 Shinya Imai
 Manabu Akahane
 Tomoaki Imamura2
- 1Faculty of Health Sciences, Butsuryo College of Osaka, Osaka, Japan
- 2Department of Public Health, Health Management and Policy, Nara Medical University, Nara, Japan
The number of computed tomography (CT) systems in operation in Japan is approximately 4.3 times higher than that of the OECD average. However, CT systems are expensive, and thus, a heavy financial burden for hospital management. We calculate the annual net profits from CT introduction in Japan for single-slice CT (SSCT), multi-slice CT (MSCT), number of hospital beds, and prefecture. We also analyze the factors that affect CT profitability. First, the annual income per CT in operation is estimated for 2011. Second, the annual costs per CT are calculated as the sum of depreciation, maintenance, and labor costs. Finally, the annual net profits per CT are estimated for SSCT and MSCT, the number of hospital beds, and prefecture. A correlation analysis between the annual net profits, population, and number of physicians per CT equipment is used to determine the determinants of the net CT profits by prefecture. Our results show that, for hospitals with fewer than 100 beds, the annual net CT profits are higher for SSCT than MSCT, and vice versa for hospitals with at least 100 beds. Both SSCT and MSCT increased profits as the number of hospital beds increased. The annual net CT profits per prefecture are USD −12,105 for SSCT and USD 87,233 for MSCT, on average. The annual net profits per prefecture and population per CT show positive correlations with both SSCT and MSCT, as do the annual net profits per prefecture and number of physicians per CT. Thus, choosing high-performance MSCT is advantageous in terms of profitability in facilities with at least 100 beds. Additionally, CT profitability presumably affects the balance between the number of introduced CTs, population per CT, and number of physicians per CT.
Introduction
Computed tomography (CT) was invented in 1968 by Godfrey Hounsfield at EMI Corporation, United Kingdom. It now provides immeasurable benefits in the field of medical care. As CT has superior spatial resolution than other examinations, it is excellent for stroke, acute abdominal disorder, and cancer screening, among other disorders (1–4). Additionally, with the advent of multi-slice CT (MSCT) that uses multi-row detectors, it has become possible to photograph thin slices of tissue during a short time period, making, for example, coronary arteries and the colon subject to CT examinations (5–8). Moreover, applying iterative reconstruction has made it possible to obtain high quality images at low doses, that is, screening for lung cancer at a low dose is also possible (4, 9, 10). Consequently, CT has rapidly spread worldwide because of its rapid progress and high diagnostic capability.
Specifically, the spread of CT in Japan has been exceptional. According to 2013 data from the Organization for Economic Co-operation and Development (OECD), the number of CTs per million inhabitants in Japan is 101.3, ~4.3 times the OECD average of 23.6 units (11). As such, it is necessary to assess the effective use and placement of CTs in Japan. Additionally, as a CT system is an expensive medical device, it may be a heavy burden for hospital management (12), especially because, in Japan, there are cases where CT has also been introduced in small hospitals and medical offices. However, to the best of our knowledge, the profitability of CT introduction has not been sufficiently studied to date.
Consequently, we calculate the annual net profits of the CTs in Japan based on performance, number of hospital beds, and prefecture in order to analyze the determinants of CT profitability. The purpose of this study is to clarify the influence of CT on hospital management from the viewpoint of income and costs. CT income and cost data are taken from the Ministry of Health, Labor, and Welfare. Depending on the number of hospital beds, these data show the performance level of CT where the income and cost balance is excessive. Our results provide useful information for hospital administrators when updating CT infrastructure and for hospital management generally.
Materials and Methods
CT Profitability by the Number of Hospital Beds
Estimation of the Annual CT Income by the Number of Hospital Beds
We calculate annual CT income for the number of beds in each facility by multiplying the annual CT examination numbers by the examination fee of each CT system. The CT performance is divided into single-slice CT (SSCT), with one X-ray detector, and multiple-slice CT (MSCT) with multiple X-ray detectors. Facilities are categorized by the number of hospital beds as follows: 0–19, 20–49, 50–99, 100–199, 200–299, 300–499, and 500 beds and above. The number of annual CT examinations is estimated by the performance and number of hospital beds, using the total number of CT systems implemented and total number listed in the Survey of Medical Institutions of 2011 (13). The income per CT examination is estimated using the medical treatment fees in Japan in 2011. From these medical treatment fees, we understand the remuneration that medical institutions and pharmacies receive from insurers as compensation for insured medical services. The fees corresponding to each item are added for each medical procedure carried out, after which, the total fees are calculated.
Based on these figures, the annual income per CT scanner is calculated for each procedure and prefecture by multiplying the number of examinations per CT scanner by the income per CT examination. The income per CT examination is calculated for each procedure according to the imaging, contrast enhancement, diagnosis, electronic image management, and radiology diagnosis fees 1 or 2 (see Table 1). As of April 2, 2018, 1 dollar was equal to 105.89 yen.
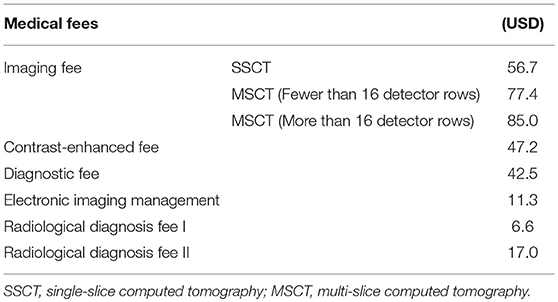
Table 1. Medical fees.
Estimation of the Annual CT Costs by the Number of Hospital Beds
Annual CT costs are calculated as the sum of depreciation expenses for the main unit, maintenance costs, and labor costs. Personnel expenses are calculated using the Osaka Prefectural Public Hospital Questionnaire and 2011 Basic Survey on Wage Structure (14). These are estimated for each procedure and prefecture using a CT cost model (Table 2) and the number of CT scanners. The depreciation expenses for the main unit are calculated using a linear method with the main unit price and assuming an amortization period of 6 years. The maintenance fee is set as the total annual maintenance fee, including periodic inspections and repair costs. The number of CTs is calculated using the number of CTs for each hospital bed in Tokyo, Gunma, Nara, Kochi, and Tottori (Table 3). The large dataset of CTs makes it difficult to investigate the number of CTs for large (e.g., Tokyo), medium (e.g., Gunma, Nara), and small cities (e.g., Kochi, Tottori). Labor costs are estimated using the average number of doctors, medical radiology technicians, and nurses necessary for CT examinations in Osaka prefectural public hospitals, as well as the average numbers of examinations and CT systems by prefecture.
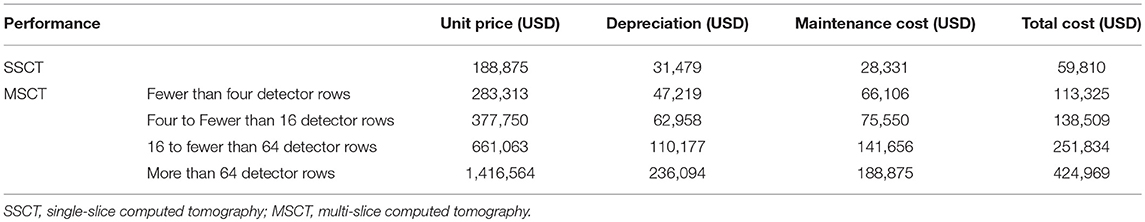
Table 2. CT cost model.
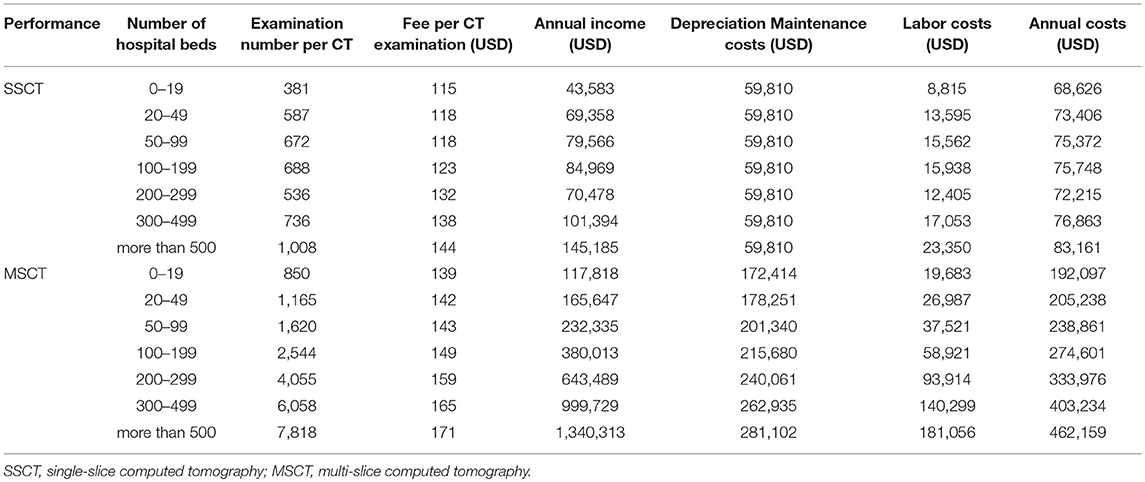
Table 3. Annual CT income and costs by the number of hospital beds.
Estimation of the Annual Net CT Profits by the Number of Hospital Beds
Annual net profits per CT scanner are calculated for each procedure and number of hospital beds using the annual income and costs per CT scanner.
CT Profitability by Prefecture
Estimation of the Annual CT Income by Prefecture
Annual CT income is calculated for each prefecture and CT by multiplying the number of annual examinations by the income from each CT examination. The number of examinations per CT per prefecture is estimated using the total number of CT implementations and total numbers listed in the Survey of Medical Institutions of 2011. The income per CT examination is calculated for each procedure according to the imaging, contrast enhancement, diagnosis, electronic image management, and radiologic diagnosis fees 1 or 2 (see Table 1).
Estimation of the Annual CT Costs by Prefecture
Annual CT costs are calculated for each CT and prefecture using a CT cost model similar to the estimation method by the number of hospital beds. The CT numbers by prefecture incorporate the MSCTs listed in the Data Book of Medical Devices & Systems 2013 (15).
Estimation of the Annual Net CT Profits by Prefecture
Annual net profits per CT scanner are calculated for each procedure and prefecture using the annual income and costs per CT scanner.
Factor Analysis on the Annual Net CT Profits by Prefecture
A correlation analysis is conducted to investigate the relationship between the annual net CT profits by prefecture, population per CT, and number of doctors per CT. The population per CT is calculated by prefecture using the population listed in the Population Estimates of 2011 (16), while the number of physicians per CT is calculated using the number of physicians listed in the Survey of Physicians, Dentists and Pharmacists of 2012 (17).
Results
CT Profitability by the Number of Hospital Beds
Estimation of the Annual CT Income by the Number of Hospital Beds
The fees per CT examination by the number of hospital beds show an increasing trend for both SSCT and MSCT as the number of hospital beds increases. Although the number of examinations per CT scanner increases as the number of hospital beds increases, the tendency is particularly strong for MSCT. The annual revenue per CT is USD 43,583–145,185 for SSCT and USD 117,818–1,340,313 for MSCT. The annual income for MSCT is higher for all numbers of hospital beds, and both SSCT and MSCT show an increasing trend as the number of hospital beds increases (Table 3).
Estimation of the Annual CT Costs by the Number of Hospital Beds
The total CT depreciation and maintenance expenses by the number of hospital beds are USD 59,810 for SSCT and USD 172,414–281,102 for MSCT. Personnel expenses are USD 8,815–23,350 for SSCT and USD 19,683–181,056 for MSCT. Both SSCT and MSCT increase with the number of hospital beds, but the tendency is stronger for MSCT. The annual cost per CT is estimated at USD 68,626–83,161 for SSCT and USD 192,097–462,159 for MSCT. The annual costs for MSCT are higher for all numbers of hospital beds, and both SSCT and MSCT show an increasing tendency as the number of hospital beds increases (Table 3).
Estimation of the Annual Net CT Profits by the Number of Hospital Beds
The annual net profits per CT by the number of hospital beds are USD −25,043 to 62,024 for SSCT and USD −74,279 to 878,154 for MSCT. SSCT shows a higher profit for hospitals below 100 beds, while MSCT shows a higher tendency for hospitals with at least 100 beds. Nevertheless, both SSCT and MSCT show an increasing tendency as the number of hospital beds increases (Figure 1).
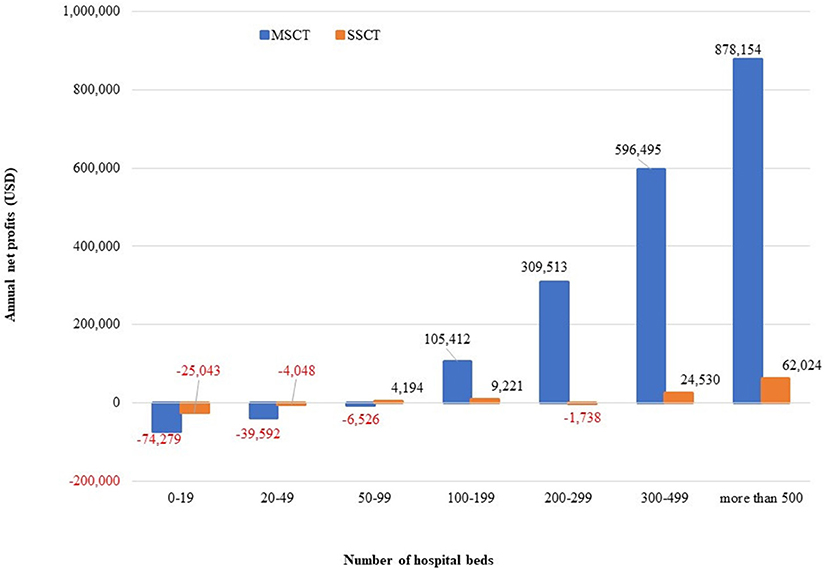
Figure 1. Annual net CT profits by the number of hospital beds.
CT Profitability by Prefecture
Estimation of the Annual CT Income by Prefecture
The annual income per SSCT by prefecture is estimated to range from approximately USD 38,360 to 98,886, while the annual income per MSCT by prefecture is estimated to range from USD 277,958 to 600,490 per prefecture (Table 4).
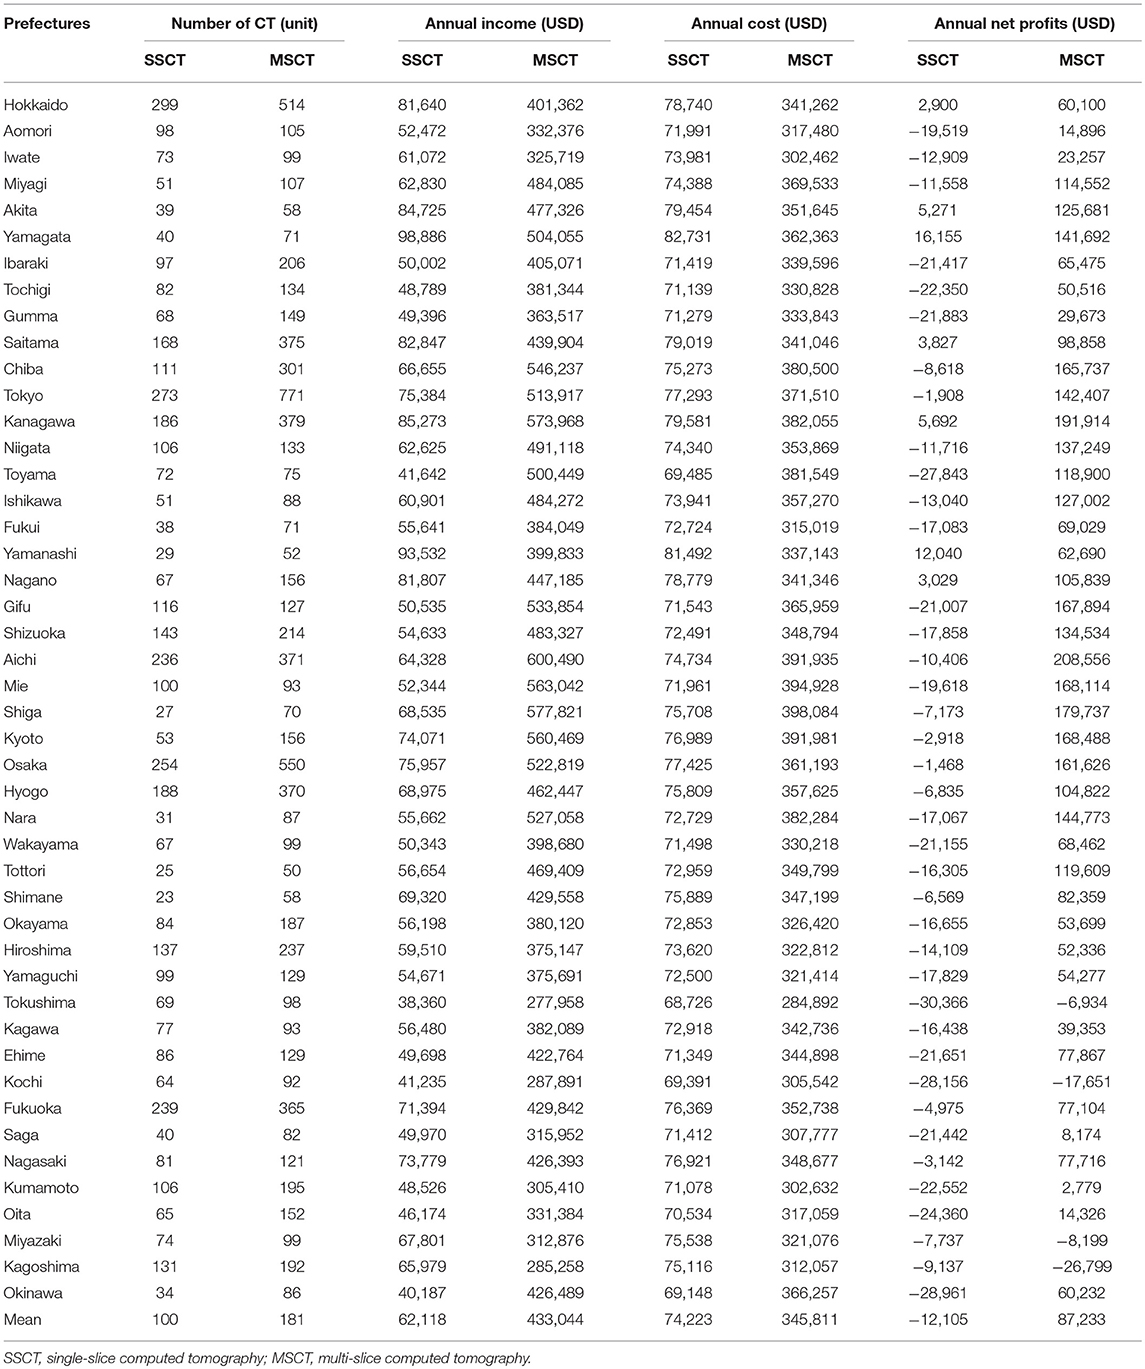
Table 4. Annual net CT profits by prefecture.
Estimation of the Annual CT Costs by Prefecture
The annual costs per SSCT by prefecture are estimated to range from USD 68,726 to 82,731, while the annual costs per MSCT by prefecture range from USD 284,892 to 398,084 (Table 4).
Estimation of the Annual Net CT Profits by Prefecture
The annual net profits per SSCT by prefecture range from USD −30,366 to 16,155, with the average deficit being approximately USD −12,105. The annual net profits per MSCT by prefecture range from USD −26,799 to 208,556, with an average surplus of USD 87,233. As shown in Table 4, the annual net profits of SSCT are in deficit in most prefectures, while those of MSCT are in surplus in most prefectures.
Factor Analysis of the Annual Net CT Profits by Prefecture
We find a positive correlation between the annual net profits per SSCT by prefecture and population per CT (r = 0.481, P < 0.01), and also between the annual net profits per MSCT by prefecture and population per CT (r = 0.764, P < 0.01). Similarly, we find a positive correlation between the annual net profits per SSCT by prefecture and number of physicians per CT (r = 0.438, P < 0.01), and also between the annual net profits per SSCT by prefecture and number of physicians per CT (r = 0.683, P < 0.01) (Table 5). We observe that profits tend to increase as the population per CT increases.
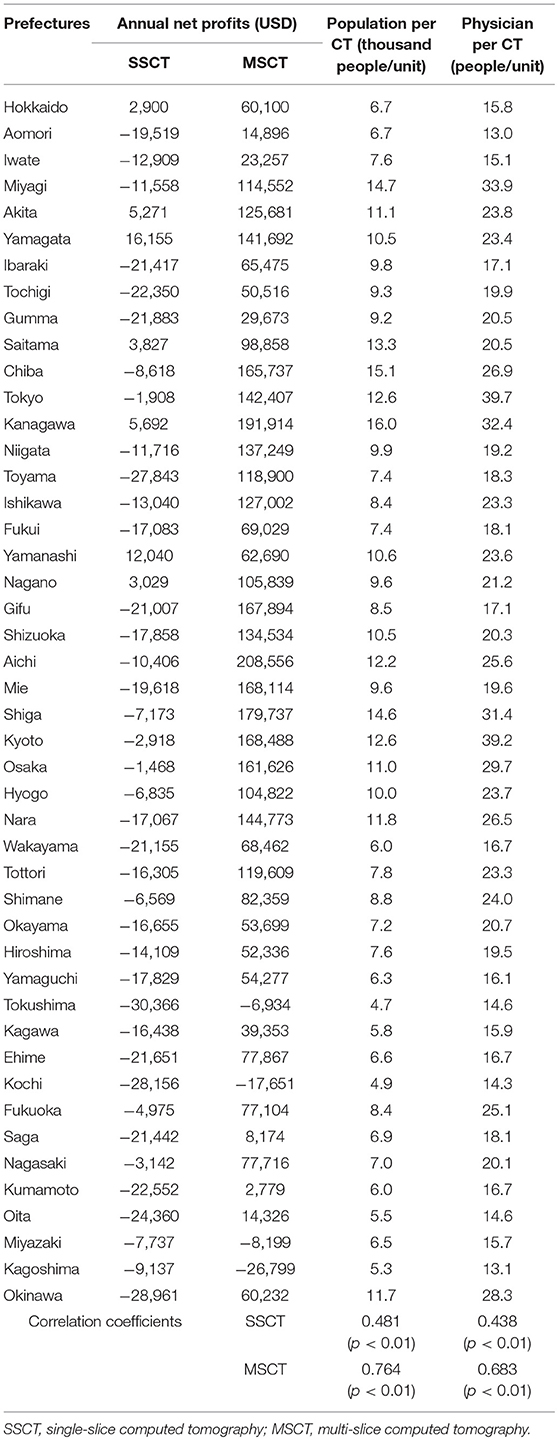
Table 5. Factor analysis of the balance of annual net profits.
Discussion
This study suggests that CT performance and number of hospital beds influence annual net CT profits. The annual net profits per CT show an increase for SSCT and MSCT as the number of hospital beds increases, especially for MSCT. Additionally, annual net profits tend to be high for SSCT, which is less expensive for hospitals below 100 beds, but they are higher for MSCT for hospitals with at least 100 beds. This is because the number of examinations per CT varies greatly depending on the performance and number of hospital beds. As MSCT has a larger number of examinations per CT by number of hospital beds than SSCT, and increases more rapidly with rising bed numbers, the MSCTs introduced into facilities with higher bed numbers have higher annual net profits. Moreover, the income per CT examination varies with the CT performance and number of hospital beds because the diagnostic fee is USD 56.7 for SSCT, USD 77.4 for below 16 detector rows for MSCT, and USD 87.8 for 16 detector rows or more for MSCT. However, MSCT has more than three times the annual depreciation and maintenance costs of SSCT. In facilities with fewer than 100 beds, the annual net profits may be lower for SSCT because the necessary number of examinations cannot be ensured. MSCT has higher diagnostic ability than SSCT, and therefore, we suggest that it is better to introduce MSCT for 100+ bed hospitals (18).
Recently, compelling evidence was reported that a substantial fraction of the ≈80 million annual CT exams in the United States of America are performed without sound medical justification. This quantitative evidence is derived from comparing actual CT use patterns with expected CT utilization provided appropriate clinical decision guidelines are followed (19). Recent studies suggest that if appropriate clinical criteria are followed, 20–40% of CT scans could be avoided (20–22). Similar to Japan, CT use has been increasing in other Asian countries too (23, 24). Hu et al. (24) reported that CT utilization rates increased significantly between 2009 and 2013 in emergency departments. They speculated that CT scans may be used for rapid screening to facilitate patients' disposition rather than to confirm diagnosis, given the stress of emergency department crowding and potential lawsuits. They also suggested further investigation to determine whether increasing CT utilization was efficient and cost-effective. Our study clearly shows that selecting high-performance MSCTs for 100+ bed facilities is advantageous in terms of profitability and hospital management.
The usage of CT scans is high in Japan compared to other countries due to the high number of CTs per million inhabitants of Japan compared to the OECD average (11). Therefore, it is important to determine the effective use and placement of CTs in Japan and to confirm the profitability of CT introduction. In this study, we showed that initial costs to purchase CT equipment and maintenance and running costs are fairly high, especially for MSCT, occasionally placing a heavy financial burden on the hospital management. Therefore, there is a possibility that doctors may recommend CT scans to recover initial and maintenance costs over the short term. However, CTs scan can provide an accurate diagnosis for various diseases, as our study clearly demonstrates that CT utilization rates relate to a reduction in mortality from accidents such as falling, drowning, and asphyxia; this indicates that screening patients with CT in the emergency room, especially with MSCT, has clinical advantages such as reduced mortality (25). Taken together with the results of our previous research, this study finds that CT equipment (especially MSCT) has beneficial effects for both emergency medicine and hospital management.
SSCT has a significant drawback in that only one slice of tissue can be acquired per rotation. Thus, scanning an anatomical range of, for example, 30 cm in length using a 10 mm collimation requires 30 tube rotations. Therefore, when examining a patient, he or she must hold his or her breath for a long time. However, these problems have been solved by introducing MSCT. As the MSCT scanner is equipped with multiple rows of detectors (e.g., 16–256 rows), the examination speed is faster. In addition, it can set the slice width to be thinner than that in SSCT, and thus, it shows good results with superior diagnostic evaluation (26). In addition to the medical benefits to patients, for hospitals with 100 beds or more, the balance of income and costs is likely to yield a surplus, thus generating increased profits. Therefore, it may be possible for hospitals with SSCT to consider updating to MSCT. However, in hospitals with fewer than 100 beds, this move could spell a high possibility of the additional expenses becoming a burden. Thus, hospital management should take account of these considerations.
According to the correlation analysis between the annual net profits per CT by prefecture, population per CT, and number of physicians per CT, we find a positive correlation for both SSCT and MSCT. Therefore, if the population per CT is large, the number of patients that use a CT is likely to increase. However, if the number of physicians per CT is large, the number of instructions for CT examination from each doctor is also likely to increase. These determinants of the increase in the annual number of examinations per CT are considered to be reflected in the annual net CT profits.
Nevertheless, our study is also beset by certain limitations. First, only the MSCT depreciation expenses for the main unit, maintenance costs, and personnel expenses are recorded as expenses that influence the net profit, without including other factors affecting the profitability of the hospital as a whole, such as indirect costs. Second, the main unit and maintenance costs for CT are estimates from a simplified model, and may differ from actual costs. In particular, although the price at the time of purchase may vary considerably depending on the medical institution and purchase time, we considered only a uniform estimate. Third, the high usage of CT scans in Japan is driven by hospital profitability. However, as mentioned earlier, our previous study showed that performing accurate diagnosis using MSCT in emergency medicine could reduce mortality rates in terms of accidental death, indicating its benefits for patients.
In conclusion, by estimating the annual net CT profits of CT, we found that selecting high-performance MSCTs for 100+ bed facilities is advantageous in terms of profitability and hospital management. Additionally, the profitability of CT is affected by the introduction of CT scanners in the area, population, and number of physicians. In this trial calculation, the net profits may turn into deficits depending on the performance of the CTs to be introduced and number of hospital beds. However, decisions on introduction of CT should consider not only profitability, but also the clinical necessity of each medical facility.
Author Contributions
SI designed the study and wrote the initial draft of the manuscript. MA contributed to the analysis and interpretation of data, and assisted in the preparation of the manuscript. TI contributed to data collection and interpretation, and critically reviewed the manuscript. All authors approved the final version of the manuscript, and agree to be accountable for all aspects of the work in ensuring that questions related to the accuracy or integrity of any part of the work are appropriately investigated and resolved.
Funding
This work was supported by JSPS KAKENHI Grant Number JP 17K09142.
Conflict of Interest Statement
The authors declare that the research was conducted in the absence of any commercial or financial relationships that could be construed as a potential conflict of interest.
Acknowledgments
We would like to thank Toshio Ogawa, whose comments and suggestions were of inestimable value for our study. We also offer special thanks to members of our laboratory, whose meticulous comments were an enormous help.
References
1. Riedel CH, Jensen U, Rohr A, Tietke M, Alfke K, Ulmer S, et al. Assessment of thrombus in acute middle cerebral artery occlusion using thin-slice non-enhanced computed tomography reconstructions. Stroke (2010) 41:1659–64. doi: 10.1161/STROKEAHA.110.580662
2. Perry JJ, Stiell IG, Sivilotti MLA, Bullard MJ, Émond M, Symington C, et al. Sensitivity of computed tomography performed within six hours of onset of headache for diagnosis of subarachnoid haemorrhage: prospective cohort study. Br Med J. (2011) 343:d4277. doi: 10.1136/bmj.d4277
3. Ng CS, Watson CJE, Palmer CR, See TC, Beharry NA, Housden BA, et al. Evaluation of early abdominopelvic computed tomography in patients with acute abdominal pain of unknown cause: prospective randomised study. Br Med J. (2002) 325:1387. doi: 10.1136/bmj.325.7377.1387
4. International Early Lung Cancer Action Program Investigators. Survival of patients with stage I lung cancer detected on CT screening. N Engl J Med. (2006) 355:1763–71. doi: 10.1056/NEJMoa060476
5. Saremi F, Krishnan S. Cardiac conduction system: anatomic landmarks relevant to interventional electrophysiologic techniques demonstrated with 64-detector CT. Radiography (2007) 27:1539–67. doi: 10.1148/rg.276075003
6. Nasis A, Mottram PM, Cameron JD, Seneviratne SK. Current and evolving clinical applications of multidetector cardiac CT in assessment of structural heart disease. Radiology (2013) 267:11–25. doi: 10.1148/radiol.13111196
7. Johnson CD, Chen M-H, Toledano AY, Heiken JP, Dachman A, Kuo MD, et al. Accuracy of CT colonography for detection of large adenomas and cancers. N Engl J Med. (2008) 359:1207–17. doi: 10.1056/NEJMoa0800996
8. De González AB, Kim KP, Knudsen AB, Lansdorp-Vogelaar I, Rutter CM, Smith-Bindman R, et al. Radiation-related cancer risks from CT colonography screening: a risk-benefit analysis. Am J Roentgenol. (2011) 196:816–23. doi: 10.2214/AJR.10.4907
9. Singh S, Kalra MK, Gilman MD, Hsieh J, Pien HH, Digumarthy SR, et al. Adaptive statistical iterative reconstruction technique for radiation dose reduction in chest CT: a pilot study. Radiology (2011) 259:565–73. doi: 10.1148/radiol.11101450
10. The National Lung Screening Trial Research Team. Reduced lung-cancer mortality with low-dose computed tomographic screening. N Engl J Med. (2011) 365:395–409. doi: 10.1056/NEJMoa1102873
12. Sistrom CL, McKay NL. Costs, charges and revenues for hospital diagnostic imaging procedure: differences by modality and hospital characteristics. J Am Coll Radiol. (2005) 2:511–9. doi: 10.1016/j.jacr.2004.09.013
13. Ministry of Health Labor and Welfare. Basic Survey on Wage Structure (2012). Available online at: http://www.e-stat.go.jp/SG1/estat/List.do?bid=000001022183andcycode=0
14. Ministry of Health Labor and Welfare. Survey of Medical Institutions (2012). Available online at: http://www.e-stat.go.jp/SG1/estat/NewList.do?tid=000001030908
15. Multi-slice CT installation facility roster. In: Data Book of Medical Devices and Systems (Tokyo: Emu I Shinko Kyokai) (2016). p. 36–74.
16. Ministry of Health Labor and Welfare. Vital Statistics (2012). Available online at: http://www.e-stat.go.jp/SG1/estat/NewList.do?tid=000001088119
17. Ministry of Health Labor and Welfare. Survey of Physicians, Dentists and Pharmacists (2011). Available online at: http://www.e-stat.go.jp/SG1/estat/NewList.do?tid=000001084609
18. Assenza M, Ricci G, Macciucca VM, Polettini E, Casciani E, De MC, et al. Comparison among preoperative single-slice CT and multi-slice CT in simple, closed loop and strangulating bowel obstruction. Hepatogastroenterology (2007) 54:2017–23.
19. Armao D, Semelka RC, Elias J Jr. Radiology's ethical responsibility for healthcare reform: tempering the overutilization of medical imaging and trimming down a heavyweight. J Magn Reson Imag J Magn Reson Imag. (2012) 35:512–7. doi: 10.1002/jmri.23530
20. Lehnert BE, Bree RL. Analysis of appropriateness of outpatient CT and MRI referred from primary care clinics at an academic medical center: how critical is the need for improved decision support? J Am Coll Radiol. (2010) 7:192–7. doi: 10.1016/j.jacr.2009.11.010
21. Brenner DJ, Hricak H. Radiation exposure from medical imaging: time to regulate? JAMA (2010) 304:208–9. doi: 10.1001/jama.2010.973
22. Kupperman N, Holmes JF, Dayan PS, Hoyle JD Jr, Atabaki SM, Holubkov R, et al. Identification of children at very low risk of clinically important brain injuries after head trauma: a prospective cohort study. Lancet (2009) 374:1160–70. doi: 10.1016/S0140-6736(09)61558-0
23. Zhou JC, Zheng SW, Yu YX, Rouleau K, Jiang WL, Jin CW, et al. Trends in computed tomography utilization and association with hospital outcomes in a Chinese Emergency Department. PLoS ONE (2012) 7:e40403. doi: 10.1371/journal.pone.0040403
24. Hu SY, Hsieh MS, Lin MY, Hsu CY, Lin TC, How CK, et al. Trends of CT utilisation in an emergency department in Taiwan: a 5-year retrospective study. BMJ Open (2016) 6:e010973. doi: 10.1136/bmjopen-2015-010973
25. Imai S, Akahane M, Konishi Y, Imamura T. Benefits of computed tomography in reducing mortality in emergency medicine. Open Med. (2018) 13:394–401. doi: 10.1515/med-2018-0058
Keywords: computed tomography, multi-slice CT, single-slice CT, net profits, SSCT in Japan, MSCT in Japan
Citation: Imai S, Akahane M and Imamura T (2019) Computed Tomography: Return on Investment and Regional Disparity Factor Analysis. Front. Public Health 6:380. doi: 10.3389/fpubh.2018.00380
Received: 03 July 2018; Accepted: 20 December 2018;
Published: 10 January 2019.
Edited by:
Obinna E. Onwujekwe, University of Nigeria, Nsukka, NigeriaReviewed by:
Brian Godman, Karolinska Institute (KI), SwedenNemanja Rancic, Military Medical Academy, Serbia
Copyright © 2019 Imai, Akahane and Imamura. This is an open-access article distributed under the terms of the Creative Commons Attribution License (CC BY). The use, distribution or reproduction in other forums is permitted, provided the original author(s) and the copyright owner(s) are credited and that the original publication in this journal is cited, in accordance with accepted academic practice. No use, distribution or reproduction is permitted which does not comply with these terms.
*Correspondence: Shinya Imai, imai@butsuryo.ac.jp