Response: Commentary: Statistical Modeling for the Prediction of Infectious Disease Dissemination With Special Reference to COVID-19 Spread
 Hom Nath Dhungana
 Saroj Ghimire
- 1School of Mathematical Science, University of Technology Sydney, Sydney, NSW, Australia
- 2School of Public Health, Torrens University, Sydney, NSW, Australia
A Commentary on
Statistical Modeling for the Prediction of Infectious Disease Dissemination With Special Reference to COVID-19 Spread
by Yadav, S. K., and Akhter, Y. (2021). Front. Public Health. 9:645405. doi: 10.3389/fpubh.2021.645405
This commentary builds upon the recent study of Subhash Kumar Yadav and Yosuf Akhter entitled “Statistical Modeling for the Prediction of Infectious Disease Dissemination With Special Reference to COVID-19 Spread” published in Frontiers in Public health. The study describes the basics of the mathematical epidemiology of infectious diseases. The study attempted to introduce a history of epidemic modeling and pointed out some standard methods of modeling. After careful reading of the study, we identified erroneous definitions in multiple sections other than typos.
In sections “SI and SIS Models” and “SIR and SIRS Models,” the authors define β as an infectious rate and further write β as a chance, which is a misinterpretation of β. Additionally, in section “SI With Vital Dynamics,” the authors again wrongly define β as a rate of infection. Precisely, β is the per capita rate at which two different individuals come in effective contact per unit time (1). It neither refers to a chance or probability of infection nor is an infection rate. For a correct definition of infection rate in detail, please refer to the book (2), page number 127. To understand the basic difference between contact rate and transmission rate, we can use following simple SI model.
Figure 1 represents a simple SI model, where S is the size of susceptible class and I is the size of infected class at time t. At the beginning of infection, the size of susceptible class decreases; therefore, the size of infected class increases. Then, at time t + 1, the size of susceptible will be
where λt is called the force of infection or the risk of infection at time t and it varies with time. In 1906, W.H. Hamer postulated that the transmission of infection should depend on the number of susceptible individuals, the number of infective individuals, and the contact rate between them. So, the net rate of transmission of infection is proportional to the multiplication of the product of the density of susceptible and the density of infected. This statement has been recognized as a mass action principle in epidemiology and is a base of modern mathematical epidemiology and compartment models of infectious diseases. Therefore, λt = βIt. Authors mistakenly write β as probability of infection or transmission probability as it does not follow the basic probability axioms. βSI is called transmission rate or an instantaneous rate from S to I, and it is not a chance or probability.
FIGURE 1
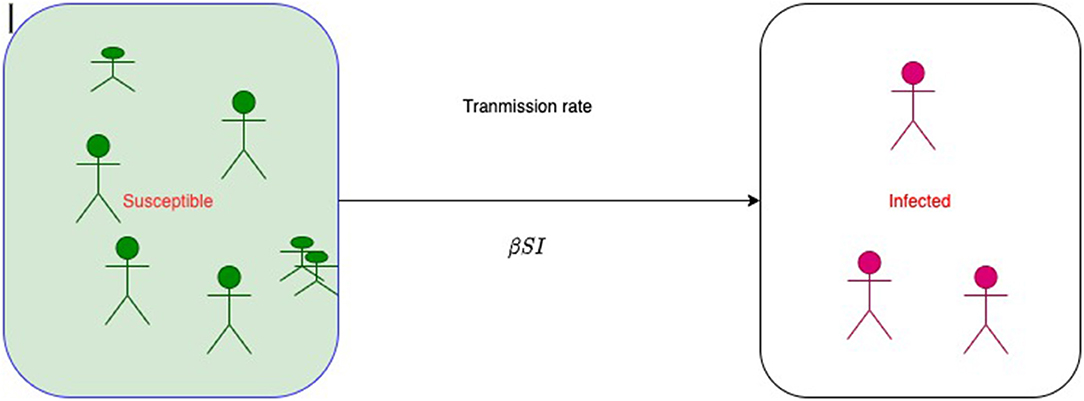
Figure 1. A simple SI model without demography. β is per capita contact rate.
In section, “The Distribution Fitting,” the authors mentioned that the infectious disease mainly depends on two factors, namely, the number of carriers and the time of infections. This line is very vague, especially for readers and definitely, and it needs improvements in terms of context writing. The possible context might be the infectious disease transmissibility, where the contagiousness of a pathogen depends on the chance of infection (infectivity), duration of infectiousness, and effective contact rates. Therefore, the authors should explain the context and the frame of the sentence with their biological interpretations.
In the section of “The Basic Reproduction Number,” the authors defined the basic reproduction number and the factors it depends on. Further, the authors wrote that R0 is a unit-free quantity (without dimension of measurement), which is correct. However, in the following line, the authors used the word reproductive rate, which is inconsistent and confusing. Many prominent researchers in the epidemic modeling have suggested that the terms “reproductive rate” or “reproduction rate” are wrong because the estimation of R0 does not involve time as a function of it. Moreover, in the compartmental model, the reproduction number R0 can be calculated by using next-generation matrix method (NGMM) (3).
We define a matrix G that comprises two matrices F and V−1 as follows,
and
where Fi is the new infections, while the Vi is the transfers of infections from one compartment to another. x0 is the disease-free equilibrium state. The dominant eigenvalue of G = FV−1 is R0. In NGMM, the dominant eigenvalue does not represent any rate. However, it is very common to see such key-words as rates in routine publications and in even some books. If R0 was a rate involving time, the measure would provide information about how fast an epidemic will spread through a population. More details, on how R0 is not a rate but is a pure number, can be read in some highly influencing studies (4, 5). There are numerous inconsistencies in the name of reproduction number (4); therefore, we suggest authors at least follow a specific name (either rate or number) consistently throughout the study to avoid confusions for readers.
In section, “SIR and SIRS Models,” the authors mentioned “The SIRS model ξ represents the transmission rate from recovered to susceptible state because of decay in immunity” (page number 9), where ξ is an instantaneous rate from recovery class to susceptible class, and this line needs to be corrected, because ξ is a model parameter not the model.
In the section, “Further Suggestions and Future Prospectives,” the authors put a couple of suggestions, especially on sample size issues in modeling. It is vital in inferential statistics to incorporate the sample size effect on parameter estimation (sample size must be appropriately calculated). However, this compulsion can be avoided for the epidemic curve-based models using serial interval data and disease incidence. This means, to model short-term infections (SARS, MERS, and Influenza), some preamble methodologies do not have any assumptions about the sample size (6–8). To estimate the reproduction number of such short-term infection using epidemic curve-based models, we do not make any assumptions on sample size but it requires some assumptions on growth rate (6, 7, 9, 10). For example, if a school children get infected by COVID-19 and infects some other students of the class within few days and infection grows, we can estimate R0 and other parameters (β, γ) by doing model fitting even for small number of time series data without violating any model assumptions. Therefore, authors need to present specific models/methods that are significantly affected by sample size before generalizing the recommendations.
Author Contributions
HD drafted the manuscript and SG approved the final version the manuscript. Both authors contributed to the article and approved the submitted version.
Conflict of Interest
The authors declare that the research was conducted in the absence of any commercial or financial relationships that could be construed as a potential conflict of interest.
Publisher's Note
All claims expressed in this article are solely those of the authors and do not necessarily represent those of their affiliated organizations, or those of the publisher, the editors and the reviewers. Any product that may be evaluated in this article, or claim that may be made by its manufacturer, is not guaranteed or endorsed by the publisher.
Acknowledgments
The authors would like to thank editor and reviewer of this commentary article.
References
1. Keeling MJ, Rohani P. Modeling Infectious Diseases in Humans and Animals. Princeton: NJ: Princeton University Press (2011).
2. Hartge P. A Dictionary of epidemiology, SIXTH EditionEdited by Miquel Porta. Am J Epidemiol. (2015) 181:633–4. doi: 10.1093/aje/kwv031
3. Diekmann O, Heesterbeek JAP, Metz JAJ. On the definition and the computation of the basic reproduction ratio R 0 in models for infectious diseases in heterogeneous populations. J Math Biol. (1990) 28:365–82. doi: 10.1007/BF00178324
4. Delamater PL, Street EJ, Leslie TF, Yang YT, Jacobsen KH. Complexity of the basic reproduction number (R0). Emerg Infect Dis. (2019) 25:1–4. doi: 10.3201/eid2501.171901
5. Jones JH. Department of Anthropological Sciences, Stanford University. Technical report, California (2007).
6. Wallinga J. Different epidemic curves for severe acute respiratory syndrome reveal similar impacts of control measures. Am J Epidemiol. (2004) 160:509–16. doi: 10.1093/aje/kwh255
7. Cori A, Ferguson NM, Fraser C, Cauchemez S. A new framework and software to estimate time-varying reproduction numbers during epidemics. Am J Epidemiol. (2013) 178:1505–12. doi: 10.1093/aje/kwt133
8. Thompson RN, Stockwin JE, van Gaalen RD, Polonsky JA, Kamvar ZN, Demarsh PA, et al. Improved inference of time-varying reproduction numbers during infectious disease outbreaks. Epidemics. (2019) 29:100356. doi: 10.1016/j.epidem.2019.100356
9. Dhungana HN. Comments on "Preliminary estimation of the basic reproduction number of novel Coronavirus (2019-nCoV) in China, from 2019 to 2020: a data-driven analysis in the early phase of the outbreak". Int J Infect Dis. (2020) 94:72–3. doi: 10.1016/j.ijid.2020.02.024
Keywords: infectious disease modeling, reproduction number, mathematical modeling, transmission rate, effective contact rate
Citation: Dhungana HN and Ghimire S (2021) Commentary: Statistical Modeling for the Prediction of Infectious Disease Dissemination With Special Reference to COVID-19 Spread. Front. Public Health 9:735857. doi: 10.3389/fpubh.2021.735857
Received: 03 July 2021; Accepted: 15 September 2021;
Published: 15 October 2021.
Edited by:
Mehlika Toy, Stanford University, United StatesReviewed by:
Stefan Bracke, University of Wuppertal, GermanyCopyright © 2021 Dhungana and Ghimire. This is an open-access article distributed under the terms of the Creative Commons Attribution License (CC BY). The use, distribution or reproduction in other forums is permitted, provided the original author(s) and the copyright owner(s) are credited and that the original publication in this journal is cited, in accordance with accepted academic practice. No use, distribution or reproduction is permitted which does not comply with these terms.
*Correspondence: Hom Nath Dhungana, homnath.dhungana@uts.edu.au