 Weijia Wang
 Xin Guan
 Xiaoyan Peng
 Zeyu Wang
 Xinyi Liang4
- 1School of Information Technology, Deakin University, Geelong, VIC, Australia
- 2Guangzhou Xinhua University, Dongguan, China
- 3School of Government, Sun Yat-sen University, Guangzhou, China
- 4School of Public Administration, Guangzhou University, Guangzhou, China
- 5Guangdong Finance and Trade Vocational College, Qingyuan, China
Introduction: To enhance the precision of evaluating the impact of urban environments on resident health, this study introduces a novel fuzzy intelligent computing model designed to address health risk concerns using multi-media environmental monitoring data.
Methods: Three cities were selected for the study: Beijing (B City), Kunming (K City), and Wuxi (W City), representing high, low, and moderate pollution levels, respectively. The study employs a Fuzzy Inference System (FIS) as the chosen fuzzy intelligent computing model, synthesizing multi-media environmental monitoring data for the purpose of urban health risk assessment.
Results: (1) The model reliably estimates health risks across diverse cities and environmental conditions. (2) There is a positive correlation between PM2.5 concentrations and health risks, though the impact of noise levels varies by city. In cities B, K, and W, the respective correlation coefficients are 0.65, 0.55, and 0.7. (3) The Root Mean Square Error (RMSE) values for cities B, K, and W, are 0.0132, 0.0125, and 0.0118, respectively, indicating that the model has high accuracy. The R2 values for the three cities are 0.8963, 0.9127, and 0.9254, respectively, demonstrating the model’s high explanatory power. The residual values for the three cities are 0.0087, 0.0075, and 0.0069, respectively, indicating small residuals and demonstrating robustness and adaptability. (4) The model’s p-values for the Indoor Air Quality Index (IAQI), Thermal Comfort Index (TCI), and Noise Pollution Index (NPI) all satisfy p < 0.05 for the three cities, affirming the model’s credibility in estimating health risks under varied urban environments.
Discussion: These results showcase the model’s ability to adapt to diverse geographical conditions and aid in the accurate assessment of existing risks in urban settings. This study significantly advances environmental health risk assessment by integrating multidimensional data, enhancing the formulation of comprehensive environmental protection and health management strategies, and providing scientific support for sustainable urban planning.
1 Introduction
With the acceleration of global urbanization, rapid urban expansion has become one of the significant challenges faced by contemporary society (1, 2). Economic resilience levels in coal-dependent and traditional cities have shown fluctuations and upward trends. However, this trend is accompanied by the exacerbation of environmental issues such as air pollution, noise, and the further deterioration of the Urban Heat Island (UHI) effect. The continuous emission of harmful gasses such as fine Particulate Matter (PM) in cities has intensified air pollution, posing a severe threat to the respiratory and cardiovascular systems of humans. Simultaneously, the UHI effect leads to increased temperatures within cities, hindering natural air circulation and imposing dual pressures of air pollution and heat stress on residents (3). High population density and traffic activities exacerbate noise pollution, directly impacting residents’ quality of life and mental and physical health. During walking activities in urban environments, adverse sensory and environmental factors become key obstacles affecting individuals’ satisfaction with comfort, thereby limiting residents’ daily activities. Sensory impacts under hot conditions are even more pronounced, leading to psychological irritability and unrest. Consequently, residents may adopt avoidance behaviors, steering clear of spaces lacking vegetation to obtain optimal shading effects. Additionally, adaptive physiological regulation strategies in dynamic environments passively concentrate populations into low-density enclosures, resulting in excessive waste of unit area from the health perspective. The current study demonstrates that urban pilot policies based on a low-carbon perspective can generate positive and complex effects on urban economic development and environmental quality (4–6). Therefore, urban development planning and design phases must thoroughly consider outdoor thermal comfort, air quality, and noise pollution. Against this backdrop, research on urban multi-medium environmental monitoring and health risk assessment becomes particularly urgent to effectively address environmental and health challenges in urban development.
Urban development is closely intertwined with environmental factors. To achieve a comprehensive understanding of various environmental factors for urban development planning, it is essential to conduct multi-medium monitoring in advance. In recent years, an increasing number of scholars have employed Fuzzy Inference Systems (FIS) as a technical tool to extract useful information from multiple urban data sources by handling fuzzy and uncertain information. By analyzing the complex relationship between urban environmental factors and the health status of residents, predictions can be made about the impact of environmental pollution on human living conditions while achieving monitoring objectives. Zeinalnezhad et al. (7) utilized an Adaptive Neuro-FIS (AN-FIS) to model time series data of key pollutants, aiming to enhance the accuracy of daily pollutant forecasts. The study revealed that traditional time series forecasting models have limitations in dealing with nonlinear and complex components, whereas the AN-FIS can more accurately predict pollutant trends. For pollutants such as CO, SO2, O3, and NO2, the determination coefficients of the AN-FIS were 0.8686, 0.8011, 0.8350, and 0.7640 respectively, compared to 0.8445, 0.8001, 0.7830, and 0.7602, respectively, for the semi-experimental model. Furthermore, the study indicated that the AN-FIS performed more accurately in predicting time series data (7). Shelton et al. (8) investigated seasonal variations in air pollutants such as PM2.5 and PM10, NO, CO, O3, and SO2 in two cities, Colombo and Kandy, Sri Lanka, and their relationships with meteorological variables. It showed that except for O3, other pollutants exhibited two peaks during the day, aligning with urban traffic congestion. Additionally, pollutant concentrations showed significant differences between different seasons (p = 0.013 < 0.05). Wind speed and direction played significant roles in influencing pollutant concentrations and were independent of seasons. These results contributed to the formulation of air pollution control strategies tailored to specific seasons to reduce occurrences of air pollution (8). Bressane et al. (9) employed artificial intelligence methods as auxiliary tools, focusing on the FIS due to its ability to handle inherent uncertainties in complex processes, aiming to provide optimal performance. Through analysis using the forest inventory database of Southern Santa Catarina State, Brazil, various machine learning methods were trained using 10-fold cross-validation. Results demonstrated that FIS exhibited the highest performance, with an accuracy of 98.3%, a kappa value of 0.93, and no significant difference from expert classification (p = 0.976). The significance level of the study was 0.05. Therefore, it concluded that FIS has potential application prospects in classifying successional stages in subtropical Atlantic forests, which can substantially influence the guidance and decision-making process for forest logging authorization and corresponding compensation measures (9). Saini et al. (10) explored the significant impact of indoor air quality on residents’ comfort, productivity levels, health, and well-being, proposing a new application of the FIS in PM10 concentration prediction based on Particle Swarm Optimization (PSO) and Genetic Algorithm Optimization. Experimental data demonstrated that the optimized FIS exhibited better performance in predicting indoor air quality, with prediction error indicators including Mean Squared Error (MSE) = 4.3656, Mean Absolute Error (MAE) = 1.9351, Mean Absolute Percentage Error (MAPE) = 9.633%, and Root Mean Squared Error (RMSE) = 2.0894. Further improvement in RMSE was achieved with the optimized FIS-PSO = 1.0746 and FIS-GA (Genetic Algorithm) = 0.998. Consequently, the optimized FIS could serve as the foundation for real-time air quality prediction systems, contributing to enhancing the health and well-being of building occupants (10). Samani et al. (11) designed a Collaborative Space Decision Support System (SDSS) based on the Fuzzy Best-Worst Method (F-BWM) algorithm to aid in understanding and detecting the fairness of health services across different locations. SDSS evaluated the equality of health service access in different geographic regions through geographical information system data monitoring and multi-criteria decision analysis methods. The results indicated that in areas with the best performance in terms of fairness of health services, the highest score obtained by SDSS was 0.38%, while the lowest score was 0.28%. In regions with the worst performance in terms of fairness, over 70% of the areas showed varying degrees of fairness. Additionally, the calculated result of SDSS for the two-sample t-test was 2.5, with a critical value of approximately 1.676 < 2.5 at a significance level of 0.05. This demonstrated significant differences in scores between different regions assessed by SDSS at the 0.05 significance level, indicating certain reliability of the system in evaluating and monitoring the spatial distribution of medical service fairness. This suggested that cities could allocate medical resources more scientifically, ensure resources were directed toward areas with the highest demand, improve the fairness and coverage of health services, and effectively meet people’s medical needs, thereby appropriately reducing urban health risks (11). Sarkheil et al. (12) designed a Fuzzy Health Improvement System based on FIS and proposed two novel Fuzzy Radon Hazard Indexes (FRHI) to assess statistical radon environmental health risks and address relevant risk issues. The output index of FRHI ranged from 0 (no risk) to 100 (highest risk level). The study measured radon concentrations in urban buildings and created natural radon and emission zoning maps using ArcGIS software to identify key areas for excellent control to reduce health risks from natural radon. The study showed that the initial fuzzy level of FRHI average was 60.1, indicating considerable risk; while the maximum FRHI level after 48 h was 44.8, showing a significant decrease in risk. This demonstrated the practicality and effectiveness of the method, providing innovative fuzzy methods for random radon risk assessment. Additionally, FIS could provide reliable data analysis and monitoring support in such environmental health risk assessments, aiding in improving urban air quality and providing better-quality living spaces for health (12).
The aforementioned studies illustrate that traditional models have limitations in dealing with complex nonlinear relationships and uncertainties, while AI-based methods, particularly FIS, offer certain advantages in addressing issues such as air quality monitoring, pollutant prediction, and service equity assessment. FIS demonstrates high accuracy and reliability in prediction, classification, and evaluation, providing valuable references for urban environmental monitoring, health risk assessment, and resource allocation. However, these methods still face challenges, including computational complexity in model training and parameter optimization processes, as well as insufficient cross-medium comprehensive analysis and quantification of integrated health impacts. To address these issues, this study utilizes FIS to analyze and predict urban environmental data through the fuzzification of input data and rule definition, employing autoregressive integration and logistic regression models. Specifically, by collecting and organizing time-series data, establishing FIS trees, and fuzzifying various environmental monitoring data, optimizing model parameters, and ultimately evaluating and predicting urban health risks. The aim of this study is to overcome the limitations of traditional single data sources, improve the accuracy and comprehensiveness of evaluation, quantify multiple data sources into evaluable indicators, establish a more complete evaluation system, and provide deeper insights into urban environmental management and health risk warning.
2 Introducing the fuzzy intelligent computing model for urban multi-media environmental monitoring and health risk assessment analysis method
2.1 Research methods
This study selects three cities, namely Beijing (B City), Kunming (K City), and Wuxi (W City), which represent different environmental characteristics, representing high pollution, clean, and moderate pollution levels, respectively. A model for urban health risk assessment is constructed by employing a FIS as the computational model and integrating environmental monitoring data from multiple media, including air quality, water quality, soil quality, and noise levels (13, 14). The analysis of urban multi-medium environmental monitoring and health risk assessment using fuzzy intelligent computing models is divided into three parts: (1) Credibility Assessment, involving the evaluation of the credibility of fuzzy outputs to discern the confidence level associated with assessment outcomes. (2) Correlation Analysis, which entails the examination of the correlation between environmental monitoring data and health data to identify the pivotal factors exerting the most significant impact on health. (3) Applicability Analysis, focusing on the comparative assessment of results across diverse cities to validate the model’s robustness and adaptability under varied environmental conditions. The study employed historical monitoring data for the purpose of training and optimization, ensuring the precise modeling of the intricate relationship between the tangible environment and health parameters (15, 16). Through the consideration of fuzzy relationships among various environmental factors, the study achieved a comprehensive evaluation of health risks (17–20).
2.2 Research sample
In accordance with the National Urban Air Quality Report, released by the Chinese Ministry of Ecology and Environment in September 2022, the present study strategically opted for the inclusion of three diverse cities—namely, B City, K City, and W City—each characterized by distinct regional attributes and varying air quality statuses. The rationale for this selection is outlined as follows. The National Urban Air Quality Report indicates that there is currently no clear standard for determining the comprehensive index of environmental air quality to assess urban pollution levels. However, the Chinese Ministry of Ecology and Environment stated in the report that the comprehensive index of environmental air quality is a dimensionless index describing the overall condition of urban environmental air quality. It comprehensively considers the pollution levels of six pollutants: SO2, NO2, PM10, PM2.5, CO, and O3. A higher value of the comprehensive index of environmental air quality indicates a heavier overall pollution level. To select sample areas with significant differences in environmental levels during the study, statistics are conducted on the comprehensive index scores of 168 cities mentioned in this report. Specifically, after compiling the report content, it is found that the report calculates the comprehensive index for 168 cities in China, with the overall numerical range of the comprehensive index being 1.28–5.06. Among them, there is only one city, Lhasa, with a comprehensive index score below 2, and only one city, Zibo, with a comprehensive index score above 5. Therefore, when dividing pollution levels, these two cities with significant differences are not considered. Combining the rankings of all cities, the study categorizes cities with a comprehensive index of 2.30 as cities with relatively high pollution levels, as their values are close to the upper limit. Cities with a comprehensive index of 3.04 are categorized as relatively clean cities, as their values are close to the median. Cities with a comprehensive index of 3.92 are categorized as cities with moderate pollution levels, as their values fall between the higher and median values.
B City, serving as an economic epicenter, grapples with pronounced air pollution challenges, emblematic of a large urban center characterized by elevated pollution levels. The inclusion of K City, distinguished by its relatively favorable air quality, serves as a comparator to validate the model’s applicability within an environment marked by comparatively cleaner air. W City, positioned with a moderate air quality ranking, is incorporated into the model validation process to augment the generalizability of the research findings. Given the economic developmental and environmental dissimilarities in the eastern region, this city selection strategy systematically encompasses various pollution levels and regional scenarios, ensuring a comprehensive representation that yields extensive and comparable outcomes for the study. The Urban Air Quality Index for the three cities is illustrated in Table 1.

Table 1. Partial city urban air quality index.
To ensure the scientific credibility of this study, standardized sampling methods are employed to collect environmental indicators from air, water, and soil in cities B, K, and W. For air quality assessments, high-precision particulate sampling instruments, including suspended particles (PM2.5, PM10), NO2, and O3 concentration instruments, are utilized. In assessing heavy metal concentrations, dissolved oxygen content, pH levels, and urban noise levels in the water bodies of Beijing, Kunming, and Wuxi, the study first randomly selects sampling points in each city considering the differences in water body types and urban environmental characteristics using geographical information systems and environmental survey data. For sampling of water body heavy metal concentrations and dissolved oxygen content, standard water sample bottles and dissolved oxygen meters are used for collection and analysis, while parameters such as water temperature and oxidation–reduction potential are simultaneously recorded. Real-time monitoring and recording of pH levels are conducted using standard pH meters. A sampling of urban noise levels utilizes professional acoustic monitoring equipment spectrum analyzers to monitor and record noise levels in different time periods and areas. After sampling, samples are labeled, sealed, and transported for rigorous laboratory analysis and data processing. The accuracy and reliability of the analysis results are ensured through the standard curve method and monitoring of quality control samples.
2.3 Selection and standards of experimental data materials
Urban multi-media environmental variables encompass 10 parameters, incorporating factors such as PM2.5, NO2, PM10, and O3 concentration in the air, as well as the concentration of heavy metals in water. Elaborative information is presented in Table 2.
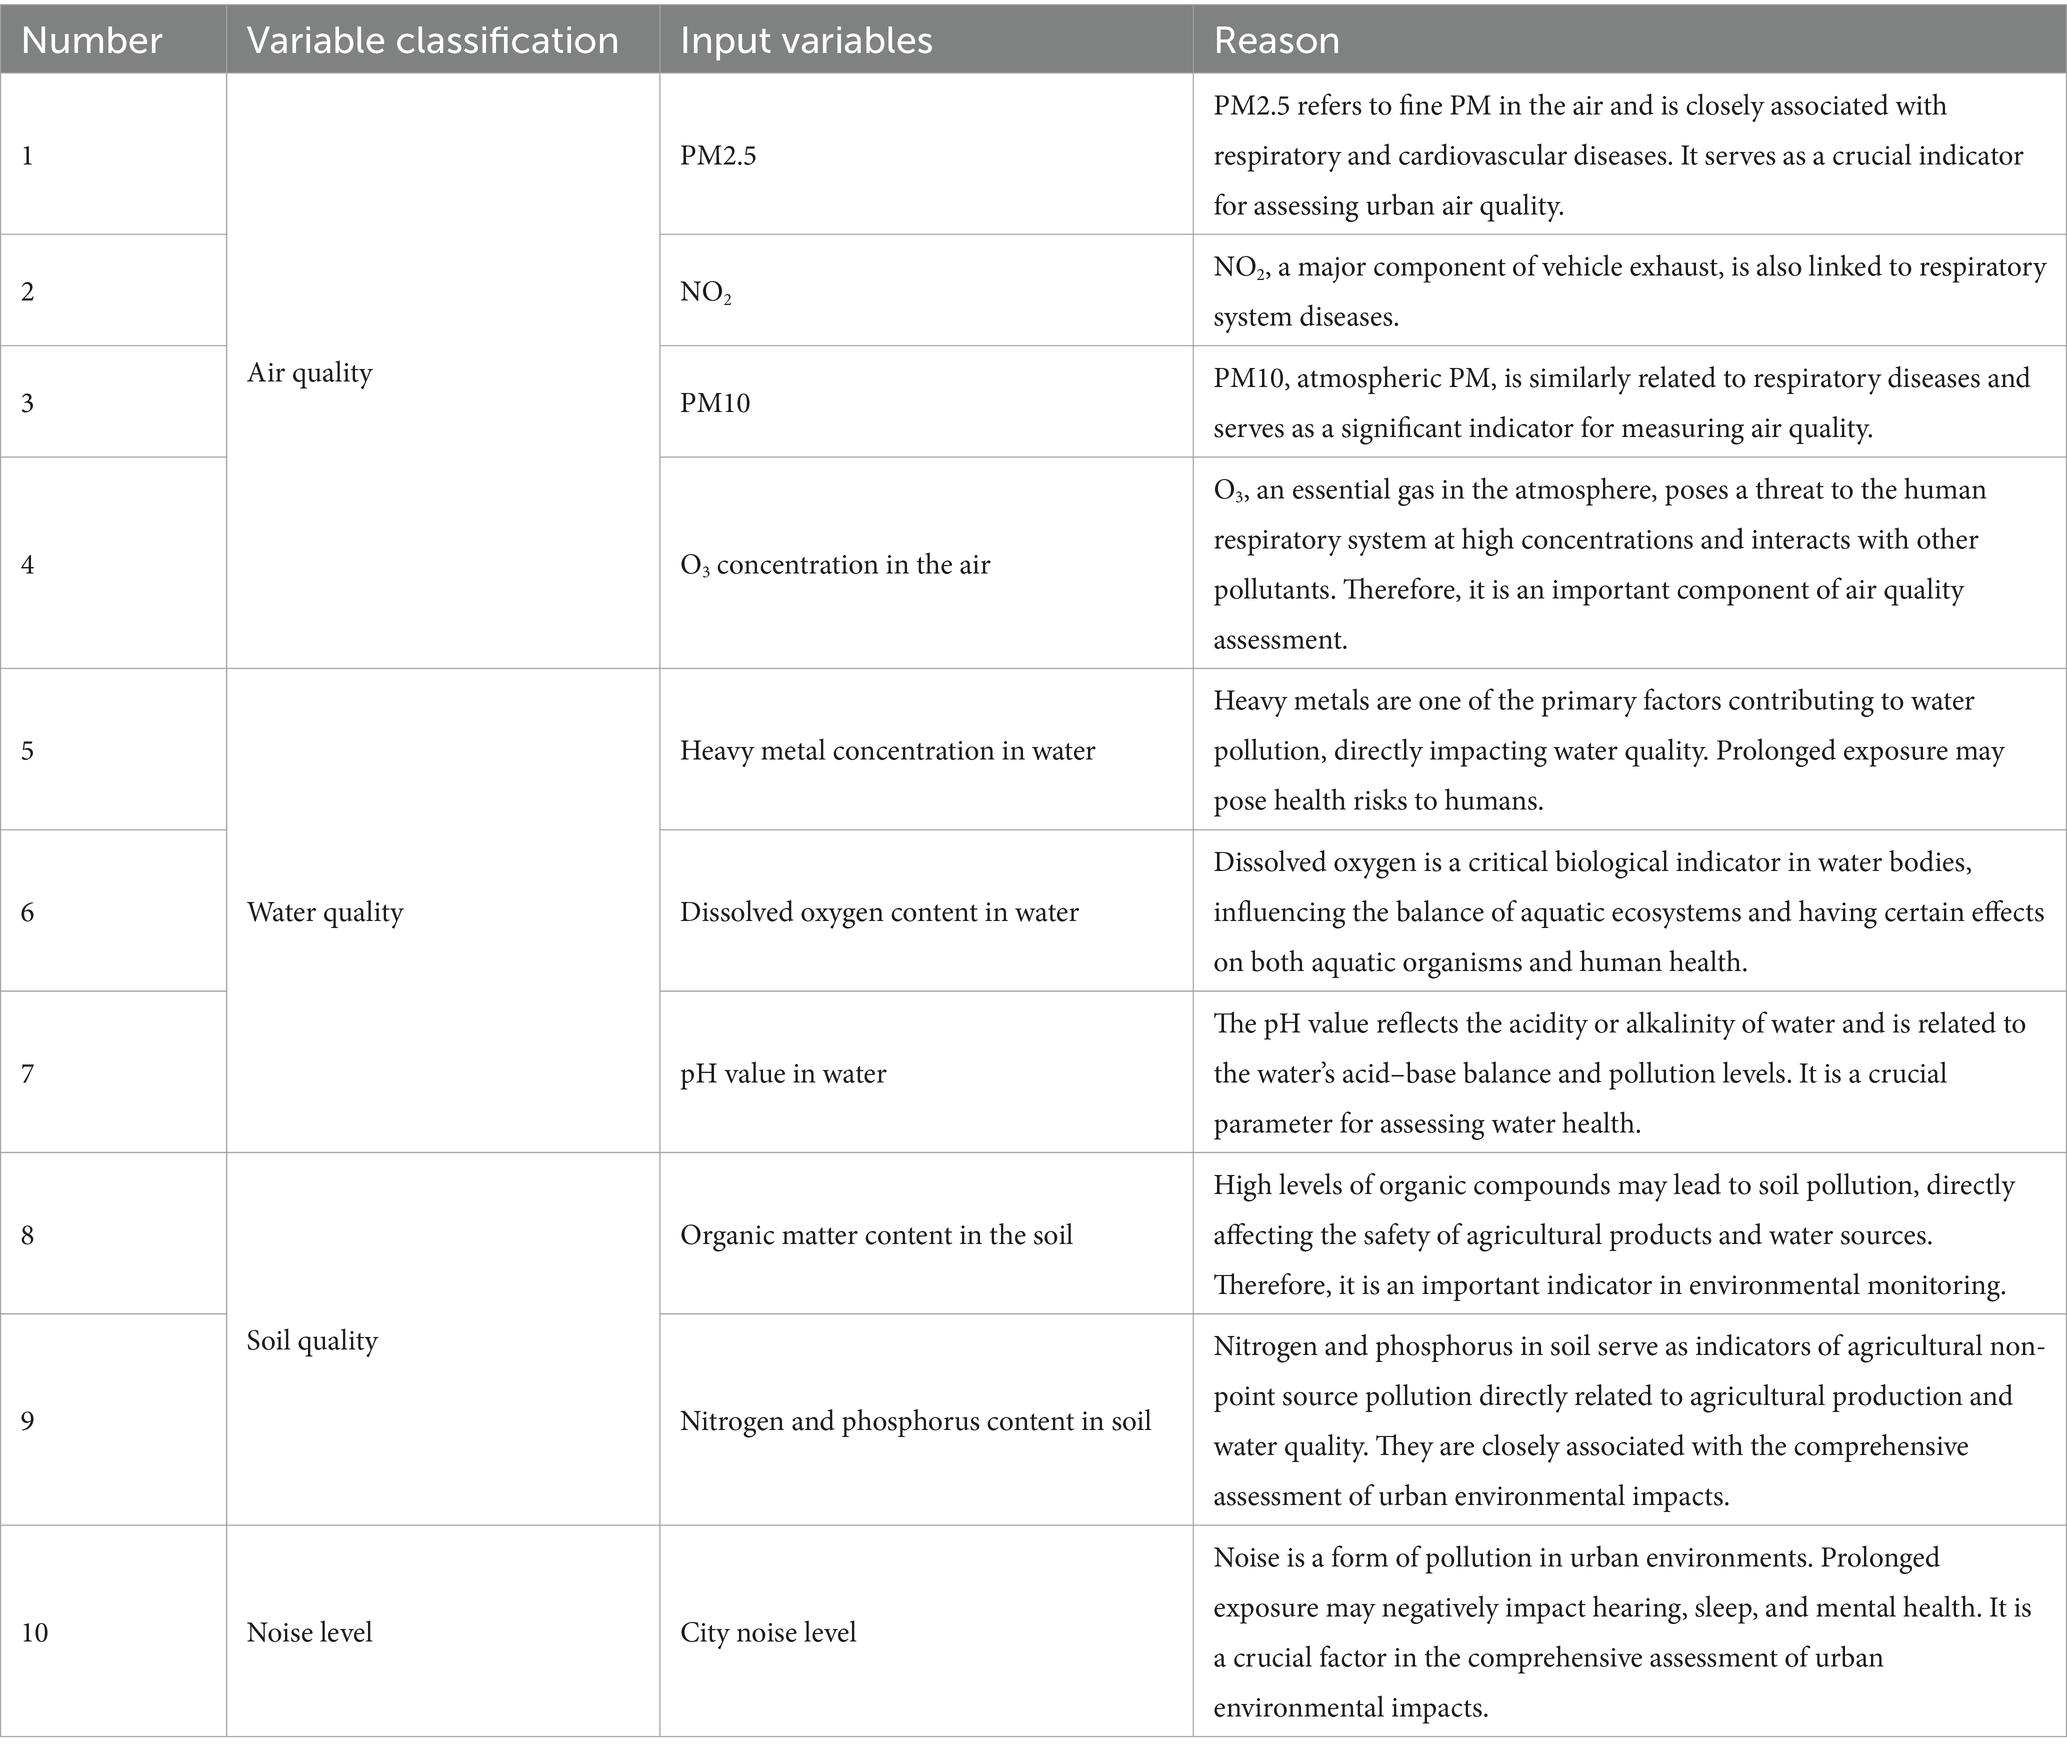
Table 2. Urban multi-media environmental factors.
This study refers to data indicator standards released by the World Water Quality Portal (WQP), World Air Quality Index (WQI), International Soil Reference and Information Centre (ISRIC), and OpenStreetMap (OSM). The specific details of the datasets are provided in Table 3.
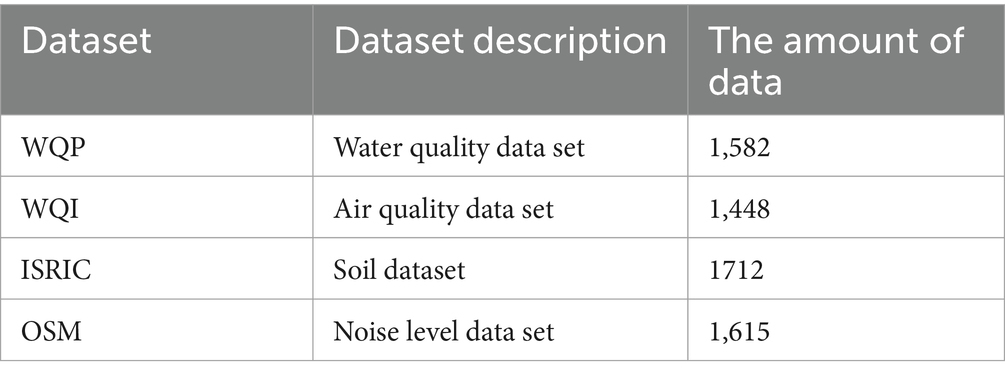
Table 3. Dataset required for experiments.
2.4 Indicators for research and verification
The core of this study lies in accurately assessing the impact of the urban environment on residents’ health. Considering the categorical characteristics of selected variables in the study, in multimedia environmental monitoring, health issues related to residents include both environmental and sensory factors. Therefore, this study selects three categories of indicators: Indoor Air Quality Index (IAQI), Thermal Comfort Index (TCI), and Noise Pollution Index (NPI) to conduct a significant analysis of the urban health risk assessment model on major health indicators. IAQI is a comprehensive index used to evaluate air quality by quantifying the concentrations of various pollutants in the air and mapping them to graded standards within a certain range to reveal the levels of air quality and their impact on human health. IAQI assesses air quality by mapping monitored air pollutant concentrations to predefined graded intervals and combining the index ranges of the graded intervals. It uses linear interpolation to convert the monitored concentrations into corresponding indices, thereby reflecting the level of air quality. The specific calculation of IAQI is shown in Equation (1):
In Equation (1), represents the monitored air pollutant concentration; and represent the lower and upper limits of pollutant concentration graded intervals, respectively; and represent the corresponding lower and upper limits of the index ranges of the graded intervals.
TCI serves as a comprehensive indicator for assessing human comfort, mainly describing the impact of environmental temperature and humidity on the human body. TCI considers factors such as environmental temperature, humidity, and wind speed. This index can reflect the degree of thermal comfort perceived by the human body, as well as the physiological and psychological effects of environmental conditions on the human body. In the calculation process of this study, the effect of temperature on thermal comfort is represented by , and wind speed is corrected by . The effect of relative humidity is presented in the form of . Considering these factors, TCI reflects the impact of environmental conditions on human thermal comfort, with higher values indicating greater comfort. The calculation of TCI is shown in Equation (2):
In Equation (2), represents environmental temperature; represents wind speed; represents relative humidity.
NPI is a comprehensive index used to measure the level of noise pollution in the environment, mainly based on acoustic principles and environmental noise monitoring data. NPI considers factors such as the frequency, intensity, duration, and spatial–temporal distribution of noise, calculated through mathematical models. This index can reflect the degree of impact of environmental noise on human health and quality of life, as well as its impact on the ecological systems of animals and plants.
In the calculation process of NPI, it is based on the weighted average of the contribution rates of each noise source and the decibel level. Each term in the formula represents the contribution of a noise source, and the comprehensive NPI is obtained by summing the weighted contributions of all noise sources. represents the contribution rate of the noise source ; represents the decibel level of noise source .
In order to ascertain the model’s applicability across diverse urban settings, this study conducts a comparative analysis of assessment outcomes across multiple cities. Specific applicability indicators are employed to assess the model’s robustness. The delineated applicability indicators are detailed in Table 4.
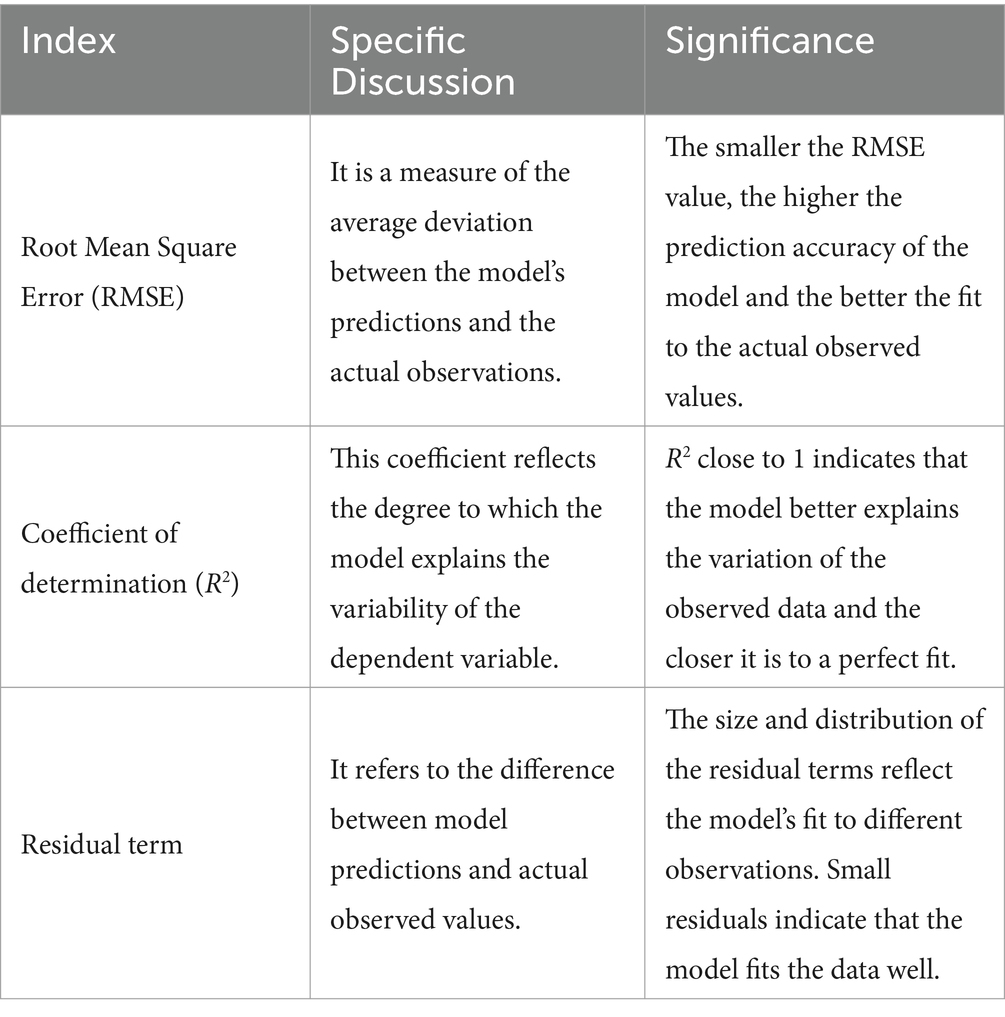
Table 4. Indicators for suitability analysis.
3 Fuzzy intelligent computing model based on FIS
3.1 Basic principles of FIS
The FIS constitutes a computational model grounded in fuzzy logic theory, specifically devised to adeptly handle information characterized by uncertainty and vagueness (21, 22). The implementation of FIS involves integrating fuzzy rule bases, fuzzy sets and membership functions, and fuzzy inference engines to handle uncertainty and fuzziness in events. The fuzzy rule base is constructed by expert knowledge, specifying the fuzzy relationships between inputs and outputs. Fuzzy sets and membership functions define the fuzzy characteristics of input and output variables, fuzzifying them to adapt to real-world situations. Finally, through the fuzzy inference engine, FIS performs fuzzy reasoning based on the fuzzy rule base and fuzzy inputs, mapping fuzzy inputs to fuzzy outputs according to the logical relationships between fuzzy rules and input values (23–25). FIS combines fuzzy logic and inference to handle various complex nonlinear systems and exhibits good performance and interpretability in uncertain environments (26).
In the context of this study, the FIS serves the purpose of amalgamating multi-media environmental monitoring data for the assessment of urban health risks. By emulating the fuzzy reasoning process inherent in human cognition, the system adeptly manages the fuzzy relationships inherent in diverse environmental factors, thereby furnishing a comprehensive evaluation of health risks (27, 28). This approach facilitates a nuanced understanding of the precise impact of urban environments on resident health, culminating in comprehensive evaluation results (29, 30). The specific procedural intricacies are delineated in Figure 1.
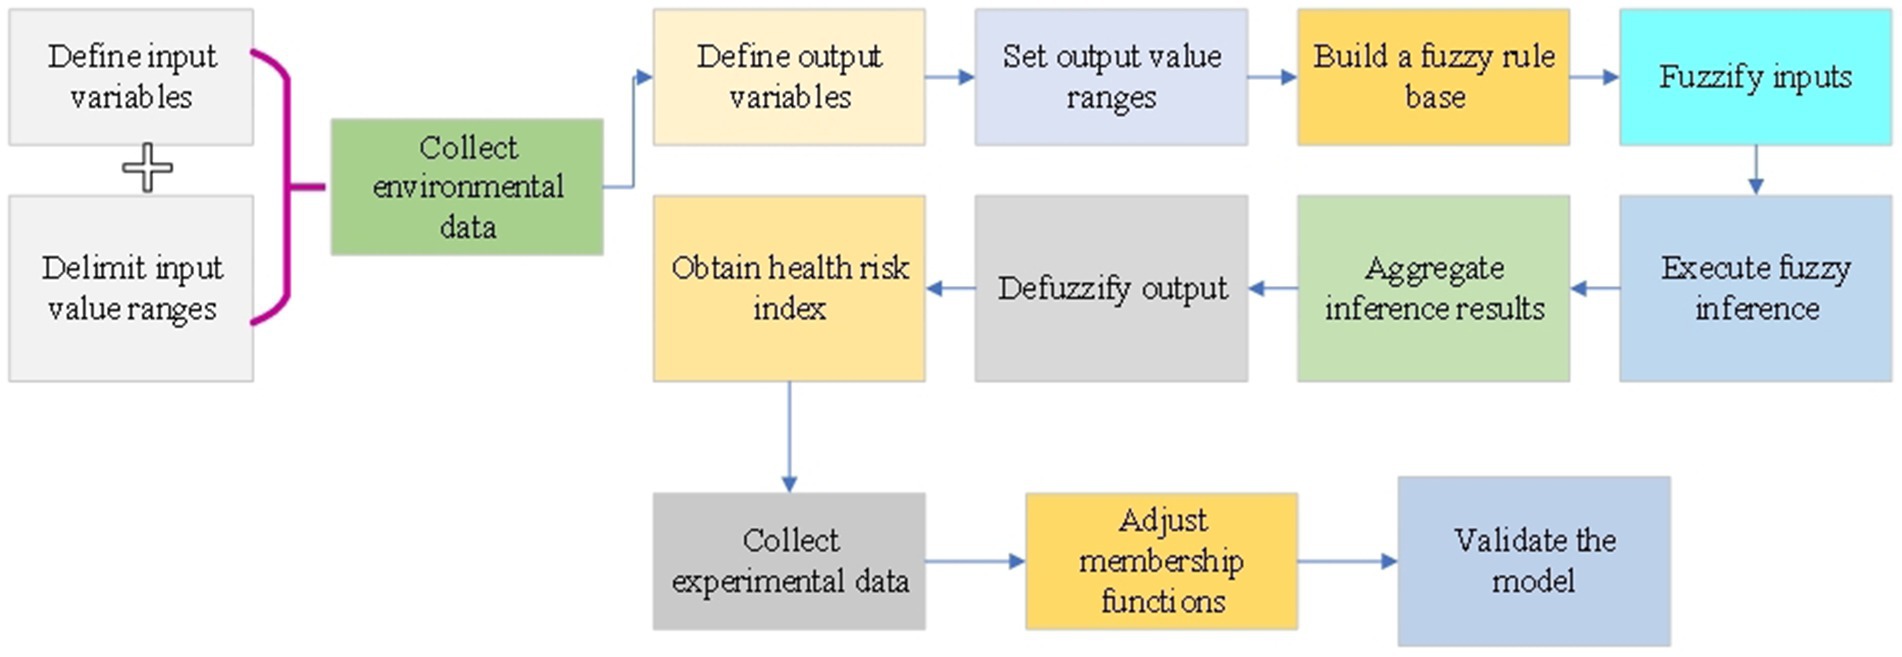
Figure 1. FIS implementation process.
3.2 Computational process of the FIS
In order to articulate the membership of input variables, the FIS employs membership functions (31, 32). This function accepts the variable value as input and employs a designated curve to depict the extent of membership of the variable to a specific fuzzy set, as exemplified in Equation (4):
In Equation (4), A represents the input variable; x denotes the variable value; signifies the center of the input variable’s membership function; is the parameter governing the steepness of the control curve; corresponds to the base of the changing curve.
Within the FIS, the membership functions associated with fuzzy output variables assume a pivotal role. These membership functions portray the membership of the output variable across various risk levels through triangular-shaped curves (33, 34). This functional form facilitates the establishment of transparent associations within the fuzzy set of output values, effectively translating the fuzzy information of the input into fuzzy results for the output, as exemplified in Equation (5):
In Equation (5), denotes the standard deviation, and signifies the center of the membership function associated with the output variable (35).
Within the FIS, the ultimate output undergoes a defuzzification process utilizing designated methods, transforming the membership function of the fuzzy output into a distinct, singular value (36), as exemplified in Equation (6):
In Equation (6), represents the output of the i-th rule, and represents the weight of the corresponding rule.
Furthermore, considering that the comprehensive index used in the referenced city data adopts unified values published by the Chinese Ministry of Ecology and Environment, the calculation process for the comprehensive index in this study also follows the corresponding calculation method. The calculation of the comprehensive index is shown in Equation (7):
In Equation (7), represents the comprehensive index of environmental air quality. represents the concentration value of pollutant p. When is SO2, NO2, PM10, and PM2.5, is the monthly average. When is CO and O3, is the concentration value at a specific percentile. represents the annual average secondary standard for pollutant . When is CO, it represents the daily average secondary standard. When is O3, it represents the 8-h average secondary standard.
4 Analysis of results on urban multi-media environmental monitoring and health risk assessment with the introduction of fuzzy intelligent computing model
4.1 Credibility assessment analysis
Establishing confidence intervals at varying confidence levels facilitates a more exhaustive comprehension of the stability and credibility associated with model outputs. The analysis of credibility assessment contributes to a more thorough and precise interpretation of the model’s applicability and reliability in health risk assessment. The results of the credibility assessment are depicted in Figure 2.
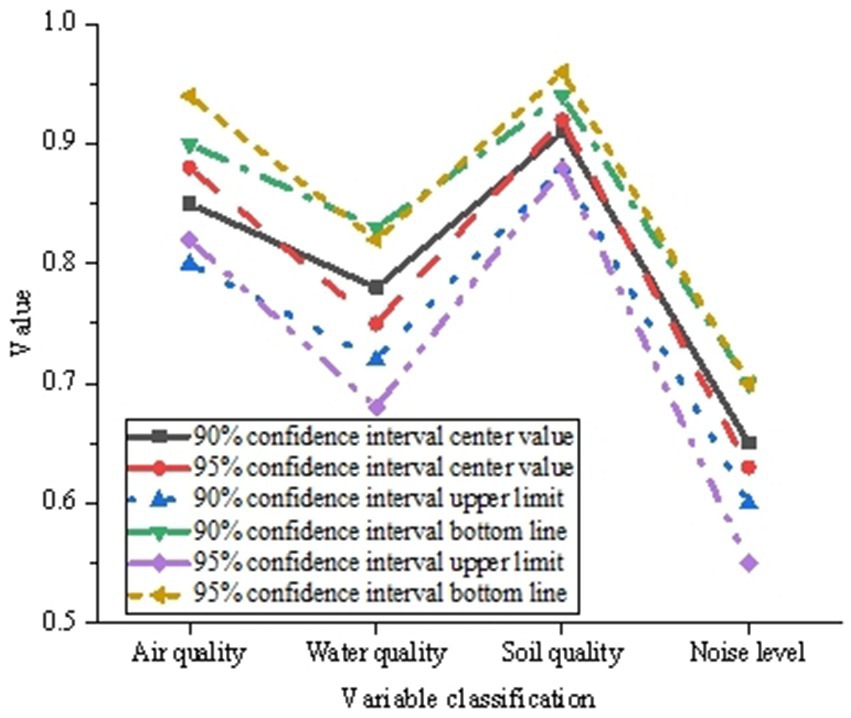
Figure 2. Credibility evaluation results of the constructed urban health risk assessment model.
In Figure 2, under diverse urban and environmental conditions, the model’s estimation of the comprehensive health risk index exhibits a discernible credibility range. Within the 90% confidence interval, the model’s health risk estimation demonstrates relative stability, characterized by a narrow confidence interval. Conversely, within the 95% confidence interval, the interval widens, signaling a more exhaustive consideration of uncertainty in the model output. This variation suggests that at higher confidence levels, the confidence interval broadens, enhancing confidence in the model output, albeit with a proportional increase in the uncertainty of the estimation. In essence, the model is adept at furnishing credibility ranges at distinct confidence levels during health risk assessments, thereby contributing to a more comprehensive grasp of the reliability inherent in the model output.
4.2 Significance analysis results
The IAQI can directly reflect the potential impact of pollutants in the air on human health, and the TCI can evaluate the impact of the thermal environment on residents’ comfort. The NPI focuses on the degree of interference from noise pollution in urban areas. The significance analysis results are shown in Figure 3.
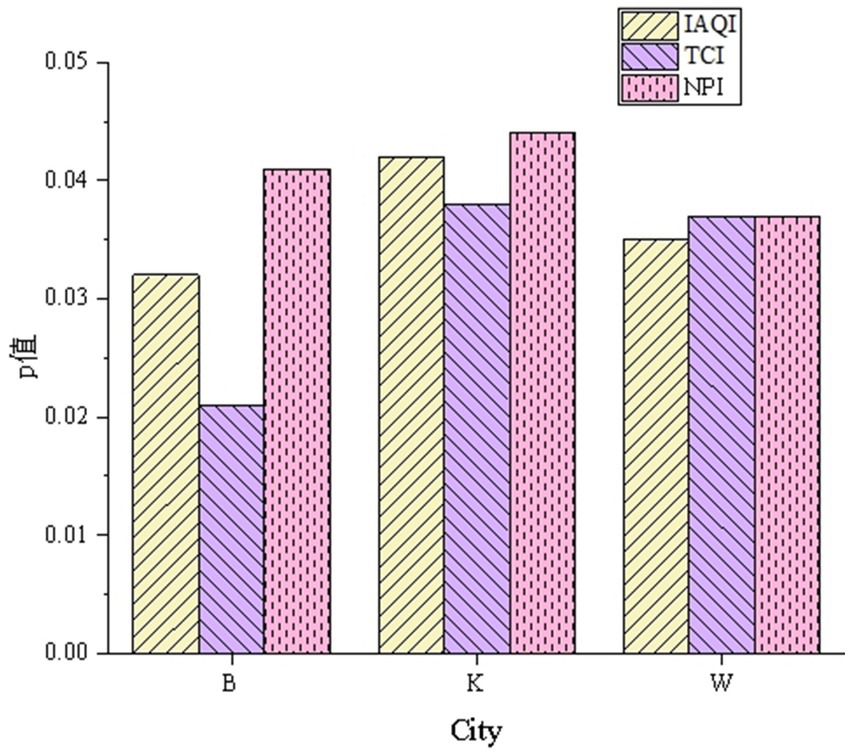
Figure 3. Significance analysis results of the urban health risk assessment model for major urban health indicators.
In Figure 3, under different urban and environmental conditions, the model’s p-values for the three core indicators IAQI, TCI, and NPI all satisfy p < 0.05. For City B, the p-values for IAQI, TCI, and NPI are 0.032, 0.021, and 0.041, respectively. In City K, the p-values for all three indices are around 0.041, while in City W, the p-values for all three indices range from 0.035 to 0.037. The data indicate that the model’s evaluation results for the three representative urban health indicators are statistically significant. This implies that the model has strong predictive capabilities under different urban environments and possesses a certain degree of accuracy in assessing the health risks of urban residents.
4.3 Correlation results analysis
Correlation analysis delves into the intricate relationship between diverse urban environmental factors and the health risk index. Through specific correlation coefficients, it becomes feasible to preliminarily discern the weights of various factors in different cities. The outcomes of the correlation analysis are delineated in Figure 4.
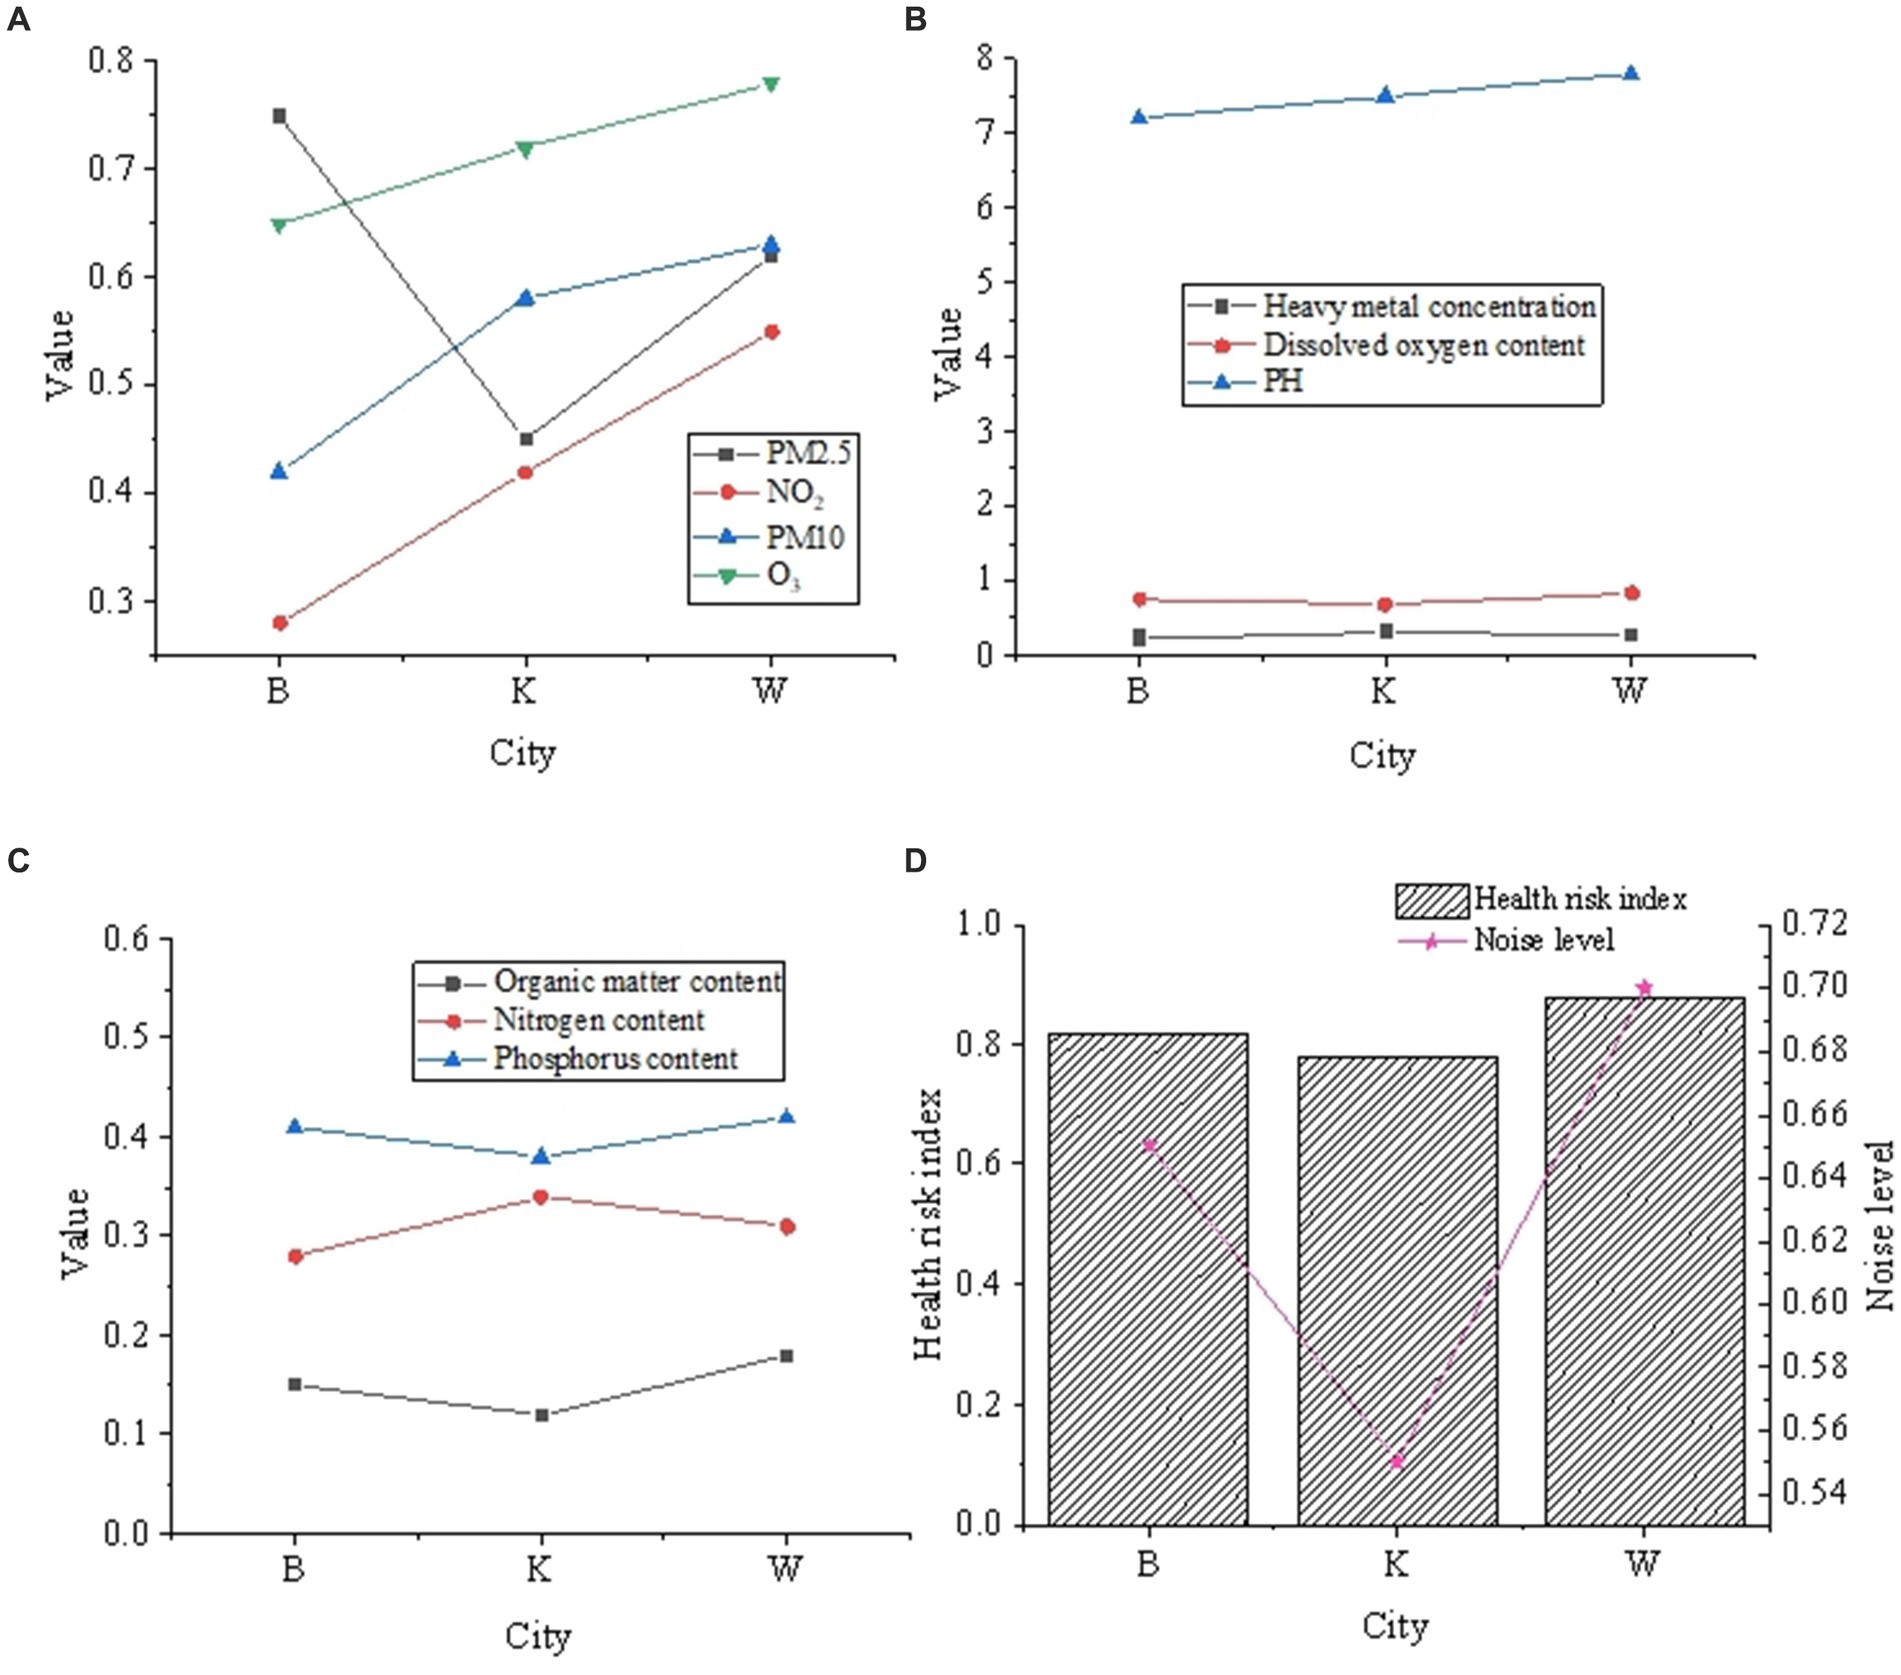
Figure 4. Correlation analysis results between different urban environmental factors and health risk indexes. (A) Air quality factors. (B) Water quality related factors. (C) Soil quality factors. (D) Noise factors and risk assessment calculation.
In Figure 4, within City B, a robust positive correlation is evident between PM2.5 concentration and the health risk index, represented by a correlation coefficient of 0.75. This signifies that an escalation in PM2.5 concentration corresponds to an increased health risk for residents in City B. Concurrently, noise levels also exhibit a positive correlation with the health risk index (correlation coefficient of 0.65), suggesting that noise similarly exerts a discernible impact on the health of City B’s residents. In City K, the correlation between PM2.5 concentration and the health risk index is relatively modest (correlation coefficient of 0.45), whereas the correlation between noise levels and the health risk index is more pronounced (correlation coefficient of 0.55). This data implies that in an environment characterized by relatively clean air, noise may exert a more substantial influence on the health of residents. Within City W, the positive correlation between PM2.5 concentration and the health risk index is moderate (correlation coefficient of 0.62). In comparison to City B and City K, City W exhibits the highest positive correlation between noise levels and the health risk index (correlation coefficient of 0.7), indicating that noise plays a pivotal role in health-related concerns for residents in City W. Generally, the impact of PM2.5 concentration on health is discernible across all three cities, while noise levels exert a more pronounced effect in Cities K and W.
Specifically, the impact of PM2.5 concentration on urban environmental monitoring varies significantly across different cities. In City B, the strong positive correlation with high PM2.5 concentration indicates poor air quality, elevating the risk of residents developing respiratory and cardiovascular diseases. The positive correlation with noise levels further highlights the potential threat of urban noise to health. In City K, within a relatively clean air environment, the heightened correlation between noise levels and health risks underscores the independent impact of noise on health, potentially leading to issues like sleep disorders. Meanwhile, in City W, despite moderate PM2.5 concentration, noise levels emerge as a primary factor, reflecting the intricate relationships within the urban environment where diverse factors interweave and influence human life and health. The environmental factors contributing to health risks vary across different cities, necessitating tailored environmental protection and health intervention measures based on specific circumstances.
4.4 Applicability results analysis
Applicability analysis endeavors to affirm the viability of the model across diverse urban and environmental conditions. Through a comparative examination of data indicators across three cities, a holistic comprehension of the model’s efficacy in various environmental contexts is attained, thereby assessing its generalization capability and robustness. The outcomes are elucidated in Figure 5.
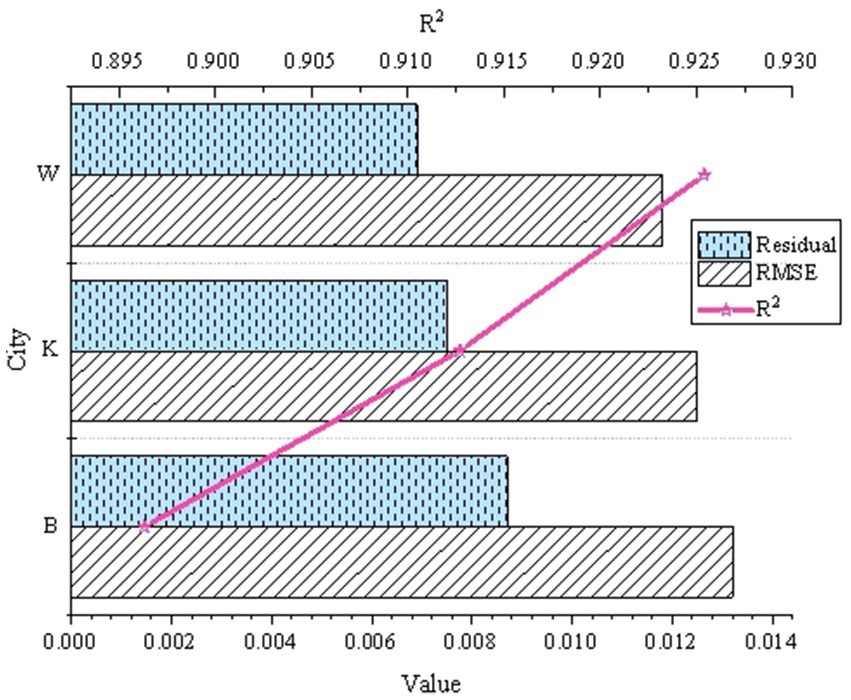
Figure 5. Analysis results of the applicability of the urban health risk assessment model under different urban and environmental conditions.
In Figure 5, the RMSE values are diminutive, registering at 0.0132, 0.0125, and 0.0118, respectively. This data signifies that the model displays a high degree of accuracy in prediction across the three cities, aligning closely with the observed values. The R2 values stand at 0.8963, 0.9127, and 0.9254, nearing 1, indicating that the model effectively elucidates variations in the data and possesses robust explanatory capability. The relatively modest magnitudes of the residual terms, measuring 0.0087, 0.0075, and 0.0069, imply minimal disparities between the model’s predicted outcomes and the observed values, showcasing a relatively even distribution of residuals. Consequently, this model manifests notable robustness and adaptability across diverse environmental conditions, facilitating the assessment of health risks in assorted urban settings.
5 Discussion
This study presents two key innovations in the field of environmental health risk assessment. Firstly, the study employs multi-media environmental monitoring data for urban health risk assessment. By utilizing key indicators such as PM2.5, NO2, PM10, O3, and others as inputs, coupled with a comprehensive health risk index as the output, it achieves a holistic evaluation of urban environments. Compared to single-media assessment methods, this approach offers higher scientific rigor and practical utility. This integrated assessment across various media provides a more comprehensive and authentic reflection of the diverse health threats residents face. Secondly, the study analyzes regional characteristics by selecting cities with distinct air quality features—Beijing (high pollution), Kunming (low pollution), and Wuxi (moderate pollution)—to evaluate model performance. This regional analysis highlights the impact of geographical variations on health risks, which is particularly relevant to China’s diverse environmental conditions. The R2 values are 0.8963, 0.9127, and 0.9254, respectively, approaching 1. Additionally, the model’s p-values for the three core indicators IAQI, TCI, and NPI satisfy p < 0.05 under different urban environments. The data indicate that the model provides a comprehensive explanation for the variability in the data and possesses strong explanatory power.
However, the study acknowledges limitations, including the lack of consideration for individual differences and the long-term health impacts of environmental exposure. Future research will address these gaps by incorporating more precise environmental monitoring data and exploring individual variability factors. The significance of this study lies in its refinement of the relationship between urban environments and health, providing innovative approaches for urban environmental health assessment and enhancing assessment accuracy. This research contributes to the development of more effective strategies for environmental protection, cleaner production, and sustainable urban planning.
6 Conclusion
This study employs a Fuzzy Inference System (FIS) to assess urban health risks through the integration of multi-media environmental monitoring data, including PM2.5, NO2, PM10, and O3. The model’s effectiveness is demonstrated through credibility, correlation, and applicability analyses. City-specific analyses unveil notable findings. In Beijing (B City), a strong positive correlation is observed between PM2.5 concentration and the health risk index (correlation coefficient 0.75), with noise levels also showing a positive correlation (correlation coefficient 0.65). Kunming (K City), with cleaner air, exhibits a greater impact of noise on health, while Wuxi (W City), with moderate pollution, shows positive correlations for both PM2.5 and noise levels (correlation coefficients 0.62 and 0.7, respectively). The model’s minimal residual values and uniform distribution indicate exceptional robustness and adaptability, providing reliable support for urban health risk assessment. This research underscores the importance of multidimensional environmental data in developing comprehensive and sustainable urban health management strategies.
Data availability statement
The original contributions presented in the study are included in the article/supplementary material, further inquiries can be directed to the corresponding author.
Author contributions
WW: Conceptualization, Data curation, Resources, Writing – review & editing. XG: Investigation, Methodology, Writing – original draft. XP: Data curation, Formal analysis, Methodology, Project administration, Writing – review & editing. ZW: Conceptualization, Formal analysis, Supervision, Writing – review & editing. XL: Validation, Visualization, Writing – original draft. JZ: Investigation, Software, Writing – original draft.
Funding
The author(s) declare that financial support was received for the research, authorship, and/or publication of this article. This work was supported by the Guangzhou Basic and Applied Basic Research Topic (Young Doctor’s “Sailing” Program) of Guangzhou Science and Technology Bureau, “Research on Digital Intelligence Empowerment of Specialized and Specialized New Enterprises in Guangdong Province under the Background of High-Quality Development” (Grant No. 2024A04J4239).
Conflict of interest
The authors declare that the research was conducted in the absence of any commercial or financial relationships that could be construed as a potential conflict of interest.
Publisher’s note
All claims expressed in this article are solely those of the authors and do not necessarily represent those of their affiliated organizations, or those of the publisher, the editors and the reviewers. Any product that may be evaluated in this article, or claim that may be made by its manufacturer, is not guaranteed or endorsed by the publisher.
References
1. Deng, Y, Jiang, W, and Wang, Z. Economic resilience assessment and policy interaction of coal resource oriented cities for the low carbon economy based on AI. Res Policy. (2023) 82:103522. doi: 10.1016/j.resourpol.2023.103522
2. Wang, Z, Zhang, S, Zhao, Y, Chen, C, and Dong, X. Risk prediction and credibility detection of network public opinion using blockchain technology. Technol Forecast Soc Chang. (2023) 187:122177. doi: 10.1016/j.techfore.2022.122177
3. Frosini, G, Amato, A, Mugnai, F, and Cinelli, F. The impact of trees on the UHI effect and urban environment quality: a case study of a district in Pisa, Italy. Atmos. (2024) 15:123. doi: 10.3390/atmos15010123
4. Li, DD, Guan, X, Tang, TT, Zhao, LY, Tong, WR, and Wang, ZY. The clean energy development path and sustainable development of the ecological environment driven by big data for mining projects. J Environ Manag. (2023) 348:119426. doi: 10.1016/j.jenvman.2023.119426
5. Sahu, A, Bose, T, and Samal, DR. Urban flood risk assessment and development of urban flood resilient spatial plan for Bhubaneswar. Environ Urban ASIA. (2021) 12:269–91. doi: 10.1177/09754253211042489
6. Li, C, Liang, F, Liang, Y, and Wang, Z. Low-carbon strategy, entrepreneurial activity, and industrial structure change: evidence from a quasi-natural experiment. J Clean Prod. (2023) 427:139183. doi: 10.1016/j.jclepro.2023.139183
7. Zeinalnezhad, M, Chofreh, AG, Goni, FA, and Klemeš, JJ. Air pollution prediction using semi-experimental regression model and adaptive neuro-fuzzy inference system. J Clean Prod. (2020) 261:121218. doi: 10.1016/j.jclepro.2020.121218
8. Shelton, S, Liyanage, G, Jayasekara, S, Pushpawela, B, Rathnayake, U, Jayasundara, A, et al. Seasonal variability of air pollutants and their relationships to meteorological parameters in an urban environment. Adv Meteorol. (2022) 2022:1–18. doi: 10.1155/2022/5628911
9. Bressane, A, Gomes, IG, da Rosa, GCS, Brandelik, CCM, Silva, MB, Siminski, A, et al. Computer-aided classification of successional stage in subtropical Atlantic Forest: a proposal based on fuzzy artificial intelligence. Environ Monit Assess. (2022) 195:184. doi: 10.1007/s10661-022-10799-x
10. Saini, J, Dutta, M, and Marques, G. A novel application of fuzzy inference system optimized with particle swarm optimization and genetic algorithm for PM10 prediction. Soft Comput. (2022) 26:9573–86. doi: 10.1007/s00500-022-06777-7
11. Samani, ZN, Alesheikh, AA, Karimi, M, Samany, NN, Bayat, S, Lotfata, A, et al. Advancing urban healthcare equity analysis: integrating public participation GIS with fuzzy best–worst decision-making. Sustain For. (2024) 16:1745. doi: 10.3390/su16051745
12. Sarkheil, H, Shirkhani, D, Azimi, Y, Talebi, A, and Rahbari, S. Fuzzy radon hazard index assessment for stochastic environmental health risk evaluation of urban scale building. Stoch Env Res Risk A. (2023) 37:3493–515. doi: 10.1007/s00477-023-02460-x
13. Chalvatzaki, E, Chatoutsidou, SE, Almeida, SM, Morawska, L, and Lazaridis, M. The representativeness of outdoor particulate matter concentrations for estimating personal dose and health risk assessment of school children in Lisbon. Int J Environ Res Public Health. (2023) 20:33. doi: 10.3390/ijerph20085564
14. Mu, G, Bian, D, Zou, M, Wang, X, and Chen, F. Pollution and risk assessment of polycyclic aromatic hydrocarbons in urban Rivers in a northeastern Chinese City: implications for continuous rainfall events. Sustain For. (2023) 15:5777. doi: 10.3390/su15075777
15. Suganya, S, and Meyyappan, T. Prediction of the level of air pollution using adaptive neuro-fuzzy inference system. Multimed Tools Appl. (2023) 82:37131–50. doi: 10.1007/s11042-023-15046-0
16. Li, C, Tang, W, Liang, F, and Wang, Z. The impact of climate change on corporate ESG performance: the role of resource misallocation in enterprises. J Clean Prod. (2024) 445:141263. doi: 10.1016/j.jclepro.2024.141263
17. Famuyiwa, AO, Davidson, CM, Ande, S, and Oyeyiola, AO. Potentially toxic elements in urban soils from public-access areas in the rapidly growing megacity of Lagos, Nigeria. Toxics. (2022) 10:10. doi: 10.3390/toxics10040154
18. Kumari, SSV, and Rathod, T. Comparison of linear and non-linear methods for runoff prediction using, co-active neuro-fuzzy inference system (CANFIS) and multi linear regression (MLR) technique for Narmada river basin, Gujarat. J Pharmacogn Phytochem. (2021) 10:247–57. doi: 10.20546/ijcmas.2021.1008.029
19. Rahmalia, D. Optimizing the membership degree of fuzzy inference system (FIS) and fuzzy clustering means (FCM) in weather data using firefly algorithm. Cauchy. (2021) 6:169–80. doi: 10.18860/ca.v6i4.8933
20. Zhao, T, Li, H, and Dian, S. Multi-robot path planning based on improved artificial potential field and fuzzy inference system. J Intell Fuzzy Syst. (2020) 39:7621–37. doi: 10.3233/JIFS-200869
21. Liu, Q, Shi, H, An, Y, Ma, J, Zhao, W, Qu, Y, et al. Source, environmental behavior and potential health risk of rare earth elements in Beijing urban park soils. J Hazard Mater. (2023) 445:130451. doi: 10.1016/j.jhazmat.2022.130451
22. Zhadanovskaya, EA, Gromov, SA, and Manzon, DA. Monitoring-based assessment of environmental pollution in regions of the Russian Federation. Pure Appl Chem. (2022) 94:317–22. doi: 10.1515/pac-2021-0317
23. Aruta, A, Albanese, S, Daniele, L, Cannatelli, C, Buscher, JT, De Vivo, B, et al. A new approach to assess the degree of contamination and determine sources and risks related to PTEs in an urban environment: the case study of Santiago (Chile). Environ Geochem Health. (2023) 45:275–97. doi: 10.1007/s10653-021-01185-6
24. Ho, HC, Guo, H, Chan, T-C, Shi, Y, Webster, C, and Fong, KNK. Community planning for a "healthy built environment" via a human-environment nexus? A multifactorial assessment of environmental characteristics and age-specific stroke mortality in Hong Kong. Chemosphere. (2022) 287:132043. doi: 10.1016/j.chemosphere.2021.132043
25. Wenchao, Z, and Goldsmith, D. Urban ecological analysis and health risk assessment under the concept of the sponge city. Work. (2021) 6:1–10. doi: 10.3233/WOR-205372
26. Li, Y, Zhang, Y, Hu, J, and Wang, Z. Insight into the nexus between intellectual property pledge financing and enterprise innovation: a systematic analysis with multidimensional perspectives. Int Rev Econ Financ. (2024) 93:700–19. doi: 10.1016/j.iref.2024.03.050
27. Galan-Madruga, D, Cardenas-Escudero, J, Broomandi, P, Caceres, JO, and Del Carmen, GM. Evaluating urban indoor and outdoor PM10-bound organochlorine pesticides. Air quality status and health impact. Build Environ. (2023) 228:109818. doi: 10.1016/j.buildenv.2022.109818
28. Villanova, M, Orcellet, E, Retamar, S, and Diez, S. Assessment of environmental risk for exposure to industrial emissions. Environ Eng Sci. (2021) 38:24–30. doi: 10.1089/ees.2020.0071
29. Bradley, PM, Journey, CA, Romanok, KM, Breitmeyer, SE, Button, DT, Carlisle, DM, et al. Multi-region assessment of chemical mixture exposures and predicted cumulative effects in USA wadeable urban/agriculture-gradient streams. Sci Total Environ. (2021) 773:145062. doi: 10.1016/j.scitotenv.2021.145062
30. Carducci, AL, Agodi, A, Ancona, C, Angelini, P, Bagordo, F, Barbone, F, et al. Impact of the environment on the health: from theory to practice. Environ Res. (2021) 194:110517. doi: 10.1016/j.envres.2020.110517
31. Si, R, Xin, J, Zhang, W, Wen, T, Li, S, Ma, Y, et al. Environmental and health benefits of establishing a coal banning area in the Beijing-Tianjin-Hebei region of China. Atmos Environ. (2021) 247:118191. doi: 10.1016/j.atmosenv.2021.118191
32. Simoes, M, Janssen, N, Heederik, DJJ, Smit, LAM, Vermeulen, R, and Huss, A. Residential proximity to livestock animals and mortality from respiratory diseases in the Netherlands: a prospective census-based cohort study. Environ Int. (2022) 161:107140. doi: 10.1016/j.envint.2022.107140
33. Can-Terzi, B, Ficici, M, Tecer, LH, and Sofuoglu, SC. Fine and coarse particulate matter, trace element content, and associated health risks considering respiratory deposition for Ergene Basin, Thrace. Sci Total Environ. (2021) 754:142026. doi: 10.1016/j.scitotenv.2020.142026
34. Insian, W, Yabueng, N, Wiriya, W, and Chantara, S. Size-fractionated PM-bound PAHs in urban and rural atmospheres of northern Thailand for respiratory health risk assessment. Environ Pollut. (2022) 293:118488. doi: 10.1016/j.envpol.2021.118488
35. Swidwa-Urbanska, J, and Batlle-Sales, J. Data quality oriented procedure, for detailed mapping of heavy metals in urban topsoil as an approach to human health risk assessment. J Environ Manag. (2021) 295:113019. doi: 10.1016/j.jenvman.2021.113019
36. Varavin, D.. (2021). Assessment of the urban environment's ecological safety in the conditions of pandemic threats on the example of Kyiv. Available at: https://zenodo.org/records/4741958
Keywords: fuzzy intelligent computing model, multi-media environmental monitoring, credibility analysis, correlation analysis, health risk
Citation: Wang W, Guan X, Peng X, Wang Z, Liang X and Zhu J (2024) Urban environmental monitoring and health risk assessment introducing a fuzzy intelligent computing model. Front. Public Health. 12:1357715. doi: 10.3389/fpubh.2024.1357715
Edited by:
Hanuman Singh Jatav, Sri Karan Narendra Agriculture University, IndiaReviewed by:
Debarati Chakraborty, International Crops Research Institute for the Semi-Arid Tropics (ICRISAT), IndiaKamal Ravi Sharma, Banaras Hindu University, India
Copyright © 2024 Wang, Guan, Peng, Wang, Liang and Zhu. This is an open-access article distributed under the terms of the Creative Commons Attribution License (CC BY). The use, distribution or reproduction in other forums is permitted, provided the original author(s) and the copyright owner(s) are credited and that the original publication in this journal is cited, in accordance with accepted academic practice. No use, distribution or reproduction is permitted which does not comply with these terms.
*Correspondence: Xiaoyan Peng, pengxy75@mail2.sysu.edu.cn
†These authors have contributed equally to this work and share first authorship