 Weiyu Feng
 Bing Zhang*
 Yong-hong Bi
- Department of Anesthesiology, The Key Laboratory of Anesthesiology and Intensive Care Research of Heilongjiang Province, Second Affiliated Hospital of Harbin Medical University, Harbin Medical University, Harbin, China
Introduction: A growing body of evidence suggests that alcohol use disorders coexist with depression. However, the causal relationship between alcohol consumption and depression remains a topic of controversy.
Methods: We conducted a two-sample two-way Mendelian randomization analysis using genetic variants associated with alcohol use and major depressive disorder from a genome-wide association study.
Results: Our research indicates that drinking alcohol can reduce the risk of major depression (odds ratio: 0.71, 95% confidence interval: 0.54~0.93, p = 0.01), while increasing the frequency of drinking can increase the risk of major depression (odds ratio: 1.09, 95% confidence interval: 1.00~1.18, p = 0.04). Furthermore, our multivariate MR analysis demonstrated that even after accounting for different types of drinking, the promoting effect of drinking frequency on the likelihood of developing major depression still persists (odds ratio: 1.13, 95% confidence interval: 1.04~1.23, p = 0.005). Additionally, mediation analysis using a two-step MR approach revealed that this effect is partially mediated by the adiposity index, with a mediated proportion of 37.5% (95% confidence interval: 0.22 to 0.38).
Discussion: In this study, we found that alcohol consumption can alleviate major depression, while alcohol intake frequency can aggravate it.These findings have important implications for the development of prevention and intervention strategies targeting alcohol-related depression.
Introduction
Depression is a widespread mental disorder that impacts individuals globally and has emerged as the sixth primary burden of disease on a global scale (1, 2). The prevalence of depression has escalated over time, with a 50% surge in worldwide instances recorded between 1990 and 2017 (3). Consequently, comprehending the underlying causes of depression is imperative for its prevention. Extensive evidence has verified that several risk factors are associated with depression, encompassing family history, stress, and specific social elements (4). Alcohol, renowned for fostering social interaction, sexual conduct, and stress alleviation across the globe (5), is also employed as a self-treatment remedy for patients enduring inherent or secondary mental disorders (6). Consequently, investigating the correspondence between alcohol consumption and depression remains a captivating subject (7).
Drinking and depression frequently coexist, and the connection between the two is intricate. The precise causal relationship between them remains uncertain (8). Some investigations have suggested that alcohol dependence is linked to an elevated risk of depression. For instance, a study of 3,967 adolescents in an ongoing cohort discovered that consuming alcohol was an autonomous factor contributing to depression (9). Another cohort study based on the US adult population also disclosed that alcohol use disorder substantially heightens the chance of subsequent depression (10). These investigations propose that alcohol use disorder can instigate depression. In contrast, there are also studies indicating that depression can result in increased alcohol consumption (11). Turner et al. (12) conducted a comprehensive review from 1997 to 2018 encompassing self-medication, mood disorders, and anxiety, and determined that mood disorders and anxiety elevate the risk of substance use disorders. Additionally, Jin-Seok Lee et al. (13) verified in mice that depression attributable to social isolation can be intensified by neuroinflammation caused by microglia, leading to augmented alcohol intake. Hence, it is evident that the emergence of alcohol use disorder and depression is a reciprocal and reinforcing relationship. On the contrary, certain investigations have displayed that moderate drinking might diminish the likelihood of depression (10, 14, 15). Alcohol has been found to normalize the sphingomyelin and monoamine functions of the nucleus accumbens in depressed mice, thereby alleviating depressive behavior (16). Furthermore, other studies have substantiated that drinking or excessive drinking does not amplify the risk of depression (17). Therefore, additional research is required to ascertain the causal association between drinking and depression, as well as comprehend the bidirectional nature of this connection.
To confirm the reliability of RCT study results in terms of causal inference, additional research methods are necessary due to the time-consuming nature of RCT studies (18). Mendelian randomization research is a particular approach that aims to infer potential causal associations between exposure factors and outcomes by utilizing genetic variation as an instrumental variable (19). This research method leverages the fact that genetic variation is randomly assigned during meiosis and fertilization, making it unaffected by self-selection and predetermined before the onset of diseases. Consequently, this minimizes the impact of confounding factors and issues related to reverse causation (20). To evaluate the possible causal relationship between depression and drinking (including frequency and type), a two-sample Mendelian randomization analysis was performed in this particular investigation. Furthermore, a two-step Mendelian randomization analysis was employed to explore the potential mediator between depression and drinking.
Methods
Two-sample study design
The study utilized two-sample Mendelian randomization (MR) to analyze the relationship between alcohol consumption (frequency and type) and major depression. The researchers conducted univariate and multivariate analyses using summary genetic data from GWAS and UK Biobank. Mendelian randomization is a method that leverages genetic variation to estimate the causal effects of risk factors on disease outcomes. To ensure the validity of MR studies, three assumptions must be met: (1) genetic variants are associated with risk factors (correlation assumption), (2) there are no confounding factors influencing the associations between genetic variants and outcomes (independence assumption), and (3) the restrictive assumption is excluded (21).
Date sources
Severe depression data were obtained from the depression meta-analysis conducted by Howard et al. (22), which examined various depression phenotypes in participants from 23andMe, PGC, and UK Biobank, including 170,756 patients with depression and 329,443 controls. However, participant data from 23andMe were not included in the publicly available data. The alcohol consumption data were sourced from the GWAS study conducted by Clarke et al. (23), which analyzed the weekly and monthly drinking volume as well as drinking type of 112,117 participants from UK Biobank. Other data, such as drinking frequency and drinking type, were extracted from published GWAS studies from UK Biobank. Additionally, there are several risk factors associated with alcohol consumption and depression, including inflammation levels [inflammatory biomarkers IL-6 (24) and C-reactive protein (25)], acid sphingomyelinase (16), body mass index (26), body fat percentage (BFP) (27), and diet-related metabolites (28). These data were obtained from the IEU Open GWAS database summary website.1 The study aimed to assess whether these factors mediate the causal relationship between alcohol use and major depression. The relevant data are organized in Supplementary Table 1.
Selection of the genetic instrumental variables
To investigate the causal relationship between alcohol consumption and major depression, we conducted a study using genome-wide association studies (GWAS). We identified a total of 450 SNPs for alcohol consumption, 8,460 SNPs for alcohol intake frequency, and 4,606 SNPs for major depression that reached genome-wide significance (p < 5 × 10⁻⁸; Supplementary Data Sheet 1). To ensure accuracy, we used linkage disequilibrium statistics (LD) to screen for significant SNPs and excluded any overlap between genetic sites (r2 < 0.001, kb = 10,000). Additionally, we accounted for potential confounding factors by examining each SNP in the PhenoScanner GWAS database (29, 30) and eliminating SNPs that were influenced by factors such as smoking, anxiety, mental stress, and pain.
Testing instrument strength and statistical power
Instrument strength is determined by the magnitude and precision of the association of genetic instruments with risk factors, which is represented by the F value. The F value is calculated based on the proportion of variance in the phenotype (R2), sample size (N), and number of instruments (k), using the formula F = R2 (N − k − 1)/k (1 − R2) (31). Ri2 for instrument i can be calculated using the approximation Ri2 = 2 × EAFi × (1 − EAFi) × βi2, where EAFi represents the effect allele frequency and βi is the estimated genetic effect of exposure (32). An F statistic ≥10 indicates that the risk of incorporating weak correlation instrument bias in the MR analysis is relatively low (33).
Statistical analyses
Univariate Mendelian randomization analysis
Univariate Mendelian randomization analysis was conducted using the inverse-variance weighted (IVW) method under a multiplicative random effects model (31). This method combines Wald ratio estimates for each SNP into a single causal estimate for each risk factor, where each estimate is obtained by dividing the SNP-outcome association by the SNP-exposure association (33). To address potential bias introduced by pleiotropic instrumental variables, sensitivity analysis was performed to resolve heterogeneity in causal estimates. In fixed effects variance weighted analysis, Cochran’s Q value was calculated to quantify the heterogeneity produced by different genetic variants, with p ≤ 0.05 indicating the presence of heterogeneity (34, 35). If heterogeneity was detected, a random-effects IVW MR analysis was employed. MR-Egger regression, based on the intercept term, was used to evaluate the presence of horizontal pleiotropy, with pleiotropy bias considered to exist when the deviation p < 0.05 (36). Additionally, sensitivity analyses were conducted using the Weighted median (37), Weighted mode (38), MR-Egger regression (39), and Simple mode methods. Briefly, the weighted median method estimates the causal effect based on the median of the weighted empirical density function of individual SNP effect estimates. This method remains applicable even in cases of horizontal pleiotropy and partial violation of the Mendelian randomization assumption (37). The weighted mode method clusters SNPs based on the similarity of causal effects and estimates causal effects based on the cluster with the largest number of SNPs, thereby providing unbiased estimates (38). Additionally, we used MR-PRESSO to assess the presence of outlier SNPs. MR-PRESSO compares the distance of all genetic instruments to the regression line (sum of squared residuals) to the distance expected under the null hypothesis of no horizontal pleiotropy (40). Furthermore, we performed a leave-one-out SNP analysis to evaluate the impact of individual variants on the observed causal effects (41).
Multivariate Mendelian randomization analysis
In order to investigate the relationship between drinking and severe depression, we conducted a multivariate Mendelian randomization analysis (42) that considered the frequency and type of drinking. This analysis allowed us to simultaneously estimate the effects of drinking frequency and the coexistence of different types of alcohol (beer/cider, fortified wine, red wine, white wine/champagne, spirits, other alcohol) on depression severity. To ensure the accuracy of our results, we used genetic tools from relevant GWAS and employed linkage disequilibrium detection (r2 = 0.001, kb = 10,000) to prevent SNP overlap. Additionally, we utilized LASSO analysis to eliminate exposure factors with collinearity.
Mediation analysis
Mediation analysis was conducted to evaluate the causal effects of potential mediator exposures on major depression. Firstly, genetic tools were used to estimate the effects of alcohol use and alcohol frequency on the mediators. Secondly, genetic tools for the identified mediators were used to assess their causal effects on major depression. The “coefficient product” method (43) was employed to determine the indirect effect of drinking and drinking frequency on the risk of major depression through each potential mediator, if evidence supported the influence of these factors. Standard errors for indirect effects were obtained using the delta method (44).
Results
Univariate Mendelian randomization analysis
To investigate the correlation between alcohol intake and major depressive disorder, we performed a two-sample Mendelian randomization analysis. The analysis included all SNPs listed in Supplementary Data Sheet 2. Our univariate MR analysis revealed a causal relationship, indicating that alcohol consumption is a protective factor for major depression. The IVW odds ratio (OR) was 0.71 with a 95% confidence interval (CI) of 0.54 to 0.93, and a p-value of 0.01 (Table 1). The absence of weak correlation bias was supported by the F value (Table 1), and heterogeneity was not detected according to Cochran’s Q value (Q = 3.63, p = 0.16; Supplementary Data Sheet 3). No potential outliers were identified by MR-PRESSO. Additionally, MR-Egger intercept analysis provided no evidence of directional pleiotropy (p = 0.47; Supplementary Data Sheet 3). The weighted median analysis yielded consistent results with the IVW method (OR = 0.71; 95% CI 0.56 to 0.91; p = 0.01), further supporting the protective effect of alcohol consumption on the risk of major depression. The forest plot in Figure 1A displays the estimates of the effect of SNPs associated with alcohol consumption on the risk of major depression. Additionally, displayed in Figure 1B is a scatterplot which showcases the correlation amid the consumption of alcohol and the likelihood of encountering significant depression. The slopes of various regression studies are denoted by distinctively colored lines. A negative causal relationship exists between the frequency of alcohol intake and major depression. As the frequency of drinking increases, the probability of suffering from major depression also increases. The IVW OR value is 1.09 with a 95% CI of 1.00 to 1.18, and a p value of 0.04 (Table 1). The F value indicates no presence of weak correlation bias (Table 1). The inclusion of SNPs shows heterogeneity, as indicated by Cochran’s Q value of 160 and a p value of 4.41 × 10⁻¹⁰ (Supplementary Data Sheet 4). However, the IVW method is not affected by heterogeneity, ensuring the credibility of the results. MR-PRESSO analysis did not detect any outliers. Additionally, MR-Egger intercept analysis found no evidence of directional pleiotropy with a p value of 0.47 (Supplementary Data Sheet 4). The forest plot in Figure 1C presents the estimates of the effect of SNPs associated with alcohol intake frequency on the risk of major depression. Furthermore, Figure 1D shows a scatter plot illustrating the association between alcohol intake frequency and the risk of major depression.

Table 1. MR results for the relationship between alcohol and depression.
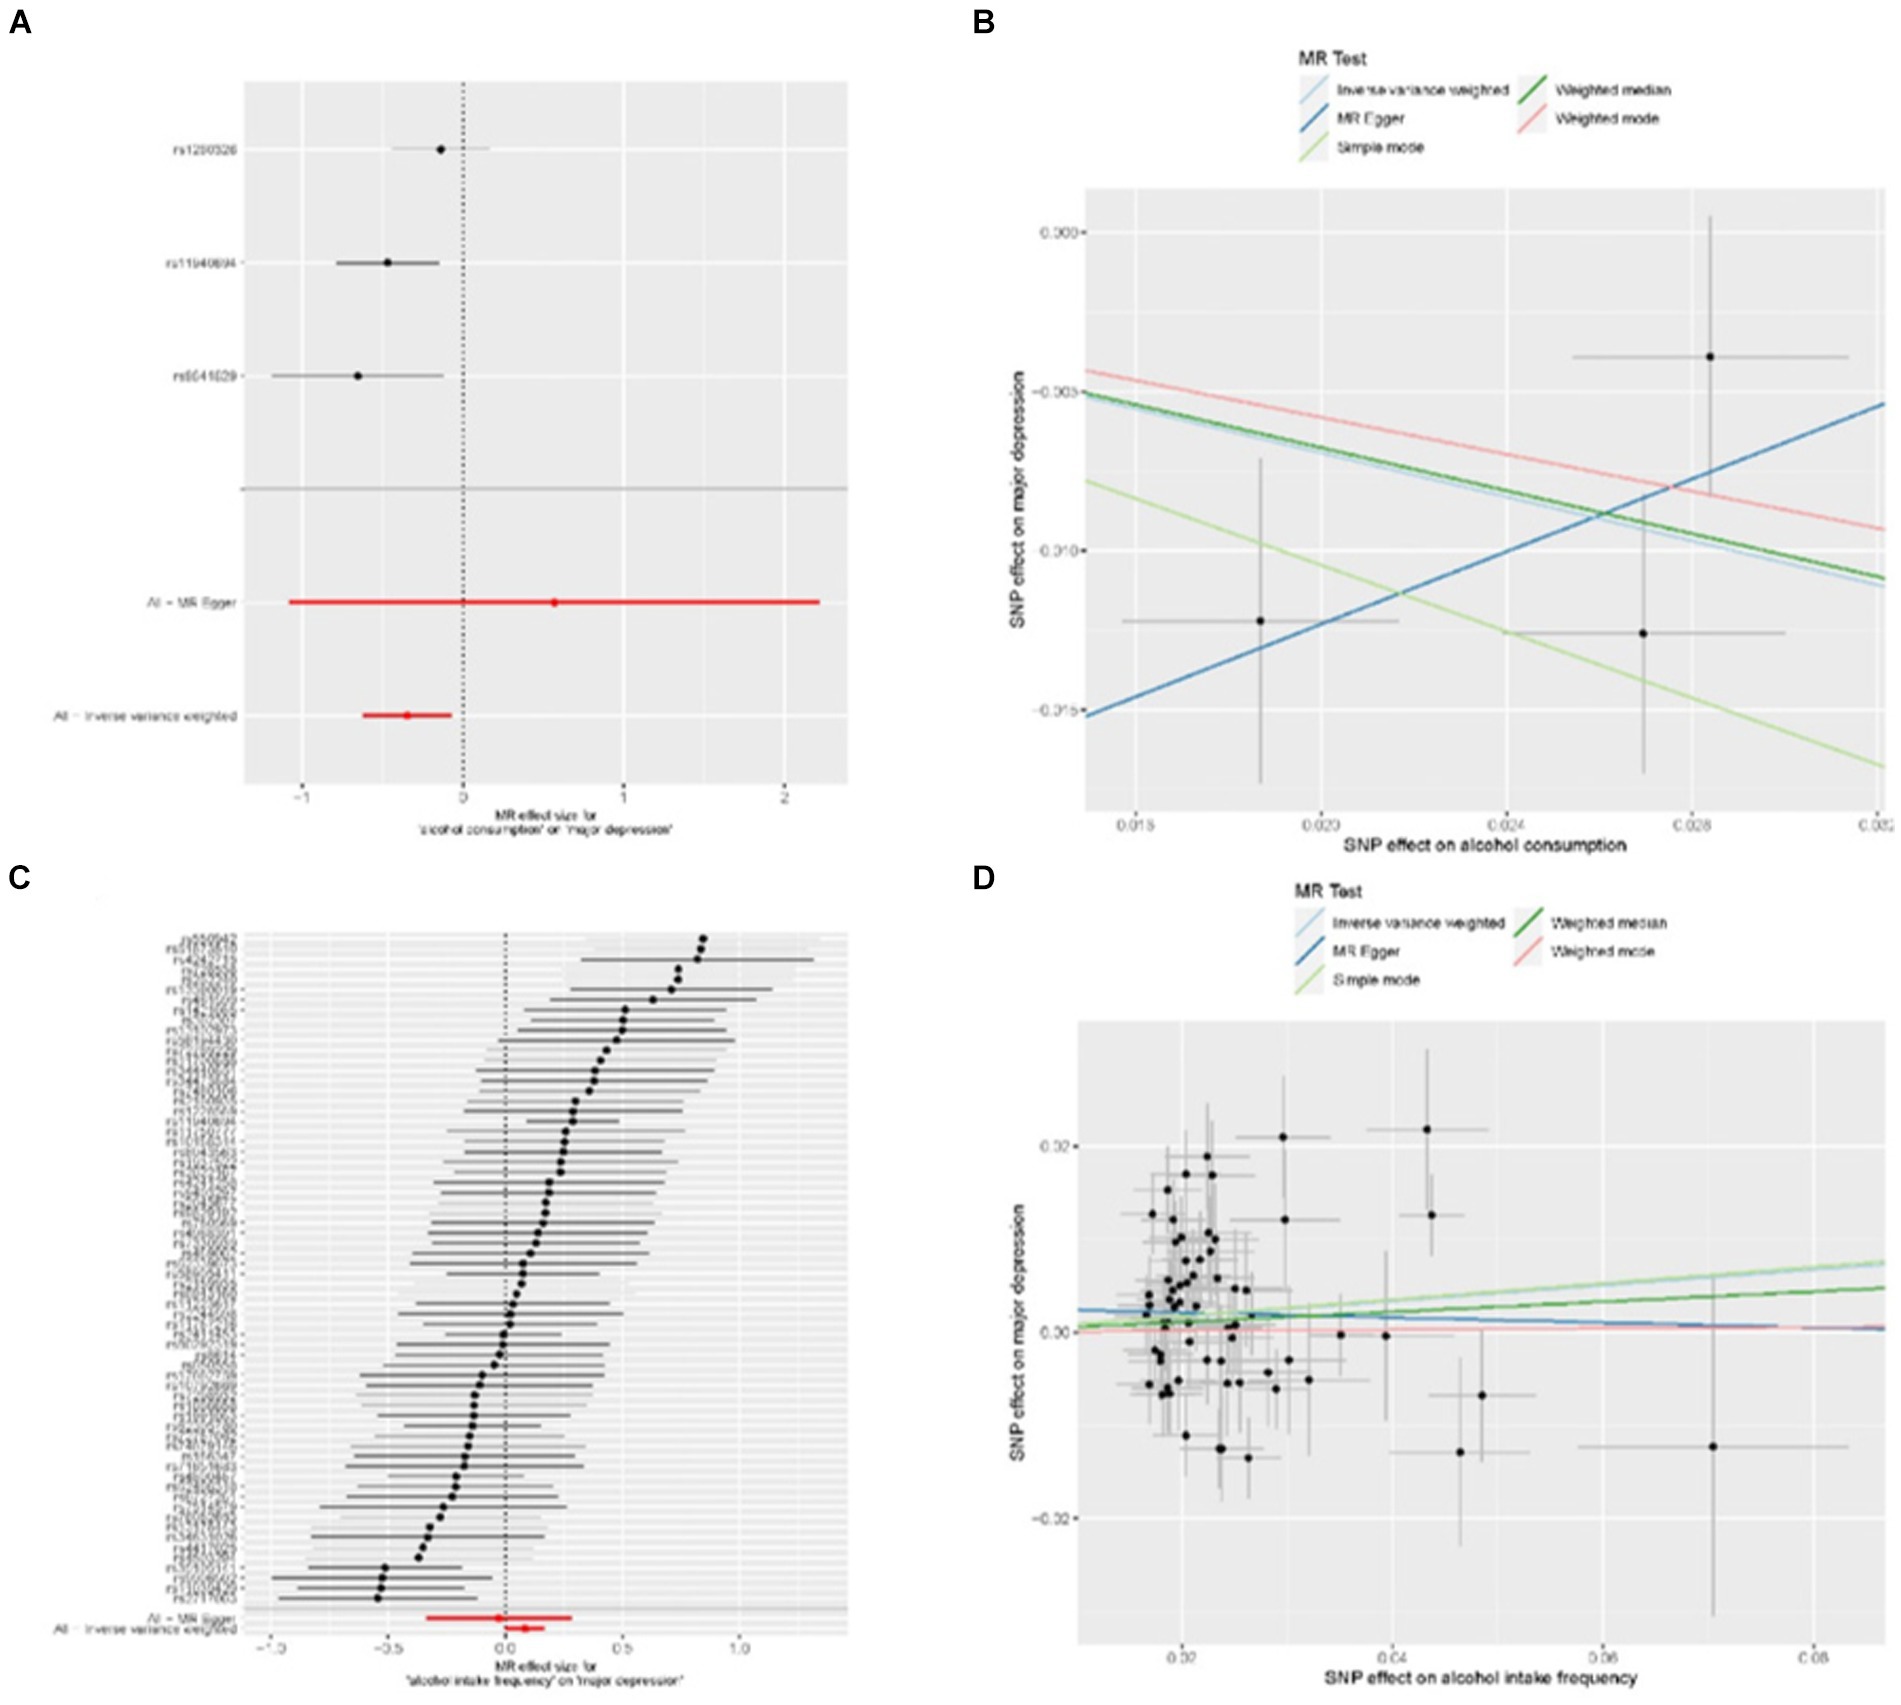
Figure 1. MR results for the relationship between alcohol and major depression. (A) forest plot of individual and combined SNP MR-estimated effect sizes. The effect estimates represent the log odds for major depression increase in alcohol consumption, and the error bars represent 95% CIs. (B) Scatter plot of SNP effects on relative alcohol consumption vs. major depression, with the slope of each line corresponding to the estimated MR effect per method. The data are expressed as raw β values with 95% CIs. (C) Forest plot of individual and combined SNP MR-estimated effect sizes, that is alcohol intake frequency and major depression. (D) Scatter plot of SNP effects on relative alcohol intake frequency vs. major depression.
Regarding the protective effect of alcohol consumption on major depression, we investigated the relationship between different types of drinking and this effect. We conducted separate single-factor Mendelian analyses to examine the effects of intake of beer/cider, fortified wine, red wine, white wine/champagne, spirits, and other alcohol on major depression. However, we found that there were too few strongly correlated SNPs when extracting SNPs, so we adjusted the p-value to 5 × 10⁻⁶ (Supplementary Data Sheet 5). The included SNPs can be found in Supplementary Data Sheet 6. The results obtained using the IVW method indicated that there was no significant causal relationship between the type of drinking and the occurrence of major depression. OR values and corresponding 95% CI for each type of alcohol were as follows: beer/cider (OR value 1.00, 95% CI 0.91~1.09, p = 0.95), fortified wine (OR value 0.99, 95% CI 0.76~1.28, p = 0.93), red wine (OR value 0.97, 95% CI 0.88~1.11, p = 0.81), white wine/champagne (OR value 0.98, 95% CI 0.86~1.11, p = 0.73), spirits (OR value 1.13, 95% CI 1.00~1.29, p = 0.06), and other alcohol (OR value 1.02, 95% CI 0.82~1.28, p = 0.84; Supplementary Table 2).
Multivariate Mendelian randomization analysis
To investigate the effects of alcohol consumption and alcohol intake frequency on major depression, we conducted a multivariate Mendelian randomization analysis. We specifically examined the affect of different types of alcohol on major depression. The findings from our analysis revealed that when considering multiple types of drinking, alcohol consumption no longer showed a causal effect on major depression (OR value 1.05, 95% CI 0.79~1.39, p = 0.76). However, alcohol intake frequency remained a significant contributing factor for major depression (OR value 1.13, 95% CI 1.04~1.23, p = 0.005), as presented in Table 2.
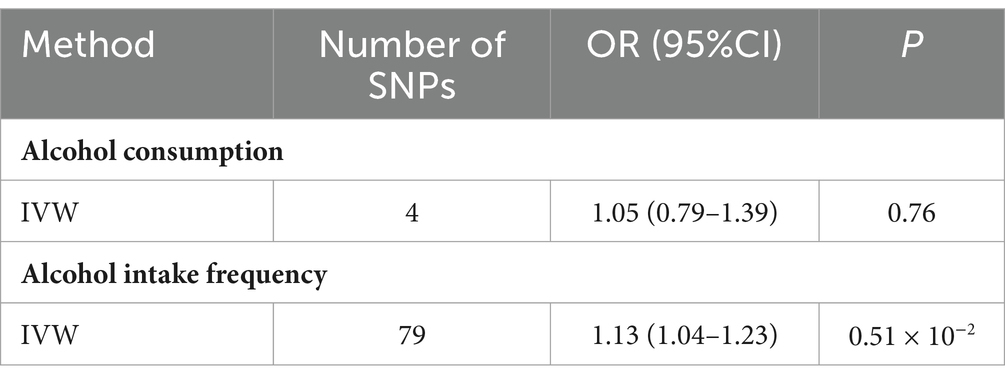
Table 2. Multivariable MR analysis estimating the effect of relative alcohol on MDD, conditioning on different alcohol.
Causal inference of major depression on alcohol consumption and alcohol intake frequency
In order to examine the potential causal effect of major depression on alcohol consumption and alcohol intake frequency, we used major depression as an exposure factor and performed a univariate Mendelian randomization analysis. The SNPs used in the analysis are shown in Supplementary Data Sheet 7. The results of the analysis are presented in Table 3. Our findings indicate that major depression does not have a causal effect on alcohol consumption (OR value 1.00, 95% CI 0.96 ~ 1.03, p = 0.82). Regarding the causal analysis of major depression on alcohol intake frequency, the weighted median method suggests that major depression is involved with an increase in alcohol intake frequency (OR value 1.09, 95% CI 1.02~1.17, p = 0.007). However, according to the IVW method, major depression does not have an effect on alcohol intake frequency (OR value 1.08, 95% CI 1.00~1.16, p = 0.07). It is important to consider that the data analyzed in this study exhibits strong heterogeneity (Cochran’s Q value is 38, p = 6.93 × 10⁻²¹; Supplementary Data Sheet 8). Therefore, it is concluded that major depression does not have a causal relationship with alcohol intake frequency.
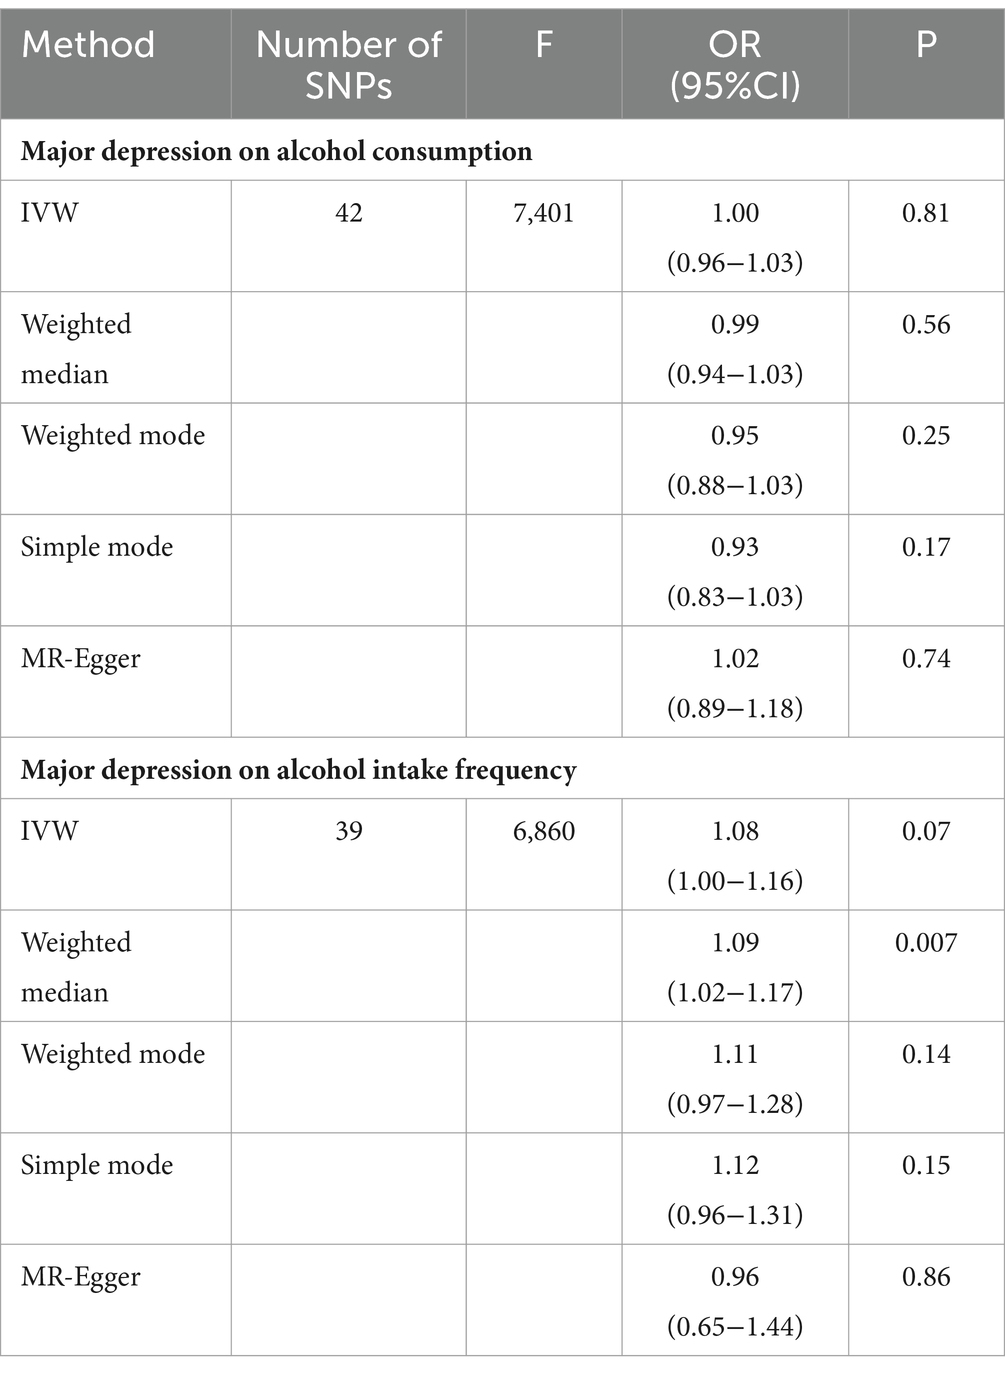
Table 3. Bidirectional MR results for the relationship between major depression and alcohol.
Mediation analysis
Considering the potential impact of alcohol consumption on depression-related metabolites (45), we performed a two-step Mendelian randomization study, incorporating inflammation levels [including IL-6 (24) and CRP (25)], diet-related metabolites (28) (such as vitamin A, mannitol, and hippuric acid), acid sphingomyelinase (16), body mass index (26), and BFP (27) as mediating factors. Figure 2 (see Supplementary Data Sheet 9 for included SNPs) illustrates the study design. In the first step, we conducted univariate MR analyses to assess the causal effects of alcohol consumption and alcohol intake frequency on the aforementioned mediating factors. Our findings indicated a causal relationship between alcohol consumption and alcohol intake frequency with BMI, showing that alcohol consumption increases BMI (IVW method β = 0.33, 95% CI 0.08 to 0.59, p = 0.97 × 10⁻²), and alcohol intake frequency also leads to an increase in BMI (IVW method β = 0.21, 95% CI 0.09 to 0.32, p = 3.5 × 10⁻⁴). (Please refer to Table 4 for details.) Moreover, we observed a causal relationship only between alcohol intake frequency and the BFP. Alcohol intake frequency was found to be a contributing factor to the increase in the BFP (IVW method β = 0.14, 95% CI 0.07 to 0.32, p = 6.94 × 10⁻⁵), while alcohol consumption did not exhibit this effect (IVW method β = 0.09, 95% CI −0.10 to 0.28, p = 0.33), as shown in Table 4. The remaining factors showed no causal effect on alcohol consumption and alcohol intake frequency (Supplementary Tables 3, 4). Subsequently, we conducted a multivariate MR analysis involving BMI, BFP, and major depression. The results revealed that only the BFP had a causal effect on major depression when combined with BMI. An increase in the BFP was associated with an elevated risk of major depression (β = 0.21, 95% CI 0.03 to 0.38, p = 0.02), as shown in Table 4. Therefore, we examined the impact of alcohol consumption frequency on major depression by considering the BFP as a mediator. Our findings revealed that the BFP had a mediation effect value of 0.03 (95% CI: 0.01–0.03, p = 2.30 × 10⁻⁴), with a mediation ratio of 37.5% (95% CI, 0.22–0.38), as presented in Table 5.
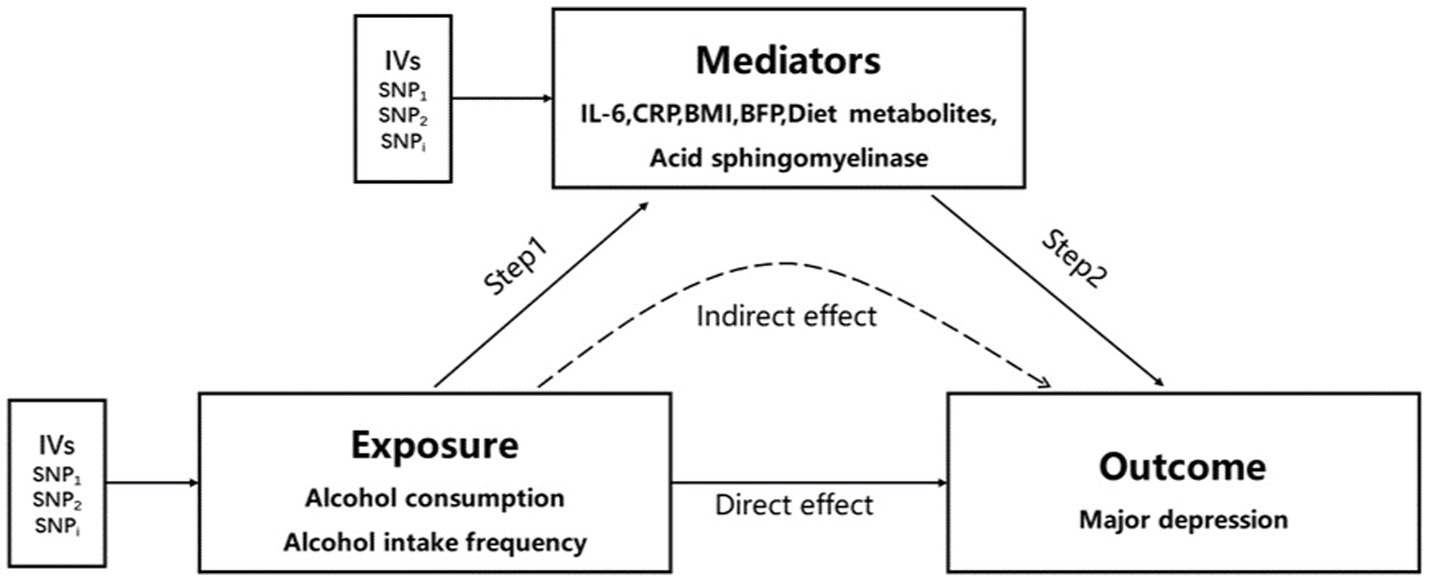
Figure 2. Two-step MR analysis framework. Step 1 estimated the causal effect of the exposure on the potential mediators, and step 2 assessed the causal effect of the mediators on major depression. “Direct effect” indicates the effect of exposure on major depression. “Indirect effect” indicates the effect of exposure on major depression through the mediator. IVs, instrumental variables.

Table 4. Two-step MR results for the relationship between major depression and alcohol.
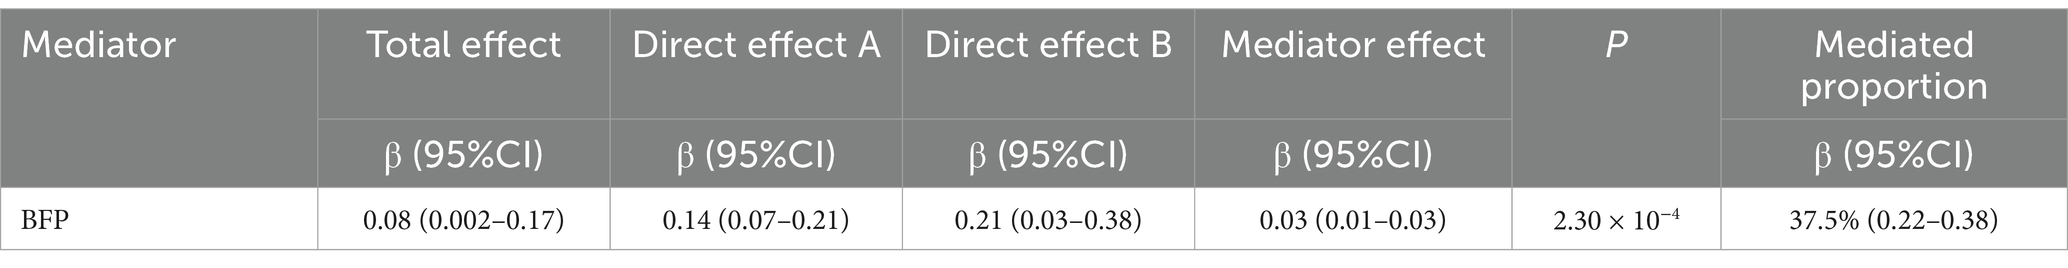
Table 5. The mediation effect of alcohol intake frequency on major depression via BFP.
Discussion
In this study, we conducted an analysis on the causal effects of alcohol consumption and alcohol intake frequency on major depression. We found that alcohol consumption can alleviate major depression without considering different types of drinking, while alcohol intake frequency can aggravate it. However, when we comprehensively considered different types of drinking and possible mediating factors, we concluded that alcohol intake frequency is the main cause of aggravating major depression. One of the reasons for this is that alcohol intake frequency worsens the BFP, which in turn aggravates major depression.
In analyzing the causal effects of alcohol consumption and alcohol intake frequency on major depression, our study emphasizes the importance of the amount of alcohol consumed. The data for alcohol consumption was obtained from the GWAS study conducted by Clarke et al. (23). The average age of the participants in this study was 59.6 years old, with an average weekly alcohol consumption of 121.04 g, which is below the theoretical minimum risk drinking amount of 130.90 g/week (46). Therefore, the participants in this study can be classified as moderate drinkers. Our research findings suggest that moderate drinking can alleviate major depression. However, as alcohol intake frequency increases and the amount of drinking exceeds the theoretical minimum drinking amount, alcohol consumption becomes a factor that increasing the risk of major depression. This viewpoint is partially supported by the study conducted by Hammerton et al. (47). In their investigation, encompassing a sample of 3,902 adolescents, they discovered a direct correlation between alcohol dependency during the age of 18 and the onset of depression at the age of 24. However, no substantiating proof was identified to support the notion of a connection between alcohol usage and depression. Another study by Li et al. (48) examined the correlation between alcohol intake, alcohol use disorder, and the risk of depression. Their findings revealed that moderate drinking (0 g~84 g/week) reduces the risk of depression, while alcohol use disorder significantly increases the risk of subsequent depression (relative risk 1.57, 95% CI 1.41~1.76). This indicates that excessive drinking to the extent of alcohol use disorder can indeed contribute to depression.
A variety of biological mechanisms can provide evidence for the causal relationship between alcohol consumption and depression, such as the serotonin hypothesis. Serotonin (5-hydroxytryptamine), a neurotransmitter, is known to be related to the pathophysiology and treatment of depression (49). The synthesis of serotonin in the brain depends on the level of its precursor, tryptophan, in the plasma (50). During short-term or long-term alcohol abuse, the activity of hepatic tryptophan pyrrolase that responsible for tryptophan degradation increases, resulting in a decrease in plasma tryptophan levels. This reduction in tryptophan levels leads to a decrease in serotonin synthesis in the brain (51). The mediating effect of obesity is also related to tryptophan metabolism. Obesity is considered a chronic inflammatory state, with adipocytes secreting inflammatory cytokines such as IFN-γ, TNFα, and IL-1β (52). Alcohol exacerbates this inflammatory state, which in turn stimulates indoleamine 2,3-dioxygenase (IDO) and leads to the catabolism of tryptophan. This further reduces plasma tryptophan levels and hampers the synthesis of serotonin in the brain (53). In addition to reducing plasma tryptophan content, alcohol can directly decrease the number of serotonin neurons in the dorsal raphe nucleus through inflammatory reactions (54), contributing to the development of depression. The presence of obesity can intensify these inflammatory reactions (53). Another theory on the pathogenesis of depression involves the hyperfunction of the hypothalamic–pituitary–adrenal (HPA) axis, characterized by increased activity of corticotropin-releasing factor, reduced negative feedback function, and elevated cortisol levels (55). Alcohol not only affects the HPA axis of the fetus through maternal intake during early life, increasing the risk of subsequent depression (56), but it can also directly stimulate the HPA axis in adults, promoting the onset of depression (57). Cortisol has been found to facilitate the conversion of preadipocytes into mature adipocytes, and an elevation in cortisol levels is associated with an increase in fat accumulation (58). However, the precise mechanism through which alcohol consumption exacerbates depression by affecting adiposity requires further investigation through rigorous and high-quality studies.
For the reduction of depression risk through moderate alcohol consumption, it appears to be associated with the enhancement of dopaminergic and GABAergic signaling (59). In vivo microdialysis studies conducted on awake and freely moving rodents have demonstrated that alcohol increases dopamine levels in the nAc, thereby suggesting a decrease in depressive symptoms (60, 61). Additionally, alcohol can enhance the function of GABAergic transmission in the amygdala, which is also linked to resistance against depressive symptoms (62, 63). It is important to note that enhanced dopaminergic and GABAergic signaling is also associated with addictive behaviors (64). Therefore, moderate alcohol consumption can reduce the risk of depression, while excessive alcohol consumption can lead to addictive behaviors, which may also be indicative of depression. The influence of social factors may contribute to the diminished visibility of the causal connection between major depression and alcohol consumption when taking into account the collective impact of various alcoholic beverages. Research indicates that individuals who prefer red wine or white wine/champagne tend to have higher education levels and greater economic income compared with those who prefer beer/cider. This may explain why the consumption of red wine and white wine/champagne is linked to a lower risk of depression (65–68). As the population’s income and education levels continue to rise, it will be necessary to reevaluate the impact of different drinking preferences on major depression in the future.
In this research, a comprehensive two-sample Mendelian randomization study was conducted, utilizing a substantial number of stable and persistent genetic variants extracted from the GWAS summary. The primary objective of this investigation was to delve into the potential causal relationship between alcohol consumption, alcohol intake frequency and major depression, specifically focusing on major depression and normal drinking. Notably, the study exclusively focused on individuals of European descent to ensure the absence of ethnic bias. The decision to employ MR analysis instead of retrospective studies was made due to its ability to eliminate confounding variables and its immunity to reverse causation. Furthermore, MR studies offer larger sample sizes and a closer approximation to random assignment in comparison to randomized controlled trials. Moreover, our study utilized instrumental variables that were considerably more detailed, comprehensive, and reliable when compared to previous research endeavors. However, it is crucial to acknowledge certain limitations within this study. Firstly, the biological significance of the genetic tools employed in this research remains unknown, thus we cannot completely dismiss the possibility of violations of the independence and exclusion restriction assumptions, particularly regarding pleiotropy. Nonetheless, we incorporated various methods, such as sensitivity analysis employing the Cochran Q statistic, MR-PRESSO, weighted median, weighted mode, and MR-Egger, to determine trustworthy causal estimates. Secondly, the SNPs associated with alcohol consumption predominantly originated from the UK Biobank study, which predominantly consisted of individuals with a mean age of 59.6 years. Conversely, the sample used in the major depressive disorder GWAS encompassed a broader age range. Consequently, it is plausible that alcohol usage among younger individuals could be influenced by other variants with distinct associations with major depression, However, it should be duly noted that relevant GWAS data pertaining to this phenomenon is not yet accessible. Thirdly, it is important to note that we cannot confirm whether the individuals in the study received psychotherapy as part of their treatment. The inclusion of psychotherapy may have some influence on the study’s results. This is because, if the participants had received psychotherapy, it is likely that it would have helped them reduce their alcohol usage and alleviate their significant depression. Therefore, these factors must be considered when interpreting the study’s conclusions. Lastly, while MR can effectively serve as an alternative to randomized controlled trials when assessing causality, it is crucial to acknowledge that genetic variation is inherently influenced by innate factors and may not entirely reflect the impact of a particular intervention on the outcomes. To obtain definitive confirmation of causal relationships, it may be necessary to conduct randomized controlled trials (RCTs) on preventive interventions. Additionally, it should be noted that the depression genome-wide association studies (GWAS) utilized in our analysis did not account for the diversity of major depressive disorder (MDD), specifically atypical depression and melancholic depression.
To explore the potential correlation between depression and alcohol consumption, a bidirectional two-sample MR analysis was executed in this research. The results show strong genetic evidence supporting a causal connection between increased frequency of drinking and heightened susceptibility to major depression. Furthermore, it was observed that the impact of augmented alcohol intake on depression risk is partially influenced by the BFP. These findings have important therapeutic implications for people with alcohol use disorder and MDD. Individuals with comorbid drinking disorders and MDD may benefit from a progressive reduction in alcohol use and weight management during treatment rather than abrupt alcohol abstinence. This approach can help align patients’ psychological and physiological elements with treatment goals, potentially reducing psychological stress associated with alcohol withdrawal and alleviating depression symptoms. A less rigorous treatment strategy may also increase patient compliance and overall therapy efficacy. It is advisable to carry out a robust randomized clinical trial in the future to substantiate the significance of these discoveries.
Data availability statement
The original contributions presented in the study are included in the article/Supplementary material, further inquiries can be directed to the corresponding author.
Ethics statement
Ethical approval was not required for the study involving humans in accordance with the local legislation and institutional requirements. Written informed consent to participate in this study was not required from the participants or the participants’ legal guardians/next of kin in accordance with the national legislation and the institutional requirements.
Author contributions
WF: Writing – original draft, Writing – review & editing, Data curation, Investigation. BZ: Writing – review & editing, Funding acquisition, Project administration, Supervision, Validation. PD: Data curation, Writing – review & editing. Y-hB: Methodology, Writing – review & editing. ZJ: Validation, Writing – review & editing. XL: Investigation, Writing – review & editing. XZ: Software, Writing – review & editing. KZ: Data curation, Writing – review & editing.
Funding
The author(s) declare that financial support was received for the research, authorship, and/or publication of this article. This study was supported by the National Natural Science Foundation of China (grant no. 82072129).
Acknowledgments
The authors express our gratitude to the IEU Open GWAS database (https://gwas.Mrcieu.ac.uk/) for providing publicly available summary-level GWAS data for our study.
Conflict of interest
The authors declare that the research was conducted in the absence of any commercial or financial relationships that could be construed as a potential conflict of interest.
Publisher’s note
All claims expressed in this article are solely those of the authors and do not necessarily represent those of their affiliated organizations, or those of the publisher, the editors and the reviewers. Any product that may be evaluated in this article, or claim that may be made by its manufacturer, is not guaranteed or endorsed by the publisher.
Supplementary material
The Supplementary material for this article can be found online at: https://www.frontiersin.org/articles/10.3389/fpubh.2024.1372758/full#supplementary-material
Footnotes
References
1. O'Connor, EA, Perdue, LA, Coppola, EL, Henninger, ML, Thomas, RG, and Gaynes, BN. Depression and suicide risk screening: updated evidence report and systematic review for the US preventive services task force. JAMA. (2023) 329:2068–85. doi: 10.1001/jama.2023.7787
2. GBD 2019 Diseases and Injuries Collaborators. Global burden of 369 diseases and injuries in 204 countries and territories, 1990-2019: a systematic analysis for the global burden of disease study 2019. Lancet. (2020) 396:1204–22. doi: 10.1016/S0140-6736(20)30925-9
3. Liu, Q, He, H, Yang, J, Feng, X, Zhao, F, and Lyu, J. Changes in the global burden of depression from 1990 to 2017: findings from the global burden of disease study. J Psychiatr Res. (2019) 126:134–40. doi: 10.1016/j.jpsychires.2019.08.002
4. Hammen, C . Risk factors for depression: an autobiographical review. Annu Rev Clin Psychol. (2018) 14:1–28. doi: 10.1146/annurev-clinpsy-050817-084811
5. Peele, S, and Brodsky, A. Exploring psychological benefits associated with moderate alcohol use: a necessary corrective to assessments of drinking outcomes? Drug Alcohol Depend. (2000) 60:221–47. doi: 10.1016/S0376-8716(00)00112-5
6. Müller, CP, and Schumann, G. Drugs as instruments: a new framework for non-addictive psychoactive drug use. Behav Brain Sci. (2011) 34:293–310. doi: 10.1017/S0140525X11000057
7. Zhou, H, Polimanti, R, Yang, BZ, Wang, Q, Han, S, Sherva, R, et al. Genetic risk variants associated with comorbid alcohol dependence and major depression. JAMA Psychiatry. (2017) 74:1234–41. doi: 10.1001/jamapsychiatry.2017.3275
8. Boden, JM, and Fergusson, DM. Alcohol and depression. Addiction. (2011) 106:906–14. doi: 10.1111/j.1360-0443.2010.03351.x
9. Cao, R, Gao, T, Ren, H, Hu, Y, Qin, Z, Liang, L, et al. Unique and cumulative effects of lifestyle-related behaviors on depressive symptoms among Chinese adolescents. Int J Soc Psychiatry. (2022) 68:354–64. doi: 10.1177/0020764021996739
10. Lasserre, AM, Imtiaz, S, Roerecke, M, Heilig, M, Probst, C, and Rehm, J. Socioeconomic status, alcohol use disorders, and depression: a population-based study. J Affect Disord. (2022) 301:331–6. doi: 10.1016/j.jad.2021.12.132
11. Pacek, LR, Martins, SS, and Crum, RM. The bidirectional relationships between alcohol, cannabis, co-occurring alcohol and cannabis use disorders with major depressive disorder: results from a national sample. J Affect Disord. (2013) 148:188–95. doi: 10.1016/j.jad.2012.11.059
12. Turner, S, Mota, N, Bolton, J, and Sareen, J. Self-medication with alcohol or drugs for mood and anxiety disorders: a narrative review of the epidemiological literature. Depress Anxiety. (2018) 35:851–60. doi: 10.1002/da.22771
13. Lee, JS, Lee, SB, Kim, DW, Shin, N, Jeong, SJ, Yang, CH, et al. Social isolation-related depression accelerates ethanol intake via microglia-derived neuroinflammation. Sci Adv. (2021) 7:eabj3400. doi: 10.1126/sciadv.abj3400
14. Visontay, R, Mewton, L, Slade, T, Aris, IM, and Sunderland, M. Moderate alcohol consumption and depression: a marginal structural model approach promoting causal inference. Am J Psychiatry. (2023) 180:209–17. doi: 10.1176/appi.ajp.22010043
15. Gémes, K, Forsell, Y, Janszky, I, László, KD, Lundin, A, Ponce De Leon, A, et al. Moderate alcohol consumption and depression—a longitudinal population-based study in Sweden. Acta Psychiatr Scand. (2019) 139:526–35. doi: 10.1111/acps.13034
16. Müller, CP, Kalinichenko, LS, Tiesel, J, Witt, M, Stöckl, T, Sprenger, E, et al. Paradoxical antidepressant effects of alcohol are related to acid sphingomyelinase and its control of sphingolipid homeostasis. Acta Neuropathol. (2017) 133:463–83. doi: 10.1007/s00401-016-1658-6
17. Gentile, A, Bianco, A, Nordstrӧm, A, and Nordstrӧm, P. Use of alcohol, drugs, inhalants, and smoking tobacco and the long-term risk of depression in men: a nationwide Swedish cohort study from 1969-2017. Drug Alcohol Depend. (2021) 221:108553. doi: 10.1016/j.drugalcdep.2021.108553
18. Yao, S, Zhang, M, Dong, SS, Wang, JH, Zhang, K, Guo, J, et al. Bidirectional two-sample Mendelian randomization analysis identifies causal associations between relative carbohydrate intake and depression. Nat Hum Behav. (2022) 6:1569–76. doi: 10.1038/s41562-022-01412-9
19. Lawlor, DA, Harbord, RM, Sterne, JA, Timpson, N, and Davey, SG. Mendelian randomization: using genes as instruments for making causal inferences in epidemiology. Stat Med. (2008) 27:1133–63. doi: 10.1002/sim.3034
20. Davies, NM, Holmes, MV, and Davey, SG. Reading Mendelian randomisation studies: a guide, glossary, and checklist for clinicians. BMJ. (2018) 362:k601. doi: 10.1136/bmj.k601
21. Lawlor, DA, Wade, KH, Borges, MC, Palmer, T, Hartwig, FP, Hemani, G, et al. A Mendelian randomization dictionary: useful definitions and descriptions for undertaking, understanding and interpreting Mendelian randomization studies. OSF Preprints. (2019). doi: 10.31219/osf.io/6yzs7
22. Howard, DM, Adams, MJ, Clarke, TK, Hafferty, JD, Gibson, J, Shirali, M, et al. Genome-wide meta-analysis of depression identifies 102 independent variants and highlights the importance of the prefrontal brain regions. Nat Neurosci. (2019) 22:343–52. doi: 10.1038/s41593-018-0326-7
23. Clarke, TK, Adams, MJ, Davies, G, Howard, DM, Hall, LS, Padmanabhan, S, et al. Genome-wide association study of alcohol consumption and genetic overlap with other health-related traits in UK biobank (N=112 117). Mol Psychiatry. (2017) 22:1376–84. doi: 10.1038/mp.2017.153
24. Kelly, KM, Smith, JA, and Mezuk, B. Depression and interleukin-6 signaling: a Mendelian randomization study. Brain Behav Immun. (2021) 95:106–14. doi: 10.1016/j.bbi.2021.02.019
25. Zheng, H, Teague, TK, Yeh, FC, Burrows, K, Figueroa-Hall, LK, Aupperle, RL, et al. C-reactive protein and the kynurenic acid to quinolinic acid ratio are independently associated with white matter integrity in major depressive disorder. Brain Behav Immun. (2022) 105:180–9. doi: 10.1016/j.bbi.2022.07.011
26. Gueltzow, M, Bijlsma, MJ, van Lenthe, FJ, and Myrskylä, M. The contribution of health behaviors to depression risk across birth cohorts. Epidemiology. (2022) 33:880–9. doi: 10.1097/EDE.0000000000001524
27. McCarty, CA, Kosterman, R, Mason, WA, McCauley, E, Hawkins, JD, Herrenkohl, TI, et al. Longitudinal associations among depression, obesity and alcohol use disorders in young adulthood. Gen Hosp Psychiatry. (2009) 31:442–50. doi: 10.1016/j.genhosppsych.2009.05.013
28. van der Spek, A, Stewart, ID, Kühnel, B, Pietzner, M, Alshehri, T, Gauß, F, et al. Circulating metabolites modulated by diet are associated with depression. Mol Psychiatry. (2023) 28:3874–87. doi: 10.1038/s41380-023-02180-2
29. Staley, JR, Blackshaw, J, Kamat, MA, Ellis, S, Surendran, P, Sun, BB, et al. PhenoScanner: a database of human genotype-phenotype associations. Bioinformatics. (2016) 32:3207–9. doi: 10.1093/bioinformatics/btw373
30. Kamat, MA, Blackshaw, JA, Young, R, Surendran, P, Burgess, S, Danesh, J, et al. PhenoScanner V2: an expanded tool for searching human genotype-phenotype associations. Bioinformatics. (2019) 35:4851–3. doi: 10.1093/bioinformatics/btz469
31. Burgess, S, and Thompson, SG. Avoiding bias from weak instruments in Mendelian randomization studies. Int J Epidemiol. (2011) 40:755–64. doi: 10.1093/ije/dyr036
32. Meddens, SFW, de Vlaming, R, Bowers, P, Burik, CAP, Linnér, RK, Lee, C, et al. Genomic analysis of diet composition finds novel loci and associations with health and lifestyle. Mol Psychiatry. (2021) 26:2056–69. doi: 10.1038/s41380-020-0697-5
33. Palmer, TM, Lawlor, DA, Harbord, RM, Sheehan, NA, Tobias, JH, Timpson, NJ, et al. Using multiple genetic variants as instrumental variables for modifiable risk factors. Stat Methods Med Res. (2012) 21:223–42. doi: 10.1177/0962280210394459
34. Burgess, S, Butterworth, A, and Thompson, SG. Mendelian randomization analysis with multiple genetic variants using summarized data. Genet Epidemiol. (2013) 37:658–65. doi: 10.1002/gepi.21758
35. Bowden, J, Del Greco, MF, Minelli, C, Davey Smith, G, Sheehan, N, and Thompson, J. A framework for the investigation of pleiotropy in two-sample summary data Mendelian randomization. Stat Med. (2017) 36:1783–802. doi: 10.1002/sim.7221
36. Bowden, J, Davey Smith, G, and Burgess, S. Mendelian randomization with invalid instruments: effect estimation and bias detection through egger regression. Int J Epidemiol. (2015) 44:512–25. doi: 10.1093/ije/dyv080
37. Bowden, J, Davey Smith, G, Haycock, PC, and Burgess, S. Consistent estimation in Mendelian randomization with some invalid instruments using a weighted median estimator. Genet Epidemiol. (2016) 40:304–14. doi: 10.1002/gepi.21965
38. Hartwig, FP, Davey Smith, G, and Bowden, J. Robust inference in summary data Mendelian randomization via the zero modal pleiotropy assumption. Int J Epidemiol. (2017) 46:1985–98. doi: 10.1093/ije/dyx102
39. Slob, EAW, Groenen, PJF, Thurik, AR, and Rietveld, CA. A note on the use of egger regression in Mendelian randomization studies. Int J Epidemiol. (2017) 46:2094–7. doi: 10.1093/ije/dyx191
40. Verbanck, M, Chen, CY, Neale, B, and Do, R. Detection of widespread horizontal pleiotropy in causal relationships inferred from Mendelian randomization between complex traits and diseases. Nat Genet. (2018) 50:693–8. doi: 10.1038/s41588-018-0099-7
41. Gronau, QF, and Wagenmakers, EJ. Limitations of Bayesian leave-one-out cross-validation for model selection. Comput Brain Behav. (2019) 2:1–11. doi: 10.1007/s42113-018-0011-7
42. Sanderson, E, Davey Smith, G, Windmeijer, F, and Bowden, J. An examination of multivariable Mendelian randomization in the single-sample and two-sample summary data settings. Int J Epidemiol. (2019) 48:713–27. doi: 10.1093/ije/dyy262
43. VanderWeele, TJ . Mediation analysis: a Practitioner's guide. Annu Rev Public Health. (2016) 37:17–32. doi: 10.1146/annurev-publhealth-032315-021402
44. Carter, AR, Gill, D, Davies, NM, Taylor, AE, Tillmann, T, Vaucher, J, et al. Understanding the consequences of education inequality on cardiovascular disease: mendelian randomisation study. BMJ. (2019) 365:l1855. doi: 10.1136/bmj.l1855
45. Rodríguez-Rabassa, M, López, P, Sánchez, R, Hernández, C, Rodríguez, C, Rodríguez-Santiago, RE, et al. Inflammatory biomarkers, microbiome, depression, and executive dysfunction in alcohol users. Int J Environ Res Public Health. (2020) 17:689. doi: 10.3390/ijerph17030689
46. GBD 2020 Alcohol Collaborators. Population-level risks of alcohol consumption by amount, Geography, age, sex, and year: a systematic analysis for the global burden of disease study 2020. Lancet. (2022) 400:185–235. doi: 10.1016/S0140-6736(22)00847-9
47. Hammerton, G, Lewis, G, Heron, J, Fernandes, G, Hickman, M, and Lewis, G. The association of alcohol dependence and consumption during adolescence with depression in young adulthood, in England: a prospective cohort study. Lancet Psychiatry. (2023) 10:490–8. doi: 10.1016/S2215-0366(23)00138-4
48. Li, J, Wang, H, Li, M, Shen, Q, Li, X, Zhang, Y, et al. Effect of alcohol use disorders and alcohol intake on the risk of subsequent depressive symptoms: a systematic review and meta-analysis of cohort studies. Addiction. (2020) 115:1224–43. doi: 10.1111/add.14935
49. Artigas, F . Serotonin receptors involved in antidepressant effects. Pharmacol Ther. (2013) 137:119–31. doi: 10.1016/j.pharmthera.2012.09.006
50. Nakatani, Y, Sato-Suzuki, I, Tsujino, N, Nakasato, A, Seki, Y, Fumoto, M, et al. Augmented brain 5-HT crosses the blood-brain barrier through the 5-HT transporter in rat. Eur J Neurosci. (2008) 27:2466–72. doi: 10.1111/j.1460-9568.2008.06201.x
51. Badawy, AA . Tryptophan metabolism in alcoholism. Nutr Res Rev. (2002) 15:123–52. doi: 10.1079/NRR200133
52. Chaves Filho, AJM, Lima, CNC, Vasconcelos, SMM, de Lucena, DF, Maes, M, and Macedo, D. IDO chronic immune activation and tryptophan metabolic pathway: a potential pathophysiological link between depression and obesity. Prog Neuro-Psychopharmacol Biol Psychiatry. (2018) 80:234–49. doi: 10.1016/j.pnpbp.2017.04.035
53. Martín-González, C, Fernández-Alonso, P, Pérez-Hernández, O, Abreu-González, P, Espelosín-Ortega, E, Fernández-Rodríguez, CM, et al. Sarcopenic obesity in people with alcoholic use disorder: relation with inflammation, vascular risk factors and serum vitamin D levels. Int J Mol Sci. (2023) 24:976. doi: 10.3390/ijms24129976
54. Khan, KM, Bierlein-De La Rosa, G, Biggerstaff, N, Pushpavathi Selvakumar, G, Wang, R, Mason, S, et al. Adolescent ethanol drinking promotes hyperalgesia, neuroinflammation and serotonergic deficits in mice that persist into adulthood. Brain Behav Immun. (2023) 107:419–31. doi: 10.1016/j.bbi.2022.07.160
55. Mikulska, J, Juszczyk, G, Gawrońska-Grzywacz, M, and Herbet, M. HPA Axis in the Pathomechanism of depression and schizophrenia: new therapeutic strategies based on its participation. Brain Sci. (2021) 11:1298. doi: 10.3390/brainsci11101298
56. Ciafrè, S, Ferraguti, G, Greco, A, Polimeni, A, Ralli, M, Ceci, FM, et al. Alcohol as an early life stressor: epigenetics, metabolic, neuroendocrine and neurobehavioral implications. Neurosci Biobehav Rev. (2020) 118:654–68. doi: 10.1016/j.neubiorev.2020.08.018
57. Blaine, SK, and Sinha, R. Alcohol, stress, and glucocorticoids: from risk to dependence and relapse in alcohol use disorders. Neuropharmacology. (2017) 122:136–47. doi: 10.1016/j.neuropharm.2017.01.037
58. Incollingo Rodriguez, AC, Epel, ES, White, ML, Standen, EC, Seckl, JR, and Tomiyama, AJ. Hypothalamic-pituitary-adrenal axis dysregulation and cortisol activity in obesity: a systematic review. Psychoneuroendocrinology. (2015) 62:301–18. doi: 10.1016/j.psyneuen.2015.08.014
59. Volkow, ND, Wiers, CE, Shokri-Kojori, E, Tomasi, D, Wang, GJ, and Baler, R. Neurochemical and metabolic effects of acute and chronic alcohol in the human brain: studies with positron emission tomography. Neuropharmacology. (2017) 122:175–88. doi: 10.1016/j.neuropharm.2017.01.012
60. Clarke, R, and Adermark, L. Dopaminergic regulation of striatal interneurons in reward and addiction: focus on alcohol. Neural Plast. (2015) 2015:814567:1–11. doi: 10.1155/2015/814567
61. Salamone, JD, and Correa, M. The mysterious motivational functions of mesolimbic dopamine. Neuron. (2012) 76:470–85. doi: 10.1016/j.neuron.2012.10.021
62. Nie, Z, Schweitzer, P, Roberts, AJ, Madamba, SG, Moore, SD, and Siggins, GR. Ethanol augments GABAergic transmission in the central amygdala via CRF1 receptors. Science. (2004) 303:1512–4. doi: 10.1126/science.1092550
63. Zhu, Z, Wang, G, Ma, K, Cui, S, and Wang, JH. GABAergic neurons in nucleus accumbens are correlated to resilience and vulnerability to chronic stress for major depression. Oncotarget. (2017) 8:35933–45. doi: 10.18632/oncotarget.16411
64. Wise, RA, and Jordan, CJ. Dopamine, behavior, and addiction. J Biomed Sci. (2021) 28:83. doi: 10.1186/s12929-021-00779-7
65. Nielsen, NR, Schnohr, P, Jensen, G, and Grønbaek, M. Is the relationship between type of alcohol and mortality influenced by socio-economic status? J Intern Med. (2004) 255:280–8. doi: 10.1046/j.1365-2796.2003.01268.x
66. Strandberg, TE, Strandberg, AY, Salomaa, VV, Pitkälä, K, Tilvis, RS, and Miettinen, TA. Alcoholic beverage preference, 29-year mortality, and quality of life in men in old age. J Gerontol Series A Biol Sci Med Sci. (2007) 62:213–8. doi: 10.1093/gerona/62.2.213
67. Cheng, B, Chu, X, Yang, X, Wen, Y, Jia, Y, Liang, C, et al. Dietary habit is associated with depression and intelligence: an observational and genome-wide environmental interaction analysis in the UK biobank cohort. Nutrients. (2021) 13:1150. doi: 10.3390/nu13041150
68. González-López-Arza, MV, Triviño-Palomo, JV, Montanero-Fernández, J, Garrido-Ardila, EM, González-Sánchez, B, Jiménez-Palomares, M, et al. Benefits of the light consumption of red wine in pain, tender points, and anxiety in women with fibromyalgia: a pilot study. Nutrients. (2023) 15:469. doi: 10.3390/nu15153469
Keywords: major depression (MDD), alcohol consumer, alcohol intake frequency, fat percentage, BMI
Citation: Feng W, Zhang B, Duan P, Bi Y-h, Jin Z, Li X, Zhao X and Zuo K (2024) Risk of major depressive increases with increasing frequency of alcohol drinking: a bidirectional two-sample Mendelian randomization analysis. Front. Public Health. 12:1372758. doi: 10.3389/fpubh.2024.1372758
Edited by:
Kaston D. Anderson, Michigan State University, United StatesReviewed by:
Massimo Tusconi, University of Cagliari, ItalySilvia Portero De La Cruz, University of Córdoba, Spain
Copyright © 2024 Feng, Zhang, Duan, Bi, Jin, Li, Zhao and Zuo. This is an open-access article distributed under the terms of the Creative Commons Attribution License (CC BY). The use, distribution or reproduction in other forums is permitted, provided the original author(s) and the copyright owner(s) are credited and that the original publication in this journal is cited, in accordance with accepted academic practice. No use, distribution or reproduction is permitted which does not comply with these terms.
*Correspondence: Bing Zhang, 600771@hrbmu.edu.cn