 Jamie Ferris
 Jonathan Zwier1
 Wendy J. Carender
 Kathleen H. Sienko
- 1Department of Mechanical Engineering, University of Michigan, Ann Arbor, MI, United States
- 2Michigan Balance Vestibular Testing and Rehabilitation, Department of Otolaryngology, Michigan Medicine, Ann Arbor, MI, United States
Introduction: In order for balance therapy to be successful, the training must occur at the appropriate dosage. However, physical therapist (PT) visual evaluation, the current standard of care for intensity assessment, is not always effective during telerehabilitation. Alternative balance exercise intensity assessment methods have not previously been compared to expert PT evaluations. The aim of this study was therefore to assess the relationship between PT participant ratings of standing balance exercise intensity and balance participant self-ratings or quantitative posturographic measures.
Methods: Ten balance participants with age or vestibular disorder-related balance concerns completed a total of 450 standing balance exercises (three trials each of 150 exercises) while wearing an inertial measurement unit on their lower back. They provided per-trial and per-exercise self-ratings of balance intensity on a scale from 1 (steady) to 5 (loss of balance). Eight PT participants reviewed video recordings and provided a total of 1,935 per-trial and 645 per-exercise balance intensity expert ratings.
Results: PT ratings were of good inter-rater reliability and significantly correlated with exercise difficulty, supporting the use of this intensity scale. Per-trial and per-exercise PT ratings were significantly correlated with both self-ratings (r = 0.77–0.79) and kinematic data (r = 0.35–0.74). However, the self-ratings were significantly lower than the PT ratings (difference of 0.314–0.385). Resulting predictions from self-ratings or kinematic data agreed with PT ratings approximately 43.0–52.4% of the time, and agreement was highest for ratings of a 5.
Discussion: These preliminary findings suggested that self-ratings best indicated two intensity levels (i.e., higher/lower) and sway kinematics were most reliable at intensity extremes.
1. Introduction
Balance ability deteriorates with age (1–3), leading to increased fall risk and fall prevalence in healthy older adults (4). Balance can also be impaired by the presence of sensory or neurologic disorders such as peripheral sensory loss (5, 6), vestibular disorder (6–8), multiple sclerosis (9–11), cerebrovascular accident (12), traumatic brain injury (13, 14), and Parkinson's disease (15, 16). Low balance confidence and fear of falling are associated with increased fall risk (17, 18), anxiety (19–21), depression (19, 20), and institutionalization (21, 22), and with decreased activity (3, 19, 23), social participation (23, 24), and quality of life (19, 23).
Balance training, which is traditionally performed in a clinical setting with the instruction of a physical therapist (PT), can improve balance ability when it occurs at the appropriate dosage such that the training is at or near the limits of an individual's ability (25–27). Dosage has been described as the combination of frequency, intensity, time, and type (FITT) where frequency refers to the regularity of training sessions, intensity refers to “the degree of challenge to the balance control system relative to the capacity of the individual to maintain balance” (28), time refers to the duration of each exercise and of the session, and type refers to the exercise itself (29–31). While frequency, time, and type are easily quantified (29, 31), intensity depends on both the difficulty of the exercise and the balancing ability of the individual, reflecting how challenging an exercise is for a particular individual at a specific time; it is therefore more difficult to assess (29–31). Unlike aerobic (e.g., percent of maximum heart rate) or resistance (e.g., percent of the 1-repetition maximum) exercise intensity (32), there is no standard assessment for balance exercise intensity. Most PTs visually observe the patient, employing their expert assessment to qualitatively adjust task intensity (33, 34). However, visual expert assessment is more difficult during increasingly common telerehabilitation or home-based training during which a PT is not physically present.
Telerehabilitation has grown in popularity as a solution to both misdistribution of physical therapy services (35, 36) and public health concerns such as those posed by COVID-19 (37–40). Access to traditional physical therapy services is increasingly limited. It is predicted that by 2030, the United States alone will have a shortage of 140,000 PTs, resulting in the majority of patients having difficulty accessing necessary physical therapy services (41–43). Moreover, PTs are less available in low-income countries (35, 44, 45), where the majority of people with disabilities live (35). Availability of physical therapy is also lower in rural settings (35, 36, 44), where chronic conditions amenable to physical therapy are prevalent (36). In other countries such as Singapore, PTs are concentrated in acute-care facilities, leading to lesser availability in post-acute care sites (44).
While telerehabilitation may improve access to care, only 29% of PTs in a 2022 vestibular rehabilitation study expressed that telerehabilitation was as effective as in-person care (37); 92% of PTs in the same study reported that technology limitations affected their ability to view patients' bodies remotely. PTs have also reported that inappropriate lighting and patient positioning with respect to the camera can negatively affect clinical decision making (37, 46). Relatedly, patients have reported a lack of appropriate technology including computers with cameras (39), making visual assessment impossible in some cases.
In addition to telerehabilitation, home exercise programs may complement existing affordable physical therapy options available to patients, which have been limited in their duration. For example, until recently, public insurance for older adults in the United States (i.e., Medicare) covered only approximately 14–16 outpatient physical therapy visits [44]. In Singapore, only select follow-up rehabilitation services can be paid for with compulsory medical savings. And in Bangladesh, public funding for physical therapy is limited (44). As employment rates are lower for people with disabilities, extended physical therapy care is often financially inaccessible (35, 44). However, training without a professional's guidance has been shown to be less effective than supervised training (47, 48).
In contexts where visual assessment of balance task intensity is difficult such as telerehabilitation and home-based training, PTs may time exercises, employ quantitative posturography, or ask for patient self-assessments (38). Timing standing balance exercises may reflect the intensity of a task, but additional performance aspects such as arm movements or trunk sway may be of importance, and there may be a ceiling effect if task duration is limited (e.g., 30 s) (49).
Quantitative posturography, which is possible with inertial measurement units (IMUs) found in ubiquitous technology such as smart phones, can measure an individual's center of mass during standing balance and may therefore be indicative of task intensity (50–55). Alsubaie et al. compared kinematic measures to adults' self-ratings of intensity using 5 and 10-point scales, finding correlations of >0.6 in healthy adults and older adults (53) and >0.5 in adults with vestibular disorders (56) completing static standing balance exercises (i.e., exercises with the feet in place and a goal of maintaining quiet posture) (57). However, the relationships between the kinematic measures and self-ratings with PT (expert) assessments were not evaluated.
Self-report measures of intensity are analogous to the Borg Rating of Perceived Exertion for aerobic exercise (58) or the OMNI Resistance Exertion Scale for resistance exercise (59, 60). Espy et al. proposed a 10-point self-rating scale modeled after the Rate of Perceived Exertion and found that self-ratings of intensity are independent of heart rate in adults playing Wii games, supporting that the scale measured intensity beyond solely aerobic exertion (31). Shenoy et al. examined the same scale in people post-stroke and reported good test-retest reliability, good-to-excellent correlation with self-ratings of perceived challenge, and good-to-excellent correlation with clinical balance test scores (61). Farlie et al. proposed both 13-element and 5-point self-rating scales (28), reporting strong correlation (r = 0.70) between the scales in older adults completing standing balance tasks. However, they also reported that the 5-point scale was of poor person reliability and unable to statistically detect differences in intensity (62). While these studies suggest that self-assessments hold promise as measures of balance task intensity, it is important to understand the relationship between self-report measures and PT expert assessments as the current standard of care. Farlie et al. reported a strong correlation (r = 0.70) between self-rater and PT 5-point ratings of intensity, but they did not further comment on the differences (62). The relationship between self-rater and PT assessments of intensity is still poorly understood.
While quantitative posturography and self-assessment have both shown promise as methods for remote assessment of balance task intensity, few comparisons have been made to conventional visual assessment by expert PTs. This study therefore aimed to further assess the differences between PT expert assessments of balance intensity and self-assessments and kinematic measures.
2. Materials and methods
In this study on balance exercise intensity assessment, PT participant intensity ratings (i.e., PT ratings) were compared to balance participant intensity self-ratings (i.e., self-ratings) and kinematic measures.
2.1. Participants
Two types of participants completed this study: balance participants with age or vestibular disorder-related balance concerns and PT participants. Balance participants completed standing balance exercises while wearing an IMU, and they provided self-ratings of balance intensity. PT participants reviewed video recordings of the balance participants and provided ratings of balance intensity. 450 balance exercise trials were completed by 10 adult balance participants. Six older adult balance participants (2 F, 4 M, 69.0 ± 3.6 years) self-reported to be generally healthy with no muscular or neurological disorders, and four balance participants (2 F, 2 M, 61.7 ± 25.6 years) self-reported vestibular dysfunction. In addition, 1,935 intensity ratings were provided by eight PT participants who specialized in the treatment of balance disorders (16 ± 10 years of experience). The number of participants and resulting quantity of data is consistent with a number of related previously published studies (63–66). The study was approved by a University of Michigan Institutional Review Board (HUM00086479), and all participants gave written informed consent in accordance with the Helsinki Declaration.
2.2. Intensity rating scales
Both PT and balance participants were provided a 5-point intensity rating scale [see Table 1; also reported by Bao et al., Bao et al., and Kamran et al. (50–52)]. The scale was informed by a scale developed by Espy et al. (31). Different descriptors were provided to PT and balance participants with the intent of capturing similar performance aspects while using familiar terminology.
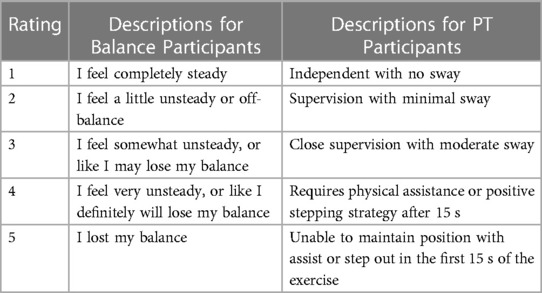
Table 1. The 1–5 balance intensity scale provided to PT and balance participants.
2.3. Procedures
2.3.1. Completion of balance exercises
Each balance participant completed 15 static standing balance exercises during which the participant was asked to maintain their feet in place and maintain a quiet posture. The exercises were selected from 54 possible options resulting from variations in surface (firm, foam), stance (feet apart, feet together, partial heel to toe, heel to toe, single leg stance), visual input (eyes open, eyes closed), and head movement (none, pitch, yaw) (57). Six exercises were excluded due to excessive difficulty for the study population (e.g., combinations of a single leg stance, eyes closed, and yaw or pitch head movements; combinations of a single leg stance and a foam surface). The exercises were selected so that each participant performed exercises spanning the intensity scale (i.e., from 1 to 5). Three 30-second trials were completed for each exercise resulting in a total of 45 total trials per balance participant. Because the active exercise duration (15 exercises × 3 trials × 30 s = 22 min 30 s) was less than the optimal duration of a balance training session (31–45 min), fatigue was expected to be minimal (25).
For the duration of testing, the balance participant wore a single six-degree-of-freedom IMU (MTx, XSens Inc, Eschende, Netherlands) on an elastic belt approximately positioned over the L4/L5 vertebrae level dorsal to the spine. IMU data were collected at 100 Hz using custom software, and the trunk sway angles were extracted using XSens' proprietary sensor fusion algorithm. Balance participants also wore an overhead harness positioned to provide no support unless the balance participant experienced a loss of balance, and they were provided a handrail for additional safety. They were instructed to touch the handrail, step out of position, or rely on the harness only when needed, continuing the trial after use of these additional supports. After each trial, the balance participant provided a per-trial self-rating of intensity. Additionally, after each exercise (i.e., collection of three trials), the balance participant provided a per-exercise self-rating of the overall intensity of that exercise.
2.3.2. Evaluation by physical therapist participants
All trials were video recorded from three angles such that the coronal plane, the sagittal plane, and the plane midway between the coronal and sagittal plane were visible. PT participants viewed de-identified videos showing the balance participant from all three angles of each trial once (see Figure 1) and provided per-trial intensity ratings via an electronic PDF form. Additionally, after viewing the videos for all three trials, they rated the overall intensity for that specific exercise. A PT participant rated all 45 trials from each balance participant for whom they were a rater, and each balance participant's videos were rated by 3–5 randomly selected PT participants. Trial order was not randomized so that the assessments could more closely reflect clinical practice in which patients often repeat multiple repetitions of the same exercises one after the other.
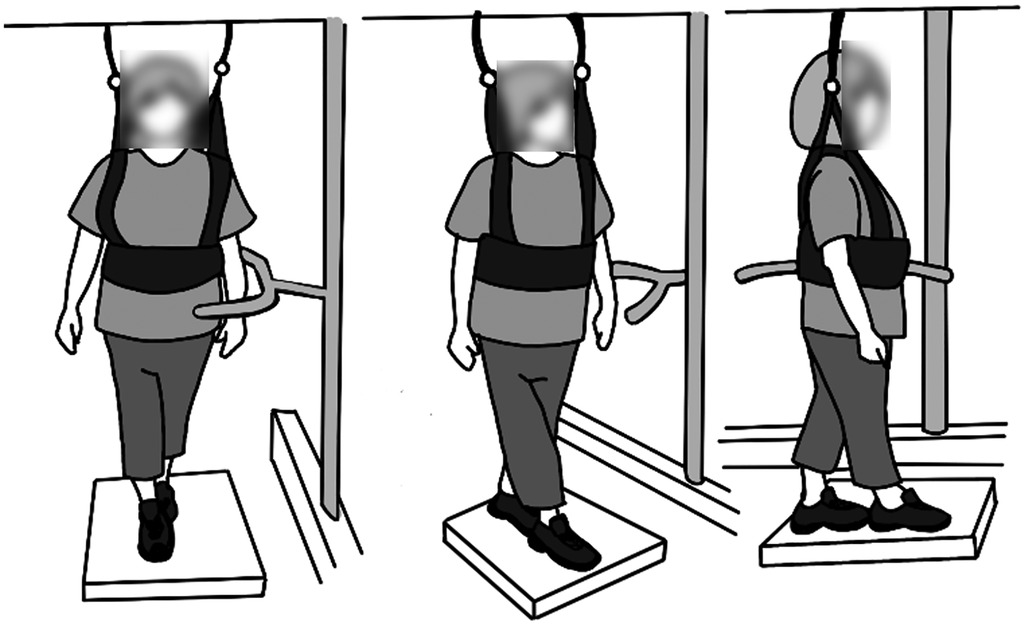
Figure 1. Layout of the video viewed by the PT participants. The video showed the coronal plane (left), sagittal plane (right), and the plane midway between the coronal and sagittal plane (center).
Twenty one per-trial PT ratings were excluded due to missing data. Consequently, 450 per-trial and 150 per-exercise self-ratings and 1,935 per-trial and 645 per-exercise PT ratings were analyzed.
2.4. Data analysis
MATLAB (R2021b, Mathworks, Natick, MA) was used to process and analyze the data according to the plan summarized in Figure 2. The ordinal rating data were treated as continuous throughout without impact on the statistical results, as is supported by recent literature (67–71).
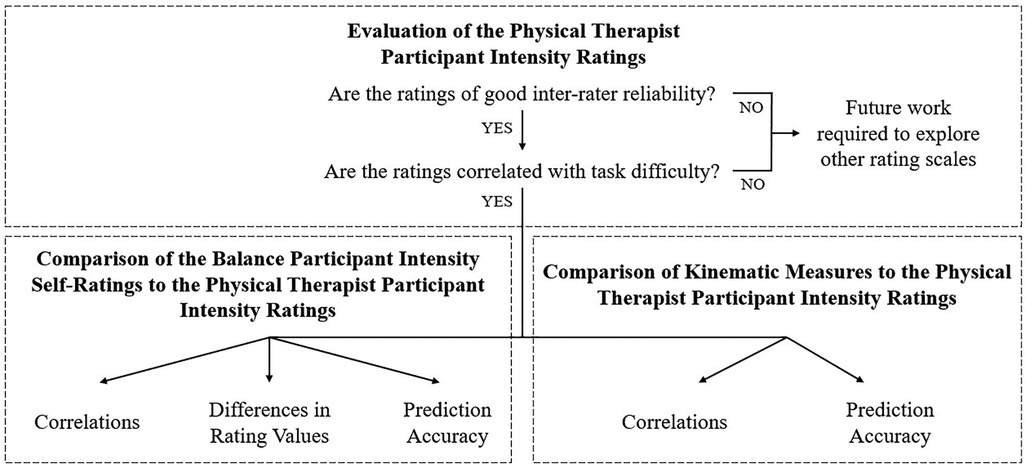
Figure 2. An overview of the analysis components. After assessing the PT ratings, these ratings were then compared to self-ratings or kinematic measures.
2.4.1. Evaluation of physical therapist participant intensity ratings
Because to our knowledge only one prior study examined PT ratings and reported limited separation (62), we first examined inter-rater reliability and the relationship between ratings and task difficulty. High inter-rater reliability was a prerequisite for further analysis due to its association with scale validity, study replicability, and the accuracy of alternative assessments. Reliability is an indicator of a scale's internal structure and as such, is a prerequisite to the scale's validity (72, 73). Low inter-rater reliability may also obfuscate true variation and therefore negatively affect replicability (74–76). Low inter-rater reliability would also impose a ceiling on the accuracy of alternative assessment methods (e.g., self-assessments or kinematic measures) because the alternative assessment could at best agree with only the majority PT rating. Similarly, weak correlation between the PT intensity ratings and task difficulty would suggest that the ratings scale may not be capturing intensity and may accidentally be capturing a different construct.
The effect of increasing exercise difficulty on PT ratings was evaluated by regressing the ratings against four dimensions of exercise difficulty: surface (coded 1: firm, 2: foam), stance (coded 1: feet apart, 2: feet together, 3: partial heel to toe, 4: heel to toe, 5: single leg), visual input (coded 1: eyes open, 2: eyes closed), and head movements (coded 1: no movements, 2: pitch or yaw movements). These dimensions and their relative difficulties were based on information from Klatt et al. (57). The regression was performed using a linear mixed model in which intensity rating was the outcome, one dimension of exercise difficulty was a fixed effect, and the specific balance participant and PT participant were random effects (rating = intercept + dimension of exercise difficulty + balance participant + PT participant + error) (53).
Additionally, the inter-rater reliability of the per-trial PT ratings was evaluated as ICC(2,1) via a linear mixed effects model that decomposed the variance. Fixed effects included the intercept and trial number (i.e., 1, 2, or 3), and random effects included all possible interactions between trial number, exercise, balance participant, and PT participant. The intraclass correlation coefficient (ICC) of the PT per-trial ratings was then calculated by dividing the variance of the subset of random effects that included the rater by the variance from all sources (77, 78). The inter-rater reliability of the PT per-exercise ratings was calculated using the same approach without the inclusion of random effects associated with trial number (since no trial number was associated with the exercise as a whole). ICCs less than 0.5 indicated poor reliability, ICCs between 0.5 to 0.75 indicated moderate reliability, ICCs between 0.75 to 0.9 indicated good reliability, and ICCs greater than 0.9 indicated excellent reliability (78).
2.4.2. Comparison of balance participant intensity self-ratings to physical therapist intensity ratings
The overall strength of the relationship between the per-exercise PT and self-ratings was quantified by the Spearman correlation coefficient. The systematic and random differences between the PT and self-ratings were then assessed by examining a contingency table of the two rating modes and quantified by the average and variance of the per-trial rating differences. The structure of these differences was further explored by using a paired t-test to compare the sample variances among the three per-trial PT ratings and the three per-trial self-ratings.
The overall effects of these differences were assessed by calculating how frequently a PT participant's rating could be accurately predicted given the self-rating, i.e., the accuracy when using self-ratings to predict per-trial and per-exercise PT ratings. The predictions were made using a linear model of the per-trial or per-exercise self-ratings.
2.4.3. Comparison of kinematic measures to physical therapist intensity ratings
Correlations between trunk kinematics and PT ratings were assessed by first calculating kinematic features and then conducting correlation tests.
Prior to feature calculation, the IMU angular position data were filtered using a second order Butterworth filter with a 3 Hz cutoff frequency (53). Kinematic features were then calculated including: root mean square (RMS) of the angular position (Phi RMS, degrees; Phi_Angle2 = AP_Angle2 + ML_Angle2 = Pitch2 + Roll2), RMS in the anterior-posterior (AP) direction (AP RMS, degrees; i.e., Pitch), RMS in the medial-lateral (ML) direction (ML RMS, degrees; i.e., Roll), mean sway velocity (MV, degrees/s), path length as computed by the sum of the magnitude of the differences between roll and pitch sway data points (degrees), and area of a 95th percentile confidence interval elliptical fit to the roll and pitch sway data (i.e., elliptical area; EA; degrees2) (26, 79). Smaller RMS and EA values have been associated with better balance performance (80–83), while reports of the relationship between MV and balance performance are mixed (81, 83, 84). As suggested by Alsubaie et al. and Schieppati et al., the logarithm of each of these kinematic features were also considered (53, 85).
The strength of the relationship between each kinematic feature and the PT ratings was then evaluated using correlation as calculated using a linear model with rating as the outcome variable, kinematic feature as a fixed effect, and balance participant as a random effect (rating = intercept + feature + balance participant + error) (53). The marginal correlation was calculated as (86):
Where is the marginal variance calculated from the multiplication of the feature coefficient and the feature , is the variance of the balance participant random effect, and is the error variance.
The overall effects of these various correlations were assessed by calculating how frequently a PT participant's rating could be accurately predicted given the sway kinematics, i.e., the accuracy when per-trial or per-exercise PT ratings were predicted using a linear combination of all kinematic features from the trial or all three trials, respectively.
Finally, the overall strength of the relationship between sway kinematic measures and intensity ratings was assessed using the Spearman correlation between the kinematics-predicted and per-trial or per-exercise PT ratings.
3. Results
3.1. Evaluation of physical therapist participant intensity ratings
The per-trial and per-exercise PT ratings were both of good inter rater reliability (per-trial: ICC = 0.868, per-exercise: ICC = 0.860). Additionally, increases in exercise difficulty were significantly correlated with increases in per-trial and per-exercise PT ratings (see Table 2).
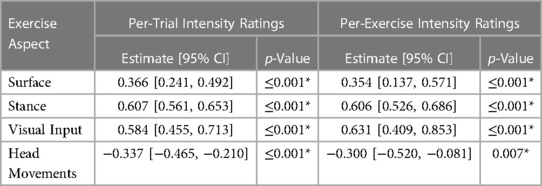
Table 2. Linear relationship between per-trial and per-exercise PT ratings and aspects of exercise difficulty. * denotes significance (p < 0.05).
3.2. Comparison of balance participant intensity self-ratings to physical therapist intensity ratings
The per-exercise self-ratings were significantly correlated with the PT ratings [r = 0.769, 95% CI = (0.735, 0.799), p ≤ 0.001].
As shown in Figure 3, self-ratings agreed with PT ratings most often for ratings of a 5 (per-trial and per-exercise self-ratings of a 5 agreed with PT ratings 74.8% and 77.5% of the time, respectively). Self-ratings of a 4 also most often corresponded to a PT rating of a 5 (per-trial: 63.0%, per-exercise: 47.5% for self-ratings of a 4) while self-ratings of a 3 corresponded to various PT ratings, and self-ratings of a 2 or 1 most often corresponded to PT ratings between 1 and 3.
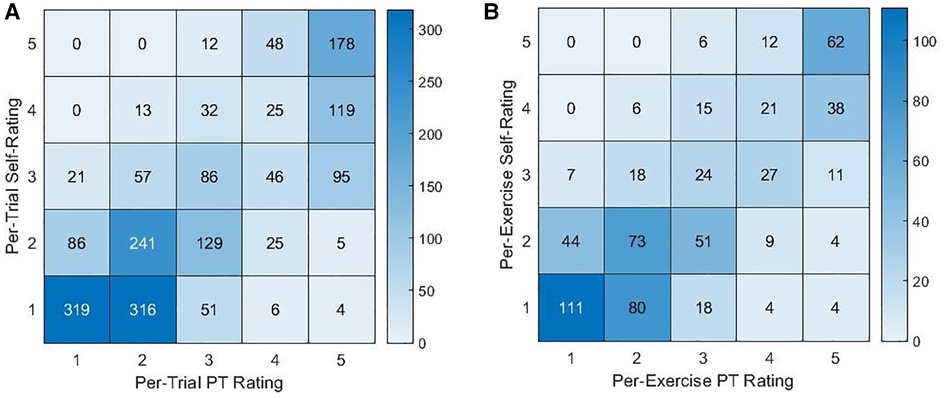
Figure 3. Contingency tables for the counts of PT ratings and (A) per-trial or (B) per-exercise self-ratings.
However, the per-trial and per-exercise self-ratings were lower than the PT ratings [absolute per-trial rating difference: 0.385, per-exercise: 0.314, 95% CI = (0.048, 0.581), p = 0.021]. Additionally, the standard deviations of the difference in per-trial or per-exercise ratings were 0.920 and 0.961 [0.910, 1.015], respectively. Self-ratings exhibited a smaller variance between trials of the same exercise than the PT ratings did [0.102, 95% CI = (0.049, 0.154), p < 0.001].
As a result, when using self-ratings to linearly predict per-trial or per-exercise PT ratings, the accuracies were 46.6% and 45.9%, respectively.
3.3. Comparison of kinematic measures to physical therapist intensity ratings
The kinematic features were significantly correlated with PT ratings (see Table 3). When using all kinematic features together to predict PT ratings, the resulting predictions were significantly correlated with per-trial or per-exercise PT ratings (per-trial: r = 0.698, 95% CI = [0.675, 0.721], p ≤ 0.001; per-exercise: r = 0.826, 95% CI = [0.799, 0.850], p ≤ 0.001) and agreed with the PT ratings 43.0% and 52.4% of the time, respectively. As shown in Figure 4, kinematics-predicted per-exercise ratings agreed with PT ratings most often for ratings of a 5 (kinematics-predicted ratings of a 5 agreed with PT ratings 92.7% of the time). Kinematics-predicted per-exercise ratings of a 4 also most often corresponded to a PT rating of a 5 (42.0% for kinematics-predicted ratings of a 4) but also often corresponded to a 4 (39.1% for kinematics-predicted ratings of a 4). Kinematics-predicted ratings of a 3 corresponded to various PT ratings, and self-ratings of a 2 or 1 most often corresponded to PT ratings of a 2 or 1.
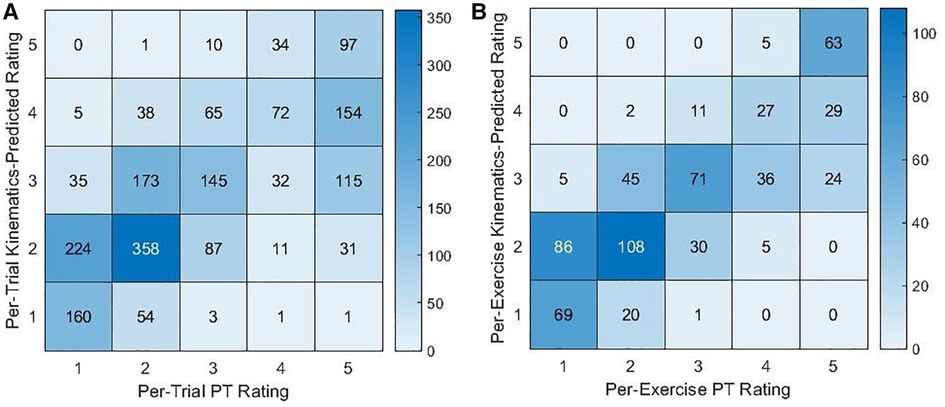
Figure 4. Contingency tables for the counts of PT ratings and (A) per-trial or (B) per-exercise kinematics-predicted ratings.
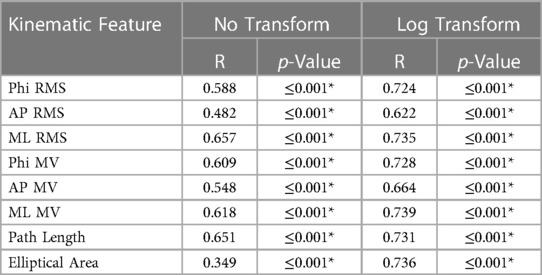
Table 3. Correlation coefficients between kinematic features and per-trial PT ratings. RMS denotes root mean square, and MV denotes mean velocity. * denotes significance (p < 0.05).
4. Discussion
4.1. Evaluation of physical therapist participant intensity ratings
The per-trial and per-exercise PT ratings were of good inter-rater reliability, supporting that the study results may be replicable and that it would be possible for the alternative assessments to accurately predict PT ratings. Higher ratings were also associated with higher exercise difficulty along three out of four dimensions (57) when accounting for differing individual balance participant, suggesting that the ratings do reflect task intensity. While higher ratings were not associated with more difficult head movement conditions, this could be due to the majority of balance participants having no vestibular dysfunction and consequently being less affected by head movement. Similarly, Alsubaie et al. and Anson et al. reported significant associations between balance exercise difficulty and self-ratings of exercise intensity or postural stability (5, 53).
However, it is important to note that while the descriptors for PT ratings 1, 2, and 3 referenced amount of sway, prior research has reported variable sway results for people with balance impairments (e.g., sometimes increased sway, sometimes decreased sway) (87–90). Increased sway may be interpreted as poorer control over the body's position while decreased sway may reflect an adaptive strategy in which people stiffen in order to simplify the balance task by reducing the degrees of freedom of movement (91). As a result, future work may investigate alternative scale descriptors.
4.2. Comparison of balance participant intensity self-ratings to physical therapist intensity ratings
While the self-ratings were strongly correlated with the PT ratings, the self-ratings were an imperfect approximation of PT ratings. As has been described by the Dunning-Kruger effect and reported in other contexts (92–94), balance participants overestimated the quality of their performance, self-rating the exercise as less intense than the ratings provided by the PT participants. Accounting for this offset may therefore improve the agreement between PT and self-ratings. However, the significant standard deviation in the rating difference suggests that a simple adjustment is inadequate when using self-ratings as a support to PT assessment. The standard deviation in rating difference may partially be driven by the lower variation in self-ratings between the three trials of an exercise compared to the PT's ratings. This may reflect differences in rating strategy such as the balance participants more heavily considering their performance of prior trials when rating the current trial. The variation in rating difference may also be due to differences in participants' determinations of what constituted a loss of balance, imperfect observations of the performance (e.g., a PT participant not seeing or a balancer participant not noticing movement of the feet), imperfect recollection of the performance when providing the rating, or accidental misuse of the scale (e.g., selection of a 1 when intending to select a 5). These factors likely played some role as is reflected in imperfect agreement for ratings of 4 or 5 and occasional confusion between ratings of 1 and 5 (see Figure 3).
As a result of these differences, predicted PT ratings based on self-ratings exhibited moderately low accuracy. The common confusion between ratings of a 4 or a 5 as well as between ratings of a 1 or a 2 and the overall ambiguity for ratings of a 3 might suggest that balance participants are better able to distinguish between two levels of balance intensity (e.g., higher-lower). The confusion between ratings of 1, 2, or 3 may also reflect the aforementioned scale limitation in which the PT's descriptors reference sway, which may indicate either good or poor balance. As a result of these issues, if using self-ratings to support intensity assessment during telehealth or other contexts in which traditional PT assessment might be difficult, self-ratings might be used to suggest higher or lower intensity but may not suggest more granular levels of intensity.
4.3. Comparison of kinematic measures to physical therapist intensity ratings
The kinematics-predicted intensity ratings were also imperfect yet informative approximations of PT ratings, as reflected by strong correlations, but moderately low prediction accuracies. The correlations between kinematic features and per-trial PT ratings were higher in the ML direction than in either AP or Phi directions, suggesting that, on average, PT participants based their evaluation of balance intensity more heavily upon movement in the ML direction. Similar correlation values as well as higher correlations in the ML direction were also reported by Alsubaie et al. in two investigations of intensity self-ratings (R between 0.56 and 0.88) (53, 56). The correlation coefficients were slightly higher when using the logarithm of the kinematic feature compared to the untransformed values, especially so for EA. Higher correlation between ratings and the logarithm of a kinematic feature than with the original measure were also reported by Alsubaie et al. regarding intensity self-ratings and by Scieppati et al. and Anson et al. regarding postural stability self-ratings (5, 53, 85).
Agreement between kinematics-predicted intensity ratings and PT ratings was higher than for self-ratings, resulting in especially high rates of agreement for kinematics-predicted ratings of a 5. If using kinematics to support PT assessments during telehealth or other applications, kinematics may be more heavily considered during high-intensity exercises with ratings near a 5 or for low-intensity exercises with ratings of a 1 or 2.
In this first and necessary study on the differences between alternative modes of balance intensity assessment, both self-ratings and sway kinematics were shown to have the potential to support PT assessment of balance exercise intensity when expert visual assessment is difficult or limited, with sway kinematics being more accurate than self-ratings. Intensity assessments might be used in conjunction with frameworks for exercise progression such as the one proposed by Klatt et al. so that balance training can be remotely assessed and progressed over time (57). However, the results from this study suggest that self-ratings and conventional trunk kinematic measures cannot fully replicate or substitute for PT assessments. Based on our findings, PTs might employ self-ratings and/or sway kinematic measures to supplement their partial visual assessments during telerehabilitation or home-based training. If doing so, our preliminary results suggest that the PT should consider self-ratings as indications of high versus low intensity rather than five levels, and kinematic measurements should be more heavily considered during exercises at intensity extremes (e.g., very high or very low). Combining self-ratings of intensity with kinematic measures as well as employing more complex techniques may also lead to more accurate predictions, as reported by Bao et al. and Kamran et al. (50, 51). Further exploration of related machine learning architectures and expanded datasets might further improve the prediction accuracy.
Limitations of this study included the performance of a subset of balance exercises (i.e., static standing) and a subset of balance participants that would benefit from balance training (i.e., older adults and adults with vestibular disorders). Future work could include the exploration of alternate scale descriptors without reference to amount of sway, evaluation of additional balance-related pathologies and balance exercises, evaluation of the effects of PT experience level, analysis of full-body kinematics, and the use of data science methodologies such as machine learning approaches to capture additional trends in the kinematic data.
5. Summary
This study examined the relationship between PT intensity ratings, self-assessments, and kinematic measures. Both self-ratings and trunk kinematic features correlated significantly with PT ratings of intensity. Based on the findings from this study, self-ratings may better distinguish between two levels of intensity (i.e., higher-lower) than five levels of intensity. Furthermore, kinematics-predicted intensity ratings at either extreme (i.e., 1: steady or 5: loss of balance) may be more reliable indicators of intensity than the other ratings in the evaluated scale. These findings suggest that self-assessments and kinematic measurements may support PT intensity assessments during contexts in which visual assessment is difficult (e.g., during telerehabilitation).
Data availability statement
The raw data supporting the conclusions of this article will be made available by the authors, without undue reservation.
Ethics statement
This study involved human participants and it was reviewed and approved by a University of Michigan Institutional Review Board (HUM00086479). The participants provided their written informed consent to participate in this study.
Author contributions
JF: developed the statistical plan, conducted the analysis, performed interpretation, and drafted the manuscript. JZ: participated in experimental design, recruited participants, collected data, and performed a preliminary analysis. WC: participated in experimental design and recruited participants. KS: oversaw the project, participated in experimental design, data analysis and interpretation, and writing of the manuscript. All authors contributed to the article and approved the submitted version.
Funding
This material is based upon work supported by the National Science Foundation under Grant No. 2125256 and the University of Michigan College of Engineering Miller Faculty Scholarship.
Acknowledgments
The authors thank the participants of the study for their contributions, Kerby Shedden at the University of Michigan Center for Statistical Consultation and Research for support of the statistical analysis, Noel C. Perkins for his support of the data analysis, and Safa Jabri for her assistance with producing figures.
Conflict of interest
The authors declare that the research was conducted in the absence of any commercial or financial relationships that could be construed as a potential conflict of interest.
Publisher's note
All claims expressed in this article are solely those of the authors and do not necessarily represent those of their affiliated organizations, or those of the publisher, the editors and the reviewers. Any product that may be evaluated in this article, or claim that may be made by its manufacturer, is not guaranteed or endorsed by the publisher.
References
1. Vereeck L, Wuyts F, Truijen S, Van De Heyning P. Clinical assessment of balance: normative data, and gender and age effects. Int J Audiol. (2008) 47(2):67–75. doi: 10.1080/14992020701689688
2. Drew JAR, Xu D. Trends in fatal and nonfatal injuries among older Americans, 2004–2017. Am J Prev Med. (2020) 59(1):3–11. doi: 10.1016/j.amepre.2020.01.008
3. Zijlstra GAR, van Haastregt JCM, van Eijk JTM, van Rossum E, Stalenhoef PA, Kempen GIJM. Prevalence and correlates of fear of falling, and associated avoidance of activity in the general population of community-living older people. Age Ageing. (2007) 36(3):304–9. doi: 10.1093/ageing/afm021
5. Anson E, Studenski S, Sparto PJ, Agrawal Y. Community-dwelling adults with a history of falling report lower perceived postural stability during a foam eyes closed test than non-fallers. Exp Brain Res. (2019) 237(3):769–76. doi: 10.1007/s00221-018-5458-1
6. Sturnieks DL, St George R, Lord SR. Balance disorders in the elderly. Neurophysiol Clin. (2008) 38(6):467–78. doi: 10.1016/j.neucli.2008.09.001
7. Agrawal Y, Carey JP, Della Santina CC, Schubert MC, Minor LB. Disorders of balance and vestibular function in US adults. Arch Intern Med. (2009) 169(10):938. doi: 10.1001/archinternmed.2009.66
8. Dunlap PM, Holmberg JM, Whitney SL. Vestibular rehabilitation: advances in peripheral and central vestibular disorders. Curr Opin Neurol. (2019) 32(1):137–44. doi: 10.1097/WCO.0000000000000632
9. Soyuer F, Mirza M, Erkorkmaz Ü. Balance performance in three forms of multiple sclerosis. Neurol Res. (2006) 28(5):555–62. doi: 10.1179/016164105X49373
10. Gunn H, Markevics S, Haas B, Marsden J, Freeman J. Systematic review: the effectiveness of interventions to reduce falls and improve balance in adults with multiple sclerosis. Arch Phys Med Rehabil. (2015) 96(10):1898–912. doi: 10.1016/j.apmr.2015.05.018
11. Cameron MH, Nilsagard Y. Balance, gait, and falls in multiple sclerosis. Handb Clin Neurol. (2018) 159:237–50. doi: 10.1016/B978-0-444-63916-5.00015-X
12. Lendraitienė E, Tamošauskaitė A, Petruševičienė D, Savickas R. Balance evaluation techniques and physical therapy in post-stroke patients: a literature review. Neurol Neurochir Pol. (2017) 51(1):92–100. doi: 10.1016/j.pjnns.2016.11.003
13. Bland DC, Zampieri C, Damiano DL. Effectiveness of physical therapy for improving gait and balance in individuals with traumatic brain injury: a systematic review. Brain Inj. (2011) 25(7–8):664–79. doi: 10.3109/02699052.2011.576306
14. Harrell RG, Manetta CJ, Gorgacz MP. Dizziness and balance disorders in a traumatic brain injury population: current clinical approaches. Curr Phys Med Rehabil Reports. (2021) 9(2):41–6. doi: 10.1007/s40141-021-00308-5
15. Park JH, Kang YJ, Horak FB. What is wrong with balance in Parkinson's Disease? J Mov Disord. (2015) 8(3):109–14. doi: 10.14802/jmd.15018
16. Rinalduzzi S, Trompetto C, Marinelli L, Alibardi A, Missori P, Fattapposta F, et al. Balance dysfunction in Parkinson's Disease. Biomed Res Int. (2015) 2015. doi: 10.1155/2015/434683
17. Hadjistavropoulos T, Delbaere K, Fitzgerald TD. Reconceptualizing the role of fear of falling and balance confidence in fall risk. J Aging Health. (2011) 23(1):3–23. doi: 10.1177/0898264310378039
18. Landers MR, Oscar S, Sasaoka J, Vaughn K. Balance confidence and fear of falling avoidance behavior are most predictive of falling in older adults: prospective analysis. Phys Ther. (2016) 96(4):433–42. doi: 10.2522/ptj.20150184
19. Hughes CC, Kneebone II, Jones F, Brady B, Pachana NA, Oude Voshaar RC. A theoretical and empirical review of psychological factors associated with falls-related psychological concerns in community-dwelling older people. Int Psychogeriatrics. (2015) 27(7):1071–87. doi: 10.1017/S1041610214002701
20. Hull SL, Kneebone II, Farquharson L. Anxiety, depression, and fall-related psychological concerns in community-dwelling older people. Am J Geriatr Psychiatry. (2013) 21(12):1287–91. doi: 10.1016/j.jagp.2013.01.038
21. Denkinger MD, Lukas A, Nikolaus T, Hauer K. Factors associated with fear of falling and associated activity restriction in community-dwelling older adults: a systematic review. Am J Geriatr Psychiatry. (2015) 23(1):72–86. doi: 10.1016/j.jagp.2014.03.002
22. Cumming RG, Salkeld G, Thomas M, Szonyi G. Prospective study of the impact of fear of falling on activities of daily living, SF-36 scores, and nursing home admission. J Gerontol Med Sci. (2000) 55A(5):299–305. doi: 10.1093/gerona/55.5.M299
23. Arfken CL, Lach HW, Birge SJ, Miller JP. The prevalence and correlates of fear of falling in elderly persons living in the community. Am J Public Health. (1994) 84(4):565–70. doi: 10.2105/AJPH.84.4.565
24. Howland J, Peterson EW, Levin WC, Fried L, Pordon D, Bak S. Fear of falling among the community-dwelling elderly. J Aging Health. (1993) 5(2):229–43. doi: 10.1177/089826439300500205
25. Lesinski M, Hortobágyi T, Muehlbauer T, Gollhofer A, Granacher U. Effects of balance training on balance performance in healthy older adults: a systematic review and meta-analysis. Sport Med. (2015) 45(12):1721–38. doi: 10.1007/s40279-015-0375-y
26. Kümmel J, Kramer A, Giboin LS, Gruber M. Specificity of balance training in healthy individuals: a systematic review and meta-analysis. Sport Med. (2016) 46(9):1261–71. doi: 10.1007/s40279-016-0515-z
27. Burzynski J, Sulway S, Rutka JA. Vestibular rehabilitation: review of indications, treatments, advances, and limitations. Curr Otorhinolaryngol Rep. (2017) 5(3):160–6. doi: 10.1007/s40136-017-0157-1
28. Farlie MK, Molloy E, Keating JL, Haines TP. Clinical markers of the intensity of balance challenge: observational study of older adult responses to balance tasks. Phys Ther. (2016) 96(3):313–23. doi: 10.2522/ptj.20140524
29. Farlie MK, Robins L, Keating JL, Molloy E, Haines TP. Intensity of challenge to the balance system is not reported in the prescription of balance exercises in randomised trials: a systematic review. J Physiother. (2013) 59(4):227–35. doi: 10.1016/S1836-9553(13)70199-1
30. Reinthal A. Getting the dosage right in balance exercise prescription: the intensity problem. J Nov Physiother. (2017) 7:e147. doi: 10.4172/2165-7025.1000e147
31. Espy D, Reinthal A, Meisel S. Intensity of balance task intensity, as measured by the rate of perceived stability, is independent of physical exertion as measured by heart rate. J Nov Physiother. (2017) 7(S4):343. doi: 10.4172/2165-7025.1000343
32. Pescatello LS, American College of Sports Medicine. ACSM's guidelines for exercise testing and prescription. 9th ed. Philadelphia: Wolters Kluwer/Lippincott Williams & Wilkins Health (2014).
33. McGinnis PQ, Hack LM, Nixon-Cave K, Michlovitz SL. Factors that influence the clincal decision making of physical therapists in choosing a balance assessment approach. Phys Ther. (2009) 89(3):233–47. doi: 10.2522/ptj.20080131
34. Wainwright SF, Shepard KF, Harman LB. Factors that influence the clinical decision making of novice and experienced physical therapists. Phys Ther. (2011) 91(1):87–101. doi: 10.2522/ptj.20100161
35. Jesus TS, Landry MD, Dussault G, Fronteira I. Human resources for health (and rehabilitation): six rehab-workforce challenges for the century. Hum Resour Health. (2017) 15(1):1–12. doi: 10.1186/s12960-017-0182-7
36. Horsley S, Schock G, Grona SL, Montieth K, Mowat B, Stasiuk K, et al. Use of real-time videoconferencing to deliver physical therapy services: a scoping review of published and emerging evidence. J Telemed Telecare. (2020) 26(10):581–9. doi: 10.1177/1357633X19854647
37. Harrell RG, Schubert MC, Oxborough S, Whitney SL. Vestibular rehabilitation telehealth during the SAEA-CoV-2 (COVID-19) pandemic. Front Neurol. (2022) 12(January):1–12. doi: 10.3389/fneur.2021.781482
38. Signal N, Martin T, Leys A, Maloney R, Bright F. Implementation of telerehabilitation in response to COVID-19: lessons learnt from neurorehabilitation clinical practice and education. New Zeal J Physiother. (2020) 48(3):117–26. doi: 10.15619/NZJP/48.3.03
39. Buabbas AJ, Albahrouh SE, Alrowayeh HN, Alshawaf H. Telerehabilitation during the COVID-19 pandemic: patients and physical Therapists’ experiences. Med Princ Pract. (2022) 31(2):156–64. doi: 10.1159/000523775
40. Werneke MW, Deutscher D, Grigsby D, Tucker CA, Mioduski JE, Hayes D. Telerehabilitation during the COVID-19 pandemic in outpatient rehabilitation settings: a descriptive study. Phys Ther. (2021) 101(7):1–11. doi: 10.1093/ptj/pzab110
41. Zimbelman JL, Juraschek SP, Zhang X, Lin VWH. Physical therapy workforce in the United States: forecasting nationwide shortages. PM R. (2010) 2(11):1021–9. doi: 10.1016/j.pmrj.2010.06.015
42. Zhang X, Lin D, Pforsich H, Lin VW. Physician workforce in the United States of America: forecasting nationwide shortages. Hum Resour Health. (2020) 18(1):1–9. doi: 10.1186/s12960-020-0448-3
43. Landry MD, Hack LM, Coulson E, Freburger J, Johnson MP, Katz R, et al. Workforce projections 2010–2020: annual supply and demand forecasting models for physical therapists across the United States. Phys Ther. (2016) 96(1):71–80. doi: 10.2522/ptj.20150010
44. Jesus TS, Koh G, Landry M, Ong PH, Lopes AMF, Green PL, et al. Finding the “right-size” physical therapy workforce: international perspective across 4 countries. Phys Ther. (2016) 96(10):1597–609. doi: 10.2522/ptj.20160014
45. Conradie T, Berner K, Louw Q. Rehabilitation workforce descriptors: a scoping review. BMC Health Serv Res. (2022) 22(1):1–14. doi: 10.1186/s12913-022-08531-z
46. Saaei F, Klappa SG. Rethinking telerehabilitation: attitudes of physical therapists and patients. J Patient Exp. (2021) 8:1–7. doi: 10.1177/23743735211034335
47. Lacroix A, Hortobágyi T, Beurskens R, Granacher U. Effects of supervised vs. Unsupervised training programs on balance and muscle strength in older adults: a systematic review and meta-analysis. Sport Med. (2017) 47(11):2341–61. doi: 10.1007/s40279-017-0747-6
48. Sherrington C, Fairhall N, Wallbank G, Tiedemann A, Michaleff ZA, Howard K, et al. Exercise for preventing falls in older people living in the community: an abridged cochrane systematic review. Br J Sports Med. (2020) 54(15):885–91. doi: 10.1136/bjsports-2019-101512
49. Halvorsen S, Vøllestad NK, Fongen C, Provan SA, Semb AG, Hagen KB, et al. Physical fitness in patients with ankylosing spondylitis: comparison with population controls. Phys Ther. (2012) 92(2):298–309. doi: 10.2522/ptj.20110137
50. Bao T, Klatt BN, Whitney SL, Sienko KH, Wiens J. Automatically evaluating balance: a machine learning approach. IEEE Trans Neural Syst Rehabil Eng. (2019) 27(2):179–86. doi: 10.1109/TNSRE.2019.2891000
51. Kamran F, Harrold K, Zwier J, Carender W, Bao T, Sienko K, et al. Automatically evaluating balance using machine learning and data from a single inertial measurement unit. J Neuroeng Rehabil. (2021) 18:114. doi: 10.1186/s12984-021-00894-4
52. Bao T, Carender WJ, Kinnaird C, Barone VJ, Peethambaran G, Whitney SL, et al. Effects of long-term balance training with vibrotactile sensory augmentation among community-dwelling healthy older adults: a randomized preliminary study. J Neuroeng Rehabil. (2018) 15(1):1–13. doi: 10.1186/s12984-017-0339-6
53. Alsubaie SF, Whitney SL, Furman JM, Marchetti GF, Sienko KH, Klatt BN, et al. Reliability and validity of ratings of perceived difficulty during performance of static standing balance exercises. J Phys Ther. (2019) 99(10):1381–93. doi: 10.1093/ptj/pzz091
54. Browne J, O’Hare N, O’Hare G, Finn A, Colin J. Clinical assessment of the quantitative posturography system. Physiotherapy. (2002) 88(4):217–23. doi: 10.1016/S0031-9406(05)60413-0
55. Browne JE, O’Hare NJ. Review of the different methods for assessing standing balance. Physiotherapy. (2001) 87(9):489–95. doi: 10.1016/S0031-9406(05)60696-7
56. Alsubaie SF, Whitney SL, Furman JM, Marchetti GF, Sienko KH, Sparto PJ. Rating of perceived difficulty scale for measuring intensity of standing balance exercises in individuals with vestibular disorders. J Vestib Res. (2022) 32(6):529–40. doi: 10.3233/VES-210146
57. Klatt BN, Carender WJ, Lin CC, Alsubaie SF, Kinnaird CR, Sienko KH, et al. A conceptual framework for the progression of balance exercises in persons with balance and vestibular disorders. Phys Med Rehabil Int. (2015) 2(4):1044.27489886
58. Borg GAV. Psychophysical bases of perceived exertion. Med Sci Sports Exerc. (1982) 14(5):377–81. doi: 10.1249/00005768-198205000-00012
59. Robertson RJ, Goss FL, Rutkowski J, Lenz B, Dixon C, Timmer J, et al. Concurrent validation of the OMNI perceived exertion scale for resistance exercise. Med Sci Sports Exerc. (2003) 35(2):333–41. doi: 10.1249/01.MSS.0000048831.15016.2A
60. Lagally KM, Robertson RJ. Construct validity of the OMNI resistance exercise scale. J Strength Cond Res. (2006) 20(2):252–6. doi: 10.1519/R-17224.1
61. Shenoy A, Peng TH, Todd RM, Eng JJ, Silverberg ND, Tembo T, et al. Rate of perceived stability as a measure of balance exercise intensity in people post-stroke. Disabil Rehabil. (2022) 44(26):8480–6. doi: 10.1080/09638288.2021.2022777
62. Farlie MK, Keating JL, Molloy E, Bowles KA, Neave B, Yamin J, et al. The balance intensity scales for therapists and exercisers measure balance exercise intensity in older adults: initial validation using rasch analysis. Phys Ther. (2019) 99(10):1394–404. doi: 10.1093/ptj/pzz092
63. Wong CK. Interrater reliability of the berg balance scale when used by clinicians of various experience levels to assess people with lower limb amputations. Phys Ther. (2014) 94(3):371–8. doi: 10.2522/ptj.20130182
64. Krebs DE, Edelstein JE, Fishman S. Reliability of observational kinematic gait analysis. Phys Ther. (1985) 7(1):1027–33. doi: 10.1093/ptj/65.7.1027
65. Choi YM, Dobson F, Martin J, Bennell KL, Hinman RS. Interrater and intrarater reliability of common clinical standing balance tests for people with hip osteoarthritis. Phys Ther. (2014) 94(5):696–704. doi: 10.2522/ptj.20130266
66. Stratford PW, Kennedy DM. A comparison study of KOOS-PS and KOOS function and sport scores. Phys Ther. (2014) 94(11):1614–21. doi: 10.2522/ptj.20140086
67. Johnson DR, Creech JC. Ordinal measures in multiple indicator models : a simulation study of categorization error. Am Sociol Rev. (1983) 48:398–407. doi: 10.2307/2095231
68. Norris CM, Ghali WA, Saunders LD, Brant R, Galbraith D, Faris P, et al. Ordinal regression model and the linear regression model were superior to the logistic regression models. J Clin Epidemiol. (2006) 59:448–56. doi: 10.1016/j.jclinepi.2005.09.007
69. Norman G. Likert Scales, levels of measurement and the “laws” of statistics. Adv Heal Sci Educ. (2010) 15:625–32. doi: 10.1007/s10459-010-9222-y
70. Rhemtulla M, Brosseau-Liard PÉ, Savalei V. When can categorical variables be treated as continuous? A comparison of robust continuous and categorical SEM estimation methods under suboptimal conditions. Psychol Methods. (2012) 17(3):354–73. doi: 10.1037/a0029315
71. Robitzsch A. Why ordinal variables can (almost) always be treated as continuous variables: clarifying assumptions of robust continuous and ordinal factor analysis estimation methods. Front Educ. (2020) 5:589965. doi: 10.3389/feduc.2020.589965
72. Cook DA, Beckman TJ. Current concepts in validity and reliability for psychometric instruments: theory and application. Am J Med. (2006) 119:166.e7–166.e16. doi: 10.1016/j.amjmed.2005.10.036
73. Jeyaraman MM, Al-Yousif N, Robson RC, Copstein L, Balijepalli C, Hofer K, et al. Inter-rater reliability and validity of risk of bias instrument for non-randomized studies of exposures: a study protocol. Syst Rev. (2020) 9(1):32. doi: 10.1186/s13643-020-01291-z
74. Mchugh ML. Interrater reliability: the kappa statistic. Biochem Medica. (2012) 22(3):276–82. doi: 10.11613/BM.2012.031
75. Asendorpf JB, Conner M, De Fruyt F, De Houwer J, Denissen JJA, Fiedler K, et al. Recommendations for increasing replicability in psychology. Eur J Pers. (2013) 27(2):108–19. doi: 10.1002/per.1919
76. Hallgren KA. Computing inter-rater reliability for observational data: an overview and tutorial. Tutor Quant Methods Psychol. (2012) 8(1):23–34. doi: 10.20982/tqmp.08.1.p023
77. Liljequist D, Elfving B, Roaldsen KS. Intraclass correlation—a discussion and demonstration of basic features. PLoS One. (2019) 14(7):e0219854. doi: 10.1371/journal.pone.0219854
78. Koo TK, Li MY. A guideline of selecting and reporting intraclass correlation coefficients for reliability research. J Chiropr Med. (2016) 15(2):155–63. doi: 10.1016/j.jcm.2016.02.012
79. Prieto TE, Myklebust JB, Hoffmann RG, Lovett EG, Myklebust BM. Measures of postural steadiness: differences between healthy young and elderly adults. IEEE Trans Biomed Eng. (1996) 43(9):956–66. doi: 10.1109/10.532130
80. Dozza M, Chiari L, Chan B, Rocchi L, Horak FB, Cappello A. Influence of a portable audio-biofeedback device on structural properties of postural sway. J Neuroeng Rehabil. (2005) 2(13). doi: 10.1186/1743-0003-2-13
81. Chiari L, Dozza M, Cappello A, Horak FB, Macellari V, Giansanti D. Audio-Biofeedback for balance improvement: an accelerometry-based system. Audio. (2005) 52(12):2108–11. doi: 10.1109/TBME.2005.857673
82. Sienko KH, Balkwill MD, Oddsson LIE, Wall C. Effects of multi-directional vibrotactile feedback on vestibular-deficient postural performance during continuous multi-directional support surface perturbations. J Vestib Res Equilib Orientat. (2008) 18(5–6):273–85. doi: 10.3233/ves-2008-185-604
83. Huffman JL, Norton LE, Adkin AL, Allum JHJ. Directional effects of biofeedback on trunk sway during stance tasks in healthy young adults. Gait Posture. (2010) 32(1):62–6. doi: 10.1016/j.gaitpost.2010.03.009
84. O’brien MK, Hidalgo-Araya MD, Mummidisetty CK, Vallery H, Ghaffari R, Rogers JA, et al. Augmenting clinical outcome measures of gait and balance with a single inertial sensor in age-ranged healthy adults. Sensors. (2019) 19(20):1–28. doi: 10.3390/s19204537
85. Schieppati M, Tacchini E, Nardone A, Tarantola J, Corna S. Subjective perception of body sway. J Neurol Neurosurg Psychiatry. (1999) 66(3):313–22. doi: 10.1136/jnnp.66.3.313
86. Nakagawa S, Schielzeth H. A general and simple method for obtaining R2 from generalized linear mixed-effects models. Methods Ecol Evol. (2013) 4:133–42. doi: 10.1111/j.2041-210x.2012.00261.x
87. Horak FB, Shupert CL, Mirka A. Components of postural dyscontrol in the elderly: a review. Neurobiol Aging. (1989) 10(6):727–38. doi: 10.1016/0197-4580(89)90010-9
88. Carpenter MG, Frank JS, Silcher CP. Surface height effects on postural control: a hypothesis for a stiffness strategy for stance. J Vestib Res Equilib Orientat. (1999) 9(4):277–86. doi: 10.3233/ves-1999-9405
89. Adkin AL, Frank JS, Carpenter MG, Peysar GW. Postural control is scaled to level of postural threat. Gait Posture. (2000) 12(2):87–93. doi: 10.1016/S0966-6362(00)00057-6
90. Melzer I, Benjuya N, Kaplanski J. Age-related changes of postural control: effect of cognitive tasks. Gerontology. (2001) 47(4):189–94. doi: 10.1159/000052797
91. Allum JHJ, Carpenter MG, Honegger F, Adkin AL, Bloem BR. Age-dependent variations in the directional sensitivity of balance corrections and compensatory arm movements in man. J Physiol. (2002) 542(2):643–63. doi: 10.1113/jphysiol.2001.015644
92. Guillory JJ, Blankson AN. Using recently acquired knowledge to self-assess understanding in the classroom. Scholarsh Teach Learn Psychol. (2017) 3(2):77–89. doi: 10.1037/stl0000079
93. Srikumaran D, Tian J, Ramulu P, Boland MV, Woreta F, Wang KM, et al. Ability of ophthalmology residents to self-assess their performance through established milestones. J Surg Educ. (2019) 76(4):1076–87. doi: 10.1016/j.jsurg.2018.12.004
Keywords: balance, balance training, intensity, self-assessment, IMU, wearable sensors
Citation: Ferris J, Zwier J, Carender WJ and Sienko KH (2023) Differences between physical therapist ratings, self-ratings, and posturographic measures when assessing static balance exercise intensity. Front. Rehabil. Sci. 4:1096171. doi: 10.3389/fresc.2023.1096171
Received: 11 November 2022; Accepted: 22 March 2023;
Published: 11 May 2023.
Edited by:
Jack Jiaqi Zhang, Hong Kong Polytechnic University, Hong Kong, SAR ChinaReviewed by:
Serene Paul, The University of Sydney, AustraliaArthur Sá Ferreira, University Center Augusto Motta, Brazil
Roger Adams, University of Canberra, Australia
© 2023 Ferris, Zwier, Carender and Sienko. This is an open-access article distributed under the terms of the Creative Commons Attribution License (CC BY). The use, distribution or reproduction in other forums is permitted, provided the original author(s) and the copyright owner(s) are credited and that the original publication in this journal is cited, in accordance with accepted academic practice. No use, distribution or reproduction is permitted which does not comply with these terms.
*Correspondence: Kathleen H. Sienko c2llbmtvQHVtaWNoLmVkdQ==
Specialty Section: This article was submitted to Interventions for Rehabilitation, a section of the journal Frontiers in Rehabilitation Sciences