 Ali Cheshmehzangi
 Saeid Pourroostaei Ardakani
- 1Department of Architecture and Built Environment, The University of Nottingham Ningbo, Ningbo, China
- 2The Network for Education and Research on Peace and Sustainability (NERPS), Hiroshima University, Hiroshima, Japan
- 3School of Computer Sciences, The University of Nottingham Ningbo, Ningbo, China
This paper studies the important factor of sector-based time variable, which is critical to urban mobility patterns in an urban environment. In particular, this study analyzes urban traffic optimization based on modeling analysis of a simulated urban environment. In doing so, we develop and assess the urban traffic model based on three key components of agents, urban map, and mobility pattern. We develop an urban sample based on a medium-to-large city in China, which is represented by Manhattan grid pattern layout. By developing a homogeneous urban layout, we distribute the urban blocks of various sectors across the sample model. Through simulation studies, we model urban traffic based on “conventional operation hours” and “proposed operation hours” of all sectors. This urban traffic model is used to study the impact of the proposed approach on urban traffic based on two measured metrics of end-to-end delay (ETE) and Agent queue count (AQC). By suggesting a new sector-based time variable, we then evaluate the urban traffic model based on multiple active agent ratio. The findings from this simulation uncover the importance of sector-based time variable in optimizing urban traffic.
Highlights
- This paper studies the important factor of sector-based time variable for urban traffic analysis and optimization through computational modeling and scenario analysis of multiple active agent ratio;
- This study analyzes urban traffic optimization based on modeling analysis of a simulated urban environment;
- This study proposes urban traffic optimization based on two measured metrics of end-to-end delay (ETE) and Agent queue count (AQC);
- The findings from this simulation uncover the importance of sector-based time variable in optimizing urban traffic.
Introduction
Globally, urban traffic is recognized as one of the main challenges of cities and city environments. But equally, both globally and locally, our cities need urban transportation systems. However, this specific need has many challenges of its own (Rodrigue, 2020), which also affects cities and other urban systems of cities. With the expansion of cities and the increase of urban development, cities face intensified urban traffic issues. Some of these issues are occurred due to rapid urban transformation (Zeng et al., 2019), and some are due to low-quality infrastructure, inconsistent urban planning approaches, or poor management of traffic controls. Hence, we can argue urban traffic is somehow seen as a by-product of the urbanization process, often tangled with the overarching factors of urban change, land-use change, and urban redevelopment. Examples of these are changes in urban layouts or densities, such as from low-rise to high-rise transformation (Cheshmehzangi, 2018), or changes in land uses through modes of urban redevelopment, infill development, etc. The nexus between such changes and growing urban traffic is seen in many contexts, which could ultimately lead to optimization of urban land use allocation from multiple perspectives, location-based information or networked-based location sensing (Campbell et al., 2006), mobility sensing (Hemminki et al., 2013), space-time analysis (Pan and Lai, 2019), spatial simulation (Silveira and Dentinho, 2018), etc.
In urban planning and design, the knowledge that could be gained from such analyses could lead to integrated solutions (Cheshmehzangi, 2016) or optimized models of urban systems, urban operations, and urban management. Hence, optimizing urban traffic could help us to overcome some of the main challenges associated with urban transportation. In doing so, the aim is to see how such optimization could be achieved through specific methods or examples of modeling and simulation. This study, however, is not an exact optimization through mathematical modelings, such as PageRank model, algorithm-based model, decomposition model, stochastic traffic model, etc. Instead, the results obtained here help to optimize urban traffic flow based on the sector-based time variable through computational modeling of a simulated case, which is not done before. This approach enables us to consider temporal and spatial factors as part of urban mobility modeling through applicable computational techniques. In this regard, the findings indicate a qualitative indication of the goodness of the solution, which could also be tested and quantitatively assessed in future research.
Furthermore, we see growing attention, as well as growing demand, to study how urban traffic is optimized, revised, and refined through processes of planning, modeling, and simulation. This study aims to respond to this emerging demand through a simulated case. The study, therefore, contributes to urban sustainability measures from the perspectives of transportation and urban traffic modeling. These are achieved by evaluating a context, modeling a simple—and yet effective—variable for further simulation and analysis. The results of this study then contribute mainly to broader areas of urban traffic research, and more specifically from the consideration of planning, modeling, and sustainability streams.
In accordance with the urban transportation systems, cities and city environments often require new planning strategies, guidelines, and regulations to optimize daily operations. Our urban networks operate so intensely through the fluidity of the transportation system that one cannot simply separate it from the other urban systems. Existing research also proves urban network is both physical and functional (Camagni and Salone, 1993; Cheng et al., 2013) beyond just the infrastructure systems and including other key functional parameters of connectivity, mobility, activities, socio-spatial, and socio-economic opportunities, etc. Hence, the transportation system could be regarded as one of the primary urban systems as well as the one that influences or affects others. In the field of transportation system analysis, it is important to evaluate the transportation network in simulation models, which can be done through a microsimulation approach (Miller et al., 2002). This is feasible through sample modeling examples or simulation studies, which represent the conditions of the city environments. Optimization of traffic flow has for long been one of the focus areas of research in urban traffic modeling and analysis. To respond to this overarching stream of research, this study, through a simulated case, provides a computer-based urban traffic model that could be assessed based on a neglected variable, i.e., sector-based time variable. By simulation the urban traffic model in scenarios, the study then contributes to urban traffic modeling research. The findings will give offer insight into three specific areas of land-use planning, urban management, and urban traffic modeling.
The available models of urban travel behavior suggest a variety of aspects such as temporal, spatial, and even socio-spatial considerations, which are widely applied in urban microsimulation studies (Arentze and Timmermans, 2000; Miller et al., 2002). To name a few practical examples, such modeling approaches help to develop travel models (Bradley and Bowman, 1998), provide a better understanding of daily operations and activities, such as travel plans (Miller et al., 2002) and travel demands (Goulias and Kitamura, 1992), or develop simulation-based scenarios for the optimization of traffic flow and movement dynamics (Axhausen, 1990). The city's network of transportation also influences many factors from land pricing to land use decision making, as well as other major aspects of urban mobility and urban layout planning. The planning and design of urban blocks are very much dependent on how urban transportation networks are developed, how they connect to the larger context of urban systems, and how they operate for daily uses, businesses, and all other urban sectors.
There have been many studies focusing on optimization of transportation systems, and particularly from multiple perspectives of urban traffic (Gao et al., 2016; Jovanović et al., 2017). However, no study has looked at urban traffic optimization from the perspective of the sector-based time variable. This important variable could be seen from a multi-sectoral approach, which verifies different operational hours and different peak hours, too. This approach requires a comprehensive consideration of a complex urban context with specific parameters, as well as factors of “agent,” “urban map,” and “mobility pattern,” which are related to multiple sectors across all urban systems of the city. This study addresses these in a holistic modeling approach of a simulated urban context example including a variety of urban systems and urban sectors, with specified operational hours.
Given that the optimization approach through the simulation model is a result through a holistic understanding of the complex urban context, planners, and decision-makers could be informed of the results to take into consideration dimensions of temporal and spatial and generate optimized urban mobility patterns rather than the reinvention of socio-spatial configurations of the city. Such an approach would help us to decide on time-use variables, as well as mobility patterns to/from certain destinations in the city. These travel plans and mobility patterns are important to urban traffic optimization plans and decision making for planning practices and city management levels. To develop such a model, it is necessary to put together a holistic understanding of city operations and urban functionalities, built environment characteristics of a city model, and agent-based mobility patterns across a sample city study. In doing so, this study aims to evaluate the important role of a sector-based time variable to simulate and evaluate it impacts on urban traffic. The findings from this study, embedded in an optimized scenario, would help the development of optimal city operations, mixed-use land use planning, and distributed activities and mobility patterns across the city. The study uses computational techniques, and not mathematical modeling, to conduct this simulation. In doing so, it provides solutions to (1) optimize urban traffic flow based on sector-based time variable, and (2) maximize the better use of temporal and spatial factors for land use planning and integrated solutions for urban mobility enhancement.
State of the Art
As part of urban traffic simulation studies, urban traffic modeling is a common analytical approach to assess and optimize vehicle-based studies (Amadio et al., 2018), urban traffic flow (Ledoux, 1997), urban traffic control system (Boillot et al., 2006) or prediction (De Oliveira and Camponogara, 2007), mode choice behavior (Garcia-Aunon et al., 2019), urban traffic networks (Li et al., 2016), etc. Some studies also utilize combined modeling analyses, such as the development of a nexus between traffic flow and urban networks (Gartner and Stamatiadis, 2002), or mathematical methods (Wang et al., 2006), multi-agent methods (Ou et al., 2000), multi-objective methods (Tang and Wang, 2007), prediction methods (Nigarnjanagool and Dia, 2005), network-based studies (Schadschneider et al., 2005), integrated methods (Li and Zhao, 2008), etc. In the last 10 years, in particular, urban traffic modeling and optimization studies have become more popular. For instance, published scholarly work is increased by almost six times, comparing 2009 and 2019 published research papers. More importantly, as many cities are growing by size and population, urban traffic studies have gained more popularity through multiple practical needs, policy reforms, regulatory perspectives, business-oriented analysis, impact assessment, and planning strategies. These studies have significantly contributed to major factors of efficient traffic modeling (Borg and Scerri, 2015), real-time system optimization (Yang and Jayakrishnan, 2015), recognition of various climate impacts by traffic (Golkhale and Pandian, 2007; Xie et al., 2013; Chang et al., 2019), and urban traffic congestion patterns (Karim et al., 2017), or those that suggest urban planning strategies and performative solutions. It is important to note there is growing research in developing countries or associated with cities facing rapid urbanization or urbanizing trends. The results could also help toward the development of pathways for sustainable urban mobility planning, or studies that could be influential on decision-making processes.
Among the existing research, “GIS-based” and “Fuzzy modeling” (Shafabakhsh et al., 2017) are popular in urban modeling. Also, associated with simulation-based studies, “Manhattan Mobility Model,” also known as “Manhattan-like” or “Manhattan Grid” (MG) modeling (Harri et al., 2007) is also gaining popularity in urban traffic or urban network research. Through the grid block typology and layout (inclusive of road networks), this method is a well-established urban mobility modeling approach for vehicular ad-hoc networks (VANET) (Martinez et al., 2008). Developed in computer science and applied in city studies, this method helps to create networks and vehicles/agents, which could then provide a simulation-based model of the traffic flow and predictive mobility patterns. This method is utilized for simulation analysis of urban networks and mobility patterns, those that can then help to optimize urban planning methods from an array of perspectives. The simulation could help with urban layout configuration, traffic flow optimization, physical infrastructure and planning, transportation planning, and demand-based transportation.
Out of all studies on urban traffic modeling, none has so far addressed the important parameter of “sector-based time variable.” This is a research gap, which provides suggestions for future planning and management of the cities and city environments. The sector-based analysis in urban traffic modeling is common from the perspectives of source-based analysis (Paraschiv and Paraschiv, 2019), stakeholder-analysis (Shi et al., 2020), urban freight management (Holguin-Veras et al., 2018), and other examples that look into explicit sectors. Nevertheless, these examples mostly look into one specific sector or in a combination with other factors, such as pollution, traffic congestion, etc. There are some new studies that look into temporal variations (Sahin et al., 2020), but none considers time variable from the sector-based approach. This study aims to address this research gap from a modeling analysis approach. Hence, it is proposed to develop an all-inclusive scenario of the sector-based urban context, which includes a range of sectors. This is then placed in an MG model, with the integration of the time variable. This is assessed from two sets of time variables, one that is the current working hours as scenario A, and the other as the proposed working hours as scenario B. This is developed by taking into consideration the full perspective of sectors, and sample-based approach to multiple sectors of a simulated urban environment. In doing so, we are able to provide a comparative analysis of both scenarios through urban traffic modeling. The results would help to develop novel urban management knowledge from a sector-based time variable approach.
Research Design: Multi-Phase Approach to Urban Traffic Modeling
The project is conducted in three phases: (1) defining the complex urban context; (2) modeling urban traffic; and (3) simulating urban traffic based on sector-based time variable (Figure 1). In this simulation study, the case of research is simplified to address the needs of research investigation and result from analysis. Hence, it is based on a real scenario with given data of the City of Ningbo, China. This is a representative of medium-to-large scale city, with an average urban density and urban traffic situation. The city has expanded vastly in the last 30 years, which is a similar situation to many developing cities around the world. Its mid-range urban density of 840 people per km2 provides a common scenario of mid-to-high urban density. Car ownership is estimated at around 60% of the population. The city also has a good range of public transportation of multiple modes, three major business districts, several districts, and a high-level of housing areas. With these common urban characteristics, Ningbo is recognized as a case study, which is also a representative of many developing or growing cities.
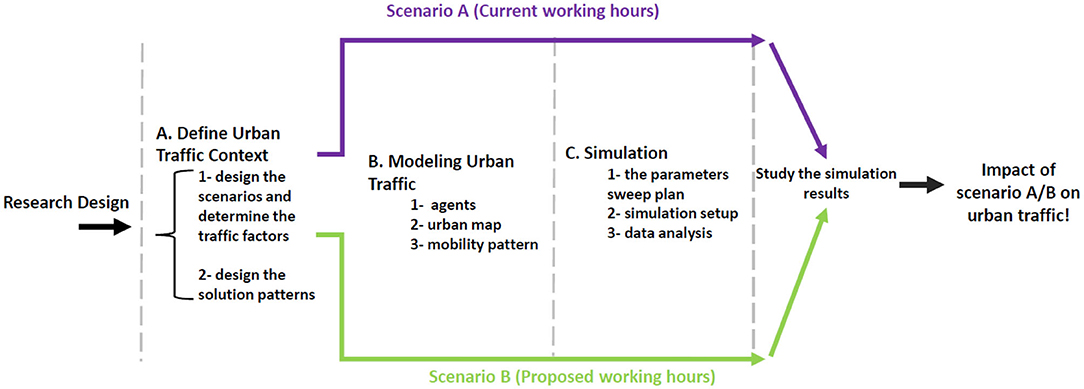
Figure 1. Flow chart of research design in three phases (source: the authors).
Phase 1: Defining the Complex Urban Context
In phase 1 of the study, it is essential to develop a simulated but complex urban context with its programmed parameters of field size, sector distribution, population, and sector-based operational working hours. By programming these specific parameters, the aim is to make the simulated model to be as close as possible to the real-life context, but in a simplified form that could evaluate the results from sector-based time variable. The simulated urban environment comprises of the following characteristics and details:
• The field size of 5 km × 5 km (Total: 25 km2) in a grid pattern layout of homogenized 400 m × 400 m block size and 100 m wide street layout across the field;
• A sector-based analysis for their random distribution across the field, including a selection of eight defined sectors located in the urban context;
• An overall population of 21,000 people (based on the given urban density from sample study), with half of them, recognized as active agents who commute to/from their workplaces daily, an average of 5 return trips a week;
• A rage of sector-based operational working hours is introduced in an orderly manner to reflect on the real situation of working hours in this defined urban context.
In order to define our grid pattern layout, a MG is selected. This method is used to simulate the context in a homogeneous layout (Figure 2), which is then more applicable for the simulation-based modeling of the whole area of 21,000 population. The number of people in this sample zone of 5 km × 5 km is calculated by considering the urban density of 840 people/km2, which is a representational density figure for medium-to-large scale cities of under 10 million population. This gives us a total figure of 21,000 people for an area of 25 km2. This approach of MG also defines the boundaries and represents a common grid layout in many developing cities.
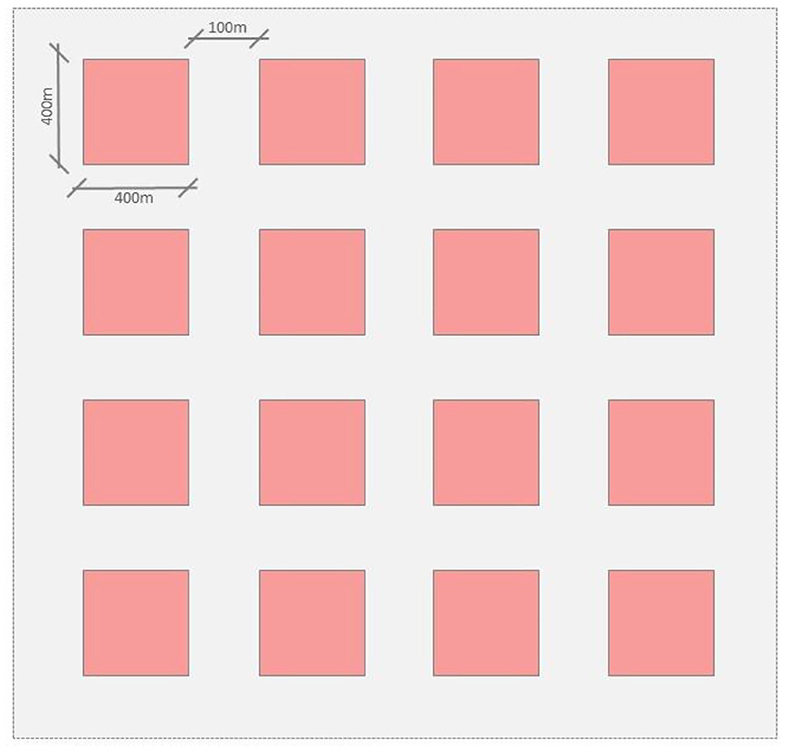
Figure 2. Selected Manhattan Grid, with 400m × 400m blocks and 100m road network layout in between urban blocks (source: the authors).
This urban sample gives us an area of 100 urban blocks, considering the urban block configuration and road network layout of 400 m wide and 100 m, respectively. In a square-shaped layout, this means a total of 10 urban blocks in rows and 10 urban blocks in columns. In a city with mid-range car ownership (based on a real sample case study), we calculate the total residential urban blocks at 88% of the whole city area. Hence, in the urban sample here, 12 of the 100 urban blocks are dedicated to non-residential land uses. This is based on the sample of 100 blocks, and 12% of non-residential typologies (i.e., based on varied functionalities) in this specific configuration. In doing so, we address the common urban typology distribution of residential and non-residential urban blocks across the sample model of this study.
In the next step, the model provides samples of multiple sectors of an urban environment, including eight defined sectors. These sectors are: (1) Education, (2) Healthcare (such as Clinic and hospital), (3) Banking (separated from finance), (4) Government, (5) Finance (Commercial), (6) Retail and shops, (7) Safety and Security, and (8) Others. For education buildings, the list includes schools (private and public), colleges, and universities. For healthcare, we refer to clinics, hospitals, and healthcare units of various sorts at small and large scales. For banking and finance, the list mainly includes banks or similar types of finance-based services. For government buildings, we refer to any building that includes government houses, council buildings, district governmental buildings, tax offices, courthouses, and police stations. For finance and commercial, the list mainly includes financial buildings/towers. For retail, we refer to a range of shopping units, retail podiums, shopping centers and facilities, restaurants, cafés, and places that are generally considered as retail facilities. For safety and security buildings, the list mostly includes police stations, fire stations, and community security buildings, etc. For others, the list includes mainly urban parks, open spaces (apart from streets and sidewalks), and public squares, mostly defined as public realms of the city. In addition, the larger part of the city are residential buildings, which commonly includes housing compounded of various types, from low-rise to high-rise compounds and residential units. In addition, the category of public buildings includes typical public buildings, such as libraries, galleries, museums, etc.
Considering the variety of land-uses and different sectors in the urban area, the study's model is assumed the transportation sector is integrated into the urban layout. All eight sectors are located within the 12% non-residential urban land uses, comprised of the following land-uses or sectors, based on the conditions of the city example:
• 2% for education (a minimum of 2 full urban blocks); the city example includes one university and one school block;
• 1% for healthcare (a minimum of 1 full urban block); the city example includes one community hospital;
• 0.5% for banking and 0.5% for Finance (1 combined urban block); the city example includes a combined urban block of banking and financial buildings as a representative of these sectors in the urban land-use;
• 4% for Retail and shops (a minimum of 4 full urban blocks); the city example includes a set of mixed retail units, shopping center, entertainment units, and restaurants/cafés;
• 0.5% for government buildings and 0.5% for safety and security (1 combined urban block); the city example includes a combined urban block of governmental offices, police stations, and a tax office;
• 1% for public buildings (a minimum of 1 full urban block); the city example includes a combined block of museum and library within the case study example;
• 2% for others, such as public parks (a minimum of 2 full urban blocks); the city example includes public squares, public facilities, and a community urban park.
Out of the above 12 blocks (12% of 100 represented blocks), two blocks are under the category of “others” mainly used for leisure activities, such as for parks, green corridors, etc. In total, 10 blocks (or 10% of total urban area) include urban businesses require travel to and from workplaces across all eight sectors. The remaining two blocks (2% of total urban area) are excluded as they do not require travel to sector-based businesses for daily operations and travels. This also simplifies the model with a 10% distribution of non-residential target or destination travel patterns in compared with 88% of residential blocks, and 2% to be recognized as void.
The distribution is demonstrated in Figure 3.
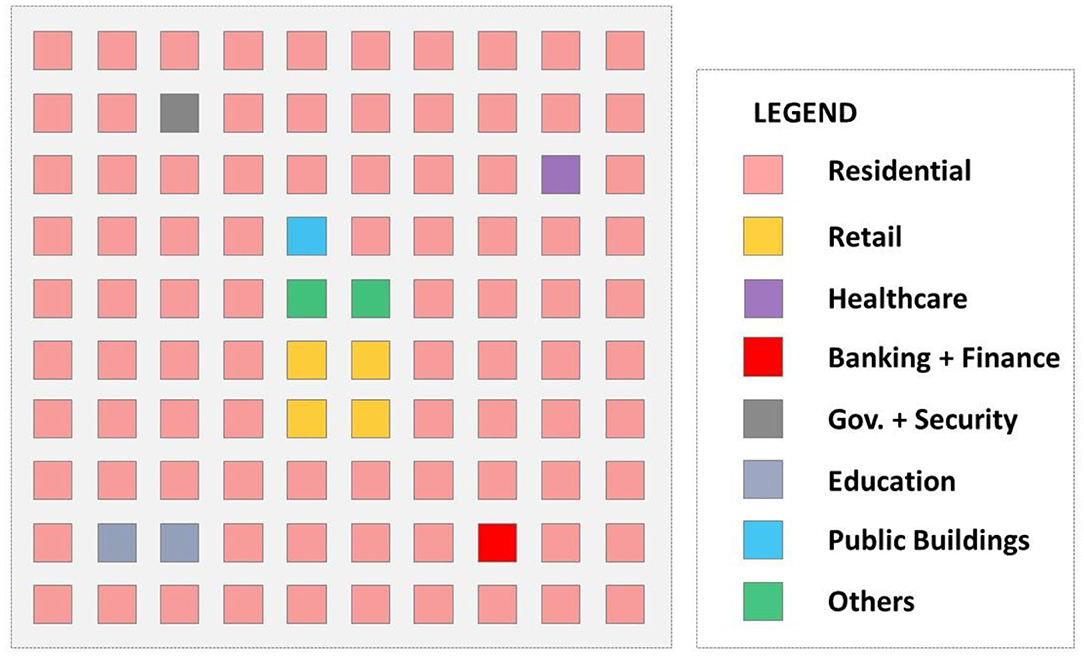
Figure 3. Representation of 100 urban blocks in the urban sample, with 88% residential land use and 12% non-residential across eight sectors (source: the authors).
Each of these eight sectors is given a range of working hours (or operational hours) and peak hours as shown in Table 1. The peak hours are divided into morning peak hours and afternoon peak hours, representing the travel times to/from workplaces for at least five working days a week (Monday–Friday).
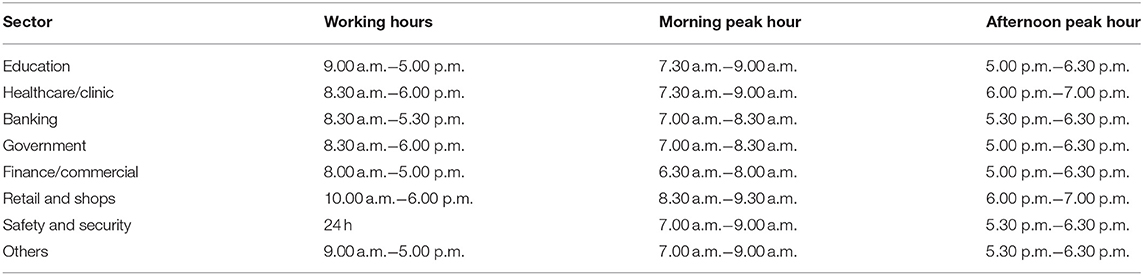
Table 1. Sample of multiple sectors, operational hours, and peak hours (source: the Authors).
In the next step, the model is given proposed hours different from the earlier operational hours. This includes a range of diverse operational hours, which also means a range of different peak hours. In doing so, the study simulates the varied operational hours including two sets of new peak hours, meaning that peak hours across all eight sectors are no longer in the same or similar range. This reflects on the main objective of this study, which is to develop a hypothesis about urban traffic optimization based on modeling of multiple time variables driven from a comprehensive sector-based consideration (Figure 4).
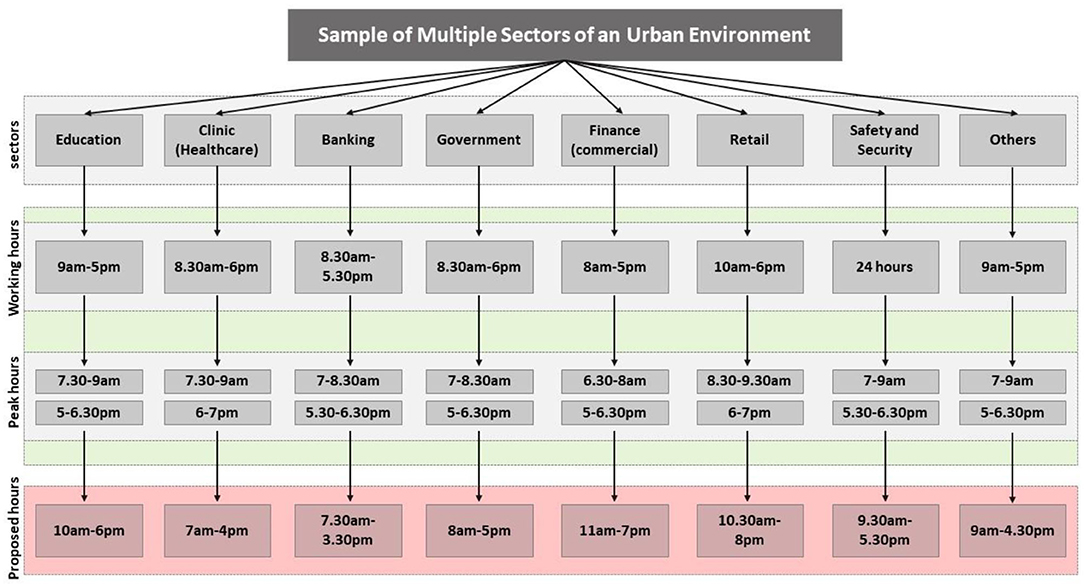
Figure 4. Summary of multiple sectors, operational hours, peak hours, and proposed hours of operations (source: the authors).
Phase 2: Modeling Urban Traffic
The urban traffic model is comprised of three components: (1) agents, (2) urban map, and (3) mobility pattern.
First, an agent is modeled as a mobile object that moves through a set of pre-defined roads provided by the urban map. This is implemented in two forms: active and inactive. An active agent leaves a residential region to reach a business sector at a particular time in the morning and return to the same residential area in the evening after the sector operation hours. This has a substantial impact on urban traffic. Active agents are assigned to business sectors according to a business allocation pattern. Based on the eight categories of sectors, these businesses are clustered into five business categories including (1) education, (2) government and security, (3) retail and shopping, (4) health, and (5) banking and finance. Each business sector cluster is allocated by a distribution weight (Education 20%, Healthcare 10%, Banking 10%, Government: 10%, Retail, and shops: 40%, and Public Buildings 10%) based on an urban environment model which is used in Ningbo city, China. This adds to a total of 100% for the business categories, which are then distributed in our simulated urban model. An inactive agent is allocated to no business sector, whereas it only is assigned by a residential address. This has no impact on urban traffic as inactive agents use particular paths (e.g., public transportation lines or pedestrian zones) to move throughout the city. This means active agents are only included to model urban traffic. This is specifically modeled to address the sector-based time variable argument of this study.
Second, an urban map is modeled according to a Metropolitan Grid (M-Grid), Manhattan model (Martinez et al., 2008). This model provides a grid infrastructure of blocks, comprised of street network configuration (Sheikh-Mohammadzadeh and Rajabi, 2013) and junctions/intersections (Ortigosa and Menendez, 2014). The blocks are assigned by a residential or business role according to a random block distribution pattern. For this, there are 12 and 88%, respectively, for non-residential and residential blocks, respectively. According to Ningbo urban environment model, 10 out of 12 non-residential blocks are marked as business blocks with an impact on urban traffic. The roads are modeled by two-lane, through which the agents move to reach their residential or business blocks. Each road and block is assigned by a row and column ID according to its location on the grid map. This will be discussed further in the next section.
Third, agents' mobility pattern is modeled by a set of particular parameters including start time, road selection, and mobility. Each active agent starts a work-journey from the residential region and moves at a constant speed to the allocated business sector. It selects a pre-defined shortest path to reach the business sector using an array of the assigned road/lane IDs. Dijikstra's algorithm (Dijikstra, 1959) is used to find the shortest path between the residential region and the business sector for each active agent's trip. This models a directed graph and forms the shortest path in which road IDs are repeatedly added if they minimize the path length in total. To avoid accidents, each agent keeps a clear radius distance around while moving. An active agent stops moving when reaching a clear radius of any around. Active agents use their private vehicles to travel throughout the urban area. The proportion of the active agents to all available ones (including who stay at the residential area, use public transportations, or walk) is defined according to an experimental parameter which will be discussed below.
This urban traffic model is used to study the impact of the proposed approach on urban traffic. For this, two metrics are measured as below:
• End-to-End delay (ETE): This is measured as an average value for active agents when they start driving from the residential region until they reach the allocated business sectors and similarly from when they leave their business sectors until they arrive home. ETE is influenced by traffic congestion caused by active agents' vehicles, mobility patterns, urban traffic management protocols, and path availability. This has the potential to impact the performance of business sectors. Late arrival would result in potential reductions in productivity, functionality, and output of the business sectors.
• Agent queue count (AQC): This calculates as the average number of active agents who wait in traffic queues at junctions or road's bottlenecks waiting to access the business sector. This is used to study traffic congestion which is caused by active agents. AQC is positively correlated to ETE as increased ACQ would enhance ETE.
Phase 3: Simulating Urban Traffic Based on Sector-Based Time Variable
A simulation technique used in this research study is to model urban traffic according to the business sectors' operation hours, conventional, and proposed. This approach gives us a variability, which could help with a comparative analysis of multiple scenarios. A real implementation is, therefore, to study the impact of the sectors' operational hours on urban traffic, which is expensive and risky. This needs additional coordination and great resources to implement traffic modeling scenarios in a real urban area. For this, simulation is often used to study the performance and functionality of urban traffic modeling. OMNET++ (2020) is a discrete event simulator, which has an open-source framework called INET (2020) to support agent mobility and urban traffic modeling. Figure 5 shows the experimental parameter sweep plan according to the scenarios, simulation parameters, and active agent ratio.
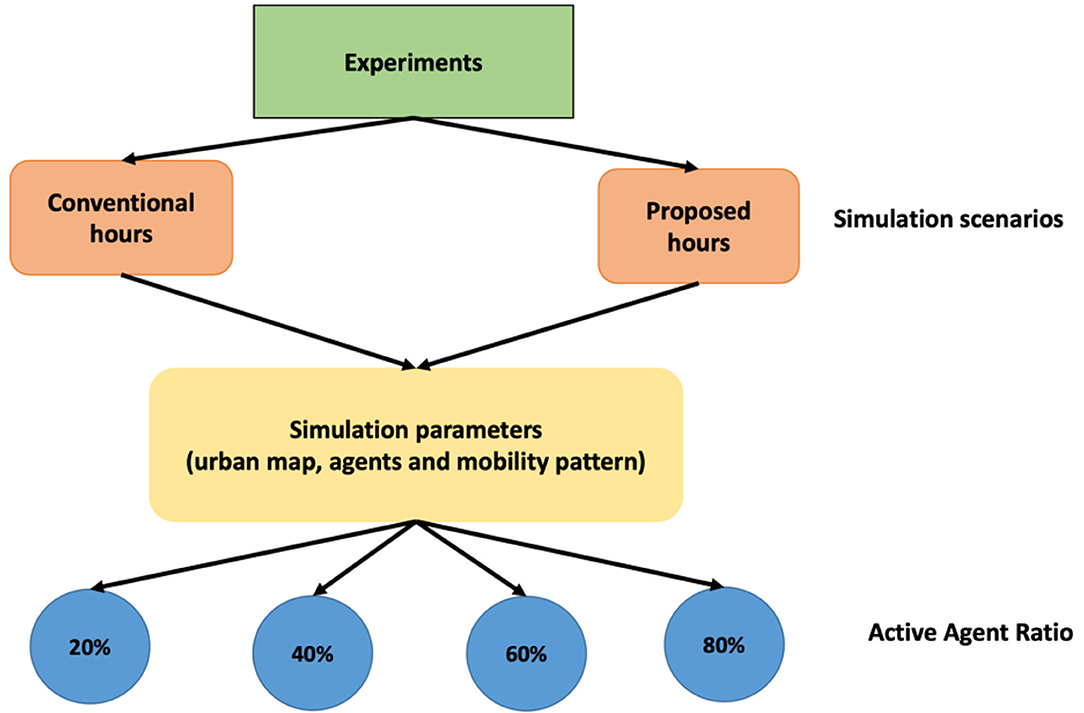
Figure 5. Parameters sweep plan (source: the authors).
This research study simulates urban traffic modeling according to two scenarios: business sectors' conventional (scenario A) and proposed operation hours (scenario B). For both scenarios, the simulation seeds are implemented using the same simulation parameters including an urban area map, agent number (both active and inactive), and mobility pattern. Table 2 summarizes the simulation parameters used to set-up the simulation seeds and implement the urban traffic modeling scenarios.
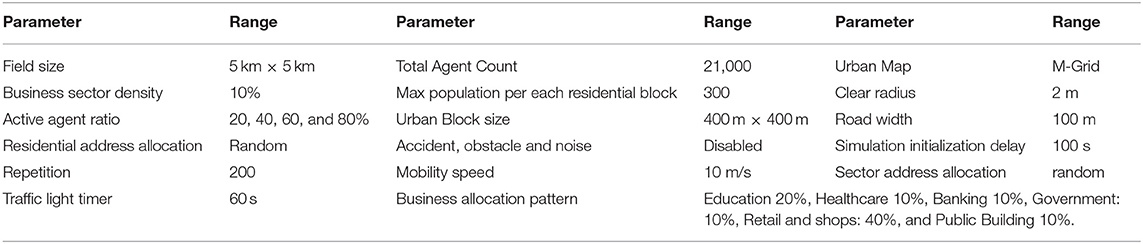
Table 2. Simulation set-up parameters (source: the authors).
According to sector distribution pattern, 12 blocks are randomly allocated in the grid map, of which 10 blocks are business sectors. Available active agents are calculated based on the active agent ratio with multiple variables (20, 40, 60, and 80%) and are assigned to the business sectors according to the business allocation pattern. For example, 4,200 active agents are allocated to the business sectors (education 840, healthcare 420, banking 420, government 420, retail and shops 1,680, and public buildings 420) if the simulation is set-up with 20% active agent ratio. Yet, agents (21,000) are randomly distributed to the residential blocks. Random allocation allows us to study the impact of the proposed operation hours on urban traffic in an average form per each simulation seed. A maximum population is set for each residential block (as 300 agents) to achieve an acceptable level of load balancing.
Each agent selects a road to move through if this is assigned by the road ID(s). It leaves the residential block to work at allocated start time in the morning and returns home when the sector's operation time is over. A private timer is assigned to each agent. This measures time until the agent reaches the target or destination. This is described as the time from source to target, which is shown across multiple sectors and randomly across various locales of the sample urban model. Moreover, each agent keeps clear a radius of 2 m around to avoid an accident. Each junction is assigned by a 60-s traffic light to manage urban traffic (US Department of Transportation, 2020). These parameters and ranges are proposed in the main research model of the study.
To observe the results of the simulations according to agent count changes, an active agent variable is defined. By this, each simulation scenario is given by four proportions of all available agents, 20, 40, 60, and 80%, as active agents. Active agents move through the map roads with their private cars at a constant speed of 10 m/s. The simulations include inactive agents to study urban traffic as they are programmed to stay home, walk, or travel with public transportation via dedicated paths.
Moreover, this simulation measures ETE for each active agent as the average value of the private timer. For this, external delays such as parking access are not included. AQC is computed as the average result of the maximum number of active agents, which are queued in traffic congestions during either onward or return journey.
Simulation Data Validity
Data validity is key for quantitative/statistical data collection and analysis -mainly simulation. This addresses the accuracy and trustworthiness of experiments aiming to determine whether the approach is able to accurately model approach/data according to real-world applications. However, this suffers from internal and external threats. The former focuses on the risks of simulated data/model validities (i.e., sample validity), whereas the latter addresses the data generalization threats (i.e., population validity).
Random sampling and power statistical analysis are two techniques that are usually used to tackle data validity threats. This simulation utilizes random sector and agent distribution models to address sample variation. For this, a two-level sample variation scheme is set up to take account of the random samples according to their dependencies: (1) urban sectors are randomly assigned to the urban blocks and (2) agents are randomly distributed between the urban sectors. This provides a variation sample range of (Agent × Sector). Yet, statistical power analysis (Epitools, 2020) was used to determine the necessary repetitions as the simulations are set up according to an average scenario. This technique is used in experimental design to calculate the number of repetitions (sample size) using the population standard deviation and according to a given confidence degree. We run the experiments 20 times (sample size) and measured them with the standard deviation of ETE and AQC. The greatest standard deviation is used to calculate the minimum number of required repetitions as it shows the widest confidence interval. In doing so, 200 is the minimum number of required repetitions to achieve 90% confidence using the assumed population standard deviation. Although the simulation results offer benefits to other cities ad urban areas in the scale of this case study (Ningbo city), the validity of this simulation still suffers from the threats of simulation model's factors such as the fixed number of urban sectors and business allocation pattern. Hence, new simulation models to support the cities and urban areas with different agent populations, urban modeling, and mobility pattern will be addressed as future work.
Optimization Results and Comparison
Main Results From the Simulation Studies
This section evaluates the impact of the working hours on urban traffic using simulation. For this, ETE and AQC are measured according to both the proposed and convectional hour scenarios. The same simulation seeds are utilized to compare and study the impact of both scenarios on urban traffic according to Figure 5.
End-to-end delay (ETE) measures the average delay during active actors' journeys when they leave the residential area to the allocated business sectors and return to home after work. This excludes working hours, whereas only includes the private timer values when actors are moving in the streets. ETE is highly influenced by a number of parameters especially urban traffic and mobility patterns.
According to Figure 6 below, ETE is reduced when the simulation is set-up according to the proposed hours. The proposed approach roughly reduces ETE from 45 to 58% as compared to the conventional working hours. Indeed, ETE is reduced for the proposed approach if the number of active agents that impact urban traffic is increased. ETE is reduced because the proposed hours move the traffic peak hours into other slots. The variability in sector-based time factor also suggests a better mobility pattern, which could be translated from the urban traffic optimization scenario planning. This approach divides the active agents into different groups which move into target blocks according to the new postponed peak hours. The results vary according to the increase of active agent ratio. But in all four scenarios, we see a substantial decrease in ETE rates in the proposed model, by nearly half of the conventional model.
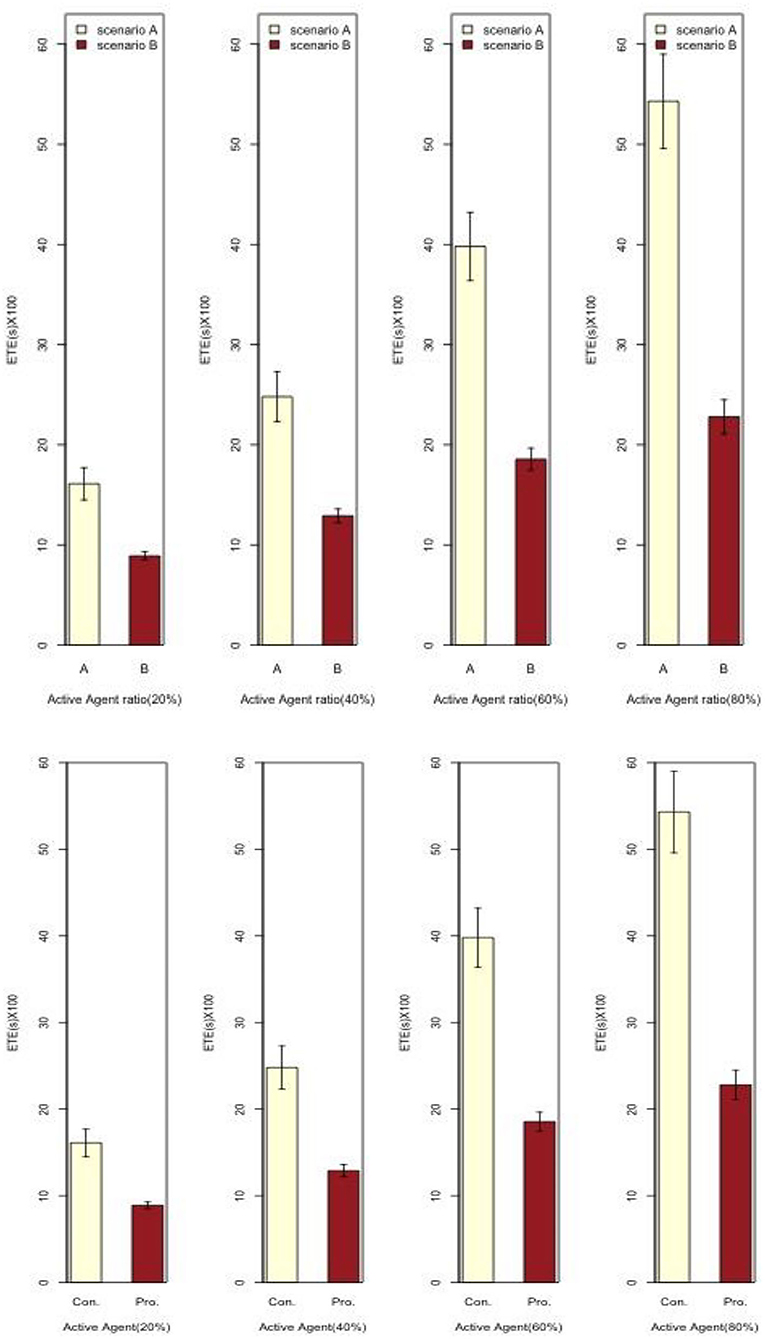
Figure 6. ETE for conventional (Scenario A) and proposed (Scenario B) hours (source: the authors).
Agent queue count (AQC) is measured as the average number of active agents who wait in traffic queues. This is positively correlated with urban traffic and highly impact ETE.
As Figure 7 shows, the average number of active agents who wait in queues is significantly increased for conventional hours as compared with proposed ones. This is because a greater number of active agents leave their source blocks to targets during the conventional peak hours. However, the “proposed hours” approach divides active agents into a number of groups according to their specified business sectors. In doing so, the number of moving active agents is reduced and consequently, traffic congestion is decreased significantly. As the findings of this simulation study indicate, the proposed approach reduces the urban traffic, in terms of AQC, by a range of 45–60% as compared to the conventional approach. The reduced travel time as a result of reduced traffic is a major finding of sector-based time variable analysis. Therefore, the length of traffic queues is reduced using the proposed hours especially if the number of active agents is increased and the urban area becomes crowded.
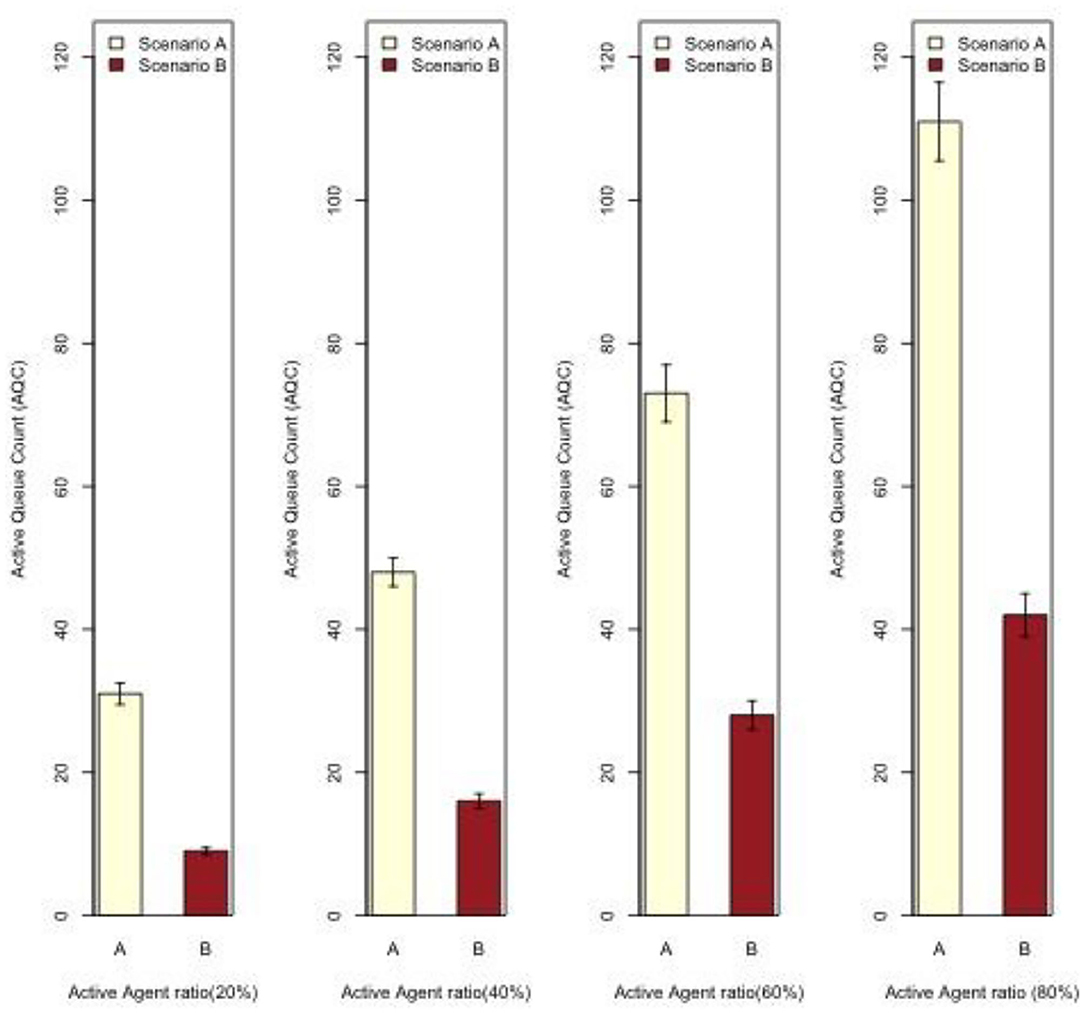
Figure 7. AQC for conventional (Scenario A) and proposed (Scenario B) hours (source: the authors).
Discussions on Urban Traffic Optimization
As shown in Figures 6, 7, the proposed model reduces ETE and AQC that results in decreased urban traffic. Indeed, the proposed approach suggests an optimal urban traffic model for cities of mid-to-high urban densities. The urban modeling according to the actual situation of urban parcels of the City of Ningbo in China, provides us with a simulation example, which could test the important sector-based time variable. This simulation is, therefore, conducted based on the calculation of the proposed hours which are according to a realistic scenario of an urban context and with a particular technique. For this, urban context is modeled using a number of key parameters including agents, mobility pattern and urban map. All these three parameters have a high impact on urban traffic. This means, urban traffic is increased if the number of agents which move throughout the area is enhanced. Various mobility patterns also would impact on urban traffic and result in increased traffic congestions. For example, traffic queue length is increased if agents repeatedly move through random roads with no target to reach. Urban traffic is increased if urban map provides on sufficient roads according to the active agent count.
The simulation is conducted according to a particular scenario, which forms by the urban traffic modeling parameters (see Table 2), Metropolitan Grid (M-Grid) Manhattan model and four proportions of active agents to study the scalability and performance of the simulation. According to power statistical analysis, this study is repeated 200 times to achieve a confidence of 90% for the simulation results. The experiments are setup according to various proportions of active agents including 20, 40, 60, and 80%. This allows us to study the impact of proposed approach on urban traffic especially when the number of moving agents is increased and urban area becomes crowded. A same city map is used by all the experiments which are implemented according to same simulation seeds. Simulation seeds are generated using the simulation parameters summarized in Table 2. However, a random distribution model is used for both residential and business sector address allocation. Yet, each residential block is allocated by random agent IDs with a maximum of 300. This allows us to study the performance of the proposed hours when the location of agents changes. Indeed, this provides us a more accurate evaluation of the proposed approach functionality and/or ability to reduce urban traffic when active agents establish various shortest path between residential and business sectors to move.
The optimized model of proposed hours provides important information that the optimization of urban traffic under the simulated scenario is possible by the adjustment in sector-based time variable. This adjustment, although minimal, plays a major part in multiple factors associated with mobility patterns between two travel nodes of source and target. Hence, the results show significant reductions urban traffic particularly in terms of in ETE and AQC. This is because the active agents avoid moving throughout the urban area at same time and make bottlenecks and traffic congestions. However, the proposed hours allow the active agents to be classified according to business sectors and move through the roads only during the allocated hours. By this, each group of active agents, for example education, start a trip and move through the roads only during its allocated time slot. Hence, the number of active agents that move throughout the urban area is rapidly decreased. This would result in decreased urban traffic.
Conclusions and Future Research Outlook
Within this simulation study, it was supported how sector-based time variable could be used to optimize urban traffic in cities and to/from business destinations. By changing the operation hours and proposing for new peak hours across multiple sectors of the city, the argument of time variables was implemented and applied in this case study example. The findings allowed us to uncover how the sector-based time variable could be utilized for future urban planning and city management scenarios. Hence, we do not necessarily need to reinvent urban environments but could optimize the urban systems, and in particular, the operational attribute of urban systems.
To maximize the potential of urban traffic optimization, three main components of agents, urban map, and mobility pattern could inform urban planning and city management decision making. The reduction of traffic flow is feasible through a sector-based time variable. Based on the comparison of two models of conventional and proposed operation hours, two measured metrics of end-to-end delay (ETE) and agent queue count (AQC) indicate significant reductions in the simulated models. These findings suggest that the time variable is vital to mobility patterns in city environments, particularly those regular travel routes, which we make to and from workplaces. Through this valuable comparative analysis, we could also suggest a potential alteration in working hours, time-place variables, location-based work travels, urban mobility reduction, and even new socio-economic opportunities.
By reflecting on the methodology and findings of this study, we also suggest future research pathways that could emerge from this new perspective to urban traffic studies. The improvements to future research studies include the consideration of data-driven urban modeling, which utilizes a larger scale of the city area, as well as the consideration of mixed land use, variable transportation modes, and demographic changes in the urban environments. While we develop a model close to a real case situation, it is feasible that with the availability of relevant big data, we could develop more scenarios of urban traffic optimization. One result of big data use would be to reflect on more parameters and associated variables. In doing so, further parameters and variables could affect the daily mobility patterns and behaviors, and ultimately could provide alternative scenarios of agent-based travel simulation analysis. Consequently, we could develop several more comparative studies, which are even more important to urban planning decision-making and urban traffic cases.
Finally, the collective use of agents, urban map, and mobility patterns were found to be important to the accuracy of simulation study; use of individual paramours, particularly land use data or travel behaviors, may lead to incorrect results that are not holistic enough for the study of urban traffic optimization. Hence, this study adds to the larger body of urban traffic studies demonstrating, in particular, the impact of sector-based time variable for estimating and evaluating travel patterns of multiple scenarios. Furthermore, the results are very useful for potential urban design analysis, urban management suggestions, and sector-based readjustments in cities and city environments. Future research work could include larger scale analysis and the use of big data for urban traffic modeling, simulation, and optimization.
Data Availability Statement
The raw data supporting the conclusions of this article will be made available by the authors, without undue reservation.
Author Contributions
All authors have been involved in conceptualization, data analysis, simulation, and writing up the study.
Funding
This study was supported by the National Natural Science Foundation of China (NSFC) project number 71950410760. The authors have also received internal funding by the Faculty of Science and Engineering (FoSE) and the Institute of Asian-Pacific Studies (IAPS) at the University of Nottingham Ningbo China.
Conflict of Interest
The authors declare that the research was conducted in the absence of any commercial or financial relationships that could be construed as a potential conflict of interest.
Supplementary Material
The Supplementary Material for this article can be found online at: https://www.frontiersin.org/articles/10.3389/frsc.2021.629940/full#supplementary-material
References
Amadio, A., Nicuesa, F., Otero, D., Galetti, D., and Mizrahi, S. S. (2018). Urban vehicular traffic: fitting the data with a hybrid stochastic model. Part II Phys. A Stat. Mech. Appl. 509, 469–478. doi: 10.1016/j.physa.2018.06.017
Arentze, T., and Timmermans, H. J. P. (2000). ALBATROSS: A Learning-Based Transportation Oriented Simulation System. Eindhoven: Eindhoven University of Technology.
Axhausen, K. (1990). “A simultaneous simulation of activity chains and traffic flow,” in Developments in Dynamic and Activity-Based Approaches to Travel Analysis, ed P. Jones (Aldershot: Avebury), 206–225.
Boillot, F., Midenet, S., and Pierrelée, J.-C. (2006). The real-time urban traffic control system CRONOS: algorithm and experiments. Transport. Res. Part C 14, 18–38. doi: 10.1016/j.trc.2006.05.001
Borg, D. L., and Scerri, K. (2015). Efficient traffic modelling and dynamic control of an urban region. Transport. Res. Procedia 6, 224–238. doi: 10.1016/j.trpro.2015.03.018
Bradley, M., and Bowman, J. L. (1998). A System of Activity-Based Models for Portland, Oregon. Washington, D.C.: Department of Transportation.
Camagni, R. P., and Salone, C. (1993). Network urban structures in northern Italy: elements for a theoretical framework. Urban Stud. 30, 1053–1064. doi: 10.1080/00420989320080941
Campbell, A. T., Eisenman, S. B., Lane, N. D., Miluzzo, E., and Peterson, R. A. (2006). “People-centric urban sensing,” in The 2nd Annual International Workshop on Wireless Internet (Buffalo, NY: University of Buffalo).
Chang, C.-T., Yang, C.-H., and Lin, T.-P. (2019). Carbon dioxide emissions evaluations and mitigations in the building and traffic sectors in Taichung metropolitan area, Taiwan. J. Cleaner Prod. 230, 1241–1255. doi: 10.1016/j.jclepro.2019.05.006
Cheng, J., Bertolini, L., Clercq, F., and Kapoen, L. (2013). Understanding urban networks: comparing a node-, a density- and an accessibility-based view. Cities 31, 165–176. doi: 10.1016/j.cities.2012.04.005
Cheshmehzangi, A. (2016). Multi-spatial environmental performance evaluation towards integrated urban design: a procedural approach with computational simulations. J. Clean. Prod. 139, 1085–1093. doi: 10.1016/j.jclepro.2016.08.151
Cheshmehzangi, A. (2018). The changing urban landscape of Chinese cities: positive and negative impacts of urban design controls on contemporary urban housing. Sustainability 10:2839. doi: 10.3390/su10082839
De Oliveira, L. B., and Camponogara, E. (2007). Predictive control for urban traffic networks: initial evaluation. IFAC Proc. 40, 424–429. doi: 10.3182/20071017-3-BR-2923.00067
Dijikstra, E. W. (1959). A note on two problems in connexion with graphs. Num. Math. 1, 269–271. doi: 10.1007/BF01386390
Epitools (2020). Sample Size Calculation. Available online at: https://epitools.ausvet.com.au/onemean (accessed May 5, 2020).
Gao, K., Zhang, Y., Sadollah, A., and Su, R. (2016). Optimizing urban traffic light scheduling problem using harmony search with ensemble of local search. Appl. Soft Comput. 48, 359–372. doi: 10.1016/j.asoc.2016.07.029
Garcia-Aunon, P., Roldan, J. J., and Barrientos, A. (2019). Monitoring traffic in future cities with aerial swarms: developing and optimizing a behavior-based surveillance algorithm. Cogn. Syst. Res. 54, 273–286. doi: 10.1016/j.cogsys.2018.10.031
Gartner, N. H., and Stamatiadis, C. (2002). Arterial-based control of traffic flow in urban grid networks. Math. Comput. Model. 35, 657–671. doi: 10.1016/S0895-7177(02)80027-9
Golkhale, S., and Pandian, S. (2007). A semi-empirical box modeling approach for predicting the carbon monoxide concentrations at an urban traffic intersection. Atmos. Environ. 41, 7940–7950. doi: 10.1016/j.atmosenv.2007.06.065
Goulias, K. G., and Kitamura, R. (1992). Travel demand forecasting with dynamic microsimulation. Transp. Res. Rec. 1357, 8–17.
Harri, J., Filali, F., and Bonnet, C. (2007). Mobility Models for Vehicular Ad Hoc Networks: A Survey and Taxonomy. Research Report RR-06-168. Available online at: http://www.eurecom.fr/en/publication/1951/download/cm-haerje-060320.pdf (accessed April 10, 2020).
Hemminki, S., Nurmi, S., and Tarkoma, S. (2013). “Accelerometer-based transportation mode detection on smartphones,” in The 11th ACM-Conference on Embedded Networked Sensor Systems (Rome).
Holguin-Veras, J., Leal, J. A., Sanchez-Diaz, I., Browne, M., and Wojtowicz, J. (2018). State of the Art and Practice of Urban Freight Management: Part I: Infrastructure, Vehicle-Related, and Traffic Operations. Transp. Res. A 137, 360–382. doi: 10.1016/j.tra.2018.10.037
INET (2020). INET Framework. Available online at: https://inet.omnetpp.org/Introduction.html (accessed April 12, 2020).
Jovanović, A., Nikolić, M., and Teodorović, D. (2017). Area-wide urban traffic control: a bee colony optimization approach. Transport. Res. Part C 77, 329–350. doi: 10.1016/j.trc.2017.02.006
Karim, L., Daissaoui, A., and Boulmakoul, A. (2017). Robust routing based on urban traffic congestion patterns. Procedia Comput. Sci. 109, 698–703. doi: 10.1016/j.procs.2017.05.380
Ledoux, C. (1997). An urban traffic flow model integrating neural networks. Transport. Res. Part C 5, 287–300. doi: 10.1016/S0968-090X(97)00015-6
Li, S.-B., Li, Y., Fu, B., and Dang, W. (2016). Study on simulation optimization of dynamic traffic signal based on complex networks. Procedia Eng. 137, 1–10. doi: 10.1016/j.proeng.2016.01.228
Li, Z., and Zhao, X. (2008). Integrated-equilibrium routing of traffic flows with congestion. IFAC Proc. 41, 16065–16070. doi: 10.3182/20080706-5-KR-1001.02715
Martinez, F. J., Cano, J. C., Calafate, C. T., and Manzoni, P. (2008). “Citymob: a mobility model pattern generator for VANETs,” in ICC Workshops-2008 IEEE International Conference on Communications Workshops (IEEE), 370–374.
Miller, E. J., Roorda, M., Eberhard, L., and Litwin, M. (2002). “A microsimulation model of daily household activity and travel,” in Understanding and Modeling Travel Behavior session of the 98th Annual Meeting of the Association of American Geographers (Los Angeles, CA), 19–23.
Nigarnjanagool, S., and Dia, H. (2005). Evaluation of dynamic signal optimisation control model using traffic simulation. IATSS Res. 29, 22–30. doi: 10.1016/S0386-1112(14)60115-1
OMNET++ (2020). Omnet++ Simulator. Available online at: http://www.omnetpp.org/ (accessed April 12, 2020).
Ortigosa, J., and Menendez, M. (2014). Traffic performance on quasi-grid urban structures. Cities 36, 16–27. doi: 10.1016/j.cities.2013.08.006
Ou, H., Yang, Y., Zhang, W., and Xu, X. (2000). Urban intelligent traffic system based on multi-agent. IFAC Proc. 33, 567–572. doi: 10.1016/S1474-6670(17)38204-6
Pan, J., and Lai, J. (2019). Spatial pattern of population mobility among cities in China: case study of the National Day plus Mid-Autumn Festival based on Tencent migration data. Cities 94, 55–69. doi: 10.1016/j.cities.2019.05.022
Paraschiv, S., and Paraschiv, L.-S. (2019). Analysis of traffic and industrial source contributions to ambient air pollution with nitrogen dioxide in two urban areas in Romania. Energy Procedia 157, 1553–1560. doi: 10.1016/j.egypro.2018.11.321
Sahin, U. A., Onat, B., Akin, Ö., Ayvaz, C., Uzun, B., Mangir, N., et al. (2020). Temporal variations of atmospheric black carbon and its relation to other pollutants and meteorological factors at an urban traffic site in Istanbul. Atmos. Pollution Res. 11, 1051–1062. doi: 10.1016/j.apr.2020.03.009
Schadschneider, A., Knospe, W., Santen, L., and Schreckenber, M. (2005). Optimization of highway networks and traffic forecasting. Phys. A Stat. Mech. Appl. 346, 165–173. doi: 10.1016/j.physa.2004.08.063
Shafabakhsh, G. A., Famili, A., and Bahadori, M. S. (2017). GIS-based spatial analysis of urban traffic accidents: case study in Mashhad, Iran. J. Traffic Transport. Eng. 4, 290–299. doi: 10.1016/j.jtte.2017.05.005
Sheikh-Mohammadzadeh, A., and Rajabi, M. A. (2013). Analyzing the effect of the street network configuration on the efficiency of an urban transportation system. Cities 31, 285–297. doi: 10.1016/j.cities.2012.08.008
Shi, J., Lee, C.-H., Guo, X., and Zhu, Z. (2020). Constructing an integrated stakeholder-based participatory policy evaluation model for urban traffic restriction. Technol. Forecast. Social Change 151:119839. doi: 10.1016/j.techfore.2019.119839
Silveira, P., and Dentinho, T. P. (2018). A spatial interaction model with land use and land value. Cities 78, 60–66. doi: 10.1016/j.cities.2017.08.023
Tang, U. W., and Wang, Z. S. (2007). Influences of urban forms on traffic-induced noise and air pollution: results from a modelling system. Environ. Model. Softw. 22, 1750–1764. doi: 10.1016/j.envsoft.2007.02.003
US Department of Transportation (2020). Traffic Signal Timing Manual. Available online at: https://ops.fhwa.dot.gov/publications/fhwahop08024/chapter5.htm (accessed May 5, 2020).
Wang, J.-S., Zhao, B., Ye, C., Yang, D., and Huang, Z. (2006). Optimizing layout of urban street canyon using numerical simulation coupling with mathematical optimization. J. Hydrodyn. B 18, 345–351. doi: 10.1016/S1001-6058(06)60015-2
Xie, L.-H., Cai, M., and Li, E. (2013). Comprehensive evaluation of traffic noise pollution based on population exposure. Procedia Social Behav. Sci. 96, 2179–2186. doi: 10.1016/j.sbspro.2013.08.246
Yang, I., and Jayakrishnan, R. (2015). Real-time network-wide traffic signal optimization considering long-term green ratios based on expected route flows. Transport. Res. Part C 60, 241–257. doi: 10.1016/j.trc.2015.09.003
Keywords: urban traffic, traffic optimization, urban modeling, time variable, sector-based, simulation, end-to-end delay (ETE), Agent queue count (AQC)
Citation: Cheshmehzangi A and Pourroostaei Ardakani S (2021) Urban Traffic Optimization Based on Modeling Analysis of Sector-Based Time Variable: The Case of Simulated Ningbo, China. Front. Sustain. Cities 3:629940. doi: 10.3389/frsc.2021.629940
Received: 16 November 2020; Accepted: 02 February 2021;
Published: 05 March 2021.
Edited by:
Paolo Santi, Massachusetts Institute of Technology, United StatesReviewed by:
Humberto Torres Marques-Neto, Pontifícia Universidade Católica de Minas Gerais, BrazilDimitri Thomopulos, University of Pisa, Italy
Copyright © 2021 Cheshmehzangi and Pourroostaei Ardakani. This is an open-access article distributed under the terms of the Creative Commons Attribution License (CC BY). The use, distribution or reproduction in other forums is permitted, provided the original author(s) and the copyright owner(s) are credited and that the original publication in this journal is cited, in accordance with accepted academic practice. No use, distribution or reproduction is permitted which does not comply with these terms.
*Correspondence: Ali Cheshmehzangi, YWxpLmNoZXNobWVoemFuZ2lAbm90dGluZ2hhbS5lZHUuY24=