 Vaibhav Bangar
 Amit Kumar Mishra
 Manish Jangid
 Prashant Rajput
- 1School of Environmental Sciences, Jawaharlal Nehru University, New Delhi, India
- 2Centre for Environmental Health, Public Health Foundation of India, Gurugram, India
In this study, we have coupled measurements, modeling, and remote sensing techniques to better delineate the source characteristics and variability of air pollutants in Delhi primarily during the post-monsoon season in 2019. We show a comparison of ambient PM2.5 (particulate matter having aerodynamic diameter ≤2.5 μm) levels and associated elements during the post-monsoon with those during a relatively clean season of monsoon (experiencing frequent wet precipitation). Air-mass back trajectories from Hybrid Single-Particle Lagrangian Integrated Trajectory (HYSPLIT) model have been used to infer the possible source pathways of PM2.5 impacting at the receptor site in Delhi. The average concentrations of PM2.5 during monsoon (June–July) and post-monsoon (October–November) were 42.2 ± 15.5 μg m−3 (range: 22–73 μg m−3) and 121.4 ± 53.6 μg m−3 (range: 46–298 μg m−3), respectively. The PM2.5 samples were analyzed for heavy and trace elements (Si, S, Na, Mg, Al, Cl, Ca, K, Ti, V, Cr, Mn, Fe, Ni, Cu, Br, Rb, Zr, and Pb) using an Energy Dispersive X-ray Fluorescence (ED-XRF) technique and their concentrations have been used to carry out the source-apportionment utilizing principal component analysis (PCA) tool. The PCA analysis has identified three major sources of fine aerosols including contributions from the sources viz. vehicular emission, biomass burning, coal combustion, secondary aerosols formation, soil dust, solid-waste burning and industrial emission. The source involving biomass burning contributed largely to the PM2.5 in post-monsoon season through long-range transport of large-scale agriculture-residue burning emissions (occurring in the states of Punjab, Haryana, and western part of Uttar Pradesh). The industrial emissions include primarily, medium- and small-scale metal processing industries (e.g. steel sheet rolling) in Delhi-National Capital Region. Traces of emission from coal based thermal power plants and waste incineration have also been observed in this study.
Introduction
Clean and healthy air is essential to all life on earth and is crucial for the well-being of human beings and the optimum performance of its supporting ecosystems. However, industrialization and urbanization have severe detrimental effects on the natural environment, be it air, water, or the soil (Kushwaha et al., 2012). The atrocious levels of particulate matter (PM) pollution in the atmosphere has created a disconcerting situation across the world's scientific and political communities, especially in developing countries due to their climatic and human health impacts (Khodeir et al., 2012; World Health Organization, 2016). PM pollution alters the composition and chemistry of the lower atmosphere, degrades air quality, reduces visibility and impacts the global climate (Khain and Pinsky, 2018). Numerous harmful impacts of PM exposure such as pulmonary and cardiovascular diseases, allergies and premature deaths have been evinced in several epidemiological studies (Badyda et al., 2016; Ghude et al., 2016). A recent research has reported that more than 75% people in India are imperiled with PM2.5 levels >40 μg m−3, a limit set by the National Ambient Air Quality Standards (Balakrishnan et al., 2019). The study has also mentioned that exposure to ambient PM2.5 resulted in ~9.8 lakhs premature deaths in a year and is of the major concern to human health point of view. Another research has estimated that PM2.5 exposures could lead to average loss of life expectancy (LLE) of 3.4 years for the country with the highest value of LLE of 6.3 years for Delhi (Ghude et al., 2016).
Recent studies have established that the impact of PM2.5 on human health cannot be only connected directly to the total mass concentration but also to the toxicity of particulate matter constituents (Yadav and Phuleria, 2020), specifically trace metals (Lippmann and Chen, 2009; Stanek et al., 2011). It is also imperative to analyze the seasonal variation of PM2.5 in the ambient air due to its high association with meteorological parameters such as relative humidity, wind speed, temperature, and precipitation (Das et al., 2020). Thus, a good understanding about chemical composition and emission sources of PM along with its seasonal variability is essential for attributing its major impacts and developing effective and efficient mitigation policy strategies (Bangar et al., 2020).
PM2.5 has myriads of natural and anthropogenic sources and is known to originate from the combustion of fossil fuels, biomass burning, soil dust, coagulation of ultrafine particles, reactions in water droplets, and condensation of gaseous organic and inorganic molecules, among others (Sioutas et al., 2005; Edgerton et al., 2009). Studies on elemental composition associated with fine PM in India have revealed that the urban population is particularly exposed to elevated levels of elements including Na, K, Mg, Al, Ca, S, Si, Cl, Cr, Ti, As, Br, Pb, Fe, Zn, and Mn due to vehicular emissions, biomass burning, industrial emissions, and soil dust uplift (Kulshrestha et al., 2009; Murari et al., 2015; Sharma and Mandal, 2017). The extent of health impact and toxicity of PM varies as a function of its composition and source, thus making it essential to conduct source apportionment analysis to comprehend the sources contributing to the PM budget over a receptor site (Jain et al., 2020).
Receptor models use a multivariate statistical approach to identify and quantify the sources of air pollutants, assuming the mass conservation between the emission sources and receptor site (Hopke et al., 2006). In India, source apportionment studies for PM have been performed using different receptor models viz. chemical mass balance (CMB) (Sharma and Patil, 1994; Srivastava et al., 2005; Srivastava and Jain, 2008; Gummeneni et al., 2011), positive matrix factorization (PMF) (Jain et al., 2020; Tobler et al., 2020), and principal component analysis (PCA) (Karar and Gupta, 2007; Suman and Pal, 2010; Hazarika et al., 2015). Valuing the importance and possibility of identifying PM sources, the present study has been conducted using PCA. PCA can proficiently perform the source apportionment analysis without any prerequisite for source profile of constituents associated with PM (Karagulian and Belis, 2012).
The capital city of India (Delhi) is one of the most populous and drastically polluted cities on earth (Bhat, 2020). The rapid rise in demands for housing and infrastructure, production and manufacturing industries, motorized vehicles, and lack of adequate air pollution control programmes have exaggerated the health risks due to PM exposures in the city (Das et al., 2020). Sharma et al. (2016a), using a receptor model technique, identified that transport sector, biomass burning, and industry are the major contributors of PM2.5 in Delhi during the winter season. For summer season, Sharma and Mandal (2017) identified long-range transport of soil dust from regional and transboundary areas as the key contributor of PM2.5. Several other studies have also presented quite similar results; however, comprehensive studies comparing seasonal variation in PM concentrations, and elemental composition as well as confirming the sources of PM pollution (using modeling and remote sensing techniques) in India are scarce. The present work is an effort to distinguish the major sources of PM pollution in Delhi by incorporating measurements, modeling and remote sensing techniques with an aim to assist policymakers in developing improved and enhanced pollution control strategies to curb PM pollution. The current study emphasizes on analyzing the seasonal variations (monsoon and post-monsoon season) in the elemental composition of PM2.5 and its source-apportionment during post-monsoon season in the year 2019. Samples of PM2.5 were collected at Jawaharlal Nehru University, New Delhi, India and were assessed for elemental analysis using EDXRF (Energy Dispersive X-Ray Fluorescence). It is an extensively utilized method for the quantification of trace elements in airborne PM due to its non-destructive technique which provides elemental composition results quickly without any chemical pre-treatment (Nascimento Filho, 1999; Zucchi et al., 2000; Öztürk et al., 2011). The measured elemental composition was then used as an input to run the PCA model to quantify the sources contributing to PM2.5 primarily for the post-monsoon season. Due to limited number of samples (n = 20) the PCA analysis was not performed for the monsoon season dataset. Moreover, the air-mass back-trajectories were also utilized in the study to understand the impact of distant sources regions on the PM2.5 loading at the receptor site.
Methodology
Sampling Site
Samples of PM2.5 were collected at Jawaharlal Nehru University (JNU), New Delhi (28.539°N, 77.167°E), India on the rooftop (16 m height) of the School of Environmental Sciences (SES) in the year 2019. The map of the sampling site is shown in Figure 1 (source: Google maps and ArcGIS Pro version 1.2.0) and the locations of all the sites (sampling site and CPCB sites) have been marked. JNU is located in the south-west region of Delhi, in an environmentally sensitive area and extends over a large space of natural vegetation in an area of ~800 acres. The sampling site is distant from any principal industrial activities; however, it is surrounded by major roads with high traffic density. Inside the campus the traffic density is relatively very low. The major landform features around Delhi are the Himalayas lying in north-northeast of Delhi approximately at a distance of 160 km, the Thar Desert of Rajasthan lying in the west and the alluvial plains in the south and east of Delhi. Delhi, with a population of more than 16 million people and over 10 million registered vehicles (Rai et al., 2020) remains choked with heavy air pollution, especially in the winter season due to temperature inversion and shallow boundary layer height which entraps a massive amount of pollutants near the ground level (Hazarika et al., 2015).
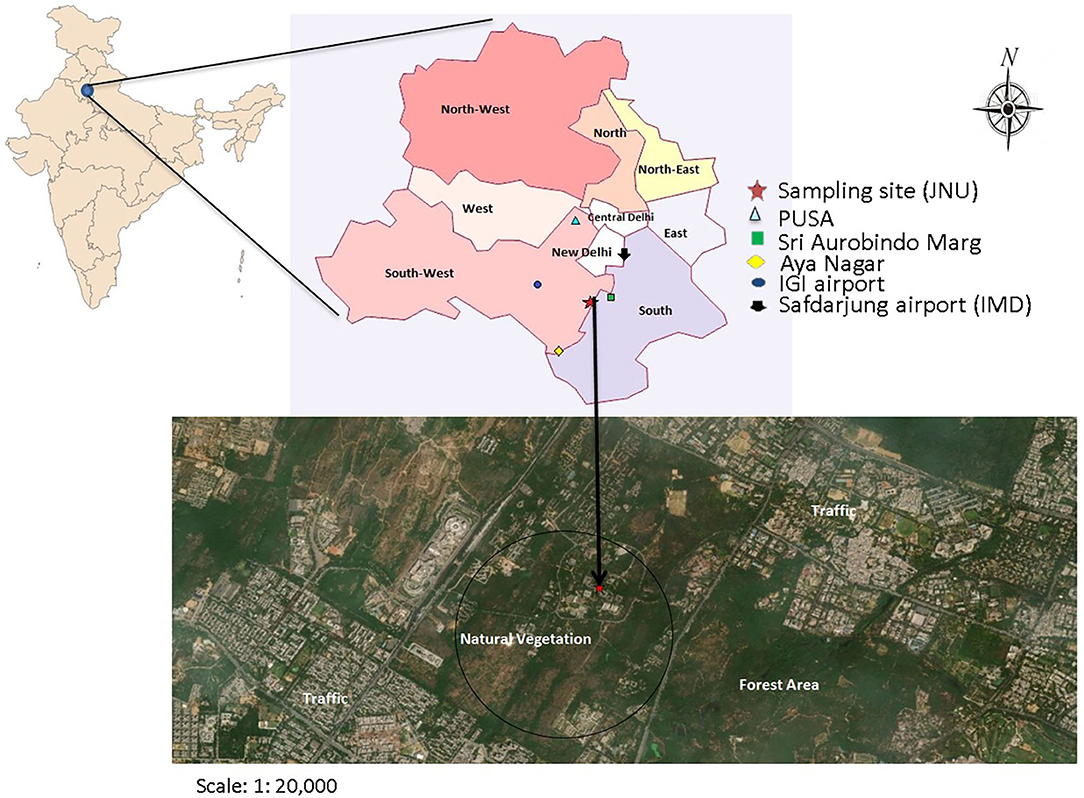
Figure 1. Map of sampling site. All PM2.5 measurement sites (JNU, PUSA, Sri Aurobindo Marg, Aya Nagar, IGI airport) and Meteorological measurement site (Safdarjung airport) are shown by legends on Delhi map. Google map of region (marked by vegetation and traffic locations) near the sampling site (JNU) is shown in the lower panel.
PM Sample Collection and Analysis
PM2.5 sampling during the monsoon (21 June−13 July, 2019; n = 20) and the post-monsoon (11 October−20 November, 2019; n = 40) seasons was done using a Fine Particulate Air Sampler (APM 550, Envirotech, India). The mean flow rate of the sampler was maintained at 1 m3 h−1 (accuracy ±2%). The sampler was operated for 24 h (8:00 a.m.−8:00 a.m.), and the volume of the air filtered during each sample collection was used to deduce the mass concentrations of PM in the ambient atmosphere. Standard protocol for the sample collection and storage until chemical analysis has been followed as prescribed by the Central Pollution Control Board (CPCB), India.
The samples were collected on the hydrophobic PTFE filter (Fluoropore, FHUP04700) of 47 mm diameter. The moisture of the filters (before and after sampling) was removed by desiccating them in a silica based desiccator. The initial and final weight of the filter substrate was determined on a microbalance and the PM2.5 concentration was calculated using the standard gravimetric method. The meteorological data of temperature, humidity and wind speed was taken for both the seasons from Safdarjung airport (IMD: Indian Meteorological Department) site.
For the quantification of metals in PM2.5, an Energy Dispersive X-ray fluorescence spectrometry (ED-XRF) was used for its non-destructive mechanism and quick analysis (Khodeir et al., 2012; Moriyama et al., 2014; Shaltout et al., 2017). In the present study, a total of 19 heavy and trace elements (Si, S, Na, Mg, Al, Cl, Ca, K, Ti, V, Cr, Mn, Fe, Ni, Cu, Br, Rb, Zr, and Pb) were analyzed using ED-XRF (PANalytical Epsilon 5 analyzer). The quality control and analysis (QC and QA) have been carried out during the elemental analysis on ED-XRF. The apparatus was set up with standard reference material (NIST SRM 2783). The instrument was pre-calibrated using the XRF standard BRPC3 and it performs a semi quantitative analysis. Semi-quantitative analysis allows the users to compare spectral data from samples in order to ascertain relative elemental concentration between samples. Accordingly, the uncertainty in the concentration of elements on ED-XRF was found to be within 10%. The lower limit of detection (LLD) of each element for ED-XRF is provided in Supplementary Table 1. The description of elemental analysis using ED-XRF and detailed methodology for calculating the concentration of individual elements are provided in the previous literatures (Maciejczyk et al., 2005; Hazarika et al., 2015). In the present study, the concentration of each element in ng/m3 was calculated using the following equation (Hazarika et al., 2015):
where EDXRF value denotes the concentration of element x in ppm, difference in filter weight (pre- and post-sampling) is in milligrams and the volume of air sampled is in m3.
Air-Mass Backward Trajectory Analysis
The fine PM has relatively a high residence time, and it can undergo long-range transport in the ambient atmosphere (Maenhaut et al., 2016). Therefore, to understand the origin of PM2.5 and its long-range transport pattern to the sampling site, the air-mass backward trajectory analysis was done using the Hybrid Single Particle Lagrangian Integrated Trajectory (HYSPLIT) model. Daily GDAS (1 degree, global) meteorological files were accessed to compute the 72-h back trajectories at 500 m and 1,000 m above the ground level (AGL) for each day and night of the sampling campaign. These heights were chosen to represent winds in the boundary layer and to eliminate local land cover and topographic effects. AIRS (Atmospheric Infrared Sounder) dust score data from NASA website (URL: https://earthdata.nasa.gov/labs/worldview/) and MODIS Moderate Resolution Imaging Spectroradiometer fire count data (URL: https://earthdata.nasa.gov/active-fire-data) was overlaid on a true color image to locate the geographical regions responsible for enhancing the aerosol concentrations at the sampling site. AIRS dust score layer shows the level of dust aerosols in the Earth's atmosphere and the areas affected by it. Whereas, the MODIS thermal anomalies data is a fire product in which active fires and other thermal anomalies are identified using thermal anomalies algorithm (Giglio et al., 2003).
Source Apportionment Using PCA
The source apportionment analysis of PM2.5 was carried out only for the post-monsoon season using the Principal Component Analysis (PCA). PCA is a statistical tool which explains the variance of a large amount of data having inter-correlated variables and transforms it into a smaller dataset of independent variables called principal components (PC) (Thurston and Spengler, 1985; Sharma et al., 2016b). In PCA, the factor loadings or PC identify the sources associated with pollution based on the correlation of individual pollutant species with each component. The pollutant species highly correlated with individual PCs indicates the association of that PC with the source emission composition (Johnson et al., 2015). In the present analysis, PCA has been performed with a statistical software SPSS (Version 25) following the Varimax Rotation method. This method maximizes the variance of the squared elements in the column of a factor matrix. In PCA, the first PC explains the most significant fraction of the original variables, while the second PC estimates a reduced fraction of the original variable in comparison with the first PC and so on (Sousa et al., 2007). PCA begins by normalizing the set of variables as Zij using equation (1), so that the variance of this set of variables is unity.
Where Cij is the concentration of jth species in the ith sample; and δj are the average concentration and standard deviation of that species j. The fundamental operation of PCA can be expressed by equation (2) indicating that it splits the data matrix into two matrices Gik (factor loading) and Hkj (factor score), as shown below:
Here, i, j, and k represent the index for sample, species and factors, respectively. Eij represents the residual matrix. The two vectors G and E are unknown in the factor analysis (FA) and are obtained by assuming various covariance relationships between the vectors H and E and finally Varimax rotation of matrix is applied to minimize the datasets of elements having high loading factor (Kumar et al., 2001). As the factor load of the variable increases, the identification of the possible source of components also increases (Henry, 2003). The detailed methodology for air pollutant's source identification and apportionment using PCA is provided in Chavent et al. (2009). In the present study PCA was carried out utilizing elemental concentration data of 40 samples for the post-monsoon season. Numerous other studies have employed PCA for source apportionment using limited data points viz; Hazarika et al. (2015) utilized data from 12 samples for each season (summer, winter and monsoon) to perform PCA analysis, Liu et al. (2018) utilized data from 15 day samples, similarly Zhang et al. (2019) and Kanellopoulos et al. (2020) also utilized limited data set to carry out source apportionment analysis using PCA.
Results and Discussion
Seasonal Variability of PM2.5 and Air-Mass Back Trajectory Analysis
In total, 60 samples were collected to ascertain the seasonal variation in PM2.5 concentrations during monsoon (n = 20 samples) and post-monsoon (n = 40 samples) seasons. Average mass concentrations were found to be 42.2 ± 15.5 μg m−3 (range: 21.8–72.5 μg m−3) and 121.4 ± 53.6 μg m−3 (range: 45.9–298.1 μg m−3) in monsoon and post-monsoon seasons, respectively. The PM2.5 data monitored by the Central Pollution Control Board (CPCB) at four nearby sites (Aya Nagar, IGI Airport, PUSA and Sri Aurobindo Marg) was also taken into account to assess the spatial heterogeneity in PM2.5 mass concentrations. Figure 2 shows the temporal variability of PM2.5 concentrations at the sampling site along with the mean concentration for the aforementioned nearby CPCB sites. The average PM2.5 concentration at the sampling site i.e., JNU is lower than the other adjoining areas particularly in the post-monsoon season. The temporal variation of PM2.5 mass concentrations for all sites during both the seasons are provided in Supplementary Figure 1. The average PM2.5 mass concentrations at JNU and that integrated for the four CPCB sites were 42.2 μg m−3 and 44.3 μg m−3 in the monsoon season and 121.4 μg m−3 and 183.3 μg m−3 in the post-monsoon season. This can be attributed to the vast tract of natural vegetation and the low traffic density in the University campus site (JNU).
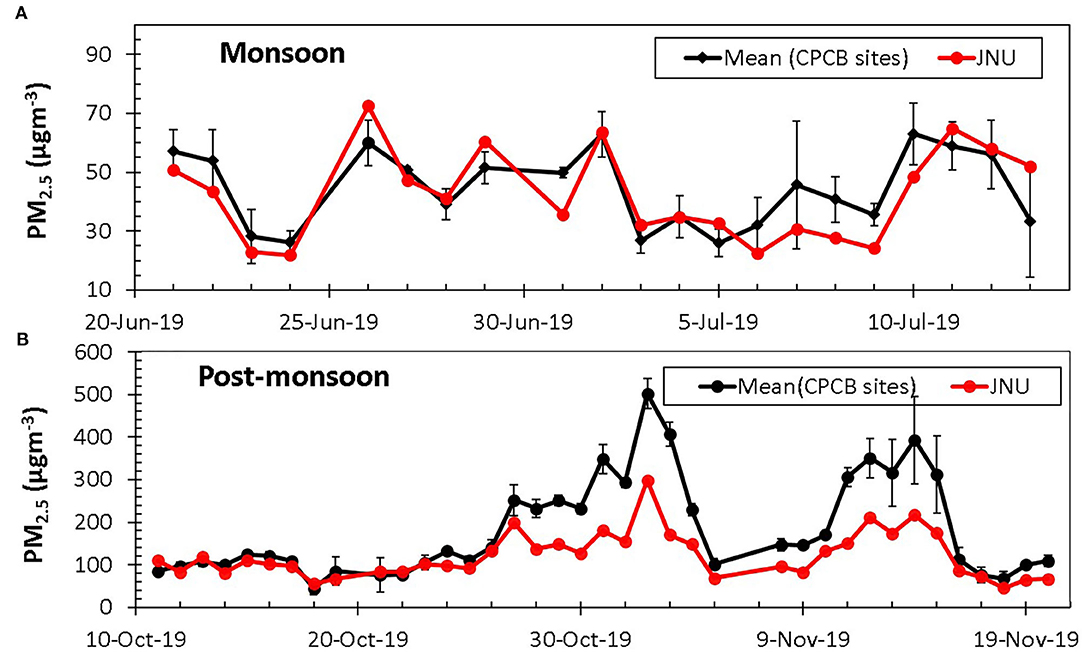
Figure 2. Temporal variation of PM2.5 concentrations (μg m−3) at JNU (sampling site, shown by red color) and mean PM2.5 concentrations for four CPCB sites (shown by black color, standard deviation is shown by vertical black lines) during (A) monsoon (21 Jun−13 July 2019) and (B) post-monsoon (11 Oct−20 Nov 2019) seasons.
Figure 3 shows the daily variation of meteorological parameters (temperature, humidity and wind speed) during both the sampling seasons. It is apparent from the figure that the monsoon season was warmer than the post-monsoon season. The wind speed in the monsoon season was also higher than the post-monsoon season. However, the relative humidity appeared to be higher in the post-monsoon season as compared to the June–July period of the monsoon season. It is evident from Figure 2 that the mean concentration of PM2.5 was substantially higher in the post-monsoon season than the monsoon season. The previous studies conducted in Delhi assessing seasonal variations in PM2.5 also showed an increased concentration in post-monsoon and winter season with respect to the monsoon season (Mandal et al., 2014; Gopalaswami, 2016; Panda et al., 2016; Sharma and Mandal, 2017; Jain et al., 2020). The most plausible explanation for lower PM2.5 mass concentrations during the monsoon season relates to the high ventilation and dispersion of pollutants as well as occurrence of frequent precipitation leading to washout of the air pollutants during the monsoon (Jain et al., 2020). In the post-monsoon season, activities such as stubble (agriculture residues) burning in the fields of Haryana, Punjab, and western part of Uttar Pradesh, firecrackers burst during Diwali festival along with prevailing meteorological conditions such as minimal wind speed, shallow boundary layer height, and geographical settings (Himalayan range in the north and Deccan Plateau in the south) results into entrapment of a large amount of PM2.5 near the ground level over the study region (Perrino et al., 2011; Rai et al., 2020). Kulshrestha and Kumar (2014) in their review report highlighted the need and significance of trajectory analysis for identifying the sources of PM pollution in South Asia.
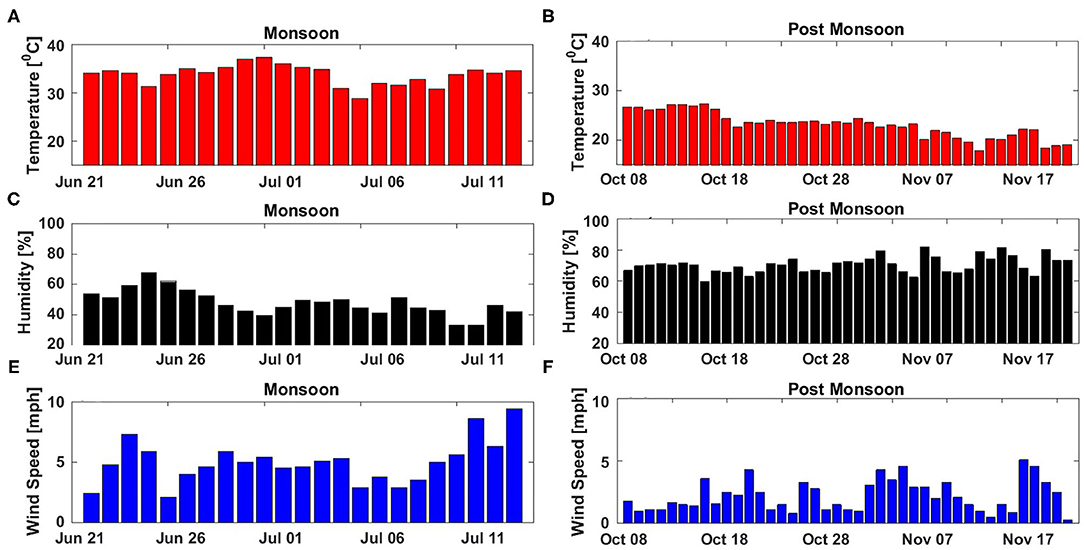
Figure 3. Daily variation of meteorological parameters; (A,B) air temperature (in °C), (C,D) humidity (in %), and (E,F) wind speed (in mph) during the monsoon (21 June −13 July 2019) and post-monsoon (11 Oct−20 Nov 2019) seasons, respectively.
The results from HYSPLIT back trajectory analysis indicating for the long-range transport of air masses at the sampling site are illustrated in Figures 4A–E. Air-mass back trajectories for a particular season do not look very different at two different altitudes, i.e., 500 and 1,000 m. During the monsoon season, the 72-h back trajectory indicated that the air masses traveled longer distances due to higher wind speed (Figures 4A,B). Most of the air masses in this period advanced to the receptor site from Indo-Gangetic Plain (IGP), Rajasthan, Gujarat, Pakistan, and the northern Arabian Sea, along with traces of air masses from Middle-East and the northern Bay of Bengal. The AIRS dust score overlaid on a true color image from MODIS shown for 24 June 2019 (Figure 4C) indicated for a strong dust layers in the atmosphere over Pakistan, Middle East and parts of the Arabian Sea which indicates that maybe the dust particles from these places would have transported over the receptor site. However, clean air mass from the Arabian Sea and Bay of Bengal would have diluted the overall dust load impact from these places at the receptor site. Sharma and Mandal (2017) made similar observations with the air-mass trajectory analysis during the monsoon season of 2013 over Delhi. Sharma et al. (2010) in their study of SO2 variation over Delhi also highlighted the long-range transport of air-masses from sources pointing toward western and southwestern regions in the monsoon season.
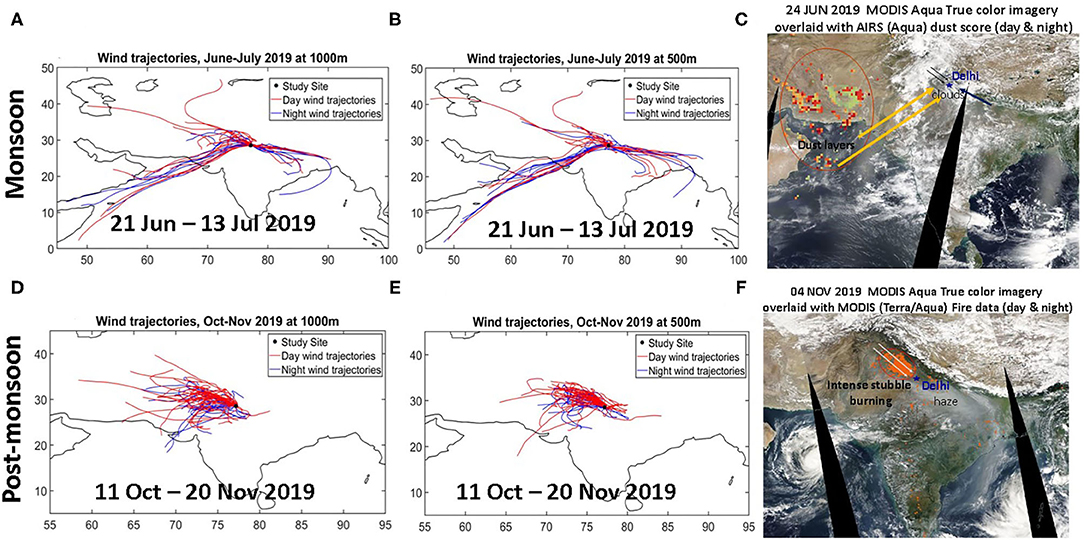
Figure 4. HYSPLIT derived air-mass back trajectories during (A,B) monsoon (21 Jun−13 Jul 2019) season and, (D,E) post-monsoon (11 Oct−20 Nov 2019) season at 1,000 m and 500 m. Day time and night time wind trajectories are shown by red and blue colors, respectively. (C) MODIS aqua true color imagery overlaid with AIRS dust scores for 24 Jun, 2019 (major wind direction at receptor site are shown by arrows). (F) MODIS aqua true color imagery overlaid with MODIS fire counts for 4 Nov, 2019 (major wind direction at receptor site are shown by arrows).
In the post-monsoon season (Figures 4D,E), the back-trajectory showed that the air masses have covered shorter distance, attributable to the lower wind speed, before arriving at the receptor site. The air masses in this period were approaching the receptor site mainly from states of Haryana, Punjab, IGP region, Rajasthan, and Pakistan. The MODIS fire count data plot (Figure 4F) for 04 November 2019 exhibits an intensive stubble burning in Punjab, Haryana and western part Uttar Pradesh indicating that high concentration of PM (and gaseous pollutants) from biomass burning emission could severely impact the air quality at the receptor site. Moreover, emissions from numerous industries operating in Delhi would also contribute to PM loading at the receptor site. Therefore, higher concentration of PM2.5 in the post-monsoon season can be attributed to the combined effect of lower wind speed, shallower boundary layer height, and the high incidence of stubble burning which increases the aerosol load over Delhi (Kanawade et al., 2020). For post-monsoon season similar results mentioning stable meteorological conditions leading to accumulation of local and transboundary pollutants have been mentioned in the previous studies conducted in Delhi (Tiwari et al., 2013; Panda et al., 2016; Cusworth et al., 2018; Kulkarni et al., 2020; Nair et al., 2020). In sharp contrast, the precipitation and high wind speed lead to lowering the concentration of atmospheric particles during the monsoon season (Sharma et al., 2016a). It is worth mentioning that the aerosols sampling was performed for 60 days, spread over both the seasons, and we found that the PM concentrations exceeded the NAAQS (National Ambient Air Quality Standard) standard value for more than 70% of the days. This is coherent with the other research work carried out over the Delhi (Pachauri et al., 2013; Tiwari et al., 2013; Sahu and Kota, 2016; Das et al., 2020; Jain et al., 2020).
Elemental Composition of PM2.5
Figure 5 shows the percentage elemental composition of fine particulates for both seasons [(a) monsoon and (b) post-monsoon]. The daily variations in the percentage elemental composition of PM2.5 for both the seasons are shown in Supplementary Figure 2. The temporal variations in concentration of the analyzed elements associated with PM2.5 for both the seasons are depicted in Supplementary Figures 3A–C. The result of the current study showed that the average concentrations of elements were found in the decreasing order of Si>Al>Na>Mg>S>Ca>Cl>K>Fe for the monsoon season and S>Al>Na>Si>Cl>K>Mg>Ca>Fe for the post-monsoon season. The presence of Si, Al, Na, Mg, S, Ca, Fe and K as major elements associated with PM2.5 is in agreement with other studies conducted in Delhi by Jain et al. (2017) and Sharma and Mandal (2017). Hazarika et al. (2015) also observed Na, Ca, Si and K as abundant elements in PM2.5 followed by Ni, Cu and Pb. However, in the present study, the mean elemental concentration of individual elements was comparatively less than the previous studies conducted in Delhi. The relative contribution of elements associated with crustal or natural origin such as Si, Al, Na and Mg (Pipal et al., 2014; Ali et al., 2019; Rai et al., 2020) accounted for 87% of the elemental composition of PM2.5 in the monsoon season, whereas in the post-monsoon season these elements accounted only for 57% (Figure 5). The element which contributed the most to the fine particulate was Silicon (Si) 39% in the monsoon season and Sulfur (S) 30% in the post-monsoon season. The high concentration of Si could be attributable to uplifted mineral dust contribution, whereas elevated S content may have contribution from coal combustion and agricultural-residue (biomass) burning (Sternbeck et al., 2002; Perrino et al., 2011). The sources of soil/road dust in the atmosphere include transboundary transport from deserts or entrainment from paved or unpaved roads, construction activities, and agricultural practices (Kulshrestha et al., 2009; Tiwari et al., 2013).
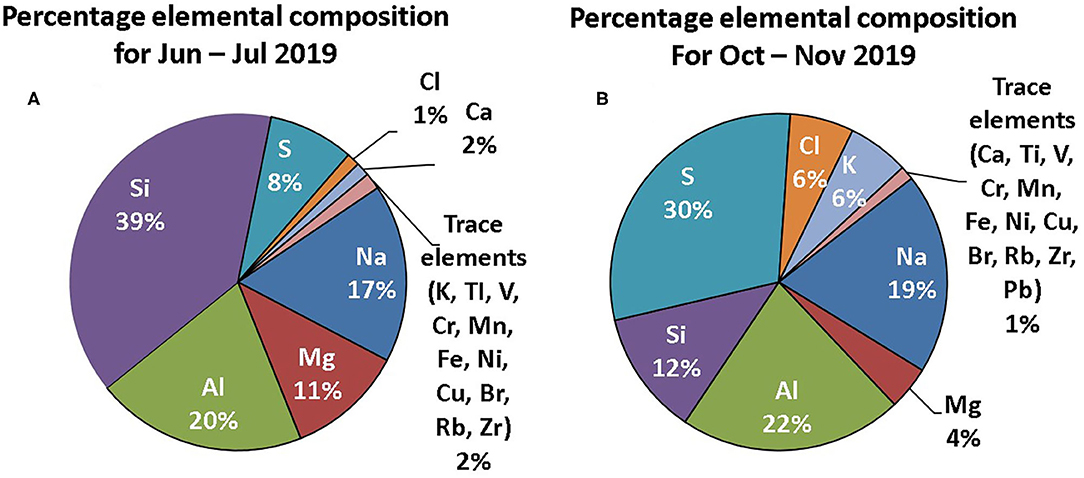
Figure 5. Percentage elemental composition of PM2.5 during (A) monsoon (21 Jun−13 July 2019) and (B) post-monsoon (11 Oct−20 Nov 2019) seasons.
Moreover, the contribution of Potassium (K), Chlorine (Cl), and Lead (Pb) have been found to increase in the post-monsoon season due to different reasons. Higher concentration of K can be attributed to local biomass burning (in addition to some fraction from upper continental crust) for space heating and agricultural residue burning (Liu et al., 2018; Das et al., 2020); Cl can have contributions from lubricants, diesel fuels, coal combustion, biomass burning, and plastic and paper burning (Singhai et al., 2017; Chang et al., 2018); Pb to ore and metal processing, lead-acid battery production/recycling as well as waste incineration (Bukowiecki et al., 2009; Kothai et al., 2011). Summing up, the post-monsoon season witnessed a substantial increase in PM2.5 concentrations predominantly due to the anthropogenic emissions (as suggested by elevated levels of S, K, Cl, Pb) with a relatively low contribution of mineral dust as compared to the scenario in monsoon season. Similar remarks have been noticed before in the previous research works (Khodeir et al., 2012; Das et al., 2020; Jain et al., 2020; Rai et al., 2020). Within the trace elements, three carcinogenic heavy metals were identified, i.e., Ni, Cr and Pb, that may pose substantial risk to humans (Liu et al., 2015). The estimated concentration of these elements is depicted in Supplementary Figure 3B. However, their concentration in this study was found well within the limits prescribed by the World Health Organization (WHO). The comprehensive details on source apportionment of PM2.5 based on associated metals profile are discussed in the following section.
Source Apportionment
To distinguish the possible sources of fine fraction particulate matter, the principal component analysis (PCA) was carried out. Based on the eigenvalues >1, PCA segregates the data into several clusters known as principal components (PC), which also indicate the contribution of each dependent variable (which in this study is the element concentration) in terms of factor loadings. The PCA was performed using the data set consisting of 19 elemental species in 40 PM2.5 samples (during the post-monsoon season) collected at JNU site in Delhi. Table 1 shows the output of PCA analysis using SPSS (IBM, SPSS, version 25) software for the post-monsoon season. The correlation matrices for all 19 elements during both the seasons are shown in Supplementary Tables 2, 3. Figure 6 shows the possible sources of PM2.5 pollutions in the post-monsoon season as identified using PCA. The total variance explained for the sources of PM2.5 during post-monsoon season (81.7%) using PCA are provided in Supplementary Table 4.
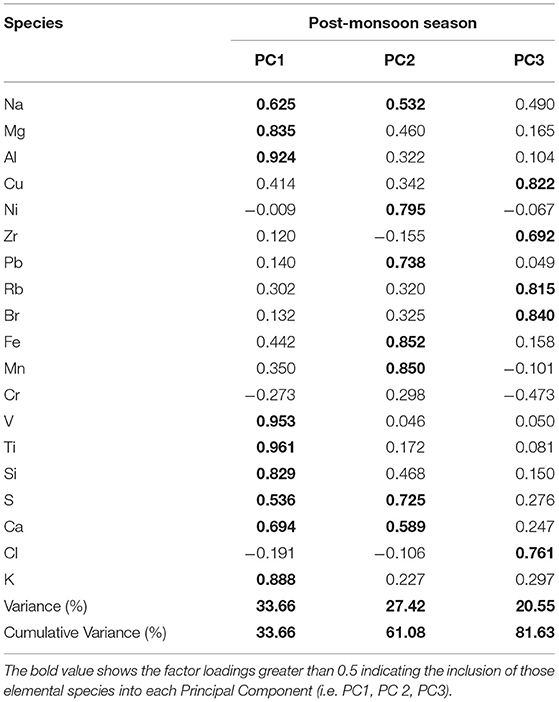
Table 1. Summary of principal component analysis (PCA) of elements associated with PM2.5 over Delhi during the post-monsoon season.
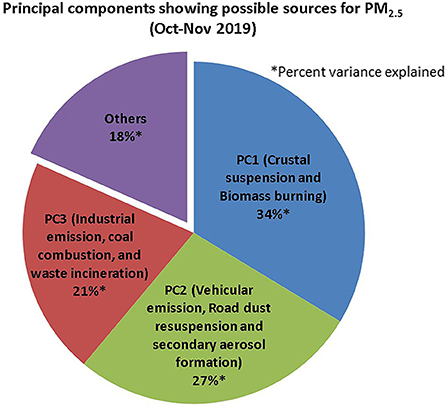
Figure 6. Source-apportionment of PM2.5 derived from PCA analysis during the post-monsoon (11 Oct−20 Nov 2019) season.
During the post-monsoon season, the PCA analysis revealed three factors, accounting for 81.7% of the total variance. The first PC explained 33.7% of the overall variance with an eigenvalue of 6.39 with high loadings of Na, Mg, Al, K, Ca, Ti, V and Si. Perrino et al. (2011) and Sharma et al. (2016a) reported that crustal dust is the major source of Si, Na, Mg, Ca, Ti, and Al in particulate matter. Therefore, this factor can be well-associated with crustal suspension. The % contribution of these elements (Figure 5) to fine particulate matter was relatively low in the post-monsoon season with respect to the monsoon season possibly due to low wind speed and boundary layer height leading to a lower resuspension of mineral dust in the ambient atmosphere. The Potassium (K) content, however, increased substantially owing to stubble/agriculture residue burning in the surrounding regions [as K is a tracer of biomass burning (Khare and Baruah, 2010)]. Similar results have been perceived in several other studies over Delhi (i.e., Jain et al., 2020; Rai et al., 2020). Therefore, this factor should be identified as crustal suspension and biomass burning. The second component with eigenvalue 5.21 represented 27.4% of the total variation with high loadings of S, Mn, Ni, Fe, and Pb. While Ni is related to vehicular emission especially with heavy diesel based vehicles (Khanna, 2015; Das et al., 2020), the elements such as Ni, Pb, Fe, and Mn are well associated with vehicular emissions mixed with road dust resuspension (Sternbeck et al., 2002; Khanna, 2015; Liu et al., 2015; Pant et al., 2015). The high concentration of S could be associated with coal combustion and secondary aerosols formation (Gummeneni et al., 2011). Therefore, this factor can be attributed to the vehicular emission, road dust resuspension, and secondary aerosols formation.
The third factor explains 20.6% of the overall variance with an eigenvalue of 3.9 and is strongly correlated with the elements Br, Cl, Cu, Rb, and Zr. These elements can have origin from industrial activities and solid-waste burning (Khodeir et al., 2012). Br in previous studies has been identified as the element associated with industrial emissions probably from various drug and chemical manufacturing industries (Kothai et al., 2011). Halogens can also be produced from solid-waste burning. In Delhi, most of the incineration of dumped waste occurs in three locations viz, Okhla (also a major industrial area in South Delhi), Bhalswa (North Delhi) and Ghazipur (East Delhi) (Ghosh et al., 2019). Moreover, in post-monsoon and winter season, brick kilns have been reported to function in areas encompassing Delhi, and they can possibly elevate the Cl concentrations in the atmosphere. These brick kilns are operating in large numbers around Delhi-NCR (National Capital Region) due to heavy demand in the infrastructure sector (Rai et al., 2020). These traditional kilns use coal and biomass as fuel to bake bricks which could emit a large amount of Cl and Br (Rai et al., 2020). Cu, Rb and Zr are associated with industrial emissions from different electroplating and other alloy manufacturing industries (Hazarika et al., 2015). Chowdhury et al. (2017) in their study in Delhi have indicated major point sources of emissions from coal based thermal power plants as well as major industrial areas located in central, northern, and eastern part of Delhi. The total number of coal based thermal power plants in Delhi-NCR is 6. These power plants and numerous industrial areas emit large amount of PM and other pollutants (Mittal et al., 2012). Therefore, this factor can be represented as coal combustion, industrial emissions, and waste incineration.
Conclusions
The seasonal variation in mass concentration and elemental composition of PM2.5 was analyzed for the monsoon (June–July) and post-monsoon (October–November) seasons in 2019 at Delhi, India. The average PM2.5 concentrations for the monsoon and post-monsoon season were 42.2 ± 15.5 μg m−3 and 121.4 ± 53.6 μg m−3, respectively. High wind speed and low relative humidity (%) were observed in the June–July months of monsoon season as compared to those during the post-monsoon season. The elements that contributed most to the PM2.5 compositions were Si, Al, Na, and Mg in the monsoon season and S, Al, Na, Si, K and Cl in the post-monsoon season. Air-mass back trajectory analysis was performed to distinguish the major atmospheric pathways through which the air pollutants particularly PM2.5 are impacting at the receptor site. High transboundary contribution to PM2.5 was observed in the monsoon season, whereas in the post-monsoon season the contribution was by-and-large from the regional sources. PCA analyses, during the post-monsoon season, identified the major sources as (i) biomass burning and uplifted mineral dust, (ii) vehicular emissions, road dust resuspension, and secondary aerosols formation, and (iii) industrial emission, coal combustion, and solid-waste burning. These results were supported by the AIRS dust score and MODIS fire count data. The present study aims to assist the stakeholders and policymakers to better understand the characteristics of PM2.5 during the post-monsoon season and to design and implement effective and efficient policy strategies to curb the problem of PM2.5 pollution in Delhi.
Data Availability Statement
The original contributions presented in the study are included in the article/Supplementary Material, further inquiries can be directed to the corresponding author/s.
Author Contributions
AM and VB have designed the work and drafted the manuscript. VB, MJ, and AM have collected the required data. Data analysis, data interpretation and final editing is done by AM, VB, MJ, and PR.
Conflict of Interest
The authors declare that the research was conducted in the absence of any commercial or financial relationships that could be construed as a potential conflict of interest.
Acknowledgments
AM would also like to thank DST Purse grant and DST INSPIRE Faculty grant [DST/INSPIRE/04/2015/003253] to provide necessary funds for consumables and analysis cost. Authors would like to acknowledge the Advanced Instrumentation Research Facility (AIRF) at Jawaharlal Nehru University (JNU), New Delhi to facilitate ED-XRF analysis. Authors would like to thank three reviewers and editor for their valuable comments and suggestions.
Supplementary Material
The Supplementary Material for this article can be found online at: https://www.frontiersin.org/articles/10.3389/frsc.2021.648551/full#supplementary-material
References
Ali, K., Acharja, P., Trivedi, D. K., Kulkarni, R., Pithani, P., Safai, P. D., et al. (2019). Characterization and source identification of PM2. 5 and its chemical and carbonaceous constituents during Winter Fog Experiment 2015–16 at Indira Gandhi International Airport, Delhi. Sci. Total Environ. 662, 687–696. doi: 10.1016/j.scitotenv.2019.01.285
Badyda, A. J., Grellier, J., and Dabrowiecki, P. (2016). “Ambient PM2. 5 exposure and mortality due to lung cancer and cardiopulmonary diseases in Polish cities,” in Respiratory Treatment and Prevention ed Pokorski, M. (Cham: Springer), 9–17. doi: 10.1007/5584_2016_55
Balakrishnan, K., Dey, S., Gupta, T., Dhaliwal, R. S., Brauer, M., Cohen, A. J., et al. (2019). The impact of air pollution on deaths, disease burden, and life expectancy across the states of India: the Global Burden of Disease Study (2017). Lancet Planetary Health 3:e26–e39. doi: 10.1016/S2542-5196(18)30261-4
Bangar, V., Goyal, R., and Pandey, R. (2020). “Climate change responses and sustainable development: integration of mitigation and adaptation,” in Sustainable Development Goals eds Hazra, S., and Bhukta, A. (Cham: Springer), 203–214. doi: 10.1007/978-3-030-42488-6_13
Bhat, M. Y. (2020). “Environmental problems of Delhi and Governmental Concern,” in Global Issues and Innovative Solutions in Healthcare, Culture, and the Environment ed Mervio, M. (Hershey, PA: IGI Global), 133–67. doi: 10.4018/978-1-7998-3576-9.ch008
Bukowiecki, N., Lienemann, P., Hill, M., Figi, R., Richard, A., Furger, M., et al. (2009). Real-world emission factors for antimony and other brake wear related trace elements: size-segregated values for light and heavy duty vehicles. Enviro. Sci. Tech. 43, 8072–8078. doi: 10.1021/es9006096
Chang, Y., Huang, K., Xie, M., Deng, C., Zou, Z., Liu, S., et al. (2018). First long-term and near real-time measurement of trace elements in China's urban atmosphere: temporal variability, source apportionment and precipitation effect. Atmos. Chem. Phys. 18, 11793–11812. doi: 10.5194/acp-18-11793-2018
Chavent, M., Guegan, H., Kuentz, V., Patouille, B., and Saracco, J. (2009). PCA-and PMF-based methodology for air pollution sources identification and apportionment. Environmetrics 20, 928–942. doi: 10.1002/env.963
Chowdhury, S., Dey, S., Tripathi, S. N., Beig, G., Mishra, A. K., and Sharma, S. (2017). “Traffic intervention” policy fails to mitigate air pollution in megacity Delhi. Environ. Sci. Policy 74, 8–13. doi: 10.1016/j.envsci.2017.04.018
Cusworth, D. H., Mickley, L. J., Sulprizio, M. P., Liu, T., Marlier, M. E., DeFries, R. S., et al. (2018). Quantifying the influence of agricultural fires in northwest India on urban air pollution in Delhi, India. Environ. Res. Lett. 13:44018. doi: 10.1088/1748-9326/aab303
Das, A., Singh, G., Habib, G., and Kumar, A. (2020). Non-carcinogenic and carcinogenic risk assessment of trace elements of PM 2.5 during winter and pre-monsoon seasons in Delhi: a case study. Exposure Health 12, 63–77. doi: 10.1007/s12403-018-0285-y
Edgerton, E. S., Casuccio, G. S., Saylor, R. D., Lersch, T. L., Hartsell, B. E., Jansen, J. J., et al. (2009). Measurements of OC and EC in coarse particulate matter in the southeastern United States. J. Air Waste Manage. Assoc. 59, 78–90. doi: 10.3155/1047-3289.59.1.78
Ghosh, P., Shah, G., Chandra, R., Sahota, S., Kumar, H., Vijay, V. K., et al. (2019). Assessment of methane emissions and energy recovery potential from the municipal solid waste landfills of Delhi, India. Bioresource Tech. 272, 611–615. doi: 10.1016/j.biortech.2018.10.069
Ghude, S. D., Chate, D. M., Jena, C., Beig, G., Kumar, R., Barth, M. C., et al. (2016). Premature mortality in India due to PM2.5 and ozone exposure. Geophys. Res. Lett. 43, 4650–4658. doi: 10.1002/2016GL068949
Giglio, L., Descloitres, J., Justice, C. O., and Kaufman, Y. J. (2003). An enhanced contextual fire detection algorithm for MODIS. Remote Sens. Environ. 87, 273–282. doi: 10.1016/S0034-4257(03)00184-6
Gopalaswami, P. (2016). A study on effects of weather, vehicular traffic and other sources of particulate air pollution on the city of Delhi for the year (2015). J. Environ. Pollut. Human Health 4, 24–41. doi: 10.12691/jephh-4-2-1
Gummeneni, S., Yusup, Y. B., Chavali, M., and Samadi, S. Z. (2011). Source apportionment of particulate matter in the ambient air of Hyderabad city, India. Atmospheric Res. 101, 752–764. doi: 10.1016/j.atmosres.2011.05.002
Hazarika, N., Jain, V. K., and Srivastava, A. (2015). Source identification and metallic profiles of size-segregated particulate matters at various sites in Delhi. Environ. Monitoring Assessment 187:602. doi: 10.1007/s10661-015-4809-7
Henry, R. C. (2003). Multivariate receptor modeling by N-dimensional edge detection. Chemometr. Intelligent Lab. Syst. 65, 179–189. doi: 10.1016/S0169-7439(02)00108-9
Hopke, P. K., Ito, K., Mar, T., Christensen, W. F., Eatough, D. J., Henry, R. C., et al. (2006). PM source apportionment and health effects: 1. Intercomparison of source apportionment results. J. Exposure Sci. Environ. Epidemiol. 16, 275–286. doi: 10.1038/sj.jea.7500458
Jain, S., Sharma, S. K., Choudhary, N., Masiwal, R., Saxena, M., Sharma, A., et al. (2017). Chemical characteristics and source apportionment of PM 2.5 using PCA/APCS, UNMIX, and PMF at an urban site of Delhi, India. Environ. Sci. Pollut. Res. 24, 14637–14656. doi: 10.1007/s11356-017-8925-5
Jain, S., Sharma, S. K., Vijayan, N., and Mandal, T. K. (2020). Seasonal characteristics of aerosols (PM2. 5 and PM10) and their source apportionment using PMF: a four years study over Delhi, India. Environ. Pollut. 262:114337. doi: 10.1016/j.envpol.2020.114337
Johnson, G. W., Ehrlich, R., Full, W., and Ramos, S. (2015). “Principal components analysis and receptor models in environmental forensics,” in Introduction to Environmental Forensics eds Murphy, B. L. and Morrison, R. D. (Cambridge, MA: Academic Press), 609–653. doi: 10.1016/B978-0-12-404696-2.00018-7
Kanawade, V. P., Srivastava, A. K., Ram, K., Asmi, E., Vakkari, V., Soni, V. K., et al. (2020). What caused severe air pollution episode of November 2016 in New Delhi? Atmospheric Environ. 222:117125. doi: 10.1016/j.atmosenv.2019.117125
Kanellopoulos, P. G., Chrysochou, E., Koukoulakis, K., Vasileiadou, E., Kizas, C., Savvides, C., et al. (2020). Polar organic compounds in PM10 and PM2. 5 atmospheric aerosols from a background Eastern Mediterranean site during the winter period: Secondary formation, distribution and source apportionment. atmosphere. Environ. 237:117622. doi: 10.1016/j.atmosenv.2020.117622
Karagulian, F., and Belis, C. A. (2012). Enhancing source apportionment with receptor models to foster the air quality directive implementation. Int. J. Environ. Pollut. 50, 190–199. doi: 10.1504/IJEP.2012.051192
Karar, K., and Gupta, A. K. (2007). Source apportionment of PM10 at residential and industrial sites of an urban region of Kolkata, India. Atmospheric Res. 84, 30–41. doi: 10.1016/j.atmosres.2006.05.001
Khain, A. P., and Pinsky, M. (2018). Physical Processes in Clouds and Cloud Modeling. Cambridge: Cambridge University Press. doi: 10.1017/9781139049481
Khanna, I. (2015). Health risks associated with heavy metals in fine particulate matter: a case study in Delhi city, India. J. Geosci. Environ. Protect. 3:72. doi: 10.4236/gep.2015.32012
Khare, P., and Baruah, B. P. (2010). Elemental characterization and source identification of PM2. 5 using multivariate analysis at the suburban site of North-East India. Atmospheric Res. 98, 148–162. doi: 10.1016/j.atmosres.2010.07.001
Khodeir, M., Shamy, M., Alghamdi, M., Zhong, M., Sun, H., Costa, M., et al. (2012). Source apportionment and elemental composition of PM2. 5 and PM10 in Jeddah City, Saudi Arabia. Atmospheric Pollut. Res. 3, 331–340. doi: 10.5094/APR.2012.037
Kothai, P., Saradhi, I. V., Pandit, G. G., Markwitz, A., and Puranik, V. D. (2011). Chemical characterization and source identification of particulate matter at an urban site of Navi Mumbai, India. Aerosol Air Quality Res. 11, 560–569. doi: 10.4209/aaqr.2011.02.0017
Kulkarni, S. H., Ghude, S. D., Jena, C., Karumuri, R. K., Sinha, B., Sinha, V., et al. (2020). How much does large-scale crop residue burning affect the air quality in Delhi? Environm. Sci. Tech. 54, 4790–4799. doi: 10.1021/acs.est.0c00329
Kulshrestha, A., Satsangi, P. G., Masih, J., and Taneja, A. (2009). Metal concentration of PM2. 5 and PM10 particles and seasonal variations in urban and rural environment of Agra, India. Sci. Total Environ. 407, 6196–204. doi: 10.1016/j.scitotenv.2009.08.050
Kulshrestha, U., and Kumar, B. (2014). Airmass trajectories and long range transport of pollutants: review of wet deposition scenario in South Asia. Adv. Meteorol. 2014:596041. doi: 10.1155/2014/596041
Kumar, A. V., Patil, R. S., and Nambi, K. S. V. (2001). Source apportionment of suspended particulate matter at two traffic junctions in Mumbai, India. Atmospheric Environ. 35, 4245–4251. doi: 10.1016/S1352-2310(01)00258-8
Kushwaha, R., Lal, H., Srivastava, A., and Jain, V. K. (2012). Human exposure to particulate matter and their risk assessment over Delhi, India. National Acad. Sci. Lett. 35, 497–504. doi: 10.1007/s40009-012-0085-z
Lippmann, M., and Chen, L. C. (2009). Health effects of concentrated ambient air particulate matter (CAPs) and its components. Crit. Rev. Toxicol. 39, 865–913. doi: 10.3109/10408440903300080
Liu, K., Shang, Q., Wan, C., Song, P., Ma, C., and Cao, L. (2018). Characteristics and sources of heavy metals in PM2. 5 during a typical haze episode in rural and urban areas in Taiyuan, China. Atmosphere 9:2. doi: 10.3390/atmos9010002
Liu, X., Zhai, Y., Zhu, Y., Liu, Y., Chen, H., Li, P., et al. (2015). Mass concentration and health risk assessment of heavy metals in size-segregated airborne particulate matter in Changsha. Sci. Total Environ. 517, 215–221. doi: 10.1016/j.scitotenv.2015.02.066
Maciejczyk, P., Zhong, M., Li, Q., Xiong, J., Nadziejko, C., and Chen, L. C. (2005). Effects of subchronic exposures to concentrated ambient particles (CAPs) in mice: II. The design of a CAPs exposure system for biometric telemetry monitoring. Inhalation Toxicol. 17, 189–197. doi: 10.1080/08958370590912743
Maenhaut, W., Vermeylen, R., Claeys, M., Vercauteren, J., and Roekens, E. (2016). Sources of the PM10 aerosol in Flanders, Belgium, and re-assessment of the contribution from wood burning. Sci. Total Environ. 562, 550–560. doi: 10.1016/j.scitotenv.2016.04.074
Mandal, P., Sarkar, R., Mandal, A., and Saud, T. (2014). Seasonal variation and sources of aerosol pollution in Delhi, India. Environmental Chem. Lett. 12, 529–534. doi: 10.1007/s10311-014-0479-x
Mittal, M. L., Sharma, C., and Singh, R. (2012). “Estimates of emissions from coal fired thermal power plants in India,” in 2012 International Emission Inventory Conference (Tampa, FL), 13–16.
Moriyama, T., Morikawa, A., Doi, M., and Fess, S. (2014). Aerosol filter analysis using polarized optics EDXRF with thin-film FP method. Powder Diffract. 29:137. doi: 10.1017/S0885715614000207
Murari, V., Kumar, M., Barman, S. C., and Banerjee, T. (2015). Temporal variability of MODIS aerosol optical depth and chemical characterization of airborne particulates in Varanasi, India. Environ. Sci. Pollut. Res. 22, 1329–1343. doi: 10.1007/s11356-014-3418-2
Nair, M., Bherwani, H., Kumar, S., Gulia, S., Goyal, S., and Kumar, R. (2020). Assessment of contribution of agricultural residue burning on air quality of Delhi using remote sensing and modelling tools. Atmospher. Environ. 230:117504. doi: 10.1016/j.atmosenv.2020.117504
Nascimento Filho, V. F. (1999). Nuclear analytical techniques of X-ray fluorescence by energy dispersion (EDXRF) and by total reflection (TXRF). Piracicaba: ESALQ/CENA/USP. (Handout), 33.
Öztürk, F., Zararsiz, A., Kirmaz, R., and Tuncel, G. (2011). An approach to measure trace elements in particles collected on fiber filters using EDXRF. Talanta 83, 823–831. doi: 10.1016/j.talanta.2010.10.038
Pachauri, T., Singla, V., Satsangi, A., Lakhani, A., and Kumari, K. M. (2013). Characterization of carbonaceous aerosols with special reference to episodic events at Agra, India. atmosphere. Res. 128, 98–110. doi: 10.1016/j.atmosres.2013.03.010
Panda, S., Sharma, S. K., Mahapatra, P. S., Panda, U., Rath, S., Mahapatra, M., et al. (2016). Organic and elemental carbon variation in PM 2.5 over megacity Delhi and Bhubaneswar, a semi-urban coastal site in India. Natural Hazards 80, 1709–1728. doi: 10.1007/s11069-015-2049-3
Pant, P., Shukla, A., Kohl, S. D., Chow, J. C., Watson, J. G., and Harrison, R. M. (2015). Characterization of ambient PM2. 5 at a pollution hotspot in New Delhi, India and inference of sources. atmosphere. Environ. 109, 178–189. doi: 10.1016/j.atmosenv.2015.02.074
Perrino, C., Tiwari, S., Catrambone, M., Dalla Torre, S., Rantica, E., and Canepari, S. (2011). Chemical characterization of atmospheric PM in Delhi, India, during different periods of the year including Diwali festival. atmosphere. Pollut. Res. 2, 418–427. doi: 10.5094/APR.2011.048
Pipal, A. S., Jan, R., Satsangi, P. G., Tiwari, S., and Taneja, A. (2014). Study of surface morphology, elemental composition and origin of atmospheric aerosols (PM2. 5 and PM10) over Agra, India. Aerosol Air Qual. Res. 14, 1685–1700. doi: 10.4209/aaqr.2014.01.0017
Rai, P., Furger, M., El Haddad, I., Kumar, V., Wang, L., Singh, A., et al. (2020). Real-time measurement and source apportionment of elements in Delhi's atmosphere. Sci. Total Environ. 742:140332. doi: 10.1016/j.scitotenv.2020.140332
Sahu, S. K., and Kota, S. H. (2016). Significance of PM2. 5 air quality at the Indian capital. Aerosol Air Qual. Res. 17, 588–597. doi: 10.4209/aaqr.2016.06.0262
Shaltout, A. A., Boman, J., and Alsulimane, M. E. (2017). Identification of elemental composition of PM2. 5 collected in Makkah, Saudi Arabia, using EDXRF. X-Ray Spectrometry 46, 151–163. doi: 10.1002/xrs.2732
Sharma, S. K., Datta, A., Saud, T., Saxena, M., Mandal, T. K., Ahammed, Y. N., et al. (2010). Seasonal variability of ambient NH3, NO, NO2 and SO2 over Delhi. J. Environ. Sci. 22, 1023–1028. doi: 10.1016/S1001-0742(09)60213-8
Sharma, S. K., and Mandal, T. K. (2017). Chemical composition of fine mode particulate matter (PM2. 5) in an urban area of Delhi, India and its source apportionment. Urban Climate 21, 106–122. doi: 10.1016/j.uclim.2017.05.009
Sharma, S. K., Mandal, T. K., Jain, S., Sharma, A., and Saxena, M. (2016b). Source apportionment of PM 2.5 in Delhi, India using PMF model. Bull. Environ. Contaminat. Toxicol. 97, 286–293. doi: 10.1007/s00128-016-1836-1
Sharma, S. K., Mandal, T. K., Srivastava, M. K., Chatterjee, A., Jain, S., Saxena, M., et al. (2016a). Spatio-temporal variation in chemical characteristics of PM 10 over Indo Gangetic Plain of India. Environ. Sci. Pollut. Res. 23, 18809–18822. doi: 10.1007/s11356-016-7025-2
Sharma, V. K., and Patil, R. S. (1994). Chemical mass balance model for source apportionment of aerosols in Bombay. Environ. Monitor. Assessment 29, 75–88. doi: 10.1007/BF00546780
Singhai, A., Habib, G., Raman, R. S., and Gupta, T. (2017). Chemical characterization of PM 1.0 aerosol in Delhi and source apportionment using positive matrix factorization. Environ. Sci. Pollution Res. 24, 445–462. doi: 10.1007/s11356-016-7708-8
Sioutas, C., Delfino, R. J., and Singh, M. (2005). Exposure assessment for atmospheric ultrafine particles (UFPs) and implications in epidemiologic research. Environ. Health Perspect. 113, 947–955. doi: 10.1289/ehp.7939
Sousa, S. I. V., Martins, F. G., Alvim-Ferraz, M. C. M., and Pereira, M. C. (2007). Multiple linear regression and artificial neural networks based on principal components to predict ozone concentrations. Environ. Modell. Softw. 22, 97–103. doi: 10.1016/j.envsoft.2005.12.002
Srivastava, A., and Jain, V. K. (2008). Source apportionment of suspended particulate matters in a clean area of Delhi: a note. Transportat. Res. Part D 13, 59–63. doi: 10.1016/j.trd.2007.09.001
Srivastava, A., Sengupta, B., and Dutta, S. A. (2005). Source apportionment of ambient VOCs in Delhi City. Sci. Total Environ. 343, 207–220. doi: 10.1016/j.scitotenv.2004.10.008
Stanek, L. W., Brown, J. S., Stanek, J., Gift, J., and Costa, D. L. (2011). Air pollution toxicology—a brief review of the role of the science in shaping the current understanding of air pollution health risks. Toxicol. Sci. 120(suppl_1), S8–S27. doi: 10.1093/toxsci/kfq367
Sternbeck, J., Sjödin, Å., and Andréasson, K. (2002). Metal emissions from road traffic and the influence of resuspension—results from two tunnel studies. atmosphere. Environ. 36, 4735–4744. doi: 10.1016/S1352-2310(02)00561-7
Suman, G. S., and Pal, A. K. (2010). Source apportionment of respirable particulate matter using principal component analysis: a case study from India. Int. J. Appl. Environm. Sci. 5, 909–921.
Thurston, G. D., and Spengler, J. D. (1985). A quantitative assessment of source contributions to inhalable particulate matter pollution in metropolitan Boston. atmosphere. Environ. (1967) 19, 9–25. doi: 10.1016/0004-6981(85)90132-5
Tiwari, S., Pervez, S., Cinzia, P., Bisht, D. S., Kumar, A., and Chate, D. M. (2013). Chemical characterization of atmospheric particulate matter in Delhi, India, Part II: source apportionment studies using PMF 3.0. Sustain. Environ. Res. (2013) 23:295–306.
Tobler, A., Bhattu, D., Canonaco, F., Lalchandani, V., Shukla, A., Thamban, N. M., et al. (2020). Chemical characterization of PM2. 5 and source apportionment of organic aerosol in New Delhi, India. Sci. Total Environ. 745:140924. doi: 10.1016/j.scitotenv.2020.140924
World Health Organization (2016). Ambient Air Pollution: A Global Assessment of Exposure and Burden of Disease. doi: 10.17159/2410-972X/2016/v26n2a4
Yadav, S., and Phuleria, H. C. (2020). “Oxidative potential of particulate matter: a prospective measure to assess PM toxicity,” in Measurement, Analysis and Remediation of Environmental Pollutants eds Gupta, T., Singh, S. P., Rajput, P., and Agarwal, A. K. (Singapore: Springer), 333–56. doi: 10.1007/978-981-15-0540-9_16
Zhang, X., Zhao, X., Ji, G., Ying, R., Shan, Y., and Lin, Y. (2019). Seasonal variations and source apportionment of water-soluble inorganic ions in PM 2.5 in Nanjing, a megacity in southeastern China. J. Atmospher. Chem. 76:73–88. doi: 10.1007/s10874-019-09388-z
Keywords: atmospheric aerosols, trace metals, urban air-shed, source-apportionment, Delhi
Citation: Bangar V, Mishra AK, Jangid M and Rajput P (2021) Elemental Characteristics and Source-Apportionment of PM2.5 During the Post-monsoon Season in Delhi, India. Front. Sustain. Cities 3:648551. doi: 10.3389/frsc.2021.648551
Received: 31 December 2020; Accepted: 10 March 2021;
Published: 12 April 2021.
Edited by:
Maria De Fatima Andrade, University of São Paulo, BrazilReviewed by:
Jianlin Hu, Nanjing University of Information Science and Technology, ChinaImran Shahid, Qatar University, Qatar
Evangelia Diapouli, National Centre of Scientific Research Demokritos, Greece
Copyright © 2021 Bangar, Mishra, Jangid and Rajput. This is an open-access article distributed under the terms of the Creative Commons Attribution License (CC BY). The use, distribution or reproduction in other forums is permitted, provided the original author(s) and the copyright owner(s) are credited and that the original publication in this journal is cited, in accordance with accepted academic practice. No use, distribution or reproduction is permitted which does not comply with these terms.
*Correspondence: Amit Kumar Mishra, YW1pdC5taXNocmEuam51QGdtYWlsLmNvbQ==; YW1pdG1pc2hyYUBtYWlsLmpudS5hYy5pbg==