 Esther Bayiga Zziwa
 Olive Kobusingye
- School of Public Health, College of Health Sciences, Makerere University, Kampala, Uganda
Road traffic crashes are a threat to walkers in cities in the global south. It is important for us to know where these crashes frequently occur as well as gain an in-depth understanding of the traffic generators around these sites. Kampala city has experienced many changes over time, and as a result, the crash sites could have changed over time. Pedestrian crashes in cities cluster in specific places than others on a road network known as black spots. It is important to know and update the current black spots as well as reassess the circumstances surrounding these crash sites. This study utilized 5-year traffic crash data (2015–2019) to map and categorize pedestrian black spots in Kampala city, Uganda, by road location type, as well as the nature of activity happening around. A total of 1,095 unique crash locations emerged from the data. Based on the criteria of locations with at least 10 serious or fatal crashes in 5 years, 46 locations were identified as black spots. The bulk (48%) of serious and fatal pedestrian black spots were junctions, especially those with traffic lights, while 74% of these black spots were around places with commercial land use. Whereas implementation of appropriate interventions at black spots is a general well-proven method for reducing the number and severity of crashes at these sites on the road network, the measures taken to treat accident black spots vary from place to place dependent on the unique local circumstances and risk factors. The draft black spot list serves as a basis for further investigation and analysis of the local risk factors surrounding serious and fatal pedestrian crashes in low-income settings as a key step in generating appropriate interventions.
Introduction
Road traffic injuries are a global problem responsible for approximately 1.35 million deaths. However, the risk of death is three times higher in low-income countries compared to high-income countries. Although 1% of the world's motor vehicles are in low- and middle-income countries (LMIC), 13% of deaths occur here. African countries have the highest regional rates of road traffic deaths estimated at 26.6 deaths per 100,000 population. Pedestrians and cyclists, known as vulnerable road users, represent 26% of all deaths due to road traffic crashes (RTCs). However, the African continent has the highest proportion of pedestrian and cyclist mortalities comprising 44% of deaths (World Health Organization, 2018). Road fatalities per capita are much higher in African cities than in other cities in the world, and pedestrians are overrepresented in the number of fatalities (Vanderschuren and Zuidgeest, 2017).
Pedestrian crashes, like all RTCs, tend to occur more in specific places than others on a road network. These places are referred to as “black spots,” “hazardous road sections,” or “dangerous road locations.” In this article, they will be referred to as black spots. Since there is no universally appropriate definition of what should be regarded as a black spot (Elvik et al., 2009), different countries have adopted different definitions for black spots. In this study, we adopted the Ugandan definition for a black spot, which is “ a spot or location of not more than 500 meters long where at least ten (10) fatal or serious crashes have occurred within a period of five (5) years because of local risk factors which are based on recorded number of crashes” [Northern Corridor Transport And Transit Coordination Authority (NTTCA), 2021]. Since black spots arise as a result of local risk factors, there is a need to identify local risk factors that may explain the higher expected number of accidents.
According to Elvik et al. (2009), the “concentration of accidents at a specific spot may partly be due to incorrect, inappropriate or inadequate road design or traffic control at that place.” As such, interventions primarily aim at improving road design or traffic regulation at such spots in order to reduce the expected number of accidents. However, Mohan Dinesh and Geetam Tiwari argue that pedestrian crash risk in LMICs is not primarily due to road design but is largely explained by exposure (Mohan and Tiwari, 1998; Mohan, 2008). The presence of variation in researchers' positions on the contributing factors that explain road safety and pedestrian safety specifically points to the need for more empirical research in this area.
Proper identification of black spots for pedestrians can inform better planning and lead to appropriate treatment measures, leading to a reduction in such crashes. While implementation of appropriate interventions at black spots is a general well-proven method for reducing the number and severity of crashes at these sites on the road network, the measures taken to treat accident black spots vary from place to place (Elvik et al., 2009), and this is dependent on the unique local circumstances. While the local circumstances within LMICs differ from those in high-income countries (HICs) (Mohan, 2002, 2008; Wegman, 2017), the bulk of research on pedestrian accidents and proposed interventions are from high-income settings (Khayesi, 2006; Wegman, 2017). For example, whereas Elvik et al. (2009) in the Handbook of Road Safety Measures give a comprehensive overview and illustration of how various interventions impact road safety, almost all the research in the handbook comes from studies in HICs or highly motorized countries (Khayesi, 2006; Wegman, 2017). However, the transferability of research results relies first and foremost on the extent to which the reported safety effects of interventions depend on the circumstances in which the research was carried out (OECD/ITF Transport Research Committee, 2012). Therefore, there is a need to establish a good understanding of conditions and circumstances under which high-risk pedestrian crashes around black spots occur in low-income settings.
It has been suggested that data of a minimum of 3 years be considered to avoid regression-to-the mean effects since RTCs are random events (Elvik et al., 2009). However, most of the available studies in Uganda utilized 1 year or less (Muni et al., 2020; Oporia et al., 2020) when identifying dangerous crash locations. In addition, none of the available studies have focused on the city specifically as a built environment. Oporia focused on the Kampala Metropolitan Area, which includes both Kampala city and surrounding districts while Muni and colleagues focused on Uganda as a country sampling district. It is important to know and update the current black spots as well as reassess the circumstances surrounding these crash sites. This formed the first part of a broader study focusing on pedestrians killed and injured due to RTCs in Kampala city as a built environment. This foundational study focused on mapping and categorizing pedestrian crash sites by frequency of pedestrian crashes and location type utilizing 5-year RTC data (2015–2019). Another study is underway to examine the detailed contribution of underlying factors that could explain the results of this study using statistical methods such as correlation and negative binomial regression as used in many other such studies (Merlin et al., 2020).
Materials and methods
Study area
This study was carried out in Kampala, the capital city of Uganda, which has a day population of approximately 2.9 million people with 60% of these comprising the working population. Kampala city is divided administratively into five divisions, which are subdivided into 99 parishes/wards that are in turn subdivided into 863 villages (Kampala Capital City Authority, 2012). Kampala, like most cities, is seen as a land of countless opportunities, thereby attracting many people, mostly youth. Kampala as a satellite city faces the challenge of many people working in the city while staying in the metropolitan suburbs, hence day-time population differs from night-time population. Kampala city is also unique because it has the highest number of vehicles in comparison to the rest of the Greater Metropolitan Area, as well as entire Uganda. The high vehicle density is because it is a transport hub that hosts all public transport leading to all the different routes in the country. Public transport in Kampala is provided by taxis (minibuses) and commercial motorcycles (boda boda). There are more than 300 different routes. However, these routes are neither coordinated, nor integrated, nor clearly regulated. Due to the high vehicle density, there is a high probability of crashes happening, evidenced by traffic police data where crashes happen the most in Kampala. In addition, more pedestrians are seen in Kampala city because many trips in the city are carried out by walking, especially nonworking tours. Although most trips are pedestrian, there are no proper pedestrian facilities. Along most roads are unpaved and physically separated sidewalks, thus pedestrians are forced to walk along roads, exposing themselves to the risk of traffic accidents. In fact, the number of pedestrians killed in Kampala city is very high (Muni et al., 2020), and pedestrians constitute 50% of all fatalities due to crashes occurring in Kampala (Kampala Capital City Authority, 2012). This is a very high rate of pedestrian involvement, and the number of people killed increases every year. Kampala city has the highest road length as well as many different types of roads found within one setting, thereby making it easier to study the influence of roadway design on pedestrian safety. Kampala city is also made up of numerous land uses with a lot of mixed land use in several places. For example, a high number of schools are located within the city, and school children have been found at risk for pedestrian crashes. However, land-use planning is disconnected from transport and road design planning (Kampala Capital City Authority, 2012). This context makes it a suitable pedestrian safety study.
Data collection
Data on pedestrian crashes were abstracted retrospectively from Uganda Traffic Police records for Kampala city for a 5-year period (2015–2019). A data abstraction form was used to abstract data on crash location, crash severity measured by the type of crash, whether serious or fatal, as well as the number of pedestrians injured or killed per crash. All the crashes registered involving pedestrians within the study period were either fatal [defined as a crash in which death occurs at the scene of the accident and/or within 1 year and 1 day as a result of injuries sustained in the crash (Uganda Police, 2020)] or serious [defined as a crash in which a person is admitted in the hospital as an “inpatient” or any of the following injuries whether or not one is admitted in the hospital: fractures, concussion, internal injuries, crashing, severe cuts and lacerations (Uganda Police, 2020)] with none reported as a minor crash [defined as a damage-only crash where no persons are injured at all regardless of the extent of damage to the vehicle (Uganda Police, 2020)].
The data abstraction form was converted to electronic format using Kobo Collect software (Kobo Toolbox), then loaded onto a Kobo Collect-enabled mobile device. Prior to use, the electronic data abstraction form was tested through pilot data collection for 1 day using 2014 traffic crash data at Kawempe police station (one of the police stations within Kampala city), and necessary modifications made to the tool. The modifications included listing age by categories of either adult, juvenile, or missing since that was the format in which the records were stated. Initially, the tool requested the actual age but at pre-testing we realized the actual age was missing in most of the records and had been stated as either adult or juvenile. We also modified the crash entry unique code to include both the number of crash, the year of crash, as well as the police station where the crash was recorded. We had initially only included the number of crashes in the police station entry book as well as year but realized that it would later look duplicated when we went to another police station where they shared the same number and year. Finally, using the said data abstraction tool, data were abstracted from Traffic Accident Record forms at the respective police stations that oversee Kampala city. Where necessary, the research assistants requested data about specific crash locations from the police in order to ensure accuracy when recording the location of the crash.
Data management and analysis
Data management
Data were downloaded from Kobo Collect in Excel format and then imported into STATA software for data management and analysis. Crash location data were written manually using a description of the nearest location to the crash site. In STATA, similar crash locations were given uniform naming patterns so that similar crash sites could be identified as one and the frequency of serious and fatal pedestrian crashes per site calculated.
Data analysis
Identification of pedestrian injury and death black spots
A list of crash locations was generated for the different roads. Crashes were then analyzed on the basis of frequency per crash location. Uganda Police Traffic crash data currently lack a spatial element with GPS coordinates. These are recorded with just addresses as a representation of location. An assumption was made that crash locations as described/reported by police were accurate within 500 m as per black spot definition. Data were ranked based on total frequency of serious and fatal crashes reported per site and then a list of black spots generated where at least 10 fatal or serious crashes were reported within a period of 5 years.
Categorization of crash locations
Pedestrian crash locations in the data were described in the records by “near,” “at the gate,” or “opposite” the nearest prominent attribute to crash site. Police reported crash locations by both spot and zone. We considered both under the assumption that the traffic police knew where the exact spot is; however, due to lack of a prominent feature around, they had opted to use the zone name. Locations were categorized on the basis of the nearest feature described by the police such as a supermarket, junction, trading center, and traffic lights as reported in the results and later recategorized into broad categories of commercial, educational, recreational, industrial, or worship place. Commercial land use was characterized by the presence of at least one of these: trading centers, markets, fuel stations, taxi stages, commercial buildings, supermarkets, shopping malls, bus parks, and roadside vendors. Educational land use was characterized by the presence of at least one of these: nursery school, primary school, secondary school, tertiary institution, or university. A worship place was characterized by the presence of a church, mosque, or temple. Recreational land use was categorized by the presence of a recreation park, amusement parks, bar, pub, playground, or restaurant. Industrial land use was categorized by the crash happening on roads demarcated within the industrial street by road names and number such as first street, second street, third street, fourth street, fifth street, sixth street, seventh street, eighth street, ninth street, and tenth street.
Results
Black spot analysis and categorization of road structure and trip generators around
Overall, 5,123 crashes were recorded. Of these, 800 (15.62%) were fatal while 4,323 (84.38%) were serious. A total of 1,095 unique crash locations emerged from the data. From the analysis, based on the criteria of locations with at least 10 serious or fatal crashes in 5 years, 46 locations were identified as black spots (Annex 1) with the characteristics of the location type. The bulk (48%) of serious and fatal pedestrian black spots were junctions, especially those with traffic lights, while 74% of these black spots were around places with commercial land use as a trip generator. Mapping of black spots, as well as the trip generators and road structure around them, was done using a proportional symbol map shown in Figure 1. No black spot is around industrial or recreational land use. Since the frequency used in creating the proportional symbol maps was the total number of serious and fatal crashes at a particular location, the option of unknown units was chosen in ArcMap when creating the map. Locations that had not been recorded precisely for proper characterization to 500 m but had a total of 10 or more serious and fatal crashes were also listed down in the Annexe 2.
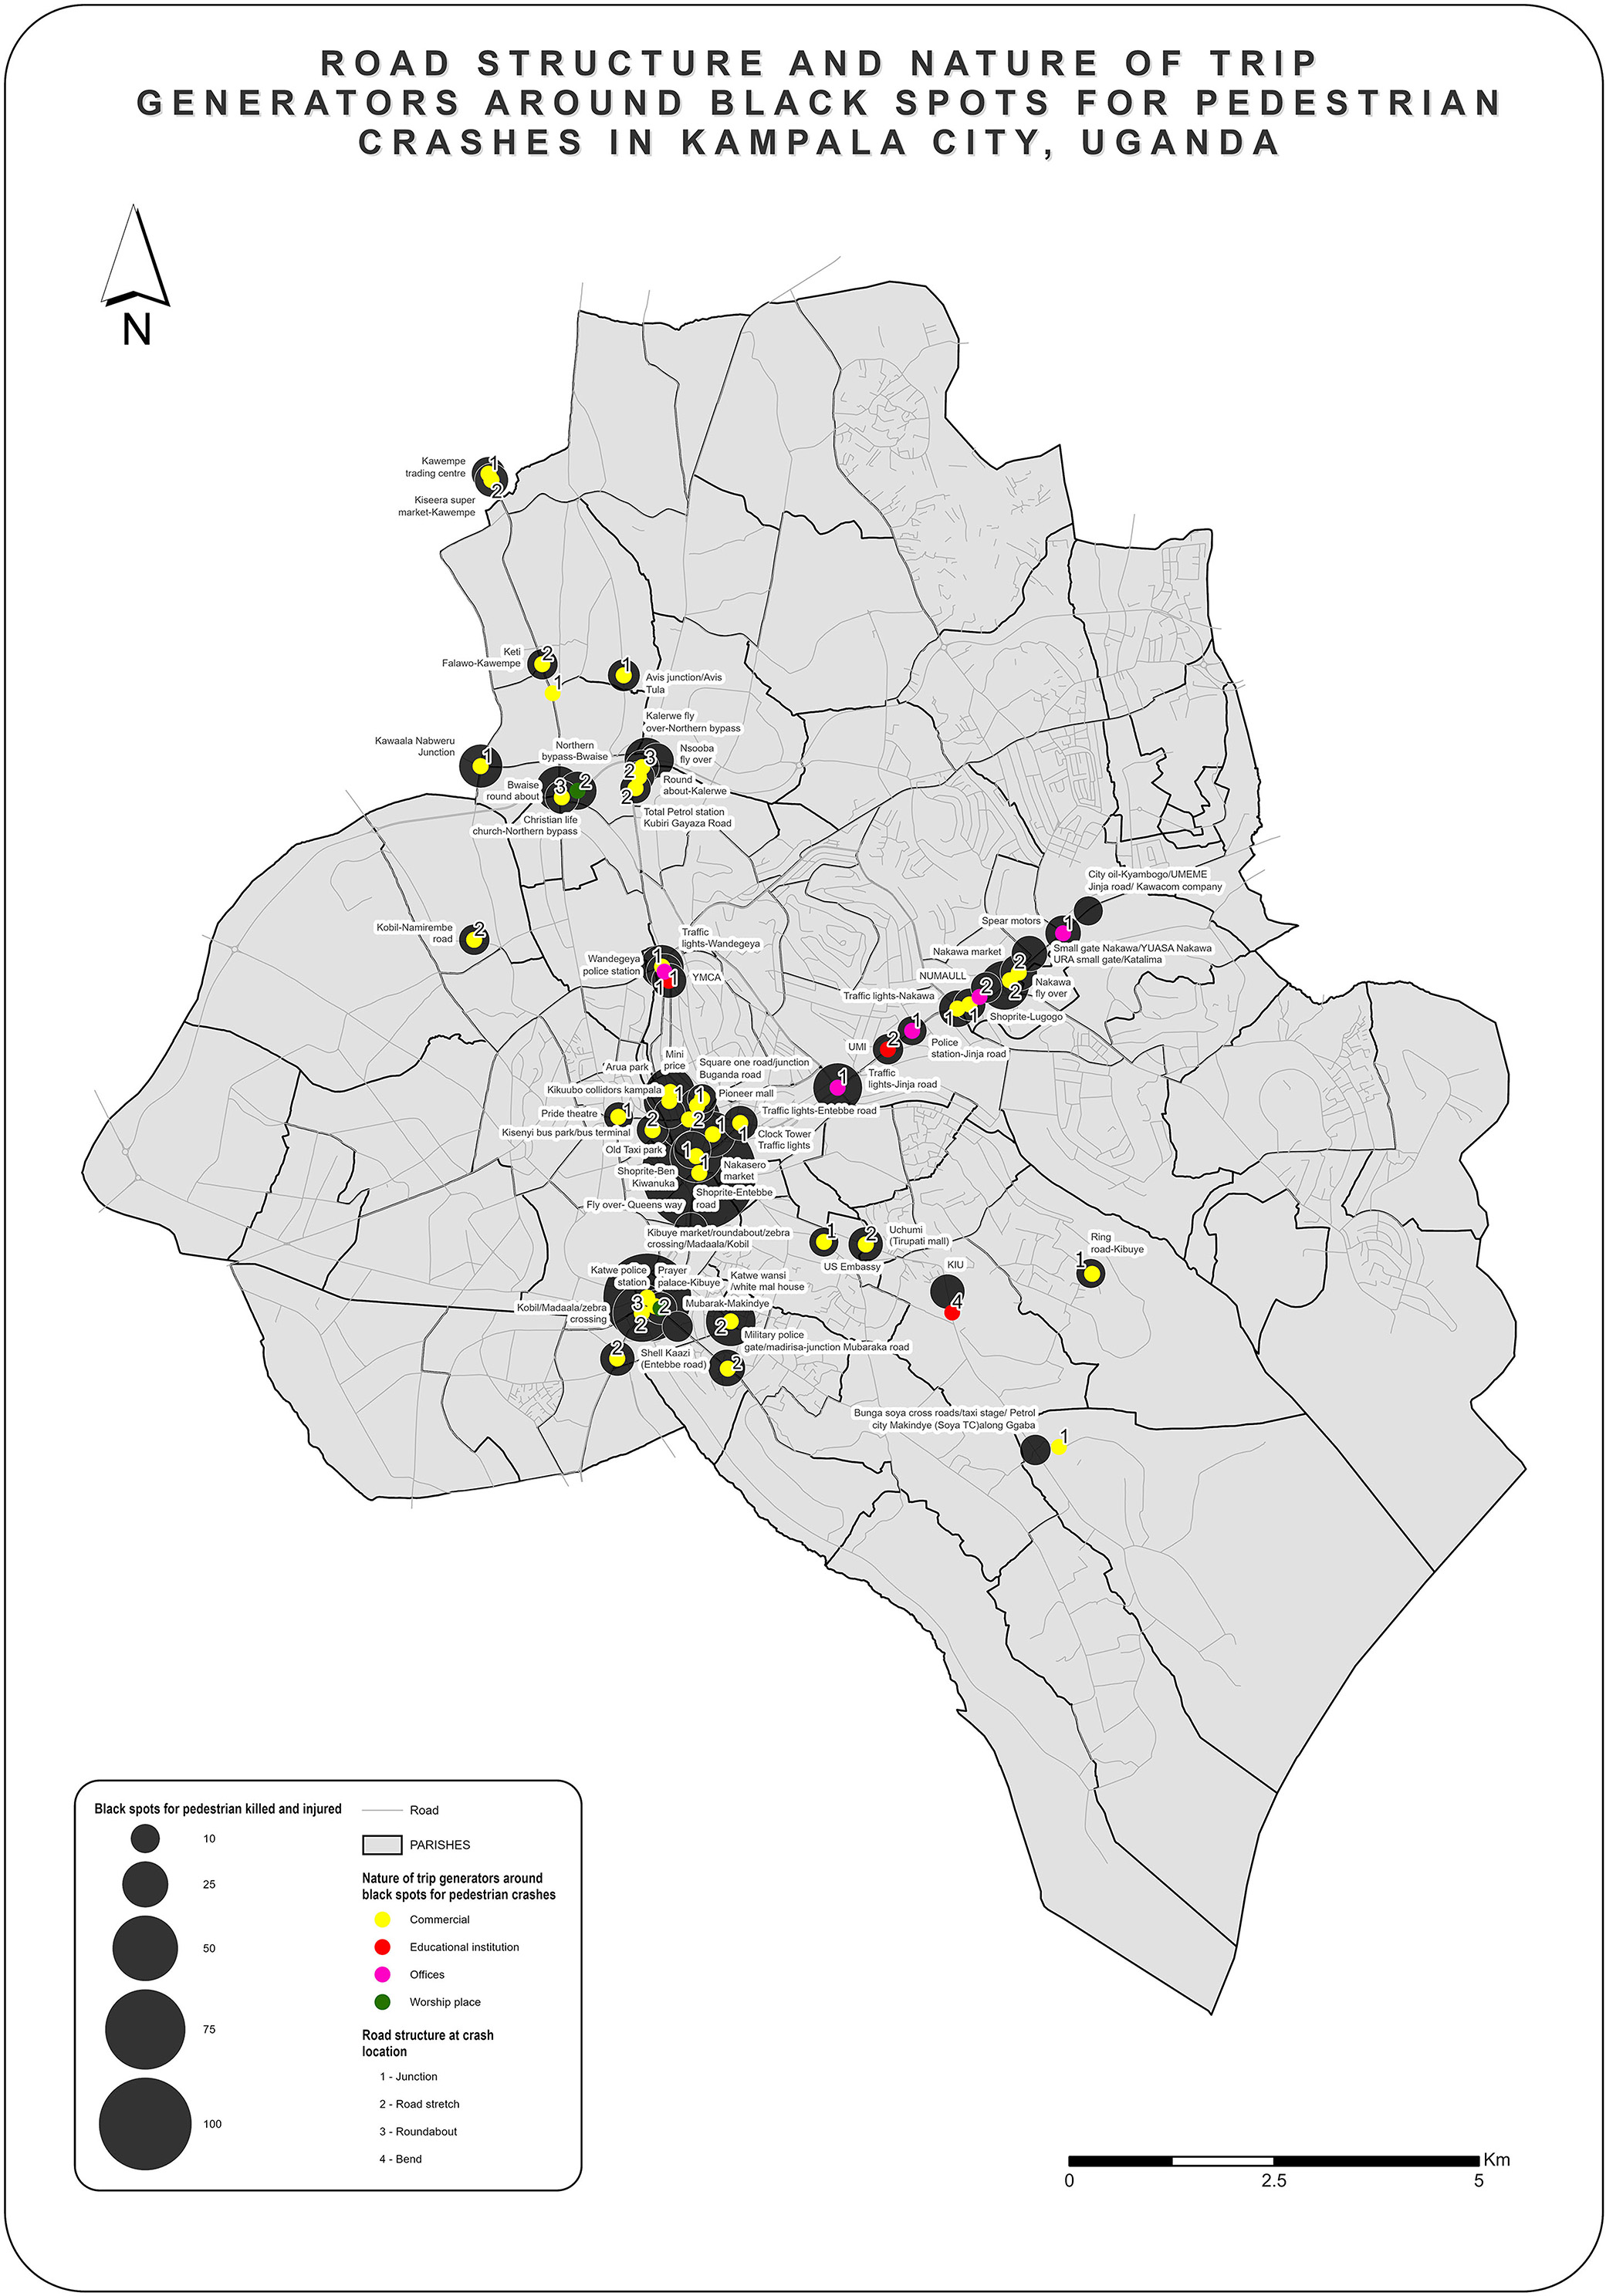
Figure 1. Road structure and nature of trip generators around black spots for pedestrian crashes in Kampala city.
Discussion
The bulk (48%) of serious and fatal pedestrian black spots were junctions, especially those with traffic lights, while 74% of these black spots were around places with commercial land use as a trip generator. No black spot is around industrial or recreational land use. Previous research has concluded that walking is the dominant mode of transport in African cities only because of economic, not health or environmental, reasons (Vanderschuren and Zuidgeest, 2017). Commercial land use attracts many pedestrians and leads to congestion in these areas while few pedestrians are found around areas with industrial land use. Mohan Dinesh argued that pedestrian risk was high due to exposure and less due to safer road design of the environment (Mohan and Tiwari, 1998; Mohan, 2008). The modal share differs in different parts of the world. For example, a study found that few English and Welsh walked or rode a bicycle as part of their daily routine with most relying on their automobiles to go to work, shop for groceries, or just go around (Goodman, 2013). As a result, most of the discussion in European and American cities resolves around active transportation and how policies can encourage walking (Pucher and Buehler, 2010; Buehler et al., 2016). In contrast, walking is the dominant mode of transport in low-income countries (Sietchiping et al., 2012). Unlike the traffic in cities in HICs, bicycles, pedestrians, and other nonmotorized modes are present in significant numbers on urban streets. Their presence persists despite the fact that engineers design these facilities for a fast-moving uninterrupted flow of motorized vehicles (Sietchiping et al., 2012).
Mohan, argued that the low pedestrian deaths in HICs were the result of the availability of cars that provide much greater safety to the occupants in crashes and of a very significant reduction in the presence of pedestrians and bicyclists on HIC streets and highways. Geetam has recommended the conflict of pedestrian and vehicular traffic on high-speed roads observed in LMICs. LMICs and also the presence of pedestrians along high-speed roads require further research and understanding of a successful strategy (Tiwari, 2020). The findings of this study affirm these assertions. Indeed, road environments in HICs are different from those in these settings. The presence of markets and trading centers along high-speed roads is a common sight. In addition, fuel stations of different kinds are readily positioned on the roads within a few meters of each other. It is not understood whether the stations are present due to traffic volumes or whether traffic volumes attract their development. However, both the markets and fuel stations are not common sights on roads in HICs. Other trip attractors such as supermarkets and shopping malls are also conveniently positioned on roads to attract customers, inclusive of pedestrians. Taxi parks exist that stop at many stages within Kampala city. All these have been associated with pedestrian crashes. The finding that junctions with traffic lights are high risk is in agreement with previous research pointing to the high level of conflict at these sites. This could be because commercial motorcyclists, also known as boda bodas, do not usually comply with the traffic lights, and these knock out the pedestrians the most. While zebra crossings are designated for pedestrians, findings from this research like previous research show that they are not safe (Oporia et al., 2020).
When the cities of Dar-es-Salaam, Nairobi, and Cape Town were compared, infrastructure provision was found to be one of the major challenges in African cities. There was a general lack of good-quality pedestrian pavements and road-crossing facilities in the three cities. Moreover, the provision is uneven and discontinuous (Ogendi et al., 2013; Vanderschuren and Zuidgeest, 2017). Speed has also been highlighted as another major risk factor (Osuret et al., 2021).
In this analysis, we do not weight fatal and serious injuries separately, which could be a limitation.
Use of traffic crash data also had some limitations such as locations being vague in description and were thus deleted from the data set. Traffic crash data are also usually not very accurate and under-reported due to the lack of follow-up on casualties (e.g., people can be recorded on the police form as seriously injured and during their stay in hospitals, they die, hence becoming fatalities within the days of admission). However, many who die in hospitals may not be recorded in the police database. In addition, traffic crash data lack many attributes that would deepen our understanding such as adding of collision diagram, GPS coordinates, information about nearby schools or other public and private services, and surrounding characteristics of interurban roads.
Conclusion and recommendations
The findings from this study show that roads are not just for moving traffic but also cater to the local functions around such as pedestrian activities like shopping. They should, therefore, be built and planned considering the mix of traffic functions. The predominant function of an area should be considered, and therefore, appropriate interventions prioritizing it made. For example, areas where many pedestrians are found should be pedestrianized. Other interventions would include walkways and traffic separation in these places. There is also a need to shift from theoretical and mythical traffic management to the reality on ground in the different spaces. Speeds must not only be determined by the road type but also by the activities happening around areas in order to minimize crashes. Pedestrian safety must be prioritized through the combination of both bottom-up and to-bottom approaches in finding potential context-specific solutions to pedestrian safety. The study results reported in this article add onto the existing research, analyzing crashes in low-income settings by identifying and classifying spots where pedestrians are injured and/or killed most on Kampala city road network in Uganda. The draft pedestrian crash black spot list serves as a basis for further investigation and analysis. The list could be improved by the use of a weighted index.
Data availability statement
The data analyzed in this study is subject to the following licenses/restrictions: Permission has to be obtained from the Research Department of the Uganda police. Requests to access these datasets should be directed to https://www.upf.go.ug.
Ethics statement
Approval to conduct the study was obtained from the Makerere University School of Public Health Research and Ethics committee. As per national guidelines, this research was cleared by the Uganda National Council for Science and Technology under protocol number: HS960ES. In addition, permission to collect data was also obtained from the research department of the Uganda Police. Codes were given to each crash record so that information could not be traced back to individual crashes. Data was only accessible to the research team to ensure privacy, confidentiality, and safety.
Author contributions
EBZ conceptualized the study, as well as carried out the data collection, analysis, and writing the original manuscript draft. DG supervised the study, as well as reviewed the manuscript. OK obtained funding for the study. All authors contributed to the writing of the article and approved the submitted version.
Funding
This work was supported by a grant (# VN 81204847) from the German Federal Ministry of Education and Research (BMBF) through the Collaboration for evidence-based healthcare and public health in Africa (CEBHA+) under Makerere University School of Public Health. The corresponding author was a Ph.D. student under the CEBHA+project.
Acknowledgments
The authors thank Dr. Khayesi Meleckidzedeck and Dr. Milton Mutto, as well as the staff at the Uganda Traffic Police, especially Assistant Inspector General of Police Bettinah Nalugo, the statistician at the Uganda Police Force, and the officers in charge of the police stations, as well as the traffic police officers, for their support during the planning and data collection phases of the study. The authors are indebted to the staff of the Kampala Kapital City Authority GIS department, as well engineering department, for their support in obtaining necessary data on Kampala city. The authors thank Mr. Steven Owundo for his help with map quality.
Conflict of interest
The authors declare that the research was conducted in the absence of any commercial or financial relationships that could be construed as a potential conflict of interest.
Publisher's note
All claims expressed in this article are solely those of the authors and do not necessarily represent those of their affiliated organizations, or those of the publisher, the editors and the reviewers. Any product that may be evaluated in this article, or claim that may be made by its manufacturer, is not guaranteed or endorsed by the publisher.
Supplementary material
The Supplementary Material for this article can be found online at: https://www.frontiersin.org/articles/10.3389/frsc.2022.838186/full#supplementary-material
References
Buehler, R., Götschi, T., and Winters, M. (2016). Moving Toward Active Transportation: How Policies Can Encourage Walking and Bicycling. Zurich: University of Zurich.
Elvik, R., Vaa, T., Hoye, A., and Sorensen, M. (2009). The Handbook of Road Safety Measures (Bingley. UK: Emerald Group Publishing Limited).
Goodman, A.. (2013). Walking, cycling and driving to work in the English and Welsh 2011 census: trends, socio-economic patterning and relevance to travel behaviour in general. PloS One. 8, e71790. doi: 10.1371/journal.pone.0071790
Kampala Capital City Authority (2012). Kampala Physical Development PLAN: Updating Kampala Structure Plan and Upgrading the Kampala GIS Unit. Kampala, Uganda.
Kobo Toolbox (2017). United Nations Office for the Coordination of Humanitarian Affairs (UN-OCHA). Available online at: https://www.kobotoolbox.org/
Merlin, L. A., Guerra, E., and Dumbaugh, E. (2020). Crash risk, crash exposure, and the built environment: a conceptual review. Accid. Anal. Prev. 134, 105244. doi: 10.1016/j.aap.2019.07.020
Mohan, D.. (2002). Road safety in less-motorized environments: future concerns. Int. J. Epidemiol. 31, 527–532. doi: 10.1093/ije/31.3.527
Mohan, D.. (2008). Road traffic injuries: a stocktaking. Best Pract. Res. Clin. Rheumatol. 22, 725–739. doi: 10.1016/j.berh.2008.05.004
Mohan, D., and Tiwari, G. (1998). “Traffic safety in low income countries: issues and concerns regarding technology transfer from high-income countries,” in Reflections of the Transfer Of Traffic Safety Knowledge to Motorising Nations (Melbourne, VIC: Global Safety Trust), 27–56.
Muni, K. M., Ningwa, A., Osuret, J., Zziwa, E. B., Namatovu, S., Biribawa, C., et al. (2020). Estimating the burden of road traffic crashes in Uganda using police and health-sector data sources. Injury Prev. 27, 208–214 doi: 10.1136/injuryprev-2020-043654
Northern Corridor Transport And Transit Coordination Authority (NTTCA) (2021). Black Spot Management Guidelines for the Northern Corridor Member States in East and Central Africa. Mombasa, Kenya.
OECD/ITF Transport Research Committee (2012). “Sharing road safety–developing an international framework for crash modification functions,” in International Transport Forum, Final Draft.
Ogendi, J., Odero, W., Mitullah, W., and Khayesi, M. (2013). Pattern of pedestrian injuries in the city of Nairobi: implications for urban safety planning. J. Urban Health 90, 849–856. doi: 10.1007/s11524-013-9789-8
Oporia, F., Tumwesigye, N. M., Isunju, J. B., Nuwematsiko, R., Bachani, A. M., Kisakye, A. N., et al. (2020). Geospatial distribution of pedestrian injuries and associated factors in the Greater Kampala Metropolitan Area, Uganda. J. Interven. Epidemiol. Public Health. 3:2. doi: 10.37432/JIEPH.2020.3.1.22
Osuret, J., Namatovu, S., Biribawa, C., Balugaba, B. E., Zziwa, E. B., Muni, K., et al. (2021). State of pedestrian road safety in Uganda: a qualitative study of existing interventions. Afr. Health Sci. 21, 1498–1506. doi: 10.4314/ahs.v21i3.62
Pucher, J., and Buehler, R. (2010). Walking and cycling for healthy cities. Built Environ. 36, 391–414. doi: 10.2148/benv.36.4.391
Sietchiping, R., Permezel, M. J., and Ngomsi, C. (2012). Transport and mobility in sub-Saharan African cities: an overview of practices, lessons and options for improvements. Cities 29, 183–189. doi: 10.1016/j.cities.2011.11.005
Tiwari, G.. (2020). Progress in pedestrian safety research. Int. J. Injury Control Safety Promot. 27, 35–43. doi: 10.1080/17457300.2020.1720255
Vanderschuren, M., and Zuidgeest, M. (2017). “Road safety and non-motorized transport in African cities.” Non-Motorized Transport Integration into Urban Transport Planning in Africa (England, UK:Routledge), 57–72.
Wegman, F.. (2017). The future of road safety: a worldwide perspective. IATSS Res. 40, 66–71. doi: 10.1016/j.iatssr.2016.05.003
Keywords: pedestrian crash, pedestrian injury, pedestrian black spot, Kampala-Uganda, serious and fatal pedestrian crashes
Citation: Zziwa EB, Kobusingye O and Guwatudde D (2022) Where are pedestrians injured and killed on Kampala city's road network? Front. Sustain. Cities 4:838186. doi: 10.3389/frsc.2022.838186
Received: 17 December 2021; Accepted: 28 June 2022;
Published: 10 August 2022.
Edited by:
Winnie Mitullah, University of Nairobi, KenyaReviewed by:
Mateusz Rydlewski, Wrocław University of Technology, PolandKatarzyna Janusz, KU Leuven, Belgium
Copyright © 2022 Zziwa, Kobusingye and Guwatudde. This is an open-access article distributed under the terms of the Creative Commons Attribution License (CC BY). The use, distribution or reproduction in other forums is permitted, provided the original author(s) and the copyright owner(s) are credited and that the original publication in this journal is cited, in accordance with accepted academic practice. No use, distribution or reproduction is permitted which does not comply with these terms.
*Correspondence: Esther Bayiga Zziwa, ZXN0aGVyYmF5aWdhQGdtYWlsLmNvbQ==