 Walter Timo de Vries
 Marc Schrey
- 1Department of Aerospace and Geodesy, School of Engineering and Design, Technical University of Munich, Munich, Germany
- 2School of Engineering and Design, Technical University of Munich, Munich, Germany
Predicting how a planned city will develop and expand after its construction, and which resources, such as energy, the city will need over time is only possible if one can rely on similar examples and reliable models. Given the existing spatial plans for the design of the new capital city of Indonesia, there is a need to develop and compare city development scenarios–in spatial expansion, population size, resource, energy and food requirements. A combination of various geospatial data approaches can address this knowledge and assessment gap. This article investigates spatial expansion, forest encroachment and sustainable energy infrastructure requirements using open access geodata and models. The hypothesis is that the constitution of the new capital city of Indonesia can rely on existing energy infrastructures but may also need to rely on additional resources. The research approach was to collect and integrate different types of geospatial data related to land use, terrain characteristics and population growth assumptions and connect these to both urban growth models and predictions and energy. This relied on land use change methodologies and urban growth models to simulate and predict spatial effects, with ca particular focus on the expansion of energy requirements. The choice to focus on energy requirements additionally required a comparison of different kinds of energy sources, such as solar and wind energy. The conclusion is that all design and expansion scenarios indicate a possible spatial conflict between locating sustainable energy production facilities with maintaining ecologically sensitive areas. A possible solution is to make use of existing mining infrastructures to enhance sustainable energy production and to make use of dual land and water solar energy systems.
Introduction
Indonesia has decided to construct a new capital city (Hackbarth and de Vries, 2021; Kodir et al., 2021). It is currently Jakarta Java Island, yet a new location is foreseen in Kalimantan, somewhere between the current cities of Balikpapan and Samarinda. How such a city will develop over time and what sort of resources will be needed when is obviously unknown, and will depend on multiple factors. In any case, the construction of the new capital city, referred to as Ibu Kota Negara (IKN), will alter existing regional land use plans of the adjacent municipalities and regions, and will therefore also have an environmental impact. So far, these impacts are largely unknown, as both the plans for the size of the IKN as well as the predictions for its spatial growth are still part of the political concourse. This uncertainty requires spatial planners and land managers to model various types of spatial and environmental assessments in order to predict and compare multiple scenarios of growth, needs to resources and impacts for the environment (Farid, 2021). This paper zooms in to the exploration and prediction of spatial (sustainable) energy requirements and the environmental impacts of various energy alternatives for the largest variant of the new city IKN.
Principally, IKN should be in line with sustainable city development guidelines, including the provision of renewable energies. Renewable energy would supply up to 39% of the new city's electricity consumption (Nangoy, 2021). Yet, this figure is significantly higher than the average of Indonesia's renewable energy provision in planned for 2030. Currently, hydroelectric power dominates the renewable energy potential in Kalimantan due to the area's abundant wide and long rivers. Even though wind energy has a low potential, already implemented wind farms in Indonesia are profitable. Therefore, East Kalimantan possesses enormous potential for clean energy. Research from the Ministry of Energy and Mineral Resources shows that the prospect of hydroelectricity, solar power, wind power, biofuel and other renewable energy sources combined in East Kalimantan alone can reach up to 20 GW. Hydroelectric comprises 26% of it, and solar power is 65% (Farid, 2021).
The availability of open access data and open access algorithms provides a unique opportunity to explore and compare different spatial and environmental scenarios and estimate different types of impacts. Although there exists different options for the size of the IKN, one of the most recent plans for the IKN indicates that regardless of the actual built-up area the establishment may affect a total surrounding area of approximately 180,000 ha (Sihombing and Simanungkalit, 2020). One of the crucial requirements of the IKN concerns the need for energy, from either conventional fossil sources and/or from renewable energy sources. Currently the renewable energy production in the area is close to 0%, which poses a crucial dilemma if the city aims to become as one of the greenest city in the world. At the same time, however, the location of the IKN is in an area surrounded by tropical forest and nature reserves, combined with facilities for energy production, thus providing with developed infrastructure, there is great potential for clean water and different types of renewable energies. Moreover, the current political context of Indonesia is also one which aims for international recognition for sustainable and renewable energies (Bland, 2021). Hence, a sustainable and renewable energy assessment of the newly designed IKN is timely and opportune. Such an assessment needs to rely on multiple types of data, which can predict and simulate both demographic and industrial growth scenarios as well as estimates of water, forest, soil and meteorological consequences.
The core questions for this article are:
• Where, how and in which direction is the IKN most likely to develop?
• Which type of energy requirements would such a development have?
• Under which conditions can renewable energies address the energy requirements for the IKN?
Answering these questions first requires an insight in how new capital cities are developing. This can draw on general insights in urban design and expansion theories, as well as a comparative evaluation of the development paths of similar new capital cities. After this follows a reflection on current plans for the IKN and an assessment of possible scenarios of size in time. Hereby we need to rely on existing documents, plans and debates, mostly available through gray literature, personal communication with public offers and planners and a review of information in the media. Based on these plans one can calculate the energy requirements for different scenarios of size and growth. After this, one can assess how renewable energy potentials–derived from existing topographic, wind and sunlight characteristics–can replace the current electricity provision. The next sections follow this sequence.
Urban Design and Expansion Theories
Any design and/or relocation of capital cities faces a number of theoretical, conceptual, socio-cultural and institutional challenges. There are multiple theories and conceptual frameworks on the design, shaping and construction of new cities. Originally, designs of new cities followed artistic principles (Sitte, 1965), ecological principles (Cadenasso and Pickett, 2008) and principles of regional cities or those of compact cities (Thomas and Cousins, 1996; Anabtawi, 2018), for example. More recently, such designs need to adhere to principles of sustainable cities (Bibri, 2018), urban resilience (Ribeiro and Gonçalves, 2019), liveability (Southworth, 2016), city branding (Lu and Fu, 2019), city of public urban spaces (Carmona, 2021) or smart city development (Han and Hawken, 2018), to mention just a few. Specific for capital cities is that they must represent the ideal image of the country and country's history, be multi-functional in politics and commercial life yet also be able to host performative functions and act as cultural center (De Vries, 2021; Hackbarth and de Vries, 2021). If furthermore designed in accordance with responsible land management principles, capital cities need to take into account human recognition of indigenous and traditional values and symbols and provide spatial justice and participatory inclusion in the design and execution processes. Furthermore, the design of cities should affect or deteriorate cultural and traditional landscapes and cityscapes, which act as symbolic elements to represent national identity. Finally, of further crucial importance are land tenure security, affordable housing, securing spatial diversity and acknowledgment indigenous and/or traditional identities within the city boundaries (De Vries, 2021).
Designing or redesigning requires geospatial data and geospatial development and expansion models, which deal with multiple factors relevant for expansion. Obviously, observable artifacts of city expansion are artifacts related to increasing numbers of people, such as new houses and new social activities. However, these expansions also require other spatial features, such as resources and infrastructure, energy provision and new roads. The establishment of other capital cities has shown a variety of spatial effects, in terms of demographic changes, urban-rural conversions, informal encroachments and environmental impacts (Rossman, 2018). Yet, conceptualizing these dynamics in a single model remains a challenge, given the variety of both spatial and thematic effects, which these previous examples have shown. Hackbarth and de Vries (2021) posit that significant unknowns in all of these examples constitute population growth (and thus the extent to which and the direction in which cities are likely to expand), and resources needs. There are both new capitals, which have turned into sleepy ghost towns (e.g., Belmopan, Yamoussoukro), whereas there are others whose population numbers and densities have increased rapidly explosively (e.g., Abuja, Brasília). Similarly, a city such as Sejong in South Korea was designed immediately as a smart city with active data-collecting sensors and prediction mechanisms, whereas others immediately suffered from negative environmental impacts and limited access to resources and energy facilities (e.g., Nouakchott, Islamabad). Therefore, extensive and complementary data collection is important for modeling and generation of growth scenarios.
Besides clarity on how and where city could expand, one would also need clarity about which types of energy facilities could support the creation of a smart city supported by renewable energy provision. Currently, Indonesia's energy supply depends primarily on oil, gas and coal, even though the potential for renewable energy is high. Especially in East Kalimantan and the IKN area, coal and gas fire plants are dominant. Hasan et al. (2012) indicate however that with Indonesia's current energy consumption rates, crude oil and natural gas reserves will last 23 and 52 years respectively.
The two pillars of the smart city in terms of energy supply are sustainable energy production and smart distribution. Smart distribution includes the internet of things, an omniscient cloud, a responsive energy network and a smart grid. The benefit of smart electricity grids lies in the capabilities to simultaneously generate, store and use (or consume) electricity (Masera et al., 2018). This implies that both the existing infrastructure to transport electricity need to be accompanied with added electricity sources and network control and regulation tools, which can accommodate power fluctuations in the grid because of fluctuations in the energy sources (e.g., switching to wind energy if winds speeds are significant and relying on solar energy during significant solar activity). Such a system would obviously require smart optimization algorithms that can accommodate flexibility in energy provision.
The New City Design Case of the New Capital City of Indonesia
In November 2021, reports were that the current administration of Indonesia government would start moving the country's capital city (IKN) from DKI Jakarta to East Kalimantan (Kaltim) in the first semester of 2024. The policy for relocating the nation's capital is contained in the Draft Law on the State Capital (RUU IKN)1 Article 3 of the IKN Bill states that “The transfer of the status of the State Capital from the Special Capital Region of Jakarta to IKN is carried out in the first semester of 2024 and is stipulated by a Presidential Regulation,”. “Since this Law (IKN) was promulgated until the date of the promulgation of the Presidential Regulation concerning the Transfer of the Status of the State Capital from the Special Capital Region of Jakarta to IKN, the position, function, and role of the IKN remain in the DKI Jakarta Province,” Article 28 paragraph (1).
The status of the IKN is that there are different scenarios for the size and the specific boundaries, which range from a core area of the IKN of several hectares needs for the main government administrative buildings only, to a full size capital region covering an area of 256,142.74 hectares. We had to rely on the largest scenario to evaluate the largest possible impact. The boundaries of this region were derived from digitizing the informal maps issued by the government and connecting these to existing geospatial data available from open sources.
The current energy conditions are not yet favorable to construct a smart energy IKN. Putra et al. (2020) argue that many parts of Indonesia, including the designated IKN area, has insufficient capacities to provide stable energy and handle flexibility in supply and demand. The IKN would therefore need to rely on a smart grid complemented by adequate assessments of future energy needs and potential renewable energy provision. This requires both a spatial and assessment of how current topography and meteorological conditions could be favorable to provide how much energy and an assessment of possible volumes for different scenarios of the IKN growth.
Currently, East Kalimantan relies on 150 kV transmission lines, but the plans are to expand this network to 275 kV and 500 kV interconnection lines. The grid in Indonesia is with T&D (transmission and distribution) losses over 7% unstable. The average electrical energy consumption per capita in Indonesia is 972 kWh per capita per year. For an IKN with 1.5 million inhabitants, as planned in the first stage there would be an estimated capacity need of 1,500 MW.
The electrical system in East Kalimantan is called Mahakam and is includes 25 power plants with a peak load of around 408 MW with 18 substation units. One of the transmission lines goes straight through the IKN area. With the new capital city moving into this electrical system, the load and reliability of the grid must undergo significant changes. The East Kalimantan grid covers seven voltage ratings (Hermanu et al., 2019):
• Voltage 150 kV on the main bus substation, which is the interconnection of all existing
• Substations
• 20 kV, repeating between the main bus at the substation and the bus generator
• Voltage 6.3 kV
• Voltage 13.8 kV
• Voltage 10.5 kV
• Voltage 3 kV
• Voltage 0.4 kV
The Mahakam system uses an interconnected electrical system with a voltage of 150 kV. The 150 kV transmission line, which connects Balikpapan City and Samarinda City, will be the initial point for the IKN grid. Before merging the Mahakam and the Barito grid, the installed cable length in the Mahakam System were 269 km of 150 kV, 4,094 km of 20 kV and 4,226 km of 400 V cable. Without considering the construction of the new capital city, the electricity demand in East Kalimantan is growing at a rate of 7% per year. However, the delta of the peak and bottom power load in the Mahakam is below average, caused by industrial users relying on their power generation (PLN, 2020). In February 2020, Sutijastoto, the director of the NREEC, the Directorate General of New, Renewable Energy and Energy Conservation, presented the implementation of renewable energies in the new capital city. According to calculations of the ministry, the electricity supply needed for the new capital city is 1.55 GW. The ministry used the following assumptions in its calculations (Sutijastoto, 2020):
• Population 1.5 million inhabitants
• Consumption per person 4,000 kWh
• Electricity needs 6,000 GWh
• Losses 10%
• Load Factor 63%
• Power Production 6,600 GWh
• Peak Load: 1,196 MW
With a reserve margin of 30%, the electricity supply needs to be prepared to be 1,555 MW. Therefore, the RUPTL expects a renewable energy development of 1,550 MW in North and East Kalimantan. The Electricity Supply Business Plan (Rencana Umum Penyediaan Tenaga Listrik–“RUPTL”) from 2016 until 2028 is a development plan for the operational areas (Wilayah Usaha) of PLN, the national energy company. It indicated the projects that will be constructed by PLN and the projects tendered for Independent Power Producers (IPP) investors (PwC, 2016).
In 2018, a PLN East and North Kalimantan representative stated, “We successfully synchronized the two electricity systems at the Tanjung electrical relay station.” As a result, PLN merged the East (Mahakam system) and South Kalimantan (Barito system) grids to have a utilization capacity of up to two GW (Adri, 2018). After the decision of the move to East Kalimantan and the estimation of the electricity supply of IKN with 1,550 MW, the director of the Director-General of Electricity at the Ministry of Energy and Mineral Resources, Rida Mulyana, published plans for new power plants in the area. Consistent with the RUPTL 2028 plan, another 864 MW of power plants in the East Kalimantan Province were added to the 691 MW already planned. As a result, the Kalimantan Interconnection system (Barito + Mahakam) should have a capacity of 1,570 MW with a peak load of 1,095 MW and 475 MW with a reserve margin of 30% (Indonesia Window, 2019).
Urban Geospatial Modeling Methodologies
Geospatial data and models can help to derive how and in which direction the IKN is most likely to develop, and to estimate how much and which energy such an IKN would need.
The first step is to assess the total area of the IKN and convert this into geographic information formats. With the help of documentation on the location and scenarios of the IKN collected by researchers of the Institute of Technology of Kalimantan (in Balikpapan), it was possible to derive and digitize the boundaries of the IKN area using google maps. These boundaries acted as a spatial mask to search for other relevant data in different geospatial data repositories. Land use data and a Digital Elevation Model (DEM) were extracted based on Sentinel and Landsat 8 data and using the EarthExplorer tool from the United States Geological Survey (USGS). The classification of the images relied on the Semi-Automatic Classification Plugin in software QGIS 3.16, following the prescription of Congedo (2021), which enables the pre-processes the images, classifying and postprocessing the classification with built-in algorithms developed in Python. Satellite images from Landsat 8 and Sentinel 2 satellites were used to get an examination of the site. With a vector file obtained from the planners of the new capital in an informal manner, it was possible to narrow down the area. The satellite images used for the classification relied on the available images from The United States Geological Service (USGS). Table 1 provides the remote sensing data used to delimit the IKN area. The area lies actually on the border of four adjacent images. Four other Sentinel 2 images were merged to one and afterwards clipped with the vector of the IKN area. Figure 1 portrays the merged and vector-clipped data. Two other Landsat 8 satellite images of the area enabled to substitute those areas that had a high cloud coverage of the Sentinel 2 images. Sentinel images do not only offer a larger selection of images, as a revisit frequency is guaranteed by two satellites rotating in the orbit phased at 180 °, but also provide a more precise resolution compared to the alternatives (10 m per pixel for multispectral) (see Table 2). Table 1 provides an overview of used images, selected with emphasis on low cloud coverage. Due to the mostly high cloud coverage in the region and IKN being on a borderline of four satellite images data collection was particularly difficult. Nevertheless, it was possible to find images with satisfactory cloud coverage over the study area, which could be masked and substituted by Landsat 8 images after classification. The two Landsat images were selected because they had low cloud coverage in the unclassifiable spots of the Sentinel images. The images came from the repositories of USGS. Table 2 describes the resolution of the Sentinel bands.
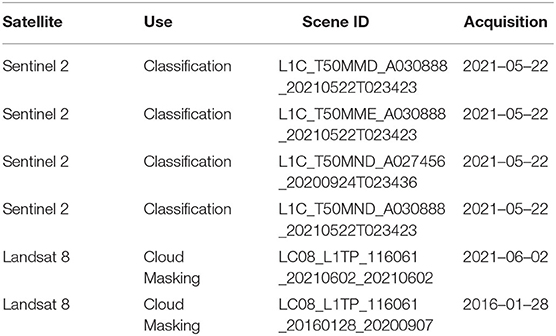
Table 1. Remote sensing data used for selecting the IKN area.
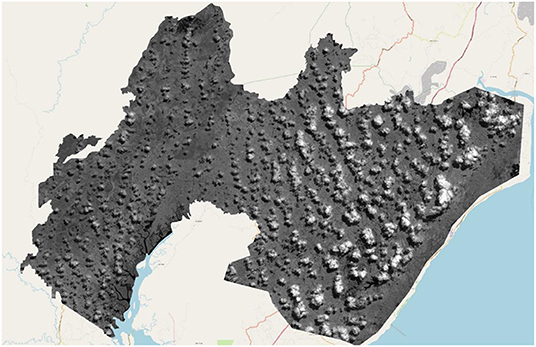
Figure 1. Merged and clipped sentinel 2 image before classification.
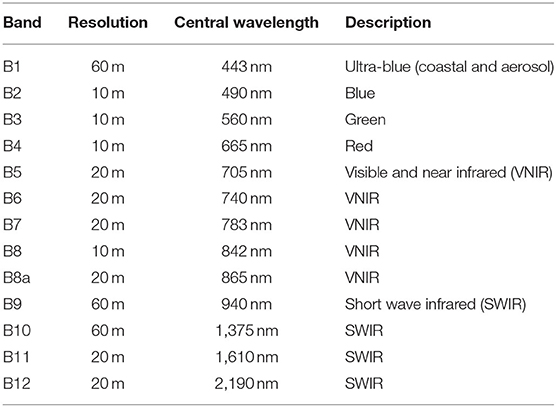
Table 2. Sentinel 2 bands.
Accuracy assessment of the final LULC map of the IKN area was conducted with the stratified estimation method by Olofsson et al. (2013). The accuracy assessment tool of the QGIS software gives the total number of pixels to be used for the estimation of the accuracy with the formula:
Wi is the area percentage per class, given in the classification report. The expected standard deviation of the overall accuracy So can be assumed. The standard deviation Si is calculated within the tool. The total number of classes c are the eight classes, used in this research. The number of necessary training input pixels was calculated to be 72 and was exceeded by the actual number of training inputs. The accuracy assessment also includes a random pixel generator given randomly chosen points on the map and saves them to a reference file. One must assign the specific values of the classes to the generated pixels, by using additional maps as comparison criteria.
The classification process drew on the procedure utilized by Verstegen et al. (2019). The satellite images were visually inspected and compared with similar pictures from Verstegen's land cover analysis, google maps images and Google Street View. The land use classification process employed the SCP function in QGIS Version 3.16. for the Sentinel 2 images. With extensive region of interest (ROI) collection spectral signatures of different ROIs were inserted into the training input shapefile. Training input for the macro classes of water bodies (WB), mining area (MA), natural forest (NF), industrial forest (IF), palm oil (OP), urban built-up (UB), agriculture (AG) and grass / scrubland (GS) was defined and used for the consequent classification. Clouds and cloud shadows were further classified as 0 in order to be able to mask them and to insert classified areas from the Landsat 8 images into the empty spaces. Figure 2 displays the workflow of the entire classification process.
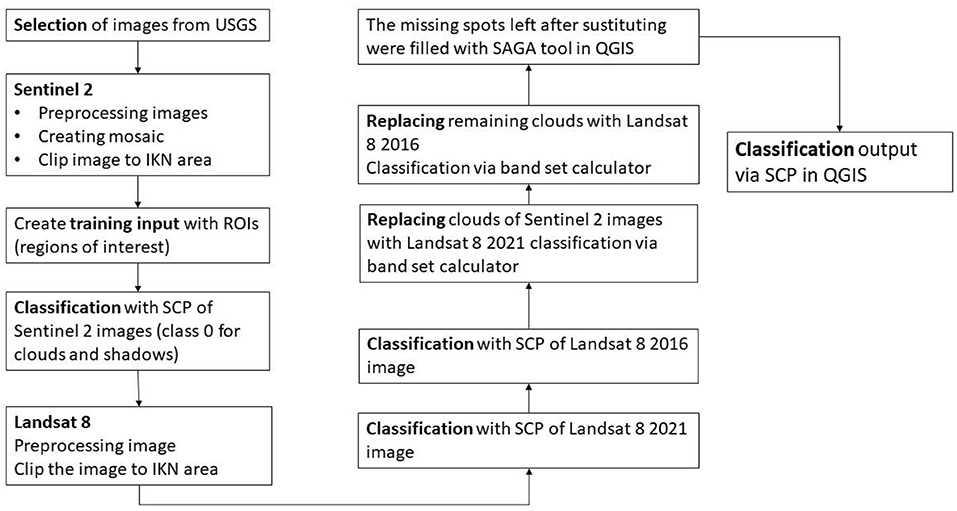
Figure 2. Work flow of classification process.
For the city development, urban growth scenarios and land use changes were derived from the study and associated datasets of Hackbarth (2021). This study compared the CLUE-S model and the FUTURES system, which are both operational within Grass GIS, and opted to rely on the latter given the active support on the one hand, and the possibilities for scenario development (Petrasova et al., 2016). It requires at least two LULC maps (Meentemeyer et al., 2013), which can be directly utilized by QGIS. For the simulation of the urban expansion patterns after the construction of the new capital one has to rely on the land cover situation in the area after a given planned building stage as a point of reference. In this first construction phase in 2024, there is only the main government campus planned. This is however suitable for the expansion model as a starting point of reference. For the expansion, it is possible to use the r.sample.category2 and the v.net function3 in Grass GIS, which creates a randomly generated street network within the planned urban development area. Afterwards, a random road network can then be calculated with the v.net function by connecting the various points within the boundaries of the total area available. To a certain degree these road expansions already exist when visually inspecting the satellite images, as these are informal paths to access existing or past palm oil and timber plantations.
For the second step, i.e., the assessment of energy requirements, additional data included maps of protected forest and nature areas, satellite and meteorological solar energy data, satellite and metrological wind energy data, and data related to grid infrastructure and energy and electricity distribution. In order to calculate wind and solar energy the following processes were done. From the digital terrain model, it was possible to calculate and derive a map of the hillshade, aspects, slopes. The data on protected areas were classified into categories peat, karst, wetland, moor, birds' sanctuaries, and the protected grand forest park. The solar power potential was derived from a map showing the PV potential and the global horizontal irradiation. The wind power potential map relied on data related to the capacity factor IEC Class III, wind power density, mean wind speed and (landscape) roughness length. To gain additional knowledge in project development, greenfield engineers from different fields and countries were contacted. For example, Greenfield engineers for solar and wind energy projects in Germany, Greece and Indonesia, who could share the experience and insights from previous studies. The estimated population for the IKN is 1.5 million inhabitants. The total needed energy will be around 3.75 TWh/year to 4.5 TWh/year, with a 4,000 kWh consumption per person (total demand of the city divided per person). The construction phase of the IKN alone will already require a significant increase in energy production. Once constructed, the electricity demand will rise sharply due to consumption from office activities, housing, and services such as education, hospitals, and shopping malls.
The Global Windatlas databank provided the base data for possible wind energy outputs. The atlas is published by the World Bank Group, funded by ESMAP, and prepared by the Department of Wind Energy at the Technical University of Denmark (DTU Wind Energy) and operates a platform for access to historical, recent, and forecast data. Data used for this study are:
• Capacity Factor IEC Class lll
• Wind Power Density
• Mean Wind Speed
• Roughness Length
The Capacity Factor, the Wind Power Density and the Mean Wind Speed are largest at the northwest end of the IKN area. However, the roughness factor is too high in this area due to the hilly land. This analysis goes hand in hand with the slope map. Similar to the northwest are the potentials for wind energy in the eastern part of the area. Wind speed is higher because of the proximity to the ocean. The capacity factor is around 0.15 until 0.2. The wind power density lies between 50 and 80 W/m2. The mean wind speed per year is around 4 m/s. The roughness length is the lowest in the eastern area. If restricting oneself to the eastern part of the new capital to project wind turbines, one must reckon with the following basic conditions. To exclude zones with poor potential for wind turbines, the following parameters were set.
• Wind power density > 40 kW/m2
• Mean Wind Speed > 3,6 m/s
• Capacity Factor IEC 3 > 6,5%
We excluded various areas for locating possible power plant projects:
• Areas where the land-use class is water (1), forest (3) or agriculture (7)
• Areas with protected wetland (more and mangroves)
• areas of national protection
• Bukit Soeharto Grand Forest Park
• Hutan Samarinda-Balikpapan birds' sanctuary
• Areas where the governmental buildings of the IKN are planned
For the establishment of how and where renewable energy could address the energy needs, we had to rely on the Global Solar Atlas, released for the solar potentials in Indonesia. The Atlas, published by the World Bank Group, funded by ESMAP, and prepared by Solargis. Solargis develops and operates a platform to access historical, recent, and forecast data (Global Solar Atlas, 2019). It calculates the PV output, i.e., the assessment of power production potential for a PV power plant with freestanding fixed-mounted c-Si modules, mounted at an optimum tilt to maximize yearly PV production.
For the solar potentials, we also had to rely on the slope steepness and slope direction. The optimal angle of the alignment of the solar panel depends on the season and the location. The azimuth is changing over the day but also over the year. Indonesia has a relatively low tilt-angle of 7°-10° north-facing (Shakti Pumps, 2020). Building on a north-facing slope in the area, this must be taken into consideration. South-facing slopes must be excluded due to possible shading and loss of direct sunlight hours. Since the area to be developed is relatively close to the equator, the areas are excluded here only with a slope of 8° south and more. To generate the maximum energy output, the optimum angle for orientating must be determined. For the specific part of Indonesia, the optimum angle for summer (April—September) is around 20°. The optimum angle for winter is around 0°. The results in a north-facing tilt angle for the year of 8° (Shakti Pumps, 2020). One could indeed argue that solar potential fluctuates through the year, but we used the figures provided in the SolarAtlas as an overall guide to what is possible and feasible.
Results
Development of IKN
Figure 3 presents the classification output for the IKN area. The new capital city has an area of 55,491 hectares, of which 35,772 ha is currently forest, 74,460 industrial forest and 37,201 ha palm oil. The planned center area for the government itself is 5,137 hectares. The capital city designated administrative total area is approximately 183,798 hectares. Figure 3 shows the IKN area after finishing the two significant parts of the city. The governmental area (Brown) and the main urban area (Green). Table 3 displays an overview of the land use changes for the initial phase of IKN development.
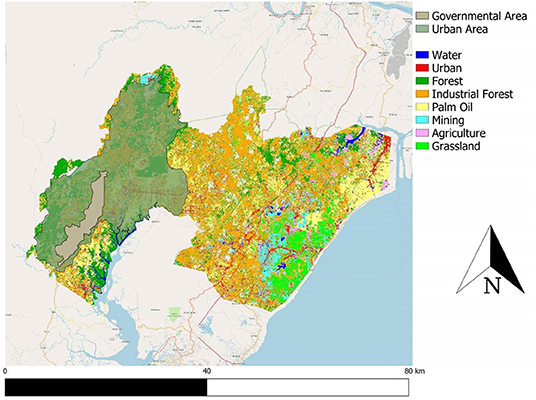
Figure 3. IKN area with urban and governmental part.
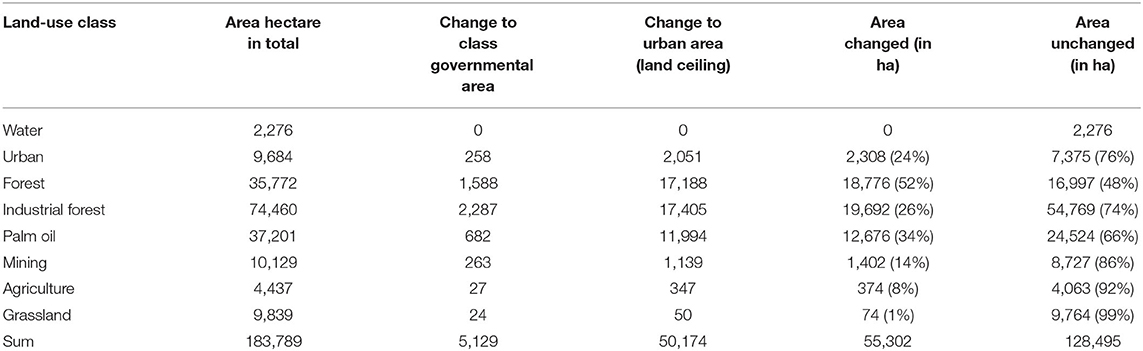
Table 3. Overview of land-use changes in the IKN area.
Figures 4–6 present the Digital elevation model (DEM) of the IKN area and the associated hillshade, slope and aspect maps, which enable the assessment of where to locate the renewable energy potentials.
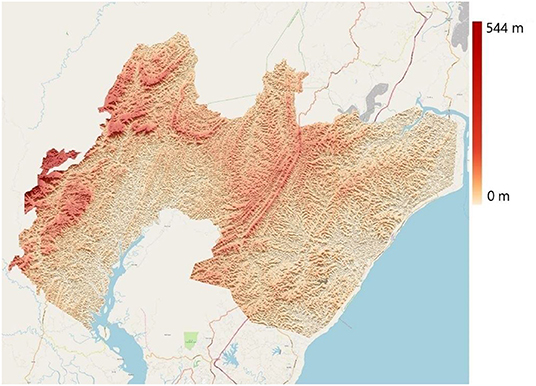
Figure 4. Digital elevation model IKN area.
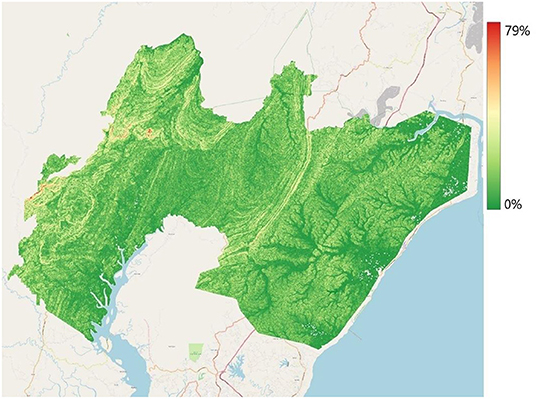
Figure 5. Slope map.
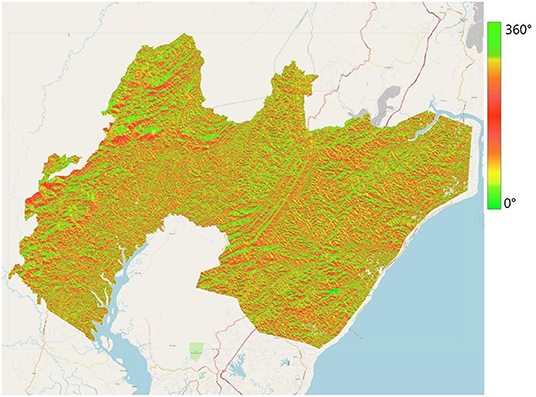
Figure 6. Aspect map.
The slope is a rate of change in altitude from pixel to pixel. It is displayed in percentage and can be converted into degrees. It shows the steepness of the terrain, which is helpful in site analysis for construction projects. For the slope map, a steepness of 70% would equal a 38° slope. The IKN area has mostly plane slopes under 10%. The western part of the area and one ridge in the middle have steeper slopes.
With a radius of 360 degrees, the map shows the compass direction of a continuous surface like the terrain represented in the DEM (north, northwest, etc.). The aspect map is helpful to identify landscapes like valleys or, in particular for this study, the amount of solar irradiation on the surface. Green is north facing; red is south facing. Because the IKN area is located in the southern hemisphere, potential solar power plants are looking for north facing slopes. Potential sites for wind energy are also affected by the slope in the construction of the turbines. The roughness factor of the terrain is directly connected to the power production of the wind turbine and a derivation of the slope map (Zhang et al., 2017).
Energy Requirements for IKN Development
The current Kalimantan Interconnection System (East Kalimantan, South Kalimantan, and Central Kalimantan) has a capacity of 1,569 MW with a peak load of 1,095 MW (Prasetyo, 2019). The current transmission lines going through East Kalimantan have a capacity of 150 kV. The PLN has already published plans about upgrading the transmission line to 275 kV, but it is clear that establishing the IKN will necessitate an upgrade of the existing infrastructure, exceeding the current upgrading plans.
The analysis of wind energy potentials depends on suitable locations. The results of finding suitable locations for wind energy using the wind potential indicators are three maps (Figure 7) with binary values 1 (white) and 0 (black), whereby 1 indicates a potential location for wind energy, and 0 no potential. The wind speed and power density are given as an average value over the year at an altitude of 100 meters. The South Kalimantan Energy Outlook 2019, for example, was calculated with a mean wind speed at 5–6 m/s but measured at an altitude of 150 meters (Ea Energy Analyses Danish Energy Agency, 2019). This results in a capacity factor of 36%. Even though the area of East Kalimantan has low wind energy potential, this does not eliminate the potential of profitable wind farms. Nevertheless, it is essential to exclude research older than 3 years. The opportunities to exploit wind energy potential increases every year with larger turbines. Research results older than 3 years may have lost their validity. Merging the wind potential indicator maps, green area shows the high wind potential areas.
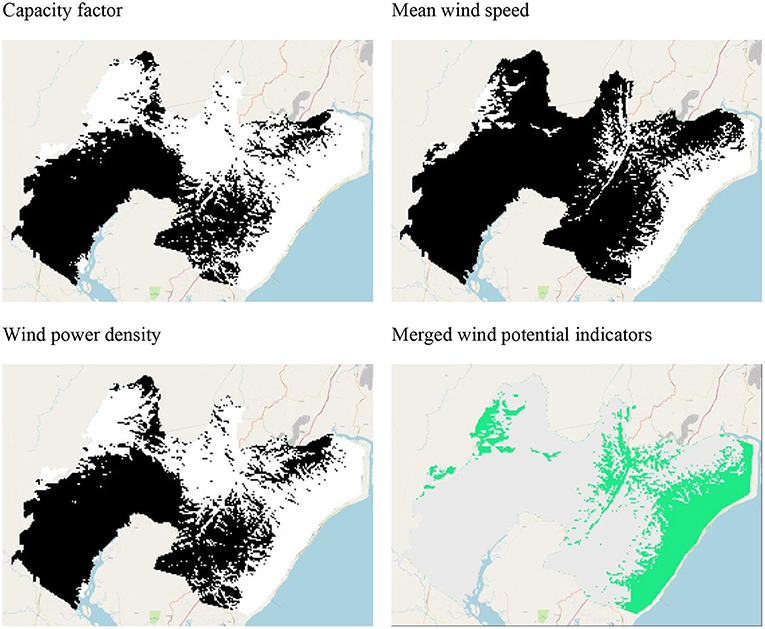
Figure 7. Wind energy potential indicators.
The wind energy potentials are predominantly located in the east, close to the coast. This map is however only first rough assessment of where to locate wind energy plants. A crucial technical requirement additionally includes also the type of wind turbines in connection to the terrain characteristics. Some areas do have good wind conditions but need to be excluded as well because these are in wetlands, unfit slopes slope or land use. Figure 8 therefore presents a better estimate of potentials, containing areas with low wind energy potential, indispensable land classes, protected wetland and steep slopes are excluded and marked as “no construction”. Excluded are:
• Land use classes 1: water bodies, 3: natural forest, 7: agricultures
• Slopes above 7°
• Protected wetlands
• Areas with low wind energy potential
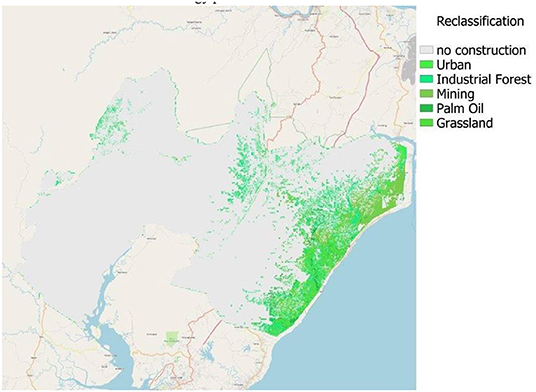
Figure 8. Wind energy potential with the exclusion of significant land use, high slopes, and protected wetlands.
Considering the roughness length, it is the lowest in the eastern area. If restricting oneself to the eastern part of the new capital to project wind turbines, one must reckon with the following basic conditions. The involvement of the roughness length goes hand in hand with high wind energy potentials. Also confirmed by the digital terrain model in Figure 4.
The analysis of solar energy potentials depends on multiple indicators. The first concerns the solar potentials. Figure 9 presents a map of the Global Horizontal Irradiation values.
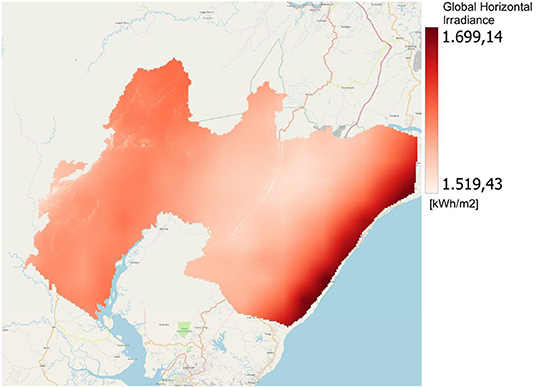
Figure 9. Global horizontal irradiation.
The analysis of the potential from solar energy follows a similar sequence as for wind energy. The first step is to create binary maps based on the solar potential indicators (Figure 10).
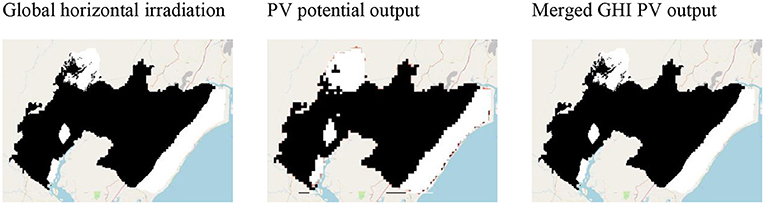
Figure 10. Locations with high and low solar potentials.
Merging the maps and excluding certain designated land use types leads to Figure 11.
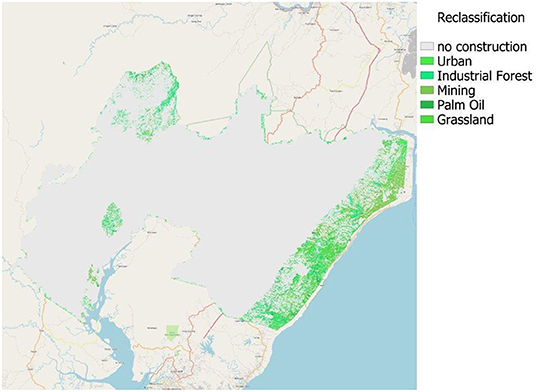
Figure 11. Solar energy potential.
The highest photovoltaic possibilities are in the east of the region. After mapping the solar potential and matching the potential solar maps with the restricted area around the new capital city, the slope and aspect of the site are being considered. The average cloud cover density gets denser moving further west. That is why there is a relatively sharp cut in the potential map—continuing working with this map, areas further west should not be excluded in the case of the missing area. The entire territory IKN has global horizontal irradiance of at least 1,500 kWh/m2, which indicates Indonesia with great potential for developing solar power systems all over the area.
Under Which Conditions Can Renewable Energies Address the Energy Requirements for the IKN?
The network for the new capital will need to branch from the main central transmission line running from Balikpapan to Samarinda. In constructing large energy projects, preference should be given to potential sites near the transmission line. Here, costs can be saved due to shorter transmission paths to the main network and cable losses can be minimized. On average, a wind farm in Germany loses 2% of the electricity from the turbines to the substation (BayWa Renewable Energy, 2020). High voltage signifies low losses. The shorter the distance from producing the electricity until it arrives in the high-voltage grid, the better it can be distributed over the IKN area.
In mining areas, the construction of a wind farm can lead to advantages in cost reduction. Mining areas are also suitable for the project planning of wind parks since the electricity infrastructure is given and so is the transport infrastructure. Due to the large machinery needed for coal mining, it is no problem to transport rotor blades and parts of towers to the given location. However, there is not enough wind to have sufficient wind energy.
Furthermore, it is essential in a country like Indonesia and an area close to the coast to consider the salinity of the air when opting for solar energy. The effects of salt spray on the panels for example directly affect PV systems on cargo ships. The salt spray has a weakening effect on the electrical output of the modules. The solar radiation levels reduce with salt spray on the panel. Salt spray can also lead to corrosion, but in a non-marine environment, this can be neglected compared to the decreasing irradiation. The salt spray creates a water film on the surface of the module. When the water evaporates in the heat during the day, salt particles are left on the surface (Zhang and Yuan, 2021). Therefore, a thin area on the coast is excluded from the construction. Additionally, the slope, representing the change in altitude, and aspect, representing the alignment of the slope issued in degrees, are taken into consideration. Solar power plants will be constructed in the southern hemisphere but still relatively close to the equator. Therefore, the ideal plot for development needs to have north-facing areas and a slope of <7°. If the slope is <3.6°, the aspect doesn't matter anymore (Congedo, 2021).
Figure 12 show the solar potentials when excluding non-effective slopes, unfit land use classes 1,3 and 7, and excluding the protected wetlands, and south-facing areas, which are unusable for solar power plants.
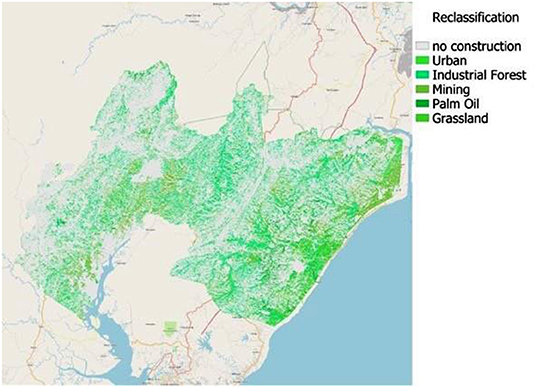
Figure 12. Solar energy potential including slope and aspect.
Just being excluded in Figures 12, 13 includes the land use classes 1, 3, and 7 again. Through dual use of the excluded land use classes 1,3 and 7, solar PV projects in these areas can be particularly lucrative (Figure 13). Pointed out in blue, red, and orange. Floating solar for water bodies and AgriPV for agriculture fields. Because of the low environmental impact and the lower investment costs through existing electricity and transport infrastructure, the red areas with the land use of mining needs to be prioritized. Overall, 0.08% of the land use are water bodies that can be used for floating solar. Therefore, water bodies in mining areas should be prioritized—the first classification report issued the Class 1 water bodies with 22 km2. Land use Class 6, mining fields, make 2.21% of the IKN area after excluding sites not suitable for the construction of solar power plants. This 2.21% should be the primary focus for solar PV projects. Located in the East of the IKN area, also solar radiation is the highest in these areas. The advantages are the existing electricity distribution, transmission lines and transport infrastructure. This advantage makes these areas unrivaled by other areas without previous infrastructure. The second advantage is the low environmental impact of using disturbed land in mining areas. The third land-use class is Class 7, the agricultural parts of the IKN area. These make 1.26% of the usable land. 23 km2 can be used to install Agri PV plants. In this case, every agricultural area needs a customized solution. Farmers and agricultural businesses should be contacted to elaborate personalized solutions depending on crop, location, and size. The result can be a win-win situation for farmers, investors, and electricity companies. By using areas that have already been partially excluded from the project planning, an additional 40 km2 of the area can be gained just in mining sites. In any case, priority should be given to unused mining areas and hydropower plants because of the existing electricity and transport infrastructure. If the chosen area for constructing power plants is part of those four areas, further actions are necessary.
• The Governmental area of Ibu Kota Negara, which is constructed in the first phase
• The Urban area of Ibu Kota Negara, which is built in the first phase
• The Bukit Soeharto Grand Forest Park (Tahura Bukit Soeharto)
• The Hutan Samarinda-Balikpapan birds' sanctuary
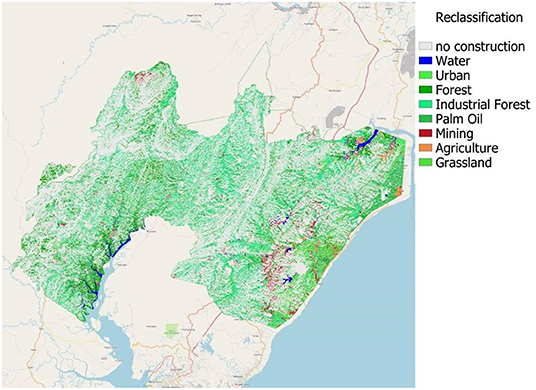
Figure 13. Solar energy potential with dual land use.
Opting for any of these alternatives is politically and ecologically sensitive and connected to possible compensation measurements. Although at the time of this investigation is still unknown to what extent the location of the power plants have been included in the design of IKN, in principle, the environmental arguments against reasons these options are multiple.
Discussion
The implications of the findings for the theory or urban growth and the modeling of urban development scenarios of new cities are that one needs to rely on the growth figures and characteristics of both similar other cities abroad and nearby cities to have a baseline model. These models may need to be adjusted regularly once the city starts to be built, and once certain dynamics—such as unplanned land use change, private spatial developments and investments and unplanned transmigration—are observable. Such requires an update of the spatial classification maps as well as regular monitoring of population dynamics. Part of these data may need to be collected by the neighboring regions, which are also directly affected by the growth. Additionally, there needs to be a close coordination between the different responsible sector agencies, such as those responsible for environment, transportation and infrastructure, to align the available datasets.
The findings have also shown a number of consequences for the choices in sustainable energy provisions. It has been clear that the current terrain and climate conditions are probably more suitable for tapping on solar than on wind energy as an additional, complementary energy resource. The energy demand figures are however difficult to predict at this moment, as a development toward energy-intensive economic activities, such as manufacturing industries and strong reliance on data centers which come with information industries, are largely unknown. This also calls for a close monitoring of economic developments and possible economic and environmental impact assessments on a regular basis. The study started with a synthesis of expert opinions and expectations in order to decide what sort of data and models would be needed to make the overall energy requirement assessment. Alongside these one needs however regular, or even continuous, updates of energy consumption in the area, especially once the construction activities start. This does however not imply that additionally investments in solar energy facilities and connections to the existing grid should be delayed. In fact, these could start immediately, such that the construction activities can already be partially supported by greener energies.
The investigation for the Indonesian capital also has implications of findings for development of capital cities in general, either at regional level or at national level. It may seem at first that constructing a new city has certain advantages over rebuilding or renovating existing cities, given that one may have more freedom to design spatial plans. However, the analysis of the terrain and the exiting environmental status quo also shows certain limitations and restrictions of spatial opportunities and possibilities. For energy provisions, the current terrain does not have natural locations where buildings and activities can directly benefit from, so there always needs to be additional infrastructure to connect to grids and to construct new energy facilities. Therefore, the benefit of constructing something new may not be directly clear. From a land management perspective, one could even argue that the construction of a new city may also result in disproportionate land take, at the expense of ecological resources, such as tropical forests. Nevertheless, the construction of a new capital city could also generate showcases of how new cities could be built, i.e., based on smarter and more responsible design principles. The design and energy considerations, and the workflow of collecting and analyzing the geospatial data cold thus be of relevance for future case.
There are of course a number of limitations of the findings and the chosen methodology. From a data management point of view, we had to rely on data from different sources and different qualities. The ideal situation would have been to tap into a broad repository of data via a national spatial data infrastructure portal. Certain data, such as topography, were indeed available here, but these were either not openly accessible, or incomplete for certain features. The consequence of these data gaps is that one has to rely on heterogeneous datasets and analysis software, whereby there is a strong risk of losing certain types of information during the process of integration. It is therefore recommended to build up a data repository for the development of the IKN specifically, whereby all agencies responsible for the development of the IKN cold tap in to.
Conclusion and Recommendations
The research aimed at answering three questions, related to (1) the size and direction of most likely urban developments of a new capital city; (2) the energy requirements for such a development, and (3) the conditions to supply this energy through renewable sources.
With regard to the size and direction, we derived that the most likely expansion is in the directions of the least environmentally sensitive (or in other words, the most protected) areas. Although it is currently unknown to which extent the locations of energy production facilities are included in the ultimate design of the IKN, the geospatial analysis indicates that these areas may be theoretically suitable for all types of energy production facilities. However, following previous examples of other new capital cities, and also in line with the current three major scenarios developed by the Indonesian government the most likely scenarios is a phased start and expansion of the IKN with relatively strong control measures to handle the new demands of the area, including those for energy.
Pertaining to the energy requirements for such expansions, we derived that for the most likely developments the estimated energy requirements far exceed the available energy production in and for the IKN area. Major energy provision projects in the entire projected IKN region beyond the initial phase are therefore imperative. The status quo of energy provision in East Kalimantan is relatively modest. With mainly coal-fired power plants, the system has a capacity of 475 MW with a peak load of 407 MW. With Indonesia's RUPTL 2028 business plan, more than 864 MW are planned. Another 691 MW are planned to meet the demand of the new capital city. With a demand of 1,500 MW for the new capital city, the demand in East Kalimantan will rise to 2,000 MW. Around 1,500 MW of power plant projects need to be projected in the next 10 years. 30% should be renewable energy, mainly in the IKN area of East Kalimantan. At the same time, the grid needs a significant expansion. To accommodate 1,500 MW of produced power, it requires a 500 kV main transmission line. The locations for such facilities are most suitable where not only no renaturation measures are necessary, but also where the current land use benefits the power plant project directly or indirectly. With the help of finding and deriving certain land use classes, it is possible to derive those locations. Benefits can arise for power plant projects at locations where existing facilities already exist and locations that are close to existing suitable infrastructures.
In connection to the conditions for sustainable energy to become the main source of energy provision, we found that solar energy—despite the fact that solar radiation may fluctuate through the year—has the highest potential and far more potential than wind energy. Despite The wind energy potential mainly relies on the potential for higher classes (3 or higher) of wind turbines, designed to perform with the highest output and reliability for the area's wind conditions: low wind breezes or heavy storms. The terrain analysis has shown that overall, the entire IKN area is relatively low and flat, which implies that most areas are not suitable for wind energy. For wind turbines in low wind areas, it is crucial to have a steeper power curve. Therefore, the turbine must reach its nominal speed at a lower wind speed. Even with large wind parks, it is therefore unlikely that the energy production will be sufficient to provide for the IKN economically. Policy changes in subsidies, wind farm tenders and electricity price are necessary to construct profitable wind farms. In contrast, the solar potentials in Indonesia in general and in the IKN region, are high. Economically, one could even argue that the output is high enough and the construction will be cost-effective when the construction of PVs is on unused mining areas and on or within existing hydropower plants because of the existing electricity and transport infrastructure. Additionally, one may opt for dual use of solar PV projects on land and water.
Data Availability Statement
The raw data supporting the conclusions of this article will be made available by the authors, without undue reservation.
Author Contributions
MS and WV: conceptualization, writing—original draft preparation, and writing—review and editing. MS: methodology, software, and visualization. WV: supervision. Both authors have read and agreed to the published version of the manuscript.
Funding
This publication was funded with support of the TUM Open Access fund.
Conflict of Interest
The authors declare that the research was conducted in the absence of any commercial or financial relationships that could be construed as a potential conflict of interest.
Publisher's Note
All claims expressed in this article are solely those of the authors and do not necessarily represent those of their affiliated organizations, or those of the publisher, the editors and the reviewers. Any product that may be evaluated in this article, or claim that may be made by its manufacturer, is not guaranteed or endorsed by the publisher.
Acknowledgments
We acknowledge the contributions of all interviewees in Germany and Indonesia.
Footnotes
1. ^Available via https://www.hukumonline.com/pusatdata/detail/lt5e25764e75a77/rancangan-undang-undang-tahun-2020.
2. ^Details are available via https://grass.osgeo.org/grass78/manuals/addons/r.sample.category.html.
3. ^Details are available via https://grass.osgeo.org/grass78/manuals/v.net.htm.
References
Adri, N. (2018). PLN Merges East, South Kalimantan Grids. The Jakarta Post. Available online at: https://www.thejakartapost.com/news/2018/06/05/pln-merges-east-south-kalimantan-grids.html.
Anabtawi, S. (2018). The Compact City: Utopian Vision or Practical Solution to Medium-sized Developing Country Cities. The Case of Jenin/State of Palestine. Doctoral Degree Technical University of Munich.
BayWa Renewable Energy. (2020). BayWa r.e. verkauft österreichisches Windprojekt. Available online at: https://www.baywa-re.com/de/news/details/baywa-re-verkauft-oesterreichisches-windprojekt (accessed 03 Jan, 2022).
Bibri, S. E. (2018). A foundational framework for smart sustainable city development: Theoretical, disciplinary, and discursive dimensions and their synergies. Sustainable Cities and Society 38, 758–794. doi: 10.1016/j.scs.2017.12.032
Bland, B. (2021). Man of Contradictions. Joko Widodo and Thew Struggle to Remake Indonesia. Melbourne: Penguin Books. doi: 10.1355/CS42-3h
Cadenasso, M. L., and Pickett, S. T. (2008). Urban principles for ecological landscape design and maintenance: scientific fundamentals. Cities Environ. 1, 4. doi: 10.15365/cate.1242008
Carmona, M. (2021). Public Places Urban Spaces: The Dimensions of Urban Design. New York, NY: Routledge. doi: 10.4324/9781315158457
Congedo, L. (2021). Semi-automatic classification plugin: a python tool for the download and processing of remote sensing images in QGIS. J. Open Source Software. 6, 3172. doi: 10.21105/joss.03172
De Vries, W. T. (2021). Urban greening for new capital cities. A meta review. Front. Sustain. Cities. 3. doi: 10.3389/frsc.2021.670807
Farid, V. (2021). Can Indonesia's New Capital Attract Capital for Renewable Energy? Clean Energy Finance Forum. Available online at: https://cleanenergyfinanceforum.com/2021/05/11/can-indonesias-new-capital-attract-capital-for-renewable-energy (accessed 03 Jan, 2022).
Hackbarth, T. X. (2021). An Integrated Land Use Change and Water Availability Assessment of Indonesia's Currently Relocating Capital Master of Science Environmental Engineering, Technical University of Munich.
Hackbarth, T. X., and de Vries, W. T. (2021). An evaluation of massive land interventions for the relocation of capital cities. Urban Scie. 5, 25. doi: 10.3390/urbansci5010025
Han, H., and Hawken, S. (2018). Introduction: innovation and identity in next-generation smart cities. City, Culture Society. 12, 1–4. doi: 10.1016/j.ccs.2017.12.003
Hasan, M. H., Mahlia, T. I., and Nur, H. (2012). A review on energy scenario and sustainable energy in Indonesia. Renew. Sust. Energ. Rev. 16, 2316–2328. doi: 10.1016/j.rser.2011.12.007
Hermanu, C., Nugroho, E., and Iftadi, I. (2019). Effect of transmission switching and short circuit on the transient stability at interconnected power system: A case study of 150 kV Mahakam East Kalimantan electrical power system. AIP Conf. Proc. 2097, 030035. doi: 10.1063/1.5098210
Indonesia Window. (2019). Indonesia's new capital city needs 1,555-MW power plant, 28 October 2019. Available online at: https://indonesiawindow.com/en/indonesias-new-capital-city-needs-1555-mw-power-plant/ (accessed 27 March, 2022).
Kodir, A., Hadi, N., Astina, I., Taryana, D., and Ratnawati, N. (2021). The Dynamics of Community Response to the Development of the New Capital (IKN) of Indonesia. Routledge: Development, Social Change and Environmental Sustainability. doi: 10.1201/9781003178163-13
Lu, J., and Fu, J. (2019). Research on City Brand Identity Design Based on Perception. International Conference on Applied Human Factors and Ergonomics. Cham: Springer. p. 381–390.
Masera, M., Bompard, E. F., Profumo, F., and Hadjsaid, N. (2018). Smart (electricity) grids for smart cities: assessing roles and societal impacts. Proc. IEEE. 106, 613–625. doi: 10.1109/JPROC.2018.2812212
Meentemeyer, R. K., Tang, W., Dorning, M. A., Vogler, J. B., Cunniffe, N. J., and Shoemaker, D. A. (2013). Futures: multilevel simulations of emerging urban–rural landscape structure using a stochastic patch-growing algorithm. Ann. Assoc. Am. Geogr. 103, 785–807. doi: 10.1080/00045608.2012.707591
Nangoy, F. (2021). Renewables to Make up at Least 48% of Indonesia's 2021-2030 Electricity Plan. Available online at: https://www.reuters.com/business/energy/renewables-make-up-least-48-indonesias-2021-2030-electricity-plan-2021-06-04/.
Olofsson, P., Foody, G. M., Stehman, S. V., and Woodcock, C. E. (2013). Making better use of accuracy data in land change studies: Estimating accuracy and area and quantifying uncertainty using stratified estimation. Remote Sens. Environ. 129, 122–131. doi: 10.1016/j.rse.2012.10.031
Petrasova, A., Petras, V., Van Berkel, D., Harmon, B., Mitasova, H., and Meentemeyer, R. (2016). Open source approach to urban growth simulation. ISPRS. 41, 953. doi: 10.5194/isprs-archives-XLI-B7-953-2016
PLN. (2020). Perusahaan Listrik Negara. Available online at: https://web.pln.co.id/en/about-us/company-profile (accessed March 30, 2022).
Prasetyo, A. (2019). Ibu Kota Negara Baru Harus 100% Manfaatkan Energi Terbarukan. Media Indonesia. Available online at: https://mediaindonesia.com/humaniora/255932/ibukota-negara-baru-harus-100-manfaatkan-energi-terbarukan (accessed March 30, 2022).
Putra, A., Sudiarto, B., and Setiabudy, R. (2020). Techno-economic analysis of remote microgrid and high voltage interconnected grid development in isolated area. IOP Conference Series: Earth, and Environmental Science. IOP Publishing. p. 012020. doi: 10.1088/1755-1315/599/1/012020
PwC. (2016). Release of long-awaited 2016–2025. RUPTL – a Positive Sign for IPP Investors. Jakarta: PwC Indonesia Energy, Utilities and Mining NewsFlash.
Ribeiro, P. J. G., and Gonçalves, L. A. P. J. (2019). Urban resilience: a conceptual framework. Sustain. Cities Soc. 50, 101625. doi: 10.1016/j.scs.2019.101625
Rossman, V. (2018). Capital Cities: Varieties and Patterns of Development and Relocation. London: Taylor and Francis. doi: 10.4324/9781315735061
Shakti Pumps (2020). Optimal Angle Solar PV Calculator. Available online at: https://www.shaktipumps.com/solar-calculator.php.
Sihombing, R. M., and Simanungkalit, F. (2020). The impact of Indonesia capital relocation to Kalimantan peatland restoration. Sociae Polites. 21, 234–244. doi: 10.33541/sp.v21i3.2262
Sitte, C. (1965). “City planning according to artistic principles 1889”, Trans, George R. Collins and Christiane Crasemann Collins (eds). London: Phaidon P.
Southworth, M. (2016). Learning to make liveable cities. J. Urban Design. 21, 570–573. doi: 10.1080/13574809.2016.1220152
Sutijastoto. (2020). Transport Technology Option for Smart Capital City: Renewable Energy Implementation. Jakarta: Ministry of Energy and Mineral Resources.
Thomas, L., and Cousins, W. (1996). “A new compact city form: concepts in practice”, The Compact City: A Sustainable Urban Form. London: Spon Press. p. 328–338.
Verstegen, J. A., Van Der Laan, C., Dekker, S. C., Faaij, A. P., and Santos, M. J. (2019). Recent and projected impacts of land use and land cover changes on carbon stocks and biodiversity in East Kalimantan, Indonesia. Ecol. Indicators. 103, 563–575. doi: 10.1016/j.ecolind.2019.04.053
Zhang, F., Sha, M., Wang, G., Li, Z., and Shao, Y. (2017). Urban aerodynamic roughness length mapping using multitemporal SAR data. Adv. Meterol. 2017, 14. doi: 10.1155/2017/8958926
Keywords: urban transformations, capital city, renewable energy, Indonesia, geospatial analysis
Citation: de Vries WT and Schrey M (2022) Geospatial Approaches to Model Renewable Energy Requirements of the New Capital City of Indonesia. Front. Sustain. Cities 4:848309. doi: 10.3389/frsc.2022.848309
Received: 04 January 2022; Accepted: 11 May 2022;
Published: 31 May 2022.
Edited by:
Kh Md. Nahiduzzaman, University of British Columbia, CanadaReviewed by:
Md. Tariqul Islam, University of Nottingham, United KingdomBharath Aithal, Indian Institute of Technology Kharagpur, India
Copyright © 2022 de Vries and Schrey. This is an open-access article distributed under the terms of the Creative Commons Attribution License (CC BY). The use, distribution or reproduction in other forums is permitted, provided the original author(s) and the copyright owner(s) are credited and that the original publication in this journal is cited, in accordance with accepted academic practice. No use, distribution or reproduction is permitted which does not comply with these terms.
*Correspondence: Walter Timo de Vries, d3QuZGUtdnJpZXNAdHVtLmRl