 Pouya Rezazadeh Kalehbasti
 Michael D. Lepech
 Craig S. Criddle
- Department of Civil and Environmental Engineering, Stanford University, Stanford, CA, United States
Designing more sustainable urban infrastructure is an essential topic in practice and research. While many have tried to address this challenge by focusing on sustainability of either supply or demand in a single infrastructure system, few studies have integrated the decisions for both supply and demand across several infrastructure. This paper proposes a novel method to design and optimize the hourly demand and supply of integrated energy and water system in an urban district for environmental and economic sustainability. This modular framework concurrently designs the optimal building mix of an urban district and the systems supplying the district with wastewater treatment, cooling, heating, and electricity. The model is tested on a sample neighborhood from San Francisco, California, with 21 building prototypes, 32 combined heating and power engines, 16 chillers, and 3 wastewater treatment systems (a central treatment plant and two decentralized membrane-based systems). The results of this study show that the median values of normalized life-cycle cost, social cost of carbon, annual energy demand, and annual wastewater production of the integrated designs of water-energy system are, respectively, 20, 75, 8, and 20% lower than those of the traditional segregated designs. The results also demonstrate the economic and environmental viability of using decentralized advanced treatment in urban areas when energy system, wastewater treatment, and building mix are designed together.
Introduction
Motivation
While covering only 3% of the earth's land, urban areas accommodate 55% of world population and are responsible for more than two-thirds of global energy consumption and CO2 emissions (United Nations, 2015; International Energy Agency, 2016). These ever-growing numbers make cities the forefront of the fight against climate change. On the other hand, around 39% of US primary energy is consumed by residential and commercial sectors (Energy Information Administration, 2019): designing more efficient buildings as well as water and energy systems can play an essential role in reducing the energy consumption and environmental footprint of urban districts. Coordinated design of infrastructure has proven to be an effective approach for creating more sustainable urban systems. Such coordination leads to integrated municipal supply systems (e.g., energy and water supply) with improved overall performance when compared to the simple superposition of individual supply systems (Mancarella, 2014). Further, integrated design of infrastructure systems facilitates closed-loop management of resources and can help create “circular economy” in urban areas (World Economic Forum, 2014; Kalmykova et al., 2018).
This study focuses on integrating urban energy and wastewater treatment systems. Typically, urban energy and water infrastructure are designed after the demands of the community are determined. At that late stage, improving the environmental and economic performance of the system is difficult (Best, 2016). However, if the supply and demand of municipal services are optimized simultaneously, the resulting urban system has proven to outperform the isolated design based on social, economic, and environmental sustainability metrics (Keirstead et al., 2012; Allegrini et al., 2015; Best et al., 2015). Since building mix largely determines the consumption profile of urban neighborhoods (Best, 2016; Wu et al., 2018), simultaneously optimizing the building mix and integrating infrastructure represents an opportunity for designing more sustainable urban systems (Keirstead et al., 2012; Best, 2016). Developing a framework to investigate and understand this opportunity is the focus of this research paper.
Prior Research
Factors including urbanization, environmental stresses due to climate change, and demand for more livable built environments are creating challenges for cities to satisfy the needs of an increasing urban population (Bauer et al., 2015; Best, 2016; Khan et al., 2017; O'Neill et al., 2017). This imperative is urging urban and infrastructure planners to design more sustainable infrastructure systems that can maintain and improve the livability of cities (Arup, 2016; SF Environment, 2018). However, concerning the focus of this study, literature shows several obstacles to achieving more sustainable water and energy systems in urban areas;
1. Disconnected modeling of supply and demand: This disconnect results in a missed opportunity to design more sustainable systems by leveraging integrated supply and demand optimization (Manfren et al., 2011; Keirstead et al., 2012; Best et al., 2015; Wang et al., 2018),
2. Isolated design of infrastructure: This isolation overlooks the interdependence between different infrastructure systems and the opportunity to increase the efficiency of the overall urban system by exploiting this interconnection (Howells and Rogner, 2014; Wu et al., 2015; Khan et al., 2017; Saidi et al., 2018),
3. Qualitative assessment of economic and environmental outcomes of planning: The application of qualitative assessment, rather than quantitative metrics, yields inefficient designs with suboptimal performance (Coutts et al., 2008; Keirstead et al., 2012; Eicker et al., 2015; Best, 2016; Hukkalainen et al., 2017).
To address these deficiencies in the context of urban water and energy systems, a framework is needed to optimize the supply and demand of infrastructure systems concurrently (Manfren et al., 2011; Keirstead et al., 2012; Best et al., 2015; Wang et al., 2018; Bakhtiari et al., 2020), integrate the design of urban water and energy infrastructure (Siddiqi and Anadon, 2011; Rodriguez et al., 2013; Bauer et al., 2015; Khan et al., 2017; United Nations, 2019), and provide quantitative feedback on the life-cycle performance of design alternatives (Keirstead et al., 2012; Best et al., 2015; Eicker et al., 2015). This paper develops such a framework to design the supply and demand of integrated wastewater treatment and energy infrastructure for urban neighborhoods. The framework designs infrastructure systems at the neighborhood scale and on an hourly basis following the recommendations by Hawkes and Leach (2005), Jaccard (2006), Evins et al. (2011), and Best et al. (2015).
Co-optimizing Supply and Demand in Energy Systems
Jaccard (2006) defined energy system as “the combined processes of acquiring and using energy in a given society or economy.” Manfren et al. (2011), Keirstead et al. (2012), and Allegrini et al. (2015) reviewed 400+ articles and tools on modeling supply and demand in urban energy systems, and concluded that frameworks must be developed to concurrently optimize energy supply and demand technologies at an urban scale. These frameworks can enable designers to make urban energy systems which are more efficient than systems created using traditional design methods (Manfren et al., 2011; Allegrini et al., 2015; Best, 2016).
To address this requirement, Best et al. (2015) made a framework to simulate and optimize the energy supply systems and the building mix of an urban district composed of 100–1,000 neighboring buildings. As a case study, Best et al. (2015) used NSGA-II Genetic Algorithm (Deb et al., 2002) to optimize the building mix and the combined cooling, heating, and power (CCHP) plant for an arbitrary development in San Francisco for minimum life-cycle cost (LCC), minimum greenhouse gas emissions (GHG), and maximum energy efficiency. The simulation successfully generated many neighborhoods with desirable life cycle costs, zero and near-zero operational GHG emissions, and energy efficiencies more than 70%.
Best et al. took an essential step in integrating the optimization of the supply and demand of energy and numerically evaluating the infrastructure and urban planning. However, this framework and its successors (Best et al., 2019; Rezazadeh Kalehbasti and Lepech, 2021) did not consider the non-energy infrastructure. Wu et al. (2018) followed the method proposed by Best et al. (2015) and added simplified pumping and heat losses as functions of pipe dimensions. Wu et al. optimized the building mix and Combined Heating and Power (CHP) engine for an arbitrary neighborhood in Shanghai, China.
More recently, Waibel et al. (2019) developed a framework for parametrically optimizing buildings and supply technologies in an urban setting. They optimized the height and geometry of four office buildings in Zurich, Switzerland. Supply systems for electricity, space heating, hot water, and cooling were composed of electricity and heat generators, an absorption chiller, and storage technologies. Waibel et al. developed a nested bi-level optimization routine to avoid direct multi-objective optimization and used it to minimize the life cycle cost and carbon emissions of the system. They also simplified the timescale for the optimization from an entire year to only 6 weeks. Similar to Best et al. (2015) and Wu et al. (2018), this paper focused only on energy infrastructure, and did not consider the water system and designing an integrated water-energy infrastructure.
The Water-Energy Nexus
Until recently, urban water and energy infrastructure systems were planned and managed independently (Howells and Rogner, 2014). However, urban infrastructures are becoming more interdependent in the face of mutual challenges including aging, population growth, shrinking resources, extreme events, and climate change (Bauer et al., 2015; Saidi et al., 2018; Moazeni et al., 2020). In particular, “integrated water and energy planning” has gained global public and scholarly attention due to recent difficulties faced by many countries to secure sustainable water and energy resources (Rodriguez et al., 2013; Bauer et al., 2015; Khan et al., 2017; United Nations, 2019; Huang et al., 2020). This concept, dubbed the “water-energy nexus,” focuses on the interrelations between production, transmission, and consumption of water and energy (Siddiqi and Anadon, 2011; Bauer et al., 2015; Dai et al., 2018).
Water used for power plant cooling accounts for half of the freshwater withdrawals in the US (World Economic Forum Water Initiative, 2012). Meanwhile, water scarcity and growing demands require new sources of freshwater and more efficient technologies to treat water and generate energy (Luck et al., 2015; Khan et al., 2017). Wastewater treatment using the wasted heat and electricity of a power plant has shown to be effective in:
1. reducing the need for power plant cooling and, consequently, the required cooling water (Khan et al., 2017; Gingerich and Mauter, 2018),
2. improving the energy efficiency of the integrated water-energy system by increasing the amount of useful work done per unit input fuel (Khan et al., 2017; Gingerich and Mauter, 2018),
3. providing a fresh and “renewable” source of potable/irrigation water for cities (Cath et al., 2009; Guo and Englehardt, 2015; Atab et al., 2016),
4. reclaiming the wastewater and mitigating the environmental repercussions of discharging it into receiving waters (McGovern and Bastian, 2009), and
5. creating a potential revenue stream for cities through selling the reclaimed water (Dayton et al., 2016).
Many studies on the water-energy nexus assess the water consumed in different processes involved in energy generation (e.g., Bouckaert et al., 2014; Khan et al., 2017; Murrant et al., 2017), or the energy consumed or produced during desalination or water treatment (e.g., Al-Karaghouli and Kazmerski, 2013; EPA, 2013; Gude, 2015; Buonocore et al., 2018). A subset of these studies examines the direct integration of power plants and desalination/water-treatment facilities. A part of these works focuses on implementing small-scale combined heating and power (CHP) or combined cooling, heating, and power (CCHP) plants inside existing water or wastewater treatment facilities to use the biogas from digestion processes (Chacartegui et al., 2013; Caceres and Alca, 2016; Mehr et al., 2018; MosayebNezhad et al., 2018). Other researchers have studied CHP/CCHP plants powering the desalination processes, also called dual-purpose or water-power plants. Examples of these articles are found in Ferreira et al. (2010), Xianli et al. (2014), González-Bravo et al. (2017), and Mata-Torres et al. (2019).
Of specific interest, Zhou et al. (2015) modeled a wastewater treatment system based on forward osmosis (FO), which used the waste-heat from a thermal power generator to recover the draw solution of the FO process. Zhou et al. concluded that the FO process can treat the boiler makeup water and desulfurize the flue gas of all power plants in the US using the waste heat from the plants. The detailed modeling in this study provides evidence for the feasibility of combining a membrane-based treatment system with a power plant to exploit the waste-heat from the facility for wastewater treatment. In another study, Gabriel et al. (2016) investigated the techno-economic feasibility of several use-cases for excess heat from industrial processes. Gabriel et al. modeled power and cooling generation, as well as seawater desalination, using multi-effect and reverse osmosis processes to leverage industrial waste heat.
More recently, Gingerich and Mauter (2018) studied 66 retrofit configurations to comply with scenarios of air and wastewater emission regulations (planned for 2030) for a typical coal-fired power plant. They combined several carbon capture and wastewater treatment technologies to retrofit the plant and use the electricity or residual heat and steam generated by the plant. The potential revenue under each scenario was then used to evaluate the combinations. The authors concluded that under the strictest regulation scenario, maximum revenue would result from allocating waste heat to amine-based carbon capture and allocating electricity to a mechanical vapor recompression water treatment system. This study is one of few in which the heat and electricity consumption of modern wastewater treatment technologies (including FO) are used to complement the operation of a power plant. Notwithstanding, their optimization algorithm adopted a single objective, and the operation of the plant and the considered technologies were independent of time and ambient temperature. Therefore, the effects of variations in the energy and wastewater treatment load as well as the ambient temperature on the operation of the facility were not captured.
Objective and Contributions
CCHP plants are a recurrent example of integrated energy infrastructure in practice and research. These plants have shown up to 30% higher overall energy efficiency than comparable segregated energy systems (Rezaie and Rosen, 2012; DOE, n.d). Despite the high efficiency of a CCHP plant, its constant power-to-heat ratio often causes electricity and heating losses (Díaz et al., 2010), as the electricity and heat demanded from the plant to power the network throughout the day do not necessarily align with this fixed ratio. Studies have shown that a wastewater treatment system located within or near the CCHP plant can effectively exploit any “excess” heat and electricity (Elimelech and Phillip, 2011; Zhou et al., 2015), providing an opportunity to design and optimize the water treatment and energy systems concurrently. Given growing water scarcity in many urban areas around the globe, this integration is important for curtailing the fresh water withdrawal used for dissipating the excess heat due to energy generation (Luck et al., 2015; Khan et al., 2017; Energy Information Administration, 2019) and providing decentralized wastewater treatment systems at the neighborhood scale. To realize this opportunity, this paper proposes a framework to design and optimize the demand and supply of integrated energy and water systems (water-energy nexus) for environmental and economic sustainability in an urban neighborhood on an hourly basis.
The contributions of this paper are as follows:
1. Hourly water demand profiles of 21 building types: This paper creates, for the first time, the hourly water demand profiles for 21 building archetypes which represent more than 70% of the buildings in the US (Deru et al., 2011; Best et al., 2015), for the climate zone of San Francisco County, CA. This contribution is essential for integrating the design of different infrastructure systems with the water system at the neighborhood scale. Section Hourly Wastewater Treatment Demand details this contribution.
2. Models for hourly energy consumption and life-cycle cost of FO-RO and FO-MD wastewater treatment systems: This paper introduces computational models of the specific energy consumption, as well as the capital and operational costs of, forward osmosis-reverse osmosis (FO-RO) and forward osmosis-membrane distillation (FO-MD) treatment systems as functions of the temperature and flow of the input wastewater. These compact wastewater treatment systems can be located within the energy plant, can use the waste heat and electricity from the CHP engine to operate, and can output water ranging in quality from irrigation to drinking. These models provide a straightforward method to include these high-performance treatment systems in large-scale simulations of the water system, and enable integrated design of a wastewater treatment system or desalination system with the energy infrastructure. Section Wastewater Treatment Module details the developed models.
3. Integrated approach to designing the wastewater treatment and energy system: The framework proposed in this paper is the first of its kind to concurrently design the optimal building mix of an urban neighborhood and the systems supplying the neighborhood with wastewater treatment, cooling, heating, and electricity on an hourly basis. The proposed framework is expected to inform urban planners and infrastructure designers of a “range” of optimal configurations, e.g., in terms of building mix or floor area ratio, for designing a neighborhood, thereby allowing them to flexibly select infrastructure systems and enact zoning rules leading to more sustainable urban neighborhoods when measured in terms of environmental and economic sustainability metrics. Unlike the typical approach where the energy system is designed independently from the wastewater treatment system, the proposed method allows for designing urban neighborhoods with lower life-cycle cost and emissions by reducing the energy loss and by improving the overall efficiency of the integrated energy system-wastewater treatment. The accuracy of the outputs of this integrated framework depends directly upon the accuracy of the models simulating the supply technologies, i.e., the CCHP engines and the wastewater treatment system, and the demand systems, i.e., the building models.
Model Development
The model presented here extends and improves a previous framework created by Best et al. (2015) in Python programming language (Van Rossum, 2007). The original framework by Best et al. (2015) was able to simulate the supply and demand of energy for a community given its building uses and energy supply equipment. Three main modules comprised the original framework: (1) energy demand modeler, (2) energy supply modeler, and (3) analyzer and optimizer. The first component, “energy demand modeler,” could simulate the annual hourly cooling, heating, and electricity demands from several building archetypes and the associated losses at the supply and distribution levels. The “energy supply modeler” could model the hourly performance of a range of combined heating and power (CHP) engines and chillers given the ambient conditions (e.g., ambient temperature and pressure) as well as heating, cooling, and electric loads imposed on the engines. The final component of the framework, “analyzer and optimizer,” could (1) evaluate the life-time performance of the supply equipment in terms of the defined optimization objectives (e.g., annual carbon emissions, life-cycle cost of equipment) and (2) using an evolutionary algorithm generate a set of neighborhoods optimized with respect to the optimization objectives.
This study extends the demand modeler from the framework mentioned above by enabling it to model the hourly wastewater treatment demands for the 21 building archetypes presented by Best et al. (2015). This work also enables the supply-side module in the mentioned framework to model wastewater treatment systems and thermal energy storage. The former is done by adding three wastewater treatment technologies to the set of supply models developed by Best et al. (2015): two modern hybrid treatment technologies, namely Forward Osmosis-Reverse Osmosis (FO-RO) and Forward Osmosis-Membrane Distillation (FO-MD), and one conventional central treatment. These treatment technologies augmented with a set of pre-treatment and post-treatment techniques can treat input municipal wastewater up to a potable quality. Finally, the triple optimization objectives in the original framework—annual carbon emissions, total fuel cycle energy efficiency, and undiscounted life-cycle cost of equipment—are reduced here to two modified objectives—discounted life-cycle social cost of carbon and discounted life-cycle cost of equipment, both normalized by the total gross-floor area of the buildings in the neighborhood. Figure 1 shows the flow diagram of the proposed framework, showing the three main components (supply module, demand module, and analysis and optimization module) and their subcomponents.

Figure 1. Flow diagram of the proposed framework.
The following provides the semi-formal formulation of the optimization problem solved by the proposed framework:
Objective Functions
Minimize {Life-cycle cost (in $/m2), Social cost of carbon (in $/m2)}
Decision Variables
Number of each building type (21 integers)
Type of the CHP engine (integer ϵ [1,32])
Type of the chiller (integer ϵ [1,16])
Type of the wastewater treatment system (integer ϵ [1,3])
Constraints
Sum of all building footprints must be less than 0.7 km2
Sum of all floor areas (i.e., total GFA) must be larger than 0.1 km2 but less than 3.3 km2
The following sections detail the demand module, supply module, and optimization objectives.
Hourly Wastewater Treatment Demand
This work enables the demand module from Best et al. (2015) to model the hourly wastewater treatment demands for the 21 building archetypes originally discussed by Best et al. (2015) which represent more than 70% of the buildings in the US (Deru et al., 2011). Table 1 shows a summary of the specifications for these 21 building archetypes. The hourly wastewater outflow for these building archetypes were modeled by converting the potable water demand for each building into the wastewater generated by the building. Table A2 in Supplemenatry Material lists the references used to create the profiles of hourly water use for these 21 building archetypes over the 12 months of the year. As mentioned later in this article, San Francisco, CA, is selected as the location of the test case study; hence, studies on buildings located in San Francisco or in areas of California with similar climates to San Francisco, e.g., Santa Barbara (“IECC Climate Zone Map | Building America Solution Center”, 2012), were used for synthesizing the water demand profiles for the 21 building archetypes. The water demand was considered only for indoor use—outdoor use, comprised mostly of irrigation use, was disregarded in this study.
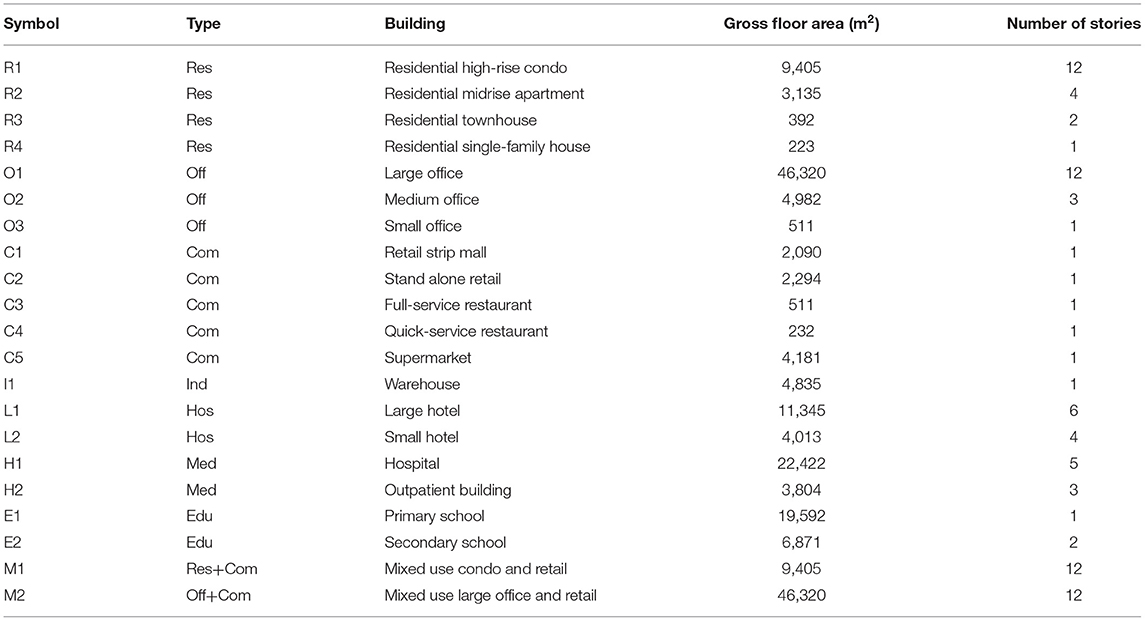
Table 1. Specifications of each building type—modified from Best et al. (2015).
In converting water use to wastewater outflow, the consumptive use of water in the buildings was conservatively assumed negligible, i.e., the outflow of wastewater was taken equal to the inflow of potable water. The average daily water use of the four “residential” building types were calculated using Equation (1).
here is the average daily indoor water use (m3/h), GFA is the total gross floor area of the building (in m2), RESa is the average number of residents per unit area (person/m2), and is the average daily indoor water use per capita for the building (m3/h/person). For this equation, for each different building type, the average number of residents per unit area was extracted from Deru et al. (2011) and the average daily indoor water use per capita was extracted from Carollo Engineers (2015). The average daily water use () for all the other building types, except for the mixed-use buildings, were calculated using Equation (2).
here is the average daily indoor water use per unit area of the building (m3/h/m2) based on US EIA (2017).
The average daily water use () of mixed-use building M1 (symbol explained in Table 1) was computed by combining the average daily water uses of buildings R1 and C2 proportional to the gross-floor-area assigned to each building type, i.e., 8,621 m2 of R1 and 784 m2 of C2, based on the definition of this mixed-use building archetype (Best et al., 2015). The same approach was followed for computing the average daily water use for mixed-use building M2: the average daily water uses of buildings O1 and C2 were combined proportional to the gross-floor-area assigned to each, i.e., 8,621 m2 of O1 and 784 m2 of C2.
Assuming the same water demand profile for every day in a month, the wastewater demand of each building type at each hour was calculated using Equation (3).
here is the wastewater outflow at hour h during month m (m3/h), is the average daily indoor water use (m3/h). Ch and Cm are the hourly and monthly coefficients for converting the average daily water use to water used at hour h and in month m, respectively. The assumption of constant daily water demand profiles for each day in a month enabled us to construct hourly profiles of water demand over the entire year across several building types within the same climatic region. We recognize that such profiles do change but found that this information is lacking in the technical and academic literature. Tables 2–4 list , Ch and Cm, respectively, for all the 21 building archetypes.

Table 2. Average daily water use for all the 21 building archetypes.
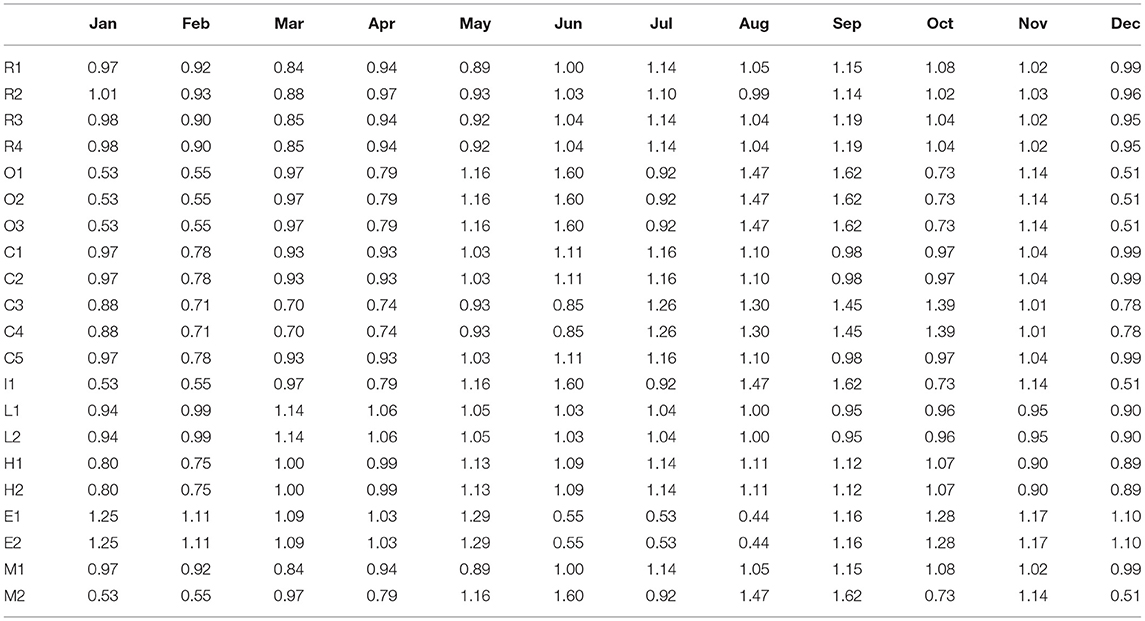
Table 3. Monthly coefficients for all the 21 building types (average of all the 12-month coefficients for each building equals 1).

Table 4. Hourly coefficients for all the 21 building types in “percent of total daily water use.”
Wastewater Treatment Module
This work enables the framework proposed by Best et al. (2015) to simulate wastewater treatment processes at the neighborhood scale. For this purpose, three wastewater treatment technologies are modeled and added to the supply module of the original framework: two membrane-based treatment technologies, namely FO-RO and FO-MD, and one conventional central treatment plant (CTP). These treatment systems augmented with pre-treatment and post-treatment processes can treat municipal wastewater to a drinking quality. “Appendix B: Wastewater Characteristics” in Supplementary Material shows the assumed composition of the input wastewater, the required quality of the output drinking water, and discusses the treatment capabilities of FO-RO and FO-MD systems.
The advanced water/wastewater treatment technologies Forward Osmosis (FO), Reverse Osmosis (RO), and Membrane Distillation (MD) have recently received considerable attention from researchers and practitioners for water reuse applications (Alkhudhiri et al., 2012; Council, 2012; McCutcheon and Huang, 2013; Coday et al., 2014; Blandin et al., 2015; Shaffer et al., 2015; Guizania et al., 2019). This is partly because these technologies are more compact, require lighter maintenance, are easier to automate, and can more effectively remove pathogens compared to traditional treatment systems (Council, 2012). These systems have consistent effluent quality and can potentially reduce the chemical demand of the treatment process (Council, 2012). Such qualities make these technologies ideal for implementing at a combined cooling, heating, and power (CCHP) plant with limited space, and for treating domestic wastewater to drinking water quality—a procedure which requires robust treatment processes.
RO and MD membranes suffer irreversible fouling (Husnain et al., 2015a,b; Kim et al., 2018). This phenomenon gradually reduces the water flux, demanding frequent replacement of the membrane. FO can largely mitigate this problem when used as a pretreatment step for RO (Cath et al., 2005; Zaviska and Zou, 2014; Kim et al., 2018) and MD (Husnain et al., 2015a,b). FO prevents the foulants from reaching the RO or MD membrane, whereas the resulting fouling of the FO membrane is mostly reversible and can be resolved with backwashing and chemical cleaning (Husnain et al., 2015a,b). Further, FO-pretreatment filters the bacteria, viruses, and organic and inorganic compounds (Zaviska and Zou, 2014; Akther et al., 2015) making for a more robust treatment.
“FO-RO” (Figure 2) and “FO-MD” (Figure 3) are the hybrid treatment processes resulting from combining FO process with RO and MD. The wastewater treatment module in the framework introduced here incorporates these two systems as the main “integrated” wastewater treatment technologies, i.e., treatment technologies collocated with the energy supply equipment. This module takes as its input the volume of hourly wastewater produced by the neighborhood and the ambient temperature (taken as the temperature of the wastewater). Assuming a 24-h storage capacity for the input wastewater, the module calculates the maximum membrane area required to treat the 24-h moving-average of the inflow over the entire year. This number is used to calculate the capital and operational expenses of the treatment systems. The treatment module also outputs (1) the hourly electricity and heat demand of the selected treatment models (which will be supplied by the CHP engines), and (2) the operational electricity requirement as well as the initial and operational expenses associated with the pre-treatment processes, e.g., screening, and the post-treatment processes, e.g., disinfection and pH adjustment. The calculation of life-cycle expenses for the treatment modules also considers the costs associated with chemicals, labor, retentate handling, and all the other expenses required for normal operation of a treatment plant (Al-Obaidani et al., 2008; McGivney and Kawamura, 2008).

Figure 2. Schematic diagram of the FO-RO hybrid wastewater treatment system.
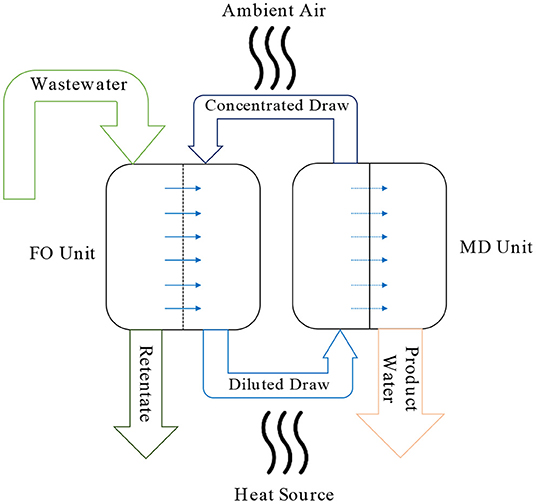
Figure 3. Schematic diagram of the FO-MD hybrid wastewater treatment system. The hot water produced by the CHP engine acts as the “Heat Source”.
Both treatment models consume electricity while the FO-MD also consumes low-grade heat to treat the wastewater. This characteristic was the other reason for selecting these systems to be integrated with the CCHP plant: these wastewater treatment technologies can consume the unused heat and electricity generated by the CHP engine, and thus mitigate the loss of primary energy and increase the efficiency of the integrated CCHP-wastewater treatment plant over the levels achievable using segregated systems. FO-RO only requires electricity to operate while FO-MD mostly requires heat: FO-RO consumes 3.34 kWh of electricity, while FO-MD consumes 33.2 kWh of heat and 0.55 kWh of electricity to treat 1 m3 of input wastewater at 20°C. The optimization algorithm is expected to favor FO-RO for treating the wastewater in cases with large amounts of extra electricity (generated by the CHP engine), and to favor FO-MD in cases with large quantities of extra heat. As Figure 3 shows, the excess heat produced by the CHP engine will be used to heat the feed water to the MD process, while the ambient air will be used to cool the product water and concentrated draw solution. The induced temperature difference will provide the vapor pressure difference required to run the MD process. “Appendix C: FO-RO” and “Appendix D: FO-MD” in Supplementary Material detail the mathematical models developed for simulating the FO-RO and FO-MD systems, respectively, with overall water recovery ratios (RR) of 50%.
In addition to the integrated treatment systems, a conventional wastewater treatment plant was modeled according to the treatment plant serving the location of the case study in San Francisco. “Appendix E: CWWTP” in Supplementary Material describes the model developed for computing the electricity requirements and expenses associated with this central plant. The wastewater treatment module takes as its input the aggregated hourly demands of the neighborhood for wastewater treatment, and computes the required cost and electricity (1.1 kWh per 1 m3 of input wastewater) to process this wastewater as well as the emissions due to the treatment process. The resulting heating and electric loads are added to the rest of the heating and electric loads imposed on the CHP engine. This module also considers the costs of chemicals, labor, bio-solid and retentate handling, and all the other expenses required for normal operation of a treatment plant (McGivney and Kawamura, 2008).
Thermal Energy Storage Model
This study enables the supply-side modeler from Best et al. (2015) to model Sensible Thermal Energy Storage (TES). Hot water storage tanks are selected and modeled for this purpose: hot water generated by the CHP engine for heating with a source temperature of 85°C (Best, 2016) is assumed to get stored in the TES and discharged to satisfy the heating loads when necessary. Four primary factors contribute to the heat loss in a storage tank (Dincer, 2002): heat loss to the surrounding environment, heat conduction between the segments of the storage fluid with higher and lower temperatures (due to the stratified storage of hot water), vertical conduction in the tank wall, and mixing of water during charging and discharging. “Capacity model,” a common loss model (Schütz et al., 2015), assumes the hot water tank to contain a homogenous fluid. With this assumption, the thermal storage at each time-step can be calculated using Equation (4):
where TES is the energy stored in the TES at time t [in kW], kv is a temporal loss factor (assumed 0.0534% based on Schütz et al., 2015), Δt is the time interval (1 h), and [in kW] is the net heat flow into the TES tank at time-step t (positive for net charging and negative for net discharging of the tank).
Equation (5) was extracted from IEA-ETSAP and IRENA (2013) to calculate the capital costs of a TES tank.
here, TESCap is the capacity of the TES [in MWh], and 1.17 is a factor converting 2008 USD to 2019 USD (CPI, 2020). The TES is sized to store enough hot water to satisfy 6 h of maximum aggregate heating demand from the buildings that is computed for each designed neighborhood. The unused heating, in the form of hot water, at each hour gets stored in the TES tank, and the stored hot water in the tank is the first resource responding to heating demand at each hour, i.e., TES has priority over the CHP engine for satisfying the heating demand.
Objective Functions
The original objective functions defined by Best et al. (2015) comprised undiscounted life-cycle cost of equipment, annual CO2 emissions of equipment, and total-fuel-cycle energy efficiency. In this study, the energy efficiency metric was removed from the set of objectives, as it was considered intangible and with no direct monetary or environmental consequences which were not captured by the other two objectives. Reducing the number of optimization objectives lowered the complexity of the optimization algorithm: now, the algorithm needs to inspect only two objectives rather than three when comparing different neighborhoods and finding the most optimal ones.
Further, the two optimization objectives for carbon emissions and life-cycle cost were normalized by the GFA of the neighborhood. Without this normalization, the optimization algorithm would only favor neighborhoods with low emissions or low operational costs regardless of their size: e.g., a small neighborhood with 10,000 ft2 of total GFA, would be equivalent to a 1,000,000 ft2 neighborhood if they both have the same values of annual carbon emissions and life-cycle cost. However, the larger neighborhood is satisfying a much larger demand in a far more sustainable way than the smaller neighborhood. Normalization addresses this error, enabling the optimization method to achieve optimal (sustainable) neighborhoods with a variety of sizes.
Also, to make more tangible the environmental impacts of building and operating the neighborhood, Social Cost of Carbon (SCC) was used to convert the annual carbon emissions into dollar values representing the social, environmental, and economic damage resulting from CO2 emissions (EPA, 2016). Among the different models used to calculate SCC, the version created by US Environmental Protection Agency (EPA) was chosen to be used here (EPA, 2016). “Appendix F: Social Cost of Carbon” in Supplementary Material presents the regression function used to calculate the SCC for each year over the design period. In this new objective function, the carbon emissions associated with the construction of the equipment were also accounted for in addition to the operational emissions. The construction costs were converted into equivalent carbon emissions using conversion factors from EIO_LCA database (Carnegie Mellon University, 2007) for the construction of utilities: 243 Tons of CO2e was assumed to result from 1 million 2007 USD worth of economic activity.
Test Case and Discussion
Introduction
To showcase the capabilities of the proposed framework in co-optimization of supply and demand as well as integrated design of water and energy infrastructure, a case study was conducted based on that proposed by Best et al. (2015). Best et al. modeled a 160-acre greenfield development in Civic Center, San Francisco, and simulated the electricity, cooling, and heating demands of 21 building archetypes (presented in Table 1) using EnergyPlus ver. 8.0.0 (Crawley et al., 2001). Best et al. also modeled 32 CHP engines and 16 chillers as the set of supply equipment. The same 160-acre development, building archetypes, CHP engines, and chillers are considered in this study with the following modifications: (i) Hourly wastewater treatment demands were added to the set of energy demands of the buildings, (ii) Thermal Energy Storage and three wastewater treatment technologies (namely, FO-RO, FO-MD, and CWWTP) were added to the original set of supply models, and (iii) the optimization objectives were changed to GFA-normalized life-cycle cost of equipment and life-cycle social cost of carbon.
The proposed model was run for two scenarios: (i) In the first one, the building mix and energy system were designed and optimized together, while a conventional central wastewater treatment plant (CWWTP) treated the wastewater from the buildings, and (ii) in the seconds scenario, the building mix, energy system, and wastewater treatment system were optimized and designed concurrently. In the first scenario, the grid was assumed to supply the electricity required by the CWWTP, and grid emissions for generating this electricity were attributed to the CWWTP. The emissions and expenses of the CWWTP were in turn attributed to the neighborhood in proportion to the ratio of the “average daily wastewater output of the neighborhood” to “57 MGD” (i.e., the actual average daily input of the treatment plant). Since the existing CWWTP serving the location of the case study, i.e., Southeast Treatment Plant (SF PUC, 2019), does not produce potable water, it was arbitrarily replaced by a conventional treatment plant of the same size but capable of producing potable water—as also explained in Appendix E: CWWTP Model in Supplementary Material. This modification was necessary to make the two scenarios comparable. In the seconds scenario, a combined CCHP-wastewater treatment plant (CCHP-WWTP) supplied the energy and wastewater treatment demand of the buildings.
Both scenarios were designed for minimum life cycle cost of equipment (LCC) and minimum social cost of carbon (SCC). The LCC optimization objective incorporated the construction and discounted operation and maintenance costs of only the CCHP plant for the first scenario, and the entire CCHP-WWTP for the seconds. The SCC optimization objective considered the construction and discounted operation costs of carbon emissions associated with only the CCHP plant for the first scenario, and the entire CCHP-WWTP for the seconds. Both scenarios were simulated for 20 year of operation with a 3.5% discount rate. The neighborhoods generated by the optimization algorithm were compared in terms of their total (i.e., including those associated with the CWWTP) life cycle cost of equipment, operational and construction GHG emissions, types of supply technologies, and building mix among other metrics. The LCC and SCC calculations excluded the reuse and redistribution of the recovered water.
The excess electricity generated during each hour was assumed to be sold back to the grid at 80% of the purchase price at that hour which was extracted from CAISO for year 2018 (California ISO, 2019). The hourly ambient temperature for the case study was extracted from TMY3 dataset for the San Francisco International Airport (Wilcox and Marion, 2008). Further, the grid emissions for each hour were extracted from Beyond Efficiency (Beyond Efficiency, 2017) for year 2016.
Results and Analysis
The two scenarios, namely scenario 1 (conventional design) and scenario 2 (integrated design), were simulated each using an Intel Xeon E5-2640v4 processor (10-core Broadwell, 2.40 GHz) with 800 MBs of effective memory use over 145 mins of CPU wall-clock time. The map method from Scoop library (Hold-Geoffroy et al., 2014) was used to parallelize the map calls to Genetic Algorithm (GA) methods from Deap library (Fortin et al., 2012). The advantage of using a GA for solving this problem is that it does not require assignment of weights to either of the two objective functions, and instead enables simultaneous optimization of both objectives (Deb et al., 2002). The GA algorithm, NSGA-II, used the following optimization parameters based on the recommendations of Best et al. (2015):
Number of generations = 1,000; Population = 200; Mutation Probability = 0.05; Similarity Parameter = 2.5; Crossover Probability = 0.75.
Substituting series data processing with parallelized Numpy (Oliphant, 2006) operations, reducing the number of objective functions from three to two, and other minor technical upgrades cut the optimization runtime by 97% compared to the optimization with the same configurations done using the original framework in Best et al. (2015). Of the 200,000 neighborhoods produced by the GA algorithm for each scenario, 93,210 for scenario 1 and 87,644 for scenario 2 had admissible total GFA (i.e., less than 3,237,485 m2) and site GFA (i.e., less than 647,497 m2). These neighborhoods are called the “admissible neighborhoods” from this point on.
Figure 4 shows the two GFA-normalized objective functions of the optimization, social cost of carbon vs. life-cycle cost, for all the admissible neighborhoods with SCC values less than 0.10 k$/m2, i.e., the 99.8th and 99.7th percentile of SCC across all neighborhoods in the first and the seconds scenario, respectively. Earlier generations of neighborhoods produced by the GA are plotted using symbols that are more transparent than the later ones. One outstanding observation from Figure 4 is that the optimization algorithm has successfully identified paths to designing neighborhoods with minimum LCC and SCC over consecutive generations: the dots (neighborhoods) closer to the origin (which has the ideal lowest SCC and LCC, i.e., 0 kg of lifetime CO2 emissions and $0 of life-cycle cost) are more opaque (belong to later generations) than the dots farther away from the origin. Figure 4 also offers an insight on the comparison between the two scenarios: the blue dots in the figure are generally located lower than their adjacent red dots. This implies that the integrated design scenario, scenario 2, has resulted in neighborhoods with generally lower SCC than those of conventional design, scenario 1, for the same values of LCC.
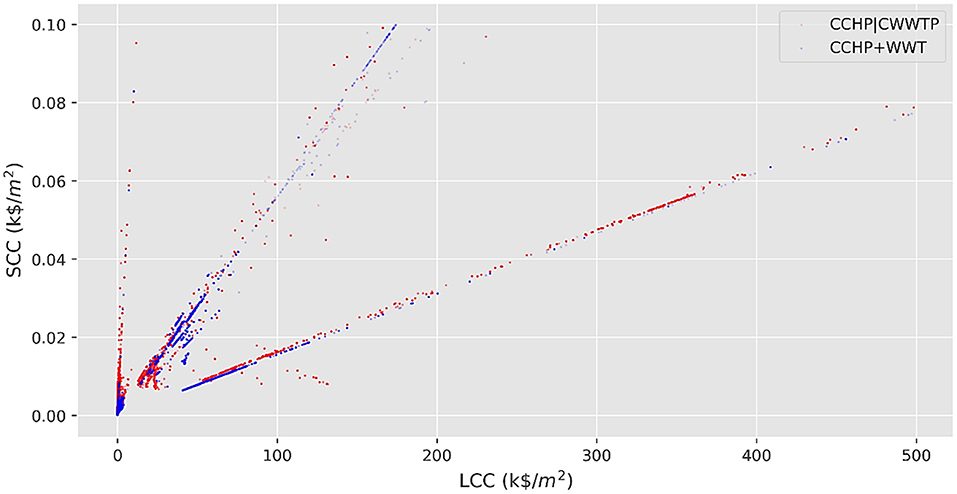
Figure 4. Life-cycle social cost of carbon vs. life-cycle cost of equipment for the individual neighborhoods (single dots on the plot), with SCCs less than 0.1 k$/m2, generated by the optimization algorithm for the analyzed scenarios. Neighborhoods generated in later generations by the Genetic Algorithm are shown more opaque than the earlier generations (Red dots: conventional design, blue dots: integrated design).
Figure 5 shows the approximate Pareto fronts of the two scenarios for the objective functions, life-cycle cost and life-cycle social cost of carbon, highlighted in yellow. In the Pareto optimal solutions, the SCC values of the integrated approach seem to be about 1/3 the SCC values of the segregated approach, while the LCC values of these solutions are similar between the two scenarios. These two observations about the Pareto fronts comply with the general trends deduced in the previous paragraph.
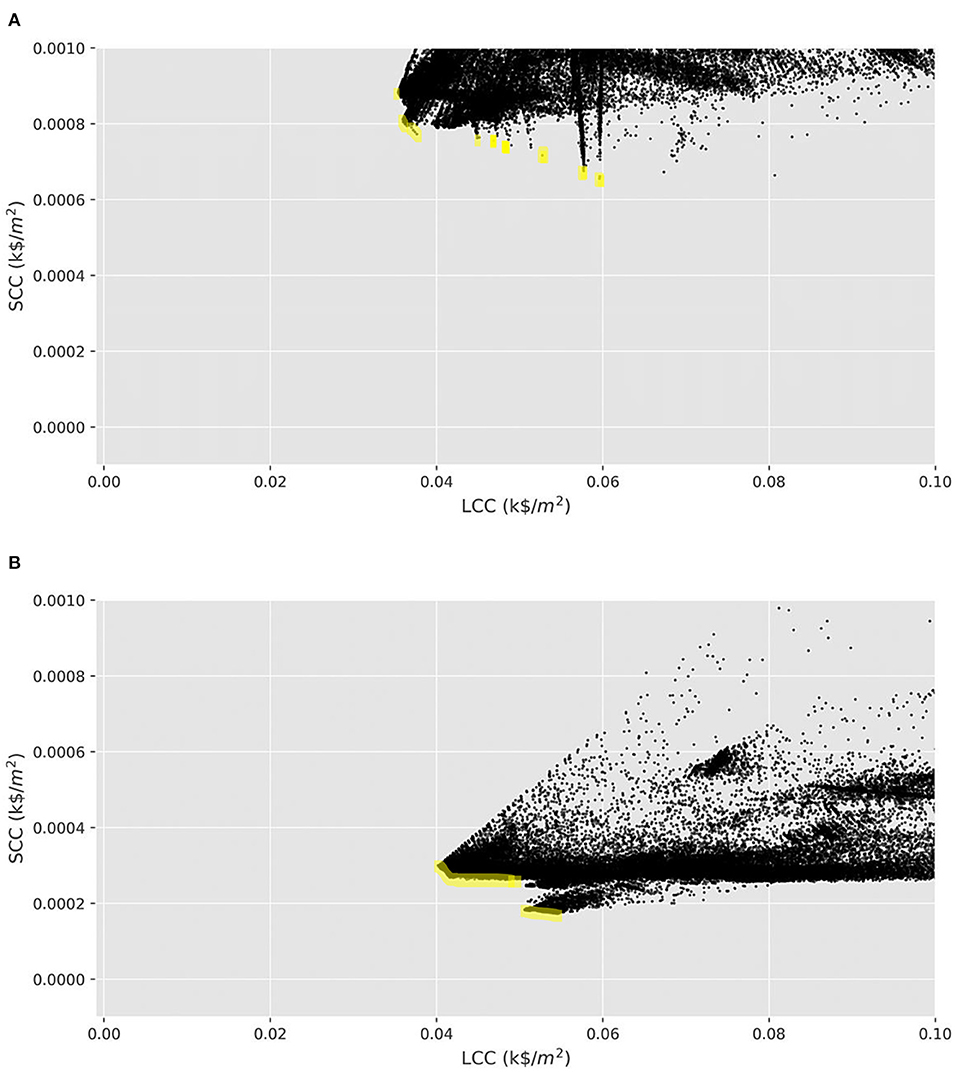
Figure 5. The approximate Pareto fronts of the life-cycle social cost of carbon vs. life-cycle cost of equipment for (A) scenario 1 and (B) scenario 2.
To get a better understanding of the distribution of performance metrics across the designs produced by the two scenarios, standard deviation (SD), mean (average), 25th percentile, 50th percentile (median), and 75th percentile of LCC, SCC, annual aggregated energy demand, and annual wastewater treatment demand for all the neighborhoods resulting from the two design scenarios were calculated—Table 5 shows the results. The annual aggregated energy demand for each neighborhood was calculated by summing the total electricity and heating demand of the buildings and supply equipment (including chillers and treatment systems) over 8,760 h of the year. In this table, “CCHP | CWWTP” denotes scenario 1, and “CCHP+WWT” denotes scenario 2. The numbers in Table 5 are unitless since the values of each metric for each variable, e.g., 25th percentile of LCC, for both scenarios are normalized by the value of the scenario 1. This facilitates comparing the statistical metrics of the seconds scenario against those of the first scenario by converting the metrics of the first scenario into unity.
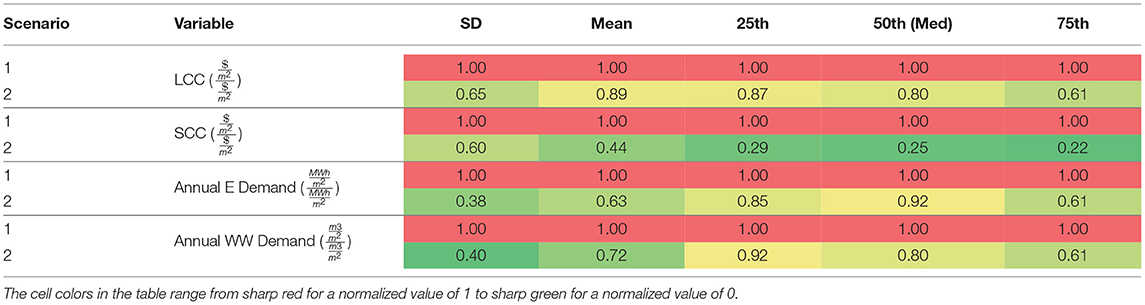
Table 5. Statistical comparison between the results of scenario 1 (segregated) and scenario 2 (integrated).
The results in Table 5 show that integrated design of energy and wastewater treatment systems has resulted in lower life-cycle carbon emissions and cost as well as lower annual energy and wastewater treatment demands compared to a separate approach to the design of these two infrastructure systems. The difference in life-cycle social cost of carbon is the most noticeable, with scenario 2 having a mean value 56% lower than scenario 1. The reduction in mean values of annual demands from scenario 1 to 2 is ca. 40%. Comparing the SDs of the two scenarios also offers another observation: the optimal neighborhoods produced by the GA under scenario 2 are closer (more uniform) in terms of the four parameters inspected in Table 5. This can imply the existence of some neighborhoods with dominant genes (i.e., configurations resulting in very low SCC and LCC) in the population of scenario 2 which have been identified by the GA and sustained across multiple generations of the analysis.
To further inspect the differences between the designs resulting from the two scenarios, K-Means Clustering (KMC) was used to create clusters of similar individuals among the admissible neighborhoods based on eleven features: the seven building-type ratios (i.e., GFA associated with each building type divided by the total GFA of the neighborhood), GFA-normalized LCC and SCC, and GFA-normalized annual energy and wastewater treatment demands. The features were standardized before clustering, and K-Means Clustering method from Scikit-Learn library (Pedregosa et al., 2011) was used to conduct the clustering with the following variables:
Initialization_method: “k-means++”; max_iterations: 300; n_init: 10; random_state: 42; tol: 0.0001.
Euclidean distance was selected as the measure of proximity for clustering. The number of clusters was varied between 8 and 40 to find the highest average Silhouette Score (Rousseeuw, 1987) and lowest cost function across all clusters: for both scenarios, the highest Silhouette scores (0.53 for scenario 1, and 0.32 for scenario 2) were obtained for 10 clusters. However, the cost function (i.e., sum of squared distances to centroids) for the 10-cluster configuration was high −233,834 (2.51 per individual) and 257,098 (2.93 per individual) for scenarios 1 and 2, respectively—and the clusters were unevenly populated. To solve this issue, the number of clusters was set to 26 (scenario 1) and 40 (scenario 2) which had yielded other local optima of the Silhouette Score among the tested number of clusters. These new cluster counts resulted in acceptably reduced cost functions of 105,064 (i.e., 1.1 per each neighborhood) for scenario 1 and 107,026 (i.e., 1.2 per each neighborhood) for scenario 2 with Silhouette scores of 0.36 and 0.31, respectively.
After the KMC algorithm converged, clusters with less than 500 members were removed to prune out the outliers, and the remaining centroids (19 centroids for scenario 1, and 27 for scenario 2) were plotted in Figure 6. Each cluster centroid in this figure is shown as a continuous, unicolor line across the eleven variables along the x-axis, and the thickness of each line is proportional to the number of neighborhoods represented by that centroid. SCC, LCC, and the annual energy and wastewater demands for both scenarios in Figure 6 are normalized by the maximum values of each variable from both scenarios, and are presented in percent.

Figure 6. Traces of the cluster features—i.e., building area percentages for Residential, Office, Commercial, Industrial, Hospitality, Medical, and Educational buildings (Table 1 shows the building types belonging to each of these building-uses), normalized LCC and SCC, normalized annual energy (Anl_E), and wastewater treatment demand (Anl_WW)—across the centroids of the clustered neighborhoods for (A) scenario 1 and (B) scenario 2. Each centroid is shown as a unicolor line connecting eleven points across the seven building-uses and the four metrics.
Figure 6 shows that the building mix and normalized annual energy and wastewater demand for the most populous clusters of optimal neighborhoods for both design approaches cover roughly the same ranges of values. However, the most populated clusters in scenario 2 have lower GFA-normalized SCC and LCC than those of scenario 1, corroborating the statistical data from Table 5. Also implied by the low standard deviation values of scenario 2 in Table 5, the most populous centroids of scenario 2 in Figure 6 are spread over smaller ranges of the eleven parameters plotted in the figure. The GFA ratios of individual building types show that (i) the percentage of residential buildings ranges from 0 to 60% for both scenarios, (ii) the office buildings range from 30 to 95% in scenario 1 and from 15 to 100% in scenario 2 with a high concentration around 80 to 100%, (iii) industrial and educational buildings are mostly negligible in scenario 1, while they range from 0 to 10% in scenario 2, and (iv) hospitality and medical buildings are mostly negligible in scenario 1 with two exceptional clusters showing ~30 and ~60% hospitality and medical type-ratios, while they range from 0 to 20% in scenario 2. These ranges show that the integrated design has resulted in a more diverse building mix among the optimal designs.
Figure 6 offers another interesting observation: the building mix in the majority of optimal neighborhoods from both scenarios have a low share of residential buildings, a medium to high share of office buildings, low shares of educational and industrial buildings (in scenario 2), and trivial shares of commercial, hospitality, and medical buildings. This mix of building types seems to provide the lowest LCC and SCC per unit area among all possible building mixes inspected by the optimization algorithm and is hence predominant among the optimal building mixes for both scenarios.
The types of selected supply equipment -were also analyzed for the admissible neighborhoods from both scenarios to identify the connections between the choices of supply equipment choices and metrics of life-cycle performance. Figure 7 shows for the two scenarios the normalized SCC against the types of CHP engines selected in neighborhoods with SCCs less than 0.1 k$/m2, i.e., the 99.8th percentile of the first scenario and 99.7th percentile of the seconds. In both cases, the neighborhoods with smallest SCCs use biomass/biogas, or fuel-cell CHP engines, which is consistent with the fact that the operation of these engines is deemed carbon-neutral since they are assumed to use renewable fuels (Best et al., 2015). The Pareto optimal solutions marked in Figure 5 are expected to be among these neighborhoods with carbon-neutral CHP engines, since the Pareto optimal solutions also have very low SCC values compared to the rest of the solutions. The neighborhoods designed with carbon-neutral CHP engines in scenario 1 seem to have a lower SCC compared to neighborhoods using the same engines in scenario 2. Further, since a large portion of the CHP engines selected in both scenarios for the local energy system are those with negligible operating emissions, supplying the wastewater treatment equipment with the local energy system in the integrated scenario would expectedly result in a much smaller life-cycle emission (SCC) compared to supplying the treatment equipment with the electric grid in the segregated scenario. These observations justify the lower SCC values of scenario 2 compared to scenario 1. Figure 7 also shows that the Genetic Algorithm has favored gas engines (i.e., gas turbines, microturbines, reciprocating engines, and steam turbines) much less than the carbon-neutral CHP engines in both scenarios given the significantly higher emission rates of the gas engines.
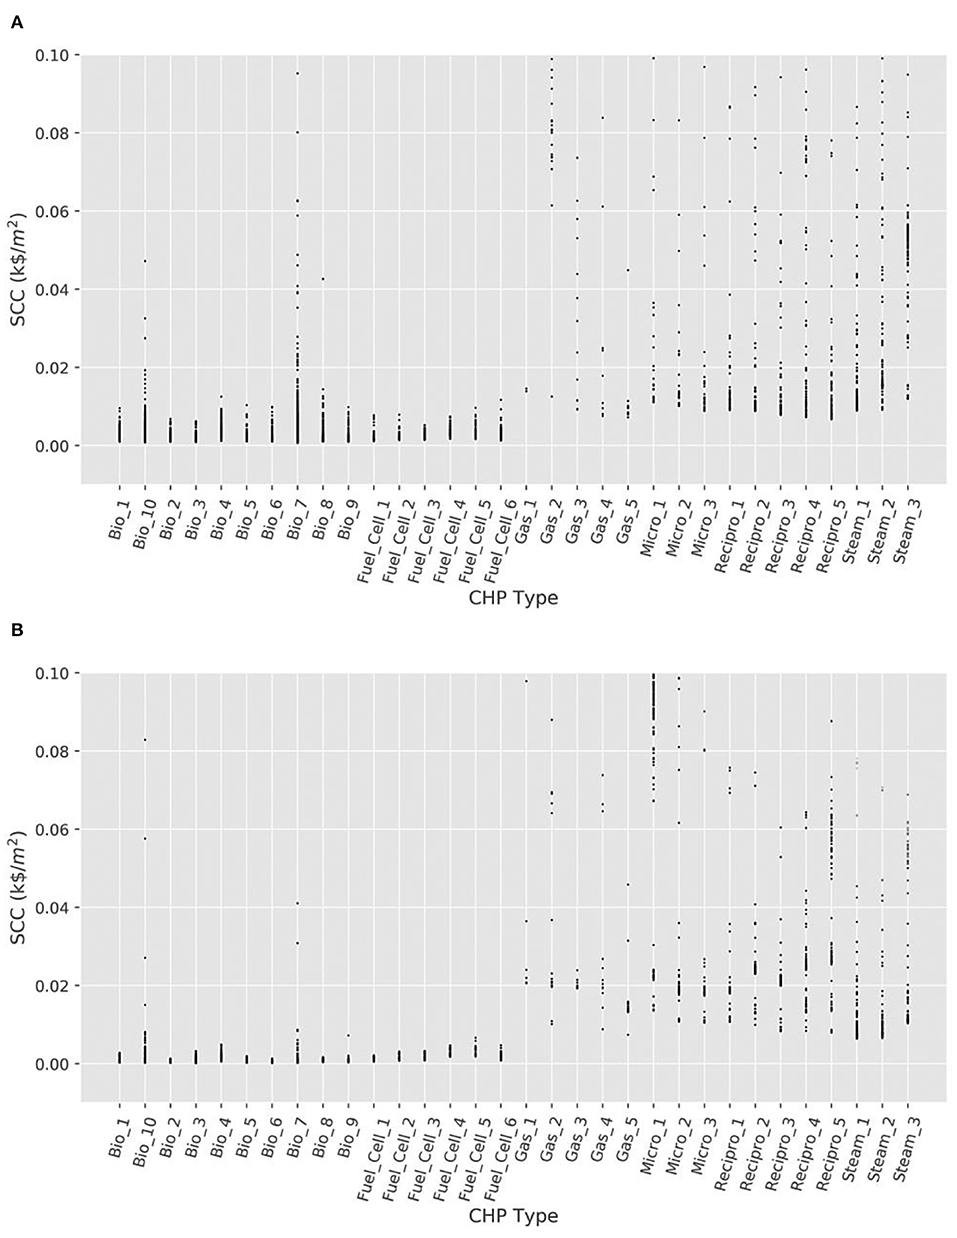
Figure 7. Social cost of carbon vs. CHP type for (A) scenario 1 and (B) scenario 2, across all individual neighborhoods with SCCs less than 0.1 k$/m2. Each neighborhood is represented by a single dot in the plot.
Figure 8 also shows the normalized SCC vs. the types of chillers chosen for those neighborhoods in the analyzed scenarios which had SCCs less than 0.1 k$/m2. Low-emission neighborhoods have been possible to create using all types of the available chillers.
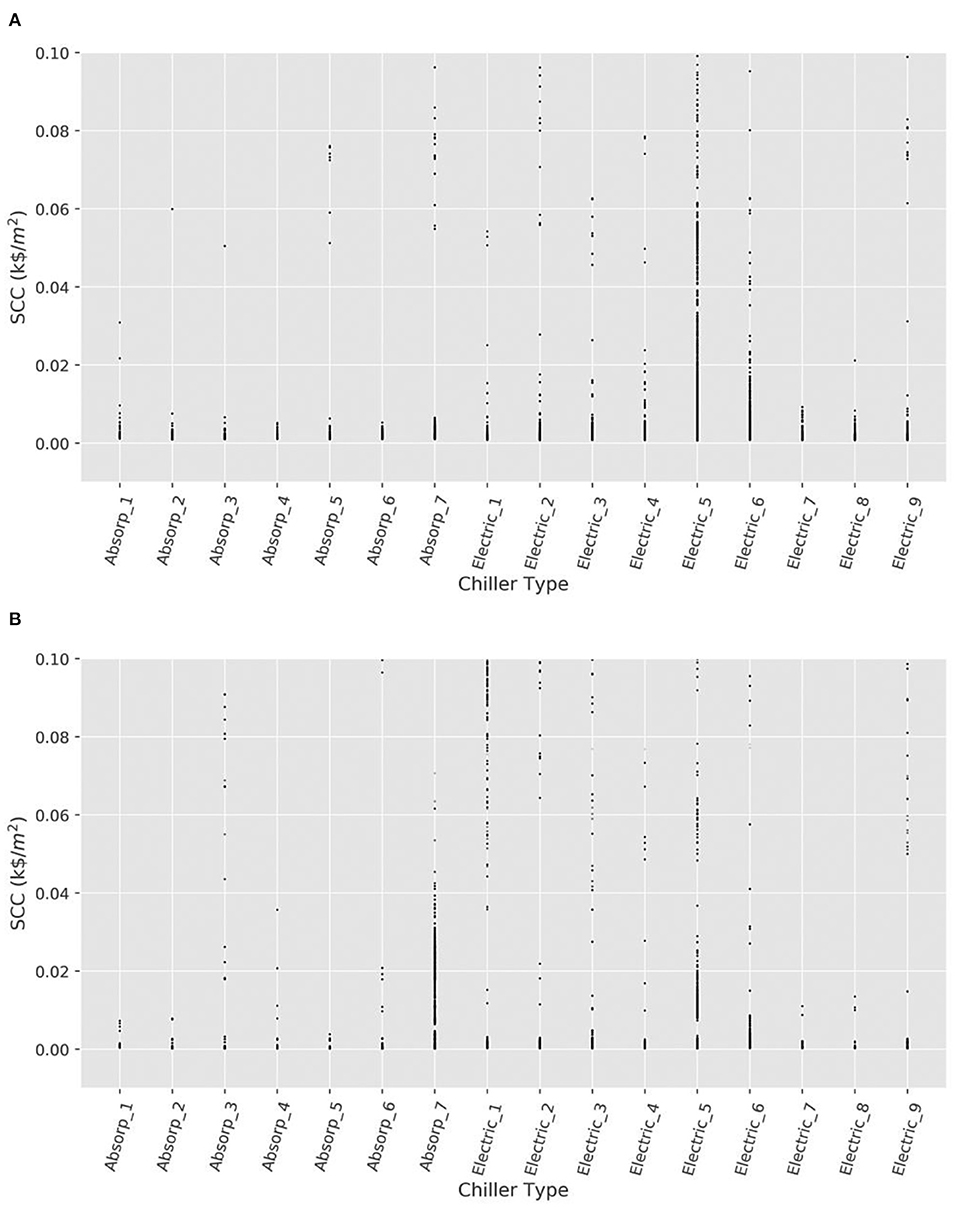
Figure 8. Social cost of carbon vs. Chiller type for (A) scenario 1 and (B) scenario 2, across all individual neighborhoods with SCCs less than 0.1 k$/m2. Each neighborhood is represented by a single dot in the plot.
Figure 9 shows the wastewater treatment (WWT) systems selected by the optimization algorithm for scenario 2. FO-MD has resulted in more low-emission neighborhoods than the other WWT system. Before, Figure 7 indicated that biomass engines were popular with low-emission neighborhoods. Most of the available biomass engines in the simulation framework have power-to-heat ratios lower than 0.42, which means they generate more heat than electricity in response to the energy demand. Part of the reason for popularity of FO-MD among the low-emission neighborhoods seems to be that this treatment system can “recycle” the excess heat generated by the carbon-neutral biomass engines selected for these neighborhoods. This excess heat can also be used for dewatering the solid residue from the treatment process (Scherson and Criddle, 2014) (discussed in more detail in Section Conclusions and Future Work).
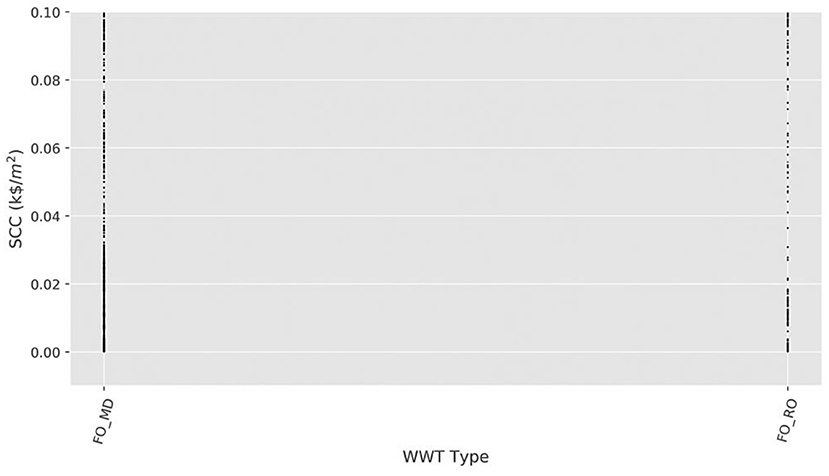
Figure 9. Social cost of carbon vs. WWT type for scenario 2 across all individual neighborhoods with SCCs less than 0.10 k$/m2, i.e., the 99.7th percentile of SCC. Each neighborhood is represented by a single dot in the plot.
Figure 6 suggests a relationship between the oscillations in ratios of different building types with the values of SCC, LCC, and the annual demands. In a final analysis, the Pearson correlation matrices between the eleven variables plotted in Figure 6 were computed to inspect the linear relationships between these variables. Figure 10 shows the resulting correlation matrices for both scenarios. Normalized LCC and SCC are not strongly related to any other variables than each other, while normalized annual energy and wastewater demand seem to be negatively correlated with the ratio of office buildings in the neighborhoods. The latter is rooted in the low energy- and water-use intensities of the office buildings. The normalized annual demands also show a strong direct linear relationship with each other, meaning that neighborhoods with high annual wastewater treatment demands tend to have high annual energy demands and vice versa. Further, annual energy demand seems to be directly proportional to the percentage of medical buildings. This is caused by the high energy-use intensity of the medical buildings. The annual wastewater demand in scenario 2 also shows a strong collinearity with the percentage of residential buildings, which is caused by the high water-use intensity of these building types. Among the building type ratios, percentages of hospitality and medical buildings in both cases and commercial buildings in scenario 2 are negatively collinear with that of office buildings. The optimization algorithm seems to have strongly preferred office buildings in reverse proportion to the residentials, especially in the integrated design scenario.
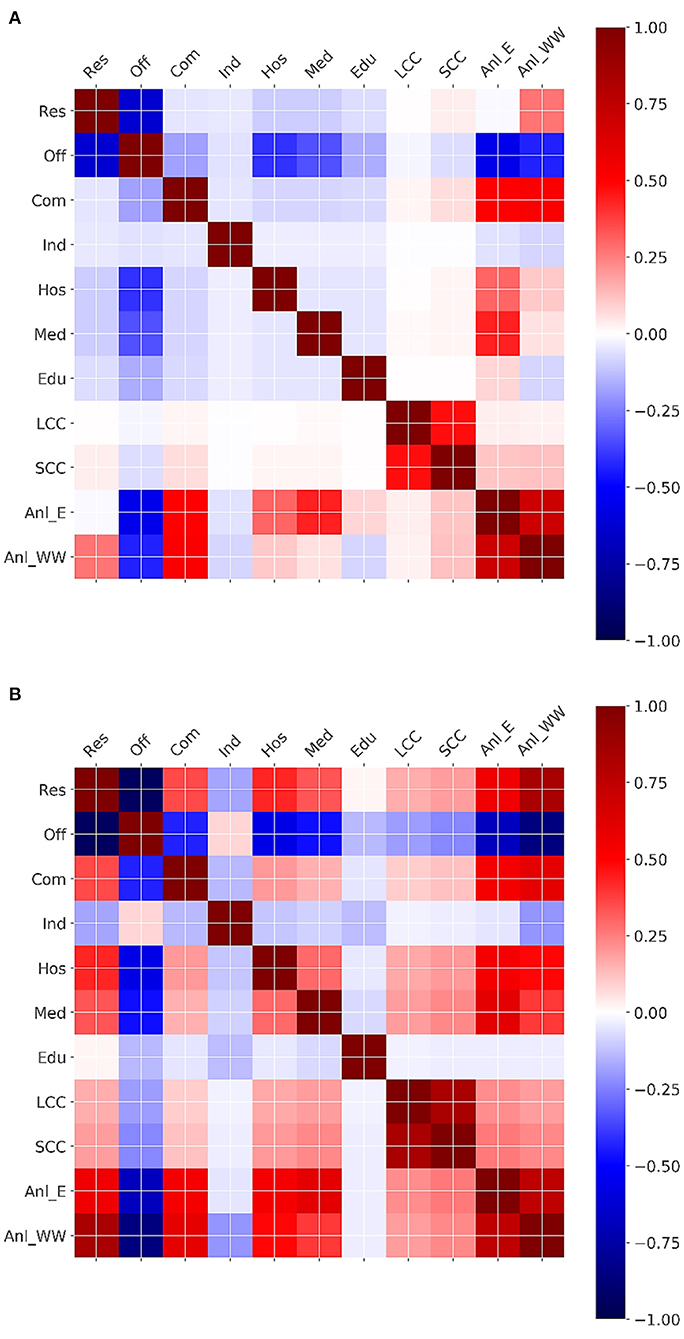
Figure 10. Correlation matrix for building area percentages (symbols from Table 1), normalized LCC and SCC, normalized annual energy (Anl_E) and wastewater treatment demand (Anl_WW) across the admissible neighborhoods from (A) scenario 1 and (B) scenario 2.
Conclusions and Future Work
This paper studies the advantages of integrated design and optimization of the wastewater treatment and energy systems at the district scale over the segregated design of these infrastructure systems in terms of environmental and economic sustainability metrics. The supply and demand of the integrated water-energy system are also concurrently considered and optimized. Annual hourly wastewater treatment demands from several building archetypes as well as advanced membrane-based and conventional central wastewater treatment systems are modeled to cover both the decentralized (integrated) and centralized (conventional) wastewater treatment configurations. An optimization framework is proposed for the integrated design of water and energy infrastructure and a case study in San Francisco is adopted to compare the outcomes of the conventional (segregated) vs. the integrated approach to the design.
The results of the case study show consistently lower normalized social cost of carbon, life-cycle cost of equipment, annual energy demand, and annual wastewater treatment demand across the neighborhoods designed using the integrated vs. segregated approach, with the median values of these metrics for the seconds scenario being, respectively, 75, 20, 8, and 20% lower than those of the first scenario. These advantages of the integrated scenario can be attributed first to simultaneous optimization of the wastewater treatment and energy system in this scenario, and also to supplying the treatment system with the low to no-emission CHP engines of the local energy system vs. supplying the treatment system with the electric grid in the segregated scenario. The results also showcase the economic and environmental viability of advanced wastewater treatment systems despite higher capital costs compared to conventional systems, when these advanced treatment processes are (i) optimized at the same time as the energy systems, (ii) physically and operationally integrated with the energy systems, and (iii) analyzed over the life-cycle of the neighborhood.
The results also show that the building mixes of the neighborhoods generated under the two scenarios have similarities. This indicates that the districts designed for segregated water and energy systems can adopt integrated infrastructure with minimal modifications and without altering the building mix of the district. The considerable savings in emission and costs achieved by taking an integrated approach to the design of the water and energy infrastructure indicate the potential for integrating more infrastructure systems during the early-stage design of neighborhoods using approaches similar to that taken in this study. It is expected that the gains in sustainability of the integrated vs. the conventional design of infrastructure will become yet more significant as more systems, over longer analysis periods, and larger spatial scopes are designed concurrently.
Future extensions of this research can address three general topics: the wastewater treatment model, the building and energy system models, and the optimization algorithm. Below are some of the potential future studies on the wastewater treatment model:
1. This study implicitly addresses handling of retentate from the treatment process; however, given its large environmental impacts, this topic merits in-depth analysis in future studies. In theory, Anaerobic Digestion (AD) combined with syngas processing of biosolids and/or short-cut nitrogen-removal systems could be used to minimize residuals and produce up to 0.35 kWh of energy per 1 m3 of wastewater treated (Scherson et al., 2013; Scherson and Criddle, 2014). AD can also be combined with emerging anaerobic secondary treatment systems, like the SAF-MBR with air-stripper (Stanford University, 2021), to maximize methane recovery and increase net energy production from retentate (Scherson and Criddle, 2014). CHP engine can directly use the biogas and syngas from such processes to generate heat and electricity (Scherson and Criddle, 2014). This also motivates studies comparing centralized vs. decentralized treatment of retentate, where part or all of the treated water from decentralized treatment could be used for irrigation.
2. The excess heat from the CHP engine in this work is used for heating the wastewater when FO-MD was selected as the treatment system. This waste heat could also be used to dry the biosolids left from the treatment process after mechanical dewatering, as suggested by Scherson and Criddle (2014). Dewatering of the biosolids enables their gasification and production of ash, dramatically reducing solids for disposal and generating additional energy in the form of syngas.
3. To avoid overcomplicating the analysis, the scope of this paper excludes the reuse and redistribution of the treated wastewater. When distributed, the potable water recovered by the system proposed in this research can improve the water security (Cook and Bakker, 2012; World Economic Forum Water Initiative, 2012; Garrick and Hall, 2014), resilience, and sustainability of the urban areas. This also merits in-depth follow-up studies.
4. Future studies can investigate the sustainability and resilience impacts of setting different qualities—e.g., suitable for irrigation, or banking in reservoirs—for the effluent of the treatment process. Same can be done for the retentate of the treatment process. For example, the nitrogen-rich retentate of the treatment can be used for landscaping to help preserve water resources.
5. This paper simplifies modeling of water demand profiles by assuming that daily profiles are constant for every day of a month. This enabled constructing hourly demand profiles for all the 21 building types in the same climatic region and over the entire year, as the existing literature did not allow for making more detailed demand profiles. Future studies should examine the updated literature for modeling variable daily profiles for each day of a month.
6. The integration across the water and energy system proposed in this work can be tailored for applying to a range of different time scales, e.g., by using monthly rather than hourly models, or geographic scales, e.g., by focusing on regions rather than districts. Results of studies on these different scales can provide valuable insights for different stakeholders who require different levels of granularity in modeling and analysis. Adapting the proposed framework to these different scales is also a worthwhile extension of this work.
The list below describes interesting future studies on the building and energy system models:
1. A limited, yet diverse, set of supply equipment were selected and modeled in this study: more treatment systems and energy systems, including all-electric technologies, can be introduced into the supply equipment mix in future efforts to make this framework applicable to a wider variety of cases.
2. Network configuration largely determines the loss and performance of the heating, cooling, and wastewater treatment infrastructure (Best et al., 2019)—future efforts should introduce network optimization into the proposed framework. This addition, nonetheless, increases the complexity of the optimization problem by several orders of magnitude, and this might require alternative optimization algorithms, more memory, and more computational power compared to this study.
3. This paper treats the input parameters of the supply and demand models as deterministic variables, whereas the uncertainties in these parameters can have tangible effects on the results of the analysis obtained using the proposed method. Uncertainty analysis of the proposed framework merits extensive future study.
The following detail potential future studies on the optimization algorithm:
1. Improving the optimization algorithm has a great potential for further studies (e.g., Rezazadeh Kalehbasti et al., 2021). For instance, in this study no constraints were applied to the optimization problem other than to the gross-floor-area of the neighborhoods. Future studies can impose constraints on the ranges of building type ratios as well as the permitted types of CHP engines, chillers, and treatment systems to inform the optimization algorithm to obtain optimal neighborhoods with specific mixes of buildings and supply equipment.
For the case study examined in this manuscript, the optimization algorithm found many optimal solutions with building type mixes dominated by office buildings. The COVID-19 global pandemic has shown that the usage of different building types can vary, sometimes drastically, because of unforeseen conditions. This suggests the need for studies that consider other “black swan” events (Taleb, 2007) to understand how they can change the optimal design and performance of cities by imposing constraints on the components, e.g., the building mix, of the urban neighborhoods.
Data Availability Statement
The original contributions presented in the study are included in the article/Supplementary Materials, further inquiries can be directed to the corresponding author/s. Files required for replicating the experiments and visualizations of this paper can be found at: https://github.com/PouyaREZ/Wastewater_Energy_Optimization.
Author Contributions
PR: conceptualization, data curation, formal analysis, funding acquisition, investigation, methodology, project administration, resources, software, writing—review and editing, roles/writing—original draft, visualization, and validation. ML: conceptualization, funding acquisition, methodology, project administration, resources, supervision, writing—review and editing, roles/writing—original draft, and validation. CC: resources, supervision, writing—review and editing, and validation. All authors contributed to the article and approved the submitted version.
Funding
This material is based on work supported by the Leavell Fellowship on Sustainable Built Environment from the Department of Civil and Environmental Engineering at Stanford University. This research has additionally been supported by AP Thailand.
Conflict of Interest
The authors declare that the research was conducted in the absence of any commercial or financial relationships that could be construed as a potential conflict of interest.
Publisher's Note
All claims expressed in this article are solely those of the authors and do not necessarily represent those of their affiliated organizations, or those of the publisher, the editors and the reviewers. Any product that may be evaluated in this article, or claim that may be made by its manufacturer, is not guaranteed or endorsed by the publisher.
Supplementary Material
The Supplementary Material for this article can be found online at: https://www.frontiersin.org/articles/10.3389/frsc.2022.856996/full#supplementary-material
References
Akther, N., Sodiq, A., Giwa, A., Daer, S., Arafat, H. A., and Hasan, S. W. (2015). Recent advancements in forward osmosis desalination: a review. Chem. Eng. J. 281, 502–522. doi: 10.1016/j.cej.2015.05.080
Al-Karaghouli, A., and Kazmerski, L. L. (2013). Energy consumption and water production cost of conventional and renewable-energy-powered desalination processes. Renew. Sustain. Energy Rev. 24, 343–356. doi: 10.1016/j.rser.2012.12.064
Alkhudhiri, A., Darwish, N., and Hilal, N. (2012). Membrane distillation: a comprehensive review. Desalination 287, 2–18. doi: 10.1016/j.desal.2011.08.027
Allegrini, J., Orehounig, K., Mavromatidis, G., Ruesch, F., Dorer, V., and Evins, R. (2015). A review of modelling approaches and tools for the simulation of district-scale energy systems. Renew. Sustain. Energy Rev. 52, 1391–1404. doi: 10.1016/j.rser.2015.07.123
Al-Obaidani, S., Curcio, E., Macedonio, F., Profio, G. D., Al-Hinai, H., and Drioli, E. (2008). Potential of membrane distillation in seawater desalination: thermal efficiency, sensitivity study and cost estimation. J. Memb. Sci. 323, 85–98. doi: 10.1016/j.memsci.2008.06.006
Arup (2016). Deadline 2020: How Cities Will Get the Job Done. Available online at: https://www.c40.org/researches/deadline-2020 (accessed April 25, 2019).
Atab, M. S., Smallbone, A. J., and Roskilly, A. P. (2016). An operational and economic study of a reverse osmosis desalination system for potable water and land irrigation. Desalination 397, 174–1184. doi: 10.1016/j.desal.2016.06.020
Bakhtiari, P. H., Nikoo, M. R., Izady, A., and Talebbeydokhti, N. (2020). A coupled agent-based risk-based optimization model for integrated urban water management. Sustain. Cities Soc. 53, 101922. doi: 10.1016/j.scs.2019.101922
Bauer, D., Philbrick, M., Vallario, B., Battey, H., Clement, Z., and Fields, F. (2015). The Water-Energy Nexus: Challenges and Opportunities. Washington, DC: US Department of Energy.
Best, R. E. (2016). Modeling, Optimization, and Decision Support for Integrated Urban and Infrastructure Planning. Available online at: https://searchworks.stanford.edu/view/11891198 (accessed April 26, 2019).
Best, R. E., Flager, F., and Lepech, M. D. (2015). Modeling and optimization of building mix and energy supply technology for urban districts. Appl. Energy 159, 161–1177. doi: 10.1016/j.apenergy.2015.08.076
Best, R. E., Rezazadeh Kalehbasti, P., and Lepech, M. D. (2019). A novel approach to district heating and cooling network design based on life cycle cost optimization. Energy 194, 116837. doi: 10.1016/j.energy.2019.116837
Beyond Efficiency. (2017). Beyond Efficiency. Available online at: http://beyondefficiency.us/ (accessed October 06, 2020).
Blandin, G., Verliefde, A. R. D., Tang, C. Y., and Le-Clech, P. (2015). Opportunities to reach economic sustainability in forward osmosis–reverse osmosis hybrids for seawater desalination. Desalination 363, 26–36. doi: 10.1016/j.desal.2014.12.011
Bouckaert, S., Assoumou, E., Selosse, S., and Maïzi, N. (2014). A prospective analysis of waste heat management at power plants and water conservation issues using a global TIMES model. Energy. 68, 80–91. doi: 10.1016/j.energy.2014.02.008
Buonocore, E., Mellino, S., De Angelis, G., Liu, G., and Ulgiati, S. (2018). Life Cycle assessment indicators of urban wastewater and sewage sludge treatment. Ecol. Indic. 94, 13–23. doi: 10.1016/j.ecolind.2016.04.047
Caceres, E., and Alca, J. J. (2016). Potential For energy recovery from a wastewater treatment plant. IEEE Latin Am. Trans. 14, 3316–333321. doi: 10.1109/TLA.2016.7587636
California ISO. (2019). California Independent System Operator. Available online at: www.caiso.com (accessed May 07, 2021).
Carnegie Mellon University (2007). Economic Input-Output Life Cycle Assessment—Carnegie Mellon University. http://www.eiolca.net/
Carollo Engineers (2015). Sanitary Sewer Flow Study Update. San Jose and Santa Clara. Available online at:http://sanjoseca.gov/DocumentCenter/View/40355 (accessed August 07, 2018).
Cath, T. Y., Drewes, J. E., and Lundin, C. D. (2009). A Novel Hybrid Forward Osmosis Process for Drinking Water Augmentation Using Impaired Water and Saline Water Sources. Alexandria, VA: Water Research Foundation.
Cath, T. Y., Gormly, S., Beaudry, E. G., Flynn, M. T., Adams, V. D., and Childress, A. E. (2005). Membrane contactor processes for wastewater reclamation in space: Part I. Direct osmotic concentration as pretreatment for reverse osmosis. J. Membrane Sci. 257, 85–98. doi: 10.1016/j.memsci.2004.08.039
Chacartegui, R., Monje, B., Sánchez, D., Becerra, J. A., and Campanari, S. (2013). Molten carbonate fuel cell: towards negative emissions in wastewater treatment chp plants. Int. J. Greenhouse Gas Control 19, 453–461. doi: 10.1016/j.ijggc.2013.10.007
Coday, B. D., Xu, P., Beaudry, E. G., Herron, J., Lampi, K., Hancock, N. T., et al. (2014). The sweet spot of forward osmosis: treatment of produced water, drilling wastewater, and other complex and difficult liquid streams. Desalination 333, 23–35. doi: 10.1016/j.desal.2013.11.014
Cook, C., and Bakker, K. (2012). Water security: debating an emerging paradigm. Global Environ. Change 22, 94–102. doi: 10.1016/j.gloenvcha.2011.10.011
Council, N. R. (2012). Water Reuse: Potential for Expanding the Nation's Water Supply Through Reuse of Municipal Wastewater. Washington, DC: National Academies Press.
Coutts, A. M., Beringer, J., and Tapper, N. J. (2008). Investigating the Climatic Impact of Urban Planning Strategies through the Use of Regional Climate Modelling: A Case Study for Melbourne, Australia. Int. J. Climatol. J. R. Meteorol. Soc. 28, 1943–191957. doi: 10.1002/joc.1680
CPI. (2020). CPI Inflation Calculator. Available online at: https://www.in2013dollars.com/us/inflation/ (accessed October 06, 2020).
Crawley, D. B., Lawrie, L. K., Winkelmann, F. C., Buhl, W. F., Huang, Y. J., Pedersen, C. O., et al. (2001). EnergyPlus: creating a new-generation building energy simulation program. Energy Build. 33, 319–331. doi: 10.1016/S0378-7788(00)00114-6
Dai, J., Wu, S., Han, G., Weinberg, J., Xie, X., Wu, X., et al. (2018). Water-energy nexus: a review of methods and tools for macro-assessment. Appl. Energy 210, 393–408. doi: 10.1016/j.apenergy.2017.08.243
Dayton, K., Eicher, J., Joffe, M., and Ring, E. (2016). Rebuilding California's infrastructure for the 21st centurcentury. Available online at: http://californiapolicycenter.org/wp-content/uploads/2016/11/Rebuilding-California-Infratructure-for-the-21st-CenturCentury.pdf (accessed May 02, 2019).
Deb, K., Pratap, A., Agarwal, S., and Meyarivan, T. (2002). A fast and elitist multiobjective genetic algorithm: NSGA-II. IEEE Trans. Evol. Comput. 6, 182–1197. doi: 10.1109/4235.996017
Deru, M., Field, K., Studer, D., Benne, K., Griffith, B., Torcellini, P., et al. (2011). US Department of Energy Commercial Reference Building Models of the National Building Stock. Golden, CO: National Renewable Energy Laboratory.
Díaz, P. R., Benito, Y. R., and Parise, J. A. R. (2010). Thermoeconomic assessment of a multi-engine, multi-heat-pump CCHP (combined cooling, heating and power generation) system–a case study. Energy. 35, 3540–353550. doi: 10.1016/j.energy.2010.04.002
Dincer, I. (2002). On Thermal Energy Storage Systems and Applications in Buildings. Energy and Buildings 34, 377–388. doi: 10.1016/S0378-7788(01)00126-8
DOE (n.d). Combined Heat & Power: A Federal Manager's Resource Guide Final Report. Available online at: https://www.energy.gov/sites/prod/files/2013/11/f4/chp_femp.pdf (accessed March 21, 2019).
Eicker, U., Monien, D., Duminil, É., and Nouvel, R. (2015). Energy performance assessment in urban planning competitions. Appl. Energy 155, 323–333. doi: 10.1016/j.apenergy.2015.05.094
Elimelech, M., and Phillip, W. A. (2011). The future of seawater desalination: energy, technology, and the environment. Science. 333, 712–717. doi: 10.1126/science.1200488
Energy Information Administration (2019). Monthly Energy Review – March 2019. Available online at: www.eia.gov/mer (accessed April 24, 2019).
EPA (2013). Energy Efficiency in Water and Wastewater Facilities. Available online at: www.epa.gov/statelocalclimate/resources/strategy-guides.html (accessed April 30, 2019).
EPA (2016). Social Cost of Carbon. Available online at: https://www.whitehouse.gov/omb/oira/social-cost-of-carbon (accessed February 02, 2019).
Evins, R., Pointer, P., and Vaidyanathan, R. (2011). “Optimisation for CHP and CCHP Decision-Making,” in Proceedings of the Building Simulation 2011 Conference, Sydney, Australia, p. 1335–1342.
Ferreira, E. M., Balestieri, J. A. P., and Zanardi, M. A. (2010). Optimization analysis of dual-purpose systems. Desalination 250, 936–944. doi: 10.1016/j.desal.2009.06.010
Fortin, F.-A., De Rainville, F- M., Gardner, M.-A., Parizeau, M., and Gagné, C. (2012). DEAP: evolutionary algorithms made easy. J. Mach. Learn. Res. 13, 2171–2175. doi: 10.5555/2503308.2503311
Gabriel, K. J., El-Halwagi, M. M., and Linke, P. (2016). Optimization across the water–energy nexus for integrating heat, power, and water for industrial processes, coupled with hybrid thermal-membrane desalination. Ind. Eng. Chem. Res. 55, 3442–3466. doi: 10.1021/acs.iecr.5b03333
Garrick, D., and Hall, J. W. (2014). Water security and society: risks, metrics, and pathways. Annu. Rev. Environ. Resour. 39, 611–639. doi: 10.1146/annurev-environ-013012-093817
Gingerich, D. B., and Mauter, M. S. (2018). Retrofitting the regulated power plant: optimizing energy allocation to electricity generation, water treatment, and carbon capture processes at coal-fired generating facilities. ACS Sustain. Chem. Eng. 6, 2694–2703. doi: 10.1021/acssuschemeng.7b04316
González-Bravo, R., Ponce-Ortega, J. M., and El-Halwagi, M. M. (2017). Optimal design of water desalination systems involving waste heat recovery. Ind. Eng. Chem. Res. 56, 1834–1847. doi: 10.1021/acs.iecr.6b04725
Gude, V. G. (2015). Energy and water autarky of wastewater treatment and power generation systems. Renew. Sustain. Energy Rev. 45, 52–68. doi: 10.1016/j.rser.2015.01.055
Guizania, M., Saitod, M., Itoa, R., and Funamizue, N. (2019). Combined FO and RO system for the recovery of energy from wastewater and the desalination of seawater. Desalination Water Treat. 154, 14–20. doi: 10.5004/dwt.2019.24083
Guo, T., and Englehardt, J. D. (2015). Principles for scaling of distributed direct potable water reuse systems: a modeling study. Water Res. 75, 146–163. doi: 10.1016/j.watres.2015.02.033
Hawkes, A., and Leach, M. (2005). Impacts of temporal precision in optimisation modelling of micro-combined heat and power. Energy. 30, 1759–1779. doi: 10.1016/j.energy.2004.11.012
Hold-Geoffroy, Y., Gagnon, O., and Parizeau, M. (2014). “Once you SCOOP, no need to fork,” in Proceedings of the 2014 Annual Conference on Extreme Science and Engineering Discovery Environment, 1–8. doi: 10.1145/2616498.2616565
Howells, M., and Rogner, H-. H. (2014). Water-energy nexus: assessing integrated systems. Nat. Clim. Chang. 4, 246. doi: 10.1038/nclimate2180
Huang, D., Li, G., Sun, C., and Liu, Q. (2020). Exploring interactions in the local water-energy-food nexus (wef-nexus) using a simultaneous equations model. Sci. Total Environ. 703, 135034. doi: 10.1016/j.scitotenv.2019.135034
Hukkalainen, M., Virtanen, M., Paiho, S., and Airaksinen, M. (2017). Energy planning of low carbon urban areas-examples from Finland. Sustain. Cities Society 35, 715–728. doi: 10.1016/j.scs.2017.09.018
Husnain, T., Mi, B., and Riffat, R. (2015a). Fouling and long-term durability of an integrated forward osmosis and membrane distillation system. Water Sci. Technol. 72, 2000–2005. doi: 10.2166/wst.2015.415
Husnain, T., Mi, B., and Riffat, R. (2015b). A combined forward osmosis and membrane distillation system for sidestream treatment. J. Water Resource Prot. 7, 1111. doi: 10.4236/jwarp.2015.714091
IEA-ETSAP and IRENA. (2013). Thermal Energy Storage: Technology Brief. Available online at: https://www.inship.eu/docs/TES1IRENA-ETSAPTechBrief~E17ThermalEnergyStorage.pdf (accessed October 06, 2020).
International Energy Agency (2016). Cities Are at the Frontline of the Energy Transition. 2016. Available online at: https://www.iea.org/newsroom/news/2016/september/cities-are-at-the-frontline-of-the-energy-transition.html (accessed April 23, 2019).
Jaccard, M. (2006). Sustainable Fossil Fuels: The Unusual Suspect in the Quest for Clean and Enduring Energy. Cambridge: Cambridge University Press.
Kalmykova, Y., Sadagopan, M., and Rosado, L. (2018). Circular economy–from review of theories and practices to development of implementation tools. Resourc. Conserv. Recycl.135, 190–201. doi: 10.1016/j.resconrec.2017.10.034
Keirstead, J., Jennings, M., and Sivakumar, A. (2012). A review of urban energy system models: approaches, challenges and opportunities. Renew. Sustain. Energy Rev. 16, 3847–3866. doi: 10.1016/j.rser.2012.02.047
Khan, Z., Linares, P., and García-González, J. (2017). Integrating water and energy models for policy driven applications. A review of contemporary work and recommendations for future developments. Renew. Sustain. Energy Rev. 67, 1123–1138. doi: 10.1016/j.rser.2016.08.043
Kim, J. E., Phuntsho, S., Ali, S. M., Choi, J. Y., and Shon, H. K. (2018). Forward osmosis membrane modular configurations for osmotic dilution of seawater by forward osmosis and reverse osmosis hybrid system. Water Res. 128, 183–192. doi: 10.1016/j.watres.2017.10.042
Luck, M., Landis, M., and Gassert, F. (2015). Aqueduct Water Stress Projections: Decadal Projections of Water Supply and Demand Using CMIP5 GCMs. World Resources Institute.
Mancarella, P. (2014). MES (Multi-Energy Systems): an overview of concepts and evaluation models. Energy. 65, 1–17. doi: 10.1016/j.energy.2013.10.041
Manfren, M., Caputo, P., and Costa, G. (2011). Paradigm shift in urban energy systems through distributed generation: methods and models. Appl. Energy 88, 1032–1048. doi: 10.1016/j.apenergy.2010.10.018
Mata-Torres, C., Zurita, A., Cardemil, J. M., and Escobar, R. A. (2019). Exergy cost and thermoeconomic analysis of a rankine cycle+ multi-effect distillation plant considering time-varying conditions. Energy Convers. Manag. 192, 114–132. doi: 10.1016/j.enconman.2019.04.023
McCutcheon, J., and Huang, L. (2013). “Forward osmosis,” in Encyclopedia of Membrane Science and Technology, 1–19. Hoboken, NJ: Wiley.
McGivney, W., and Kawamura, S,. (2008). Cost Estimating Manual for Water Treatment Facilities. Hoboken, NJ: Wiley Online Library.
McGovern, C., and Bastian, R,. (2009). Water Recycling and Reuse: The Environmental Benefits. Washington, DC: The United States Environmental Protection Agency.
Mehr, A. S., MosayebNezhad, M., Lanzini, A., Yari, M., Mahmoudi, S. M. S., and Santarelli, M. (2018). Thermodynamic assessment of a novel SOFC Based CCHP system in a wastewater treatment plant. Energy. 150, 299–309. doi: 10.1016/j.energy.2018.02.102
Moazeni, F., Khazaei, J., and Mendes, J. P. P. (2020). Maximizing energy efficiency of islanded micro water-energy nexus using co-optimization of water demand and energy consumption. Appl. Energy 266, 114863. doi: 10.1016/j.apenergy.2020.114863
MosayebNezhad, M., Mehr, A. S., Gandiglio, M., Lanzini, A., and Santarelli, M. (2018). Techno-economic assessment of biogas-fed CHP hybrid systems in a real wastewater treatment plant. Appl. Thermal Eng. 129, 1263–1280. doi: 10.1016/j.applthermaleng.2017.10.115
Murrant, D., Quinn, A., Chapman, L., and Heaton, C. (2017). Water use of the UK thermal electricity generation fleet by 2050: Part 1 Identifying the Problem. Energy Policy 108, 844–858. doi: 10.1016/j.enpol.2017.05.011
O'Neill, B. C., Kriegler, E., Ebi, K. L., Kemp-Benedict, E., Riahi, K., Rothman, D. S., et al. (2017). The roads ahead: narratives for shared socioeconomic pathways describing world futures in the 21st centurcentury. Glob. Environ. Change 42, 169–180. doi: 10.1016/j.gloenvcha.2015.01.004
Pedregosa, F., Varoquaux, G., Gramfort, A., Michel, V., Thirion, B., Grisel, O., et al. (2011). Scikit-learn: machine learning in python. J. Mach. Learn. Res. 12, 2825–2830. doi: 10.5555/1953048.2078195
Rezaie, B., and Rosen, M. A. (2012). District heating and cooling: review of technology and potential enhancements. Appl. Energy 93, 2–10. doi: 10.1016/j.apenergy.2011.04.020
Rezazadeh Kalehbasti, P., and Lepech, M. D. (2021). Augmenting high-dimensional nonlinear optimization with conditional GANs. ArXiv Preprint ArXiv:2103.04748. doi: 10.1145/3449726.3463675
Rezazadeh Kalehbasti, P., Lepech, M. D., and Pandher, S. S. (2021). “Augmenting High-Dimensional Nonlinear Optimization with Conditional GANs,” in Genetic and Evolutionary Computation Conference Companion (GECCO '21), 1879–80. ACM.
Rodriguez, D. J., Delgado, A., Delaquil, P., and Sohns, A. (2013). Thirsty Energy. Available online at: http://www.dun-eumena.com/reagri/upload/files/789230WP0Box377361B00PUBLIC0.pdf (accessed April 29, 2019).
Rousseeuw, P. J. (1987). Silhouettes: a graphical aid to the interpretation and validation of cluster analysis. J. Comput. Appl. Math. 20, 53–65. doi: 10.1016/0377-0427(87)90125-7
Saidi, S., Kattan, L., Jayasinghe, P., Hettiaratchi, P., and Taron, J. (2018). Integrated infrastructure systems—a review. Sustain. Citie Soc.y 36, 1–11. doi: 10.1016/j.scs.2017.09.022
Scherson, Y. D., and Criddle, C. S. (2014). Recovery of freshwater from wastewater: upgrading process configurations to maximize energy recovery and minimize residuals. Environ. Sci. Technol. 48, 8420–8432. doi: 10.1021/es501701s
Scherson, Y. D., Wells, G. F., Woo, S-. G., Lee, J., Park, J., Cantwell, B. J., et al. (2013). Nitrogen removal with energy recovery through N2O decomposition. Energy Environ. Sci. 6, 241–248. doi: 10.1039/C2EE22487A
Schütz, T., Streblow, R., and Müller, D. (2015). A comparison of thermal energy storage models for building energy system optimization. Energy Buildings 93, 23–31. doi: 10.1016/j.enbuild.2015.02.031
SF Environment. (2018). San Francisco Municipal Progress Report: Climate and Sustainability. San Francisco. Available online at: https://sfenvironment.org/sites/default/files/fliers/files/sfe_municipal_progress_report_2019.pdf (accessed April 25, 2019).
SF PUC. (2019). San Francisco Public Utilities Commission: Southeast Treatment Plant. SF Public Utilities Commision. Available online at: https://sfwater.org/index.aspx?page=616 (accessed May 15, 2019).
Shaffer, D. L., Werber, J. R., Jaramillo, H., Lin, S., and Elimelech, M. (2015). Forward osmosis: where are we now? Desalination 356, 271–284. doi: 10.1016/j.desal.2014.10.031
Siddiqi, A., and Anadon, L. D. (2011). The water–energy nexus in Middle East and North Africa. Energy Policy 39, 4529–4540. doi: 10.1016/j.enpol.2011.04.023
Stanford University. (2021). CR2C. Available online at: https://cr2c.stanford.edu/about-0 (accessed August 2, 2021).
Taleb, N. N. (2007). The Black Swan: The Impact of the Highly Improbable. Vol. 2. Rushden: Random House.
United Nations (2015). Cities - United Nations Sustainable Development Action 2015. United Nations. Available online at: https://www.un.org/sustainabledevelopment/cities/ (accessed March 20, 2019).
United Nations (2019). World Water Development Report 2019. Available online at: http://www.unwater.org/publications/world-water-development-report-2019/ (accessed April 29, 2019).
US EIA (2017). CBECS Water Consumption in Large Buildings. https://www.eia.gov/consumption/commercial/reports/2012/water/ (accessed May 09, 2019).
US EPA (n.d). Watersense. Available online at: https://www.epa.gov/watersense/types-facilities (accessed May 09, 2019).
Van Rossum, G. (2007). “Python Programming Language,” in USENIX Annual Technical Conference, Vol. 41, p. 36.
Waibel, C., Evins, R., and Carmeliet, J. (2019). Co-simulation and optimization of building geometry and multi-energy systems: interdependencies in energy supply, energy demand and solar potentials. Appl. Energy 242, 1661–1682. doi: 10.1016/j.apenergy.2019.03.177
Wang, X., Guo, M., Koppelaar, R. H. E. M., van Dam, K. H., Triantafyllidis, C. P., and Shah, N. (2018). A nexus approach for sustainable urban energy-water-waste systems planning and operation. Environ. Sci. Technol. 52, 3257–3266. doi: 10.1021/acs.est.7b04659
Wilcox, S., and Marion, W. (2008). Users manual for TMY3 data sets. Renew. Energy. 28. doi: 10.2172/928611
World Economic Forum (2014). Towards the Circular Economy: Accelerating the Scale-up across Global Supply Chains. Available online at: www.weforum.org (accessed April 29, 2019).
World Economic Forum Water Initiative (2012). Water Security: The Water-Food-Energy-Climate Nexus. Washington, DC: Island Press.
Wu, P. P-. Y, Fookes, C., Pitchforth, J., and Mengersen, K. (2015). A framework for model integration and holistic modelling of socio-technical systems. Dec. Support Syst. 71, 14–27. doi: 10.1016/j.dss.2015.01.006
Wu, Q., Ren, H., Gao, W., Weng, P., and Ren, J. (2018). Coupling optimization of urban spatial structure and neighborhood-scale distributed energy systems. Energy. 144, 472–481. doi: 10.1016/j.energy.2017.12.076
Xianli, W. U., Yangdong, H. U., Lianying, W. U., and Hong, L. I. (2014). Model and design of cogeneration system for different demands of desalination water, heat and power production. Chin. J. Chem. Eng. 22, 330–338. doi: 10.1016/S1004-9541(14)60036-7
Zaviska, F., and Zou, L. (2014). Using modelling approach to validate a bench scale forward osmosis pre-treatment process for desalination. Desalination 350, 1–13. doi: 10.1016/j.desal.2014.07.005
Zhou, X., Gingerich, D. B., and Mauter, M. S. (2015). Water treatment capacity of forward-osmosis systems utilizing power-plant waste heat. Ind. Eng. Chem. Res. 54, 6378–6389. doi: 10.1021/acs.iecr.5b00460
Appendix

List of symbols and abbreviations.
Keywords: district energy system, water-energy nexus, multi-objective optimization, wastewater treatment, membrane, K-means clustering
Citation: Rezazadeh Kalehbasti P, Lepech MD and Criddle CS (2022) Integrated Design and Optimization of Water-Energy Nexus: Combining Wastewater Treatment and Energy System. Front. Sustain. Cities 4:856996. doi: 10.3389/frsc.2022.856996
Received: 18 January 2022; Accepted: 02 March 2022;
Published: 31 March 2022.
Edited by:
Juan Pablo Rodríguez Sánchez, University of Los Andes, ColombiaCopyright © 2022 Rezazadeh Kalehbasti, Lepech and Criddle. This is an open-access article distributed under the terms of the Creative Commons Attribution License (CC BY). The use, distribution or reproduction in other forums is permitted, provided the original author(s) and the copyright owner(s) are credited and that the original publication in this journal is cited, in accordance with accepted academic practice. No use, distribution or reproduction is permitted which does not comply with these terms.
*Correspondence: Pouya Rezazadeh Kalehbasti, cG91eWFyQHN0YW5mb3JkLmVkdQ==