 Gary Kleiman1*
 Susan C. Anenberg2
 Zoe A. Chafe3
 Desmond C. Appiah3Tibebu Assefa3Andrea Bizberg3Toby Coombes3
 Doroti Cuestas4Daven K. Henze5Alexander Kessler1,6
 Iyad Kheirbek3
 Patrick Kinney7Musa Mahlatji8Julian D. Marshall9Seneca Naidoo3Nwabisa Potwana3†Adriana Rodriguez10Christopher W. Tessum11Culley Thomas3†
- 1Orbis Air, LLC, Concord, MA, United States
- 2Milken Institute School of Public Health, George Washington University, Washington, DC, United States
- 3C40 Cities Climate Leadership Group Inc., New York, NY, United States
- 4Environmental Management Office of the Metropolitan Municipality of Lima, Lima, Peru
- 5Department of Mechanical Engineering, University of Colorado, Boulder, CO, United States
- 6Department of Chemistry and Biochemistry and Program for Environmental Studies, Middlebury College, Middlebury, VT, United States
- 7Boston University School of Public Health, Boston, MA, United States
- 8Environment and Infrastructure Services Department, Johannesburg, South Africa
- 9Department of Civil and Environmental Engineering, University of Washington, Seattle, WA, United States
- 10Metropolitan Area of Guadalajara Planning and Management Institute, Zapopan, Mexico
- 11Department of Civil and Environmental Engineering, Newmark Civil Engineering Laboratory, University of Illinois at Urbana-Champaign, Urbana, IL, United States
Cities emit the majority of greenhouse gas emissions globally and are increasingly committing to aggressive mitigation actions. Cities are also experiencing poor—and in some cases worsening—air quality, contributing to large disease burdens for adults and children. Integrated planning frameworks can help cities leverage and prioritize measures that achieve climate, air quality, and health benefits simultaneously. We developed and applied an integrated climate action planning process that includes air quality, utilizing Pathways-AQ, a new assessment tool, in six pilot cities: Accra, Ghana; Addis Ababa, Ethiopia; Buenos Aires, Argentina; the metropolitan area of Guadalajara, Mexico; Johannesburg, South Africa; and Lima, Peru. Implementing the “ambitious” greenhouse gas reduction scenarios in these cities' climate action plans would reduce in-city contributions to fine particulate matter (PM2.5) concentrations and would avoid 230–1,040 annual premature deaths per city, by 2050. This new integrated climate action planning process revealed the importance of (i) geographic scales of analysis, (ii) data integration across climate and air quality, (iii) local civic engagement, and (iv) nuanced health messaging. Rapidly scaling up and applying this integrated approach can broaden the group of municipal stakeholders involved in climate-related planning goals, potentially leading to greater ambition by integrating climate, air pollution, and health objectives.
Introduction
Air pollution and climate change are closely interlinked through common sources that emit both primary and precursor air pollutants, short-lived climate pollutants (SLCPs, e.g., black carbon, a component of PM2.5, and methane, a powerful but short-lived greenhouse gas) and long-lived greenhouse gases (GHGs, e.g., CO2; Fiore et al., 2015). Here we primarily focus on fine particle pollution, or PM2.5, and associated precursor pollutants NOX, SO2, VOC, and NH3, which result in the greatest burden of disease globally (McDuffie et al., 2021). Historically, governmental actions to address climate change and air pollution have been largely separate, despite these common emission sources and that climate change affects air pollution and vice versa (Nemet et al., 2010; Ravishankara et al., 2012; Schmale et al., 2014). Improvements in air quality (AQ) and public health are among the largest and most-localized potential co-benefits of GHG mitigation actions, and thus often a key point of engagement for all cities, especially those in low- and middle-income countries, which increasingly seek solutions that achieve multiple policy goals simultaneously (Akbar et al., 2014). However, simultaneously assessing the AQ, health, and climate impacts of GHG and air pollution mitigation actions is challenging, in part because of dramatic differences in the climate and air pollution impacts of various pollutants; the wide variation in quantities emitted by source and by location; and the degree to which specific mitigation actions reduce these emissions (GAHP, 2020).
In response to these challenges, numerous tools have been developed to aid in integrated assessments and in planning for air quality and climate goals (Anenberg et al., 2016). Many of these tools include pre-packaged analytical calculations or reduced form, computationally expensive atmospheric chemistry simulations that have been simplified to facilitate adoption by the planning community. These tools provide a range of capabilities, such as quantifying how specified changes to air pollutant concentrations impact human health [e.g., BenMAP (USEPA, 2015), AirQ+ (WHO, 2019)], how changes to emissions impact concentrations (e.g., InMAP; Tessum et al., 2017) or corresponding health impacts [e.g., EASIUR (Heo et al., 2016), AP2 (Muller, 2014),TM5-FASST (Van Dingenen et al., 2018)], or how changes to policies impact emissions [LEAP (Heaps, 2020), ESP (Loughlin et al., 2011)]. A typology of available tools is found in the Supplementary Figure 1.
Cities are emerging as critical participants in efforts to reduce global GHGs, but at the same time, they often struggle to control air pollution. Only 1% of 12,990 cities globally had population-weighted annual mean PM2.5 concentrations below the World Health Organization (WHO) 2021 guideline of 5 μg/m3 in 2019 (Southerland et al., 2022); and air pollution concentrations are rising in many cities globally (Anenberg et al., 2019). Several cities have integrated AQ into Climate Action Plans (CAPs) in recent years (e.g., Paris, Durban, Los Angeles, New York City), but to date, most CAPs that include air quality modeling have been created by cities with financial resources for consultants and/or access to sophisticated modeling resources, either in-house or through collaborators. The complexities and computing resources typically required to simulate air quality under different policies remain an important barrier for integrating air quality into CAPs. In resource-poor settings, air pollution and health co-benefits may offer the greatest incentive for cities to “raise ambition” and seek stronger pollutant reductions.
A new opportunity for integrating climate change and air quality planning is emerging through city networks that act as “boundary organizations,” linking scientific information with policy development. One leading example is C40 Cities, a network of 96 cities that, combined, represent >700 million people and one quarter of the global economy. Throughout 2020, C40 led the largest urban CAP process in history, aiming to help cities worldwide achieve carbon neutrality by 2050 (C40, 2020a). Most of these cities use the “Pathways” planning tool (C40, 2022) to explore carbon emission scenarios that reflect a range of stringency in mitigation. However, Pathways had not—heretofore—included the capability to estimate air quality and health co-benefits of climate actions; and most of these cities do not have the resources to conduct their own air quality and health assessments outside of Pathways.
The objective of this work, therefore, was to develop a new framework, including both planning processes and screening-level analytical tools, to integrate PM2.5 and PM2.5-attributable mortality into city-level climate action planning (see Figure 1). PM2.5 was chosen as the target pollutant because it is the leading contributor to the global air pollution disease burden. This framework is distinct from previous assessment tools in that it spans the complete causal chain between emissions policies and emission impacts, for both air quality and climate action planning, and was developed specifically for use in urban areas; as compared with other tools that were originally developed for national scale analyses (e.g., LEAP-IBC; Kuylenstierna et al., 2020). This paper describes implementation of this new framework for six pilot cities (Accra, Ghana; Addis Ababa, Ethiopia; Buenos Aires, Argentina; Guadalajara, Mexico; Lima, Peru; and Johannesburg, South Africa), using examples from Buenos Aires to illustrate the process and tools, followed by lessons learned and considerations for scaling up application of this integrated climate planning and air quality management approach in more cities.
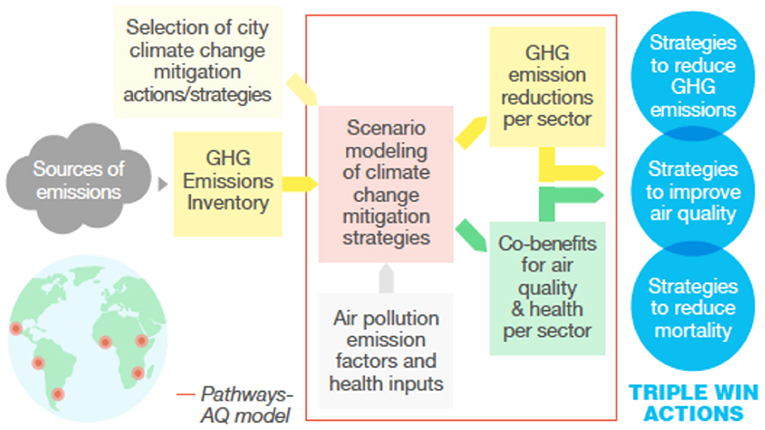
Figure 1. Integrated framework for Climate Action Planning with Air Quality (CAP-AQ).
Materials and Methods
Integrated Climate Action Planning-Air Quality Process
We formed a new partnership between academic researchers, consultants, C40 Cities, and municipal staff to develop an integrated Climate Action Planning-Air Quality (CAP-AQ) process that includes simultaneous consideration of GHGs, PM2.5, and PM2.5-attributable mortality in urban CAPs. The science-policy partnership enabled us to bridge the gap between scientific literature, which highlights the PM2.5 and health co-benefits of GHG mitigation, and the urban GHG mitigation planning led by C40 Cities and municipal agencies (C40, 2020b). The partnership included specialists in atmospheric science, public health, GHG emissions modeling, and climate and AQ policy, along with the municipal staff who hold crucial information about their city's context, including governance structures, emission sources, and potential mitigation policies. Several C40 staff members were based in pilot cities (in some cases sitting within municipal agency offices), where they could work directly with municipal staff to gather city-specific data, co-develop GHG and AQ analyses for the CAPs, convene staff across city agencies, and assist with generating and interpreting results.
Together, we developed a new integrated CAP-AQ process that enables simultaneous consideration of GHGs, air pollution and associated health impacts in urban climate action planning; and encourages continuous learning and iteration to prioritize mitigation strategies that achieve multiple benefits. For each city, the CAP-AQ process begins by identifying key emission source sectors, developing GHG emissions inventories and collecting AQ emission factors, setting GHG mitigation goals, developing mitigation plans and policies, and estimating reductions in GHG emissions and changes in PM2.5 and associated mortality impacts (Figure 2). The process includes iterating on the draft mitigation plans to evaluate and prioritize strategies that consider the multiple goals of GHG and air pollution mitigation.
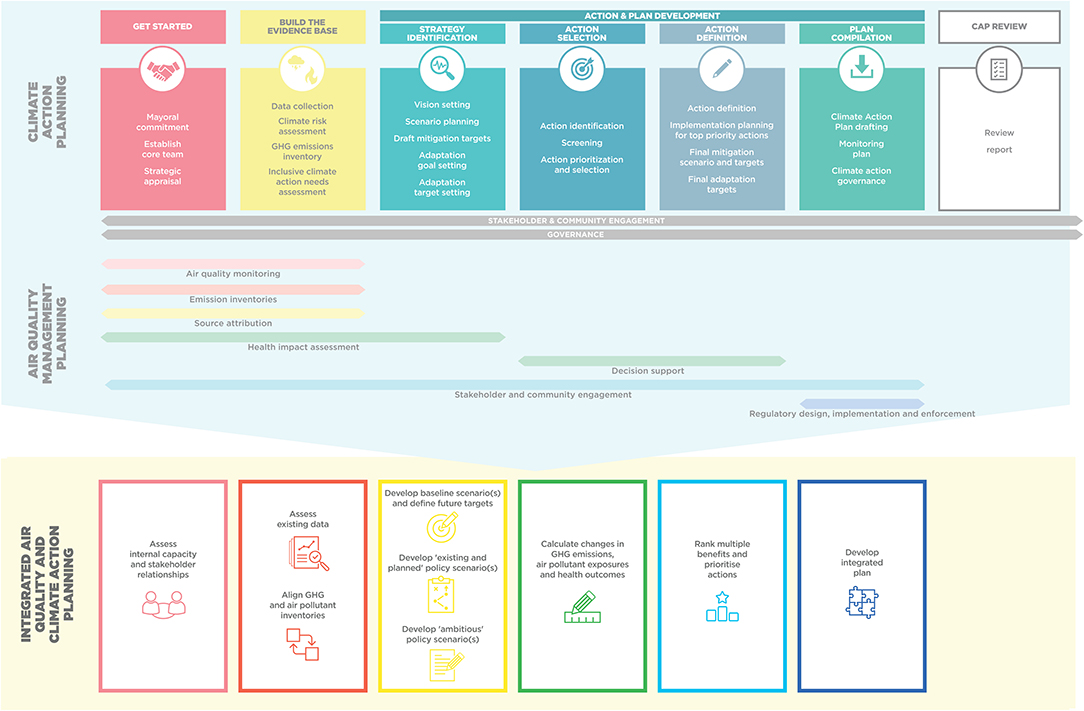
Figure 2. Flow diagram of C40 integrated climate and air quality (CAP-AQ) assessment process.
Decision-Support Tools
We developed several decision-support metrics for C40 Cities and its member cities to integrate PM2.5 into climate action planning: (1) estimates of city-wide annual average PM2.5 concentrations and associated mortality burdens; (2) estimates of the portion of PM2.5 concentrations that stem from emissions that are located inside (for sectors with interventions that are most likely to be under municipal purview) vs. outside of city control (e.g., emissions from natural sources as well as anthropogenic emissions outside the city); and (3) datasets and calculations that estimate the change in air pollutant emissions, PM2.5 concentrations, and PM2.5-attributable mortality that would come from municipal GHG mitigation actions.
This analysis uses C40's Pathways tool, a bottom-up city-scale strategic planning model of activity within eight sectors (e.g., transportation, wastewater; C40, 2022). For each sector, activity level is multiplied by a GHG emission factor (emissions per unit of activity) to calculate the associated GHG emissions. For greater reliability, the activity level is calibrated to data from the city's greenhouse gas emissions inventory (the industry-standard Global Protocol for Community-Scale Greenhouse Gas Emission Inventory, or simply “GPC-compliant inventory”; GHG Protocol, 2014). The tool is used to model city-level GHG emissions over time and allows users to input actions, such as shifting to energy efficient household appliances, to see how they will reduce the city's total emissions at various time scales.
Users can input city GHG emissions inventory activity levels and predictions for growth drivers or factors to forecast emissions in future years. Users can select emissions targets (or emissions intensity targets) for three horizon years (future years for which emissions are scaled relative to a base year using population and GDP growth assumptions to establish a “Business As Usual” scenario) and compare their targets with resulting carbon trajectories (C40, 2020a). The model contains default assumptions for three levels of action implementation, consistent with the three required scenarios: “Business as Usual” (BAU), “Existing and Planned” action (E&P), and “Ambitious” action (see screenshots of user interface in Supplementary Figures 2, 3).
Pathways contains dashboards that allow users to quickly identify key emissions sources within the city by sector, subsector and activity level. Actions that address these emissions are divided into eight sectors: electricity generation, buildings' energy usage, industrial energy usage, transportation, solid waste, wastewater, industrial processes and product use (IPPU), and agriculture, forestry and other land use (AFOLU).
We developed a new version of C40's Pathways tool (called Pathways-Air Quality, or “Pathways-AQ”; C40, 2022) to incorporate a screening-level capability to estimate the change in PM2.5 and precursor emissions, annual average PM2.5 concentrations, and PM2.5-attributable mortality associated with several mitigation scenarios. As applied here, the key analytical steps to quantitatively estimate PM2.5 concentration and associated mortality changes from mitigation policies for each city are (see Figure 3): (1) develop air pollution emissions inventories and changes under policy scenarios, using source sector activity levels and emission factors; (2) estimate changes in PM2.5 concentrations using emission-to-concentration “sensitivities” from a reduced-form chemical transport model; and (3) estimate PM2.5-attributable mortality using epidemiologically-derived concentration-response relationships. A Pathways model can be established for any city with a GPC-compliant inventory (GHG Protocol, 2014). The process involves collecting activity data (the distribution of different technologies—see Supplementary Table 1), establishing growth projections, and identifying specific actions that are implemented to create scenarios. The activity data structure within Pathways draws mostly from bottom-up modeling using city-specific data. Data are sourced from relevant departments within the city government (e.g., housing, transport, waste), and supplemented with data from local surveys, reports, and academic studies. In cases where no city-specific data are available, regional or national data may be used as a proxy by scaling to the local population.
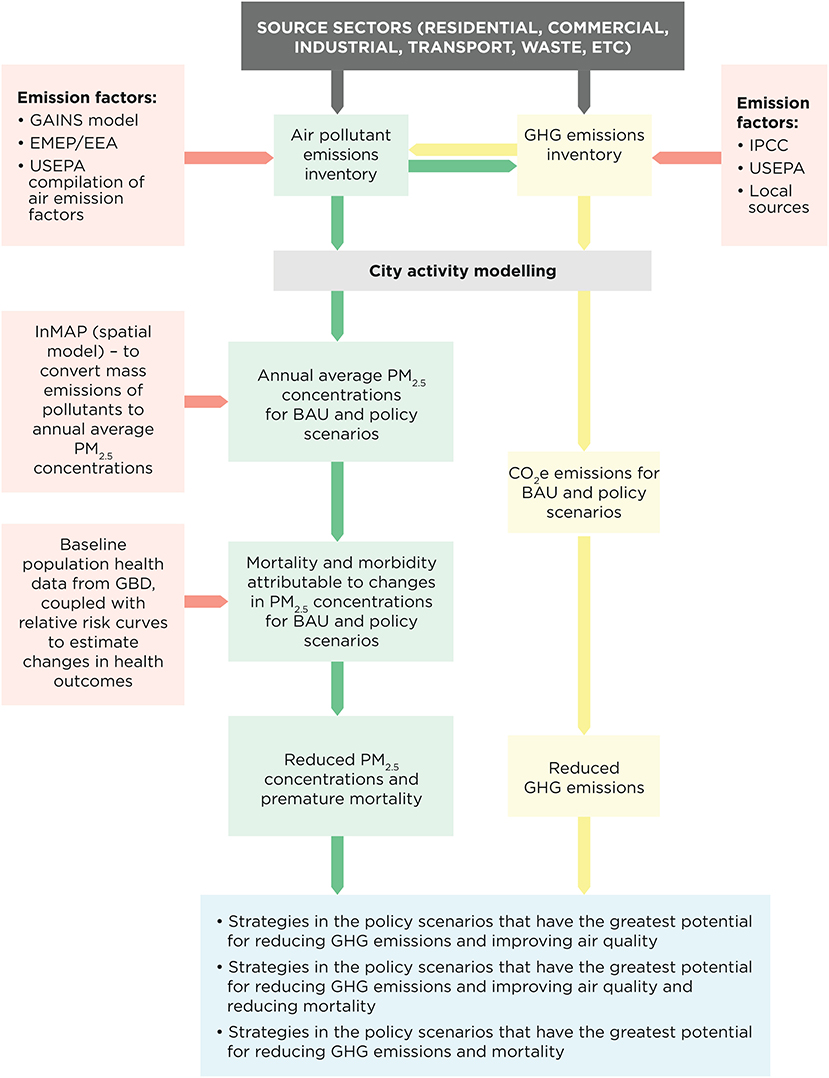
Figure 3. Flow diagram and model structure of C40's Pathways-AQ tool.
The emission factors for primary PM2.5 and its four precursor species (SO2, NOX, VOC, and NH3) come mainly from IIASA's GAINS model (Amann et al., 2011), due to GAINS' generally high quality, global coverage across all relevant sectors with internally consistent values. The IIASA emission factor databases are available by sector, pollutant and country, including 172 country regions (Klimont et al., 2017). Emission factors for the on-road transportation sector were, however, drawn from the European Environment Agency's (EEA) European Modeling and Evaluation Programme 2019 guidebook (EMEP/EEA, 2019). This guidebook breaks down the sector by technology type and vintage at a greater resolution than that which was available in the GAINS dataset. Having categories for technologies like minibuses and three wheelers, distinct from other heavy- or light-duty vehicles, is critical for municipal applications. City governments often have the ability to monitor and regulate on-road transportation, and city managers therefore benefit from using disaggregated transportation data. These emission factors were paired with local activity data to estimate emissions. Region-specific national fleet “high emitter” enhancement factors were applied as in Klimont et al. (2017). A full breakout of sectoral emission factor sources is provided in Supplementary Table 2.
“Sensitivities” (city-specific factors linking changes in primary PM2.5 and precursor emissions to changes in city-wide annual average PM2.5 concentrations) were generated using the InMAP model (Tessum et al., 2017; Thakrar et al., 2022) for 96 C40 cities. The original U.S. version of the InMAP model (Tessum et al., 2017) has been expanded to model the entire globe (Thakrar et al., 2022). While the global InMAP model development is described by Thakrar et al. (2022), here we describe its implementation in the CAP-AQ integration process. State-of-the-art chemical transport models (CTMs) are usually too computationally- and resource-intensive for municipal government application, especially in resource-poor settings (which tend to have some of the planet's worst air pollution). InMAP is a mechanistic model with simplified chemical and physical calculations that functions like a conventional CTM but at far lower computational intensity. As a steady-state model, InMAP uses a time-averaged advection scheme and reaction rates to provide steady-state estimates of changes in annual average PM2.5 levels. Annual average concentrations of PM2.5 are most relevant for determining long-term (chronic) exposure, which is the dominant contributor to adverse effects of air pollution (GBD 2019 Risk Factor Collaborators, 2020).
InMAP uses a variable resolution computational grid, enabling the model to focus computational effort on areas where it matters most, i.e., in population centers, without using valuable computational cycles across vast regions of the ocean or desert where high spatial resolution is less valuable. To achieve this outcome, the model includes a dynamic algorithm that changes grid cell sizes as it runs, based on population density and predicted pollution. The algorithm splits any cell that has more than 100,000 people, based on population densities from World Pop dataset (Tatem, 2017). Global InMAP currently relies on preprocessed GEOS-Chem model data (Henze et al., 2007) as an input for the mechanistic representation of global emission sensitivity outside of the U.S.; additional preprocessors can enable the use of other air quality models in the future. Global anthropogenic initial emissions are from the Community Emissions Data System (CEDS; Hoesly et al., 2018), and are mapped onto the InMAP grid cells at a higher resolution according to population density. Global InMAP uses information from OpenStreetMap, WorldPop, and a database of power plant locations (Tong et al., 2018) to create spatial surrogates to downscale emission locations from the 0.5 × 0.5° CEDS inventory to InMAP grid cells. The default for InMAP global simulations is 2 × 2.5 degrees for the largest cells and 0.031 × 0.039° (~3.5 × 4.3 km2 at the equator) for the smallest cells, although this resolution can be increased (which would increase the computer time required). Individual city simulations use a 20 × 25°spatial domain, centered at the center of the city in question, with maximum and minimum grid cell sizes of 2 × 2.5 and 0.01 × 0.013° (~220 × 280 and ~1.2 × 1.4 km2 at the equator). A summary of the global InMAP model evaluation is provided in Thakrar et al. (2022) and Tessum et al. (2022).
The InMAP model is not meant to reproduce total concentrations, but rather to provide a set of “sensitivities” which are used to convert changes in local emission of PM2.5 to changes in city-scale annual average PM2.5 concentrations (see Supplementary Figure 4 for an example calculation). Using a localized inventory, built from the ground up with local data and expertise, in combination with InMAP generated sensitivities to model the concentration implications of small changes in emissions, is expected to provide the best available information on anticipated air quality benefits of climate action in the context of a scoping-level analysis.
To estimate PM2.5-attributable mortality, Pathways-AQ assesses changes in attributable deaths associated with chronic exposure to PM2.5 that are due to a change in relevant emissions. The six health outcomes currently considered are stroke, ischemic heart disease, chronic obstructive pulmonary disease, lung cancer, lower respiratory infections, and type II diabetes mellitus, consistent with the Global Burden of Disease (GBD) 2019 Study (GBD 2019 Risk Factor Collaborators, 2020). Pathways-AQ uses national cause-specific mortality rates from the GBD 2019 Study, unless city-specific baseline rates are available. Local cause-specific mortality rates can influence urban PM2.5-attributable mortality estimates (Castillo et al., 2021; Southerland et al., 2022); but local cause-specific mortality rates were only available in a limited number of cities and only for some health outcomes. Pathways-AQ uses concentration-response relationships from the GBD 2019 study to calculate the fraction of the individual health outcomes that are attributable to PM2.5. The function is non-linear, flattening at high concentrations and thus leading to lower sensitivity in polluted environments, but still with overall higher health impacts at high PM2.5 concentrations. The portion of cause-specific mortality that is attributable to PM2.5 is calculated using the population attributable fraction method. We obtained a lookup table from the GBD 2019 Study team that provides mean relative risk estimates for individual PM2.5 concentration steps (e.g., 0.01, 0.1, 1, 10, or 100 μg/m3 steps from 0 to 2,500 μg/m3 total concentration). We assume that all PM2.5 components are equally toxic, as evidence for differential effects for individual components is currently insufficient (WHO, 2021). Baseline PM2.5 values are derived from the GBD 2019 Study present-day annual average PM2.5 concentrations. The values are gridded at a 0.1 × 0.1° resolution (~10 × 10 km) and then population weighted across the geographical domain of city boundaries provided by city staff to C40, using the same Worldpop population dataset that was used in the InMAP model.
We have calculated the total PM2.5 concentrations and disease burdens for all 96 C40 cities, as part of the Pathways-AQ model development. For space considerations, the application of these data is shown here for the six pilot cities listed above. We note that full application of the framework requires preparation beyond the calculation of sensitivities, concentrations and disease burdens; and that the conversion of a city's GPC inventory into Pathways-ready file, as well as quality assurance, takes significant effort. This is discussed in Section Data Integration Is Needed Across Climate Action and Air Quality Management Processes.
Results
Application in Six Pilot Cities
We applied the new integrated CAP-AQ framework and the Pathways-AQ tool during the development of CAPs for six pilot cities (Accra, Ghana; Addis Ababa, Ethiopia; Buenos Aires, Argentina; metropolitan area of Guadalajara, Mexico; Johannesburg, South Africa; and Lima, Peru). These cities were chosen because they are major cities making ambitious commitments toward GHG emission mitigation, expressed interest in understanding AQ and health co-benefits of their policy scenarios, did not have previous experience or resources to conduct their own co-benefits assessments, and were eager to enhance integration of climate and AQ policy processes. In cities like Accra, where the legal responsibility for AQ monitoring and management rests with the Ghana EPA and responsibility for health impact assessments and policy guidance rests with the Ghana Health Service (both national-level institutions), this work gives further insight into how municipal authorities can work toward addressing environmental challenges.
While we envision municipal staff taking a larger role in the future, in this initial implementation, C40 staff ran Pathways-AQ to generate estimates of GHG emission, PM2.5 concentration, and PM2.5-attributable mortality impacts. These estimates were based on data inputs provided or approved by city staff, as well as CAP policy scenarios defined by staff and stakeholders in pilot cities. Pathways-AQ results were shared with municipal technical staff for their feedback, and C40 staff made adjustments to the underlying data or background material based on comments received. The city was then presented with an updated “technical annex,” which included background on PM2.5 sources, levels, monitoring capacity, and governance documents (such as an AQ management plan). In some cases, at the city's discretion, the results were then included in a CAP package that was submitted to relevant governance bodies, such as the city council, for approval. In other cases, the CAP-AQ findings and outcomes were summarized in an internal document. We use Buenos Aires as an example to illustrate the process, and then detail the lessons learned across the six pilot cities.
Pilot City GHG Reduction Goals and Policy Scenarios
As illustrated by the results for Buenos Aires, the “Business as Usual” (BAU), “Existing and Planned” action (E&P) and “Ambitious” action scenarios include different gradations of the following policies: renewable grid electricity; heat pumps; LED lighting and high efficiency appliances in commercial buildings; fuel switching and industrial energy efficiency in the industrial sector; mode shifting from private car/minibus to bus rapid transit and commuter rail; and increasing recycling, composting, and sanitary landfills with methane capture. Detailed measures and penetration levels are in Supplementary Tables 3–5, for the city explored here (Buenos Aires). Figure 4 provides the projected results of only the “Ambitious” scenario—using three different metrics (CO2e, PM2.5, and premature mortality)—to demonstrate how different sectors are relevant to the changes in the different indicators. We focus on only the “Ambitious” scenario since we are interested in understanding the emissions implications of the ambitious actions that a city can and is willing to take as a result of its climate action plan (CAP) specifically, rather than the implications of previous regulations (as would be the case for the E&P scenario). Figure 4A depicts the resulting CO2e trajectory for Scope 1 and 2 emissions (i.e., direct emissions generated within a city or emissions generated outside the city resulting from purchased electricity/energy) generated by the city of Buenos Aires. A wide variety of sectors contribute to the projected GHG reductions.
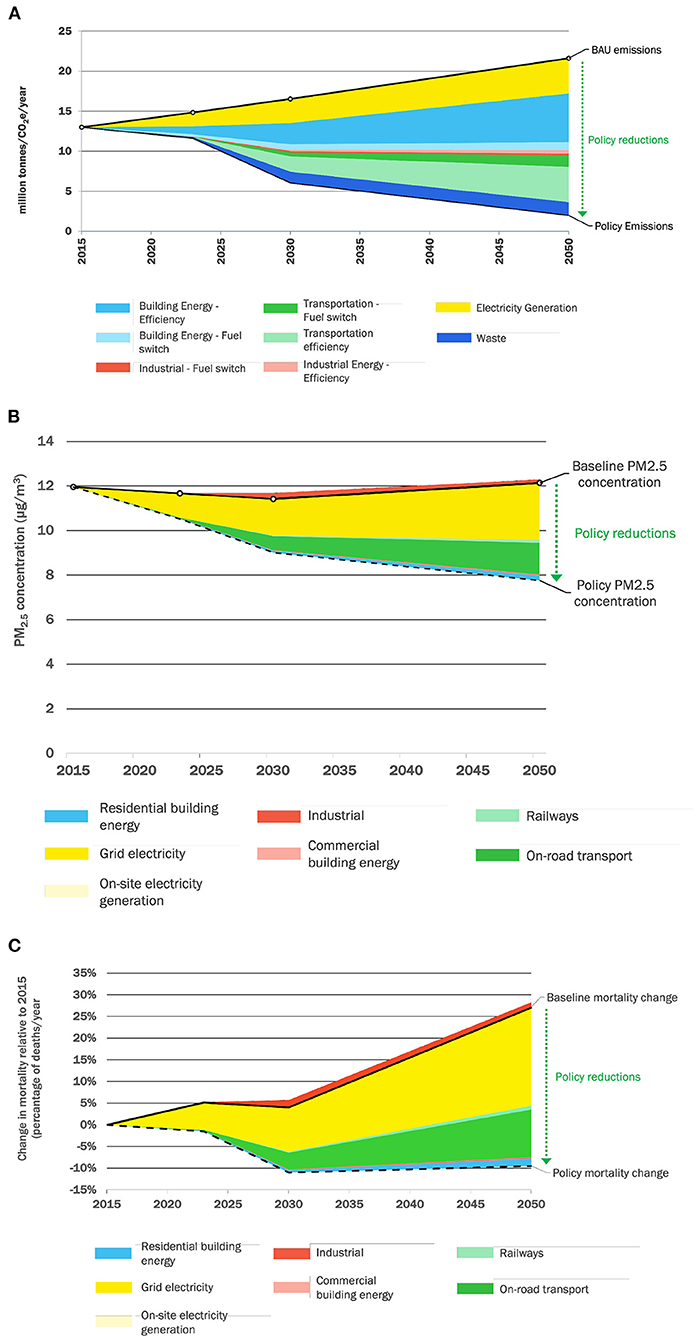
Figure 4. Estimated impacts for Buenos Aires under an “Ambitious” GHG reduction strategy, including (A) projected annual GHG emissions, (B) estimated change in annual average PM2.5, and (C) estimated percent change in PM2.5-attributable premature deaths per year. Mortality estimates for the city of Buenos Aires are based on local data provided by the Statistical Agency of the city of Buenos Aires.
Reductions in PM2.5 Concentrations and Associated Mortality From the GHG Scenarios
As a result of the policy actions represented in Figure 4A (the “Ambitious” scenario), we see in Figure 4B that reductions in associated co-pollutants contribute to a corresponding reduction (relative to the projected BAU) in PM2.5 pollution. PM2.5 concentrations attributable to “in-city” emission sources in Buenos Aires are estimated to decrease under the “Ambitious” scenarios by 1.2 μg/m3 (10% from projected baseline concentrations) in 2023, 2.4 μg/m3 (21%) in 2030, and 4.4 μg/m3 (36%) in 2050. These results show that in Buenos Aires there are significant levers within local control to substantially reduce PM2.5 through the city's “Ambitious” scenario options, but also that these levers are mostly within just two sectors (grid electricity and on-road transportation). Not surprisingly, as shown in Figure 4C, the reduction in PM2.5 also results in a reduction of attributable premature mortality (relative to the BAU), which is driven by the same emissions reductions in grid electricity and the on-road transportation sector.
Figure 5 provides another view of the projected change in PM2.5 under the “Ambitious” scenario. In this figure, the future projections of ambient concentrations are shown two ways for 2023, 2030, and 2050. The first column shows changes in the BAU scenario due to projected demographic and economic factors, as well as projected changes in the significant fraction of ambient PM2.5 that is not modeled (shown in gray), representing pollution that is transported from outside the city. The second set of columns show how sectoral reductions in the modeled portion of PM2.5 can result in significantly lower levels of ambient pollution (red dotted lines) relative to the BAU projections. Again, this figure shows that by fully implementing its “Ambitious” climate change mitigation scenario, Buenos Aires can improve AQ enough to meet the 2005 WHO ambient air quality guideline PM2.5 of 10 μg/m3 (interim target 4 in the 2021 guideline revision) by 2030, though not the revised guideline of 5 μg/m3. Annual average PM2.5 concentrations are projected—under BAU growth assumptions—to remain relatively steady overall, but with a significant shift by 2050 from regional/global contributions to a greater share of local contribution, which can be addressed through municipal policy action (lowering projected concentrations from 12.1 μg/m3 down to 7.6).
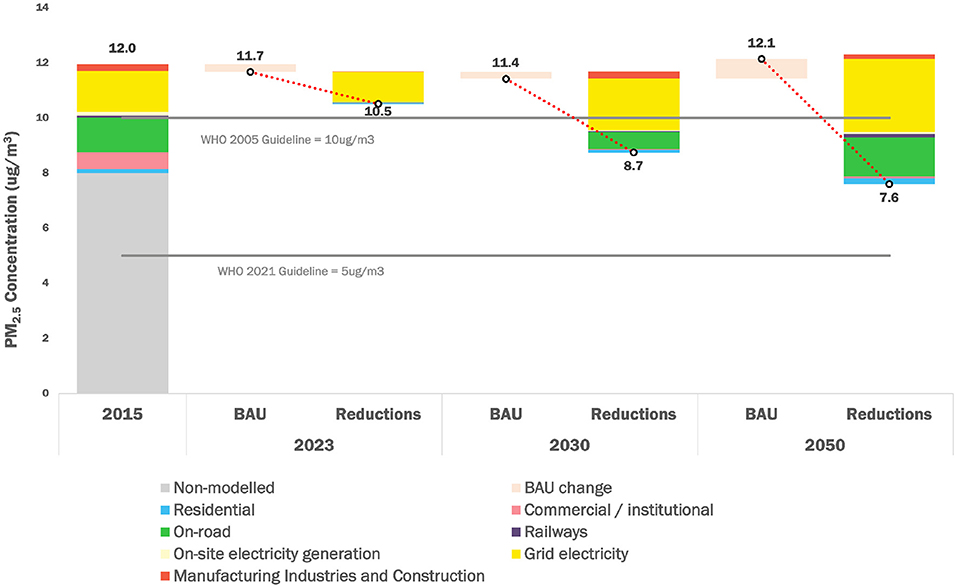
Figure 5. Changes in annual average PM2.5 concentrations in Buenos Aires for the three time horizons (2023, 2030, and 2050), comparing the BAU scenario with the “Ambitious” scenario. Peach-colored bars show how BAU concentrations are projected to change between periods based on global modeling (lower in 2023 and 2030, but rising by 2050). The Pathways-AQ model only captures 4 μg/m3 of the estimated 12 μg/m3 total concentration drawn from the Global Burden of Diseases (GBD) PM2.5 concentrations, matched to the city boundaries and population weighted for the base year of 2015, as the model includes only contributions from sources within the city (and none of the “outside city” contributions). The Pathways-AQ model also does not capture all emission sources in a city, such as natural sources, dust from the construction sector, emissions from barbecue grills, certain commercial processes, some forms of residential fuel use, and can often miss important sources of biomass incineration and burning (e.g., see lessons learned).
Prioritization of AQ, Climate, and Health Benefits
Figure 6 shows how Buenos Aires's climate benefits compare to the PM2.5-related health co-benefits for each GHG emission mitigation measure, allowing decision-makers to align climate action planning with municipal health and air quality priorities. Supplementary Table 6 provides additional detail on the specific measures that were assessed for Buenos Aires and are shown in Figure 6. The largest reductions in emissions of PM2.5 and precursor pollutants for 2050 are estimated to come from reducing emissions from the power grid, reducing the percentage of vehicles using gasoline and diesel oil, and increasing the percentage of vehicles using cleaner transportation fuels (i.e., 25% of the total passenger vehicle fleet using electricity, 15% using compressed natural gas). These same measures would also yield the greatest GHG reduction benefits, warranting stronger action than might be justified by either objective independently. Supplementary Figures 5, 6 show the contribution of these individual measures to PM2.5 reductions and averted premature mortality. Note that, in the case of industrial fuel-switching to biomass without proper end-of-pipe controls, an increase in associated premature mortality would be expected.
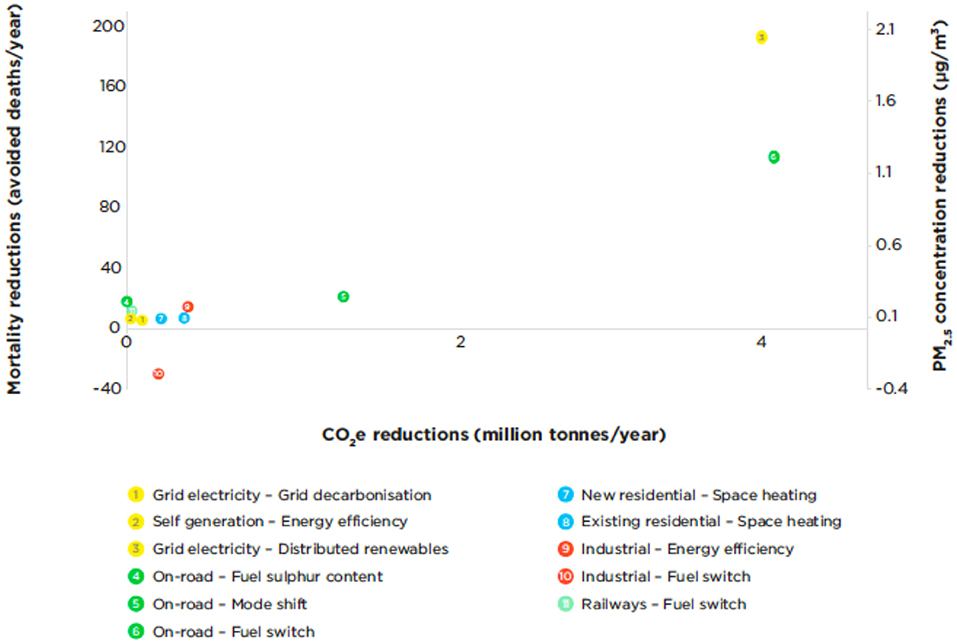
Figure 6. Estimated impacts of the Buenos Aires “Ambitious” Scenario on annual average PM2.5 concentration and the annual number of PM2.5-attributable premature deaths for 2050.
We integrated GHG and AQ planning in the six cities using the approach illustrated above through C40's CAP program (Figure 7). Results indicate that there are substantial local and immediate AQ-related health benefits to be gained by aggressive implementation of urban CAPs. However, results range widely across cities. For example, implementing the “Ambitious” scenario yielded between 59% (Lima) and 91% (Buenos Aires) reductions in CO2e and between 1% (Johannesburg) and 72% (Buenos Aires) reductions in PM2.5 by 2050. The emissions reductions led to an estimated 230 (Buenos Aires)—1,040 (Addis Ababa) premature deaths avoided each year by 2050 relative to a “BAU” scenario across the cities. These results suggest that individual city action planning does not lend itself to generalization; that conclusion is supported by Tessum et al. (2022).
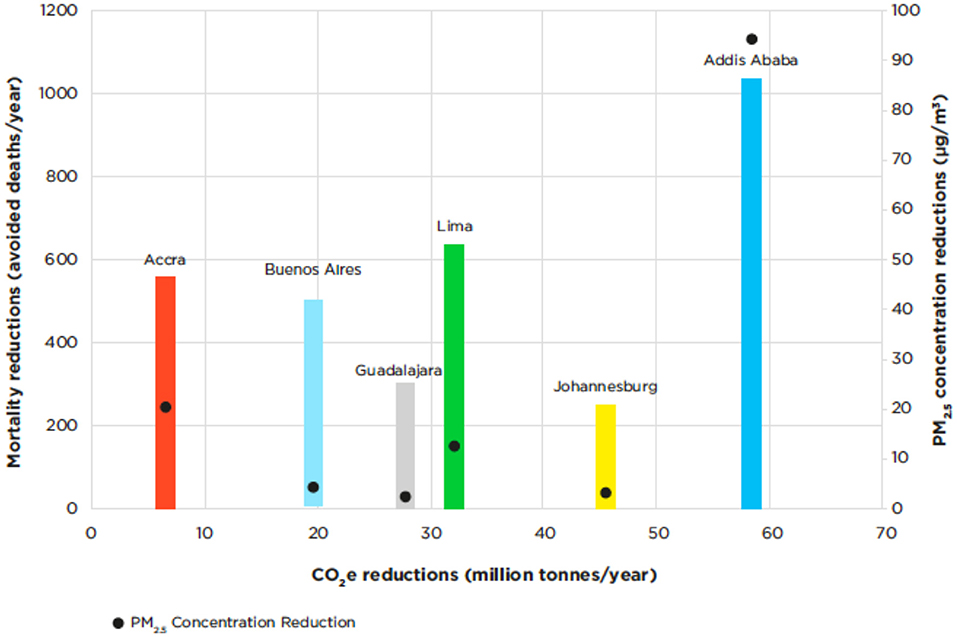
Figure 7. City-specific estimated reductions in GHG emissions (CO2e), annual average PM2.5, and PM2.5-attributable mortality, for a given city's “Ambitious” climate action scenario.
Discussion
The collaborative development and application of the Pathways-AQ framework by academics working with C40 and city partners in six cities provided proof-of-concept of the utility for complementing municipal climate action planning processes with quantitative information about air quality and health benefits. The updated Pathways-AQ framework represents an advance over the original Pathways framework; however, neither this tool, nor the original Pathways tool, explicitly addresses or estimates the economic costs of action. While cost is a critical consideration for city officials in prioritizing and justifying action, city-level costs vary so widely that it is difficult to develop a scoping-level and globally-applicable tool that provides meaningful cost assessments for typical air quality abatement options. Rather, municipal officials can use Pathways-AQ to identify the most impactful climate and air quality control strategies and then use external resources to create a more detailed cost assessment.
Lessons Learned for Municipal-Scale Planning
Here, we describe valuable lessons learned for replicating and scaling this process across other C40 cities and other cities around the world; namely, the importance of considering geographical scale, data integration (across both GHG and air pollutant emissions), local engagement, and engagement with health departments.
Decisions on Geographical Scale/Boundary Is Critical to Analysis Outcomes
Considering both “in-city” emissions and nearby “out-of-city” contributions to urban air pollution is essential, given that most major metropolitan areas produce only a fraction of the PM2.5 to which residents are exposed (Tessum et al., 2022); however, the “local” contribution can vary considerably, depending on the distribution of power plants, industrial sources, commercial sources, land use, land-types and other factors (Thunis et al., 2021). As the examples below demonstrate, striking the right balance at the city level can be challenging due to the variation in scales of data available, as well as the scale of other available analyses or reports, which do not always use the city limits as their boundary for data collection or analysis (e.g., airsheds, vehicle trip data in metro regions).
These findings point to the need for both local and regional coordination for AQ management and improvement. Whereas, individual cities can investigate and potentially reduce their share of GHG emissions, to make significant AQ improvements, both city- and regional-scale action is needed. GHG planning and action takes place in a global airshed. AQ work takes place primarily in a metro or regional airshed. Some GHG reduction strategies (e.g., transportation system improvements) rely on regional action, but urban CAPs do not tend to focus on those strategies. Focusing on AQ can emphasize the benefits of regional coordination. Thus, it is critical to select analysis boundaries and design action plans that are fit-for-purpose and strike an appropriate balance between local action (to reduce direct emissions) vs. engagement around regional emission reduction planning (including a focus on “leading by example”), as described in the Johannesburg example below.
Metropolitan Area of Guadalajara
For Guadalajara, C40's CAP process and CAP-AQ analysis were carried out at a larger metropolitan scale. This larger scale enabled a comprehensive understanding of the majority of sources contributing to local emissions; but also made it difficult to compare metropolitan-level findings with city-scale statistics and studies. For instance, it was difficult to precisely estimate wood fuel consumption levels, as rural and urban areas within the metropolitan area use different amounts of wood fuel per capita. Some of the studies conducted within a larger area (at the state level) indicated a higher amount of wood fuel used (Tatem, 2017; López-Murillo, 2019), as compared to consumption estimates from an integrated inventory that was created for the metropolitan region. Similarly, most of the studies related to brick factories (ladrilleras, which are widely-recognized as a large contributor to local air pollution) were conducted at the state level, and it was difficult to align the state-level data with the metropolitan-level integrated inventory.
Accra
In contrast, C40's CAP process and CAP-AQ analysis in Accra and most other cities were carried out using the city limits as the analysis boundary (i.e., the jurisdiction of the Accra Metropolitan Assembly). The current local air quality management plan, however, was developed for the larger Greater Accra Metropolitan Area (GAMA), of which Accra Metropolitan Assembly is a part. This focus on GAMA is consistent with a number of other air quality studies that have been carried out for the region. The CAP-AQ analysis for Accra showed large non-modeled PM2.5 concentrations for both the base year and future time horizons in the “BAU” scenario, when compared with the portion of concentrations that was modeled in Pathways-AQ. This larger non-modeled portion represents sectors not included in the city's GHG inventory (for example, smaller industrial sources of emissions within the city's boundary that have not been accounted for), sources located outside the city that influence city air quality (such as the large-scale industrial activity taking place in nearby Tema, outside the city's boundaries but within GAMA), and regional “natural” sources such as dust. While the boundary definition decision is made by city staff, choosing a smaller geographical area usually results in a smaller fraction of fine particle mass that is modeled and makes it challenging to track all activity that contributes to air pollution in the analysis.
Johannesburg
The analysis for the City of Johannesburg shows that, while grid decarbonization will be very effective at reducing the city's carbon emissions (scope 2 emissions), it may have modest benefits for reducing PM2.5 within the city (though importantly it has benefits for regional air quality). This is because the grid electricity air pollution reductions modeled using Pathways-AQ only account for the reductions in associated pollutants (from power generation) that affect the city's PM2.5 within its boundaries. There will be benefits from wider regional PM2.5 reductions, associated with grid electricity pollution reductions, but those are not quantified through this process. The majority of the city's electricity is generated at coal-fired power stations outside of the city's municipal boundaries, as is the case in Accra as well. Approximately half of Johannesburg's PM2.5 air pollution originates outside the city boundaries (Tessum et al., 2022). Working at the airshed level will therefore create new opportunities for coordinated climate change mitigation and air quality management. By facilitating joint data collection and peer learning, a multi-city approach to air quality management can also strengthen the capacity of adjacent cities to identify air pollution sources and improve current mitigation actions. The analysis in Johannesburg revealed that strong regional action is needed to improve air quality for the entire region.
Data Integration Is Needed Across Climate Action and Air Quality Management Processes
Globally applicable, pre-populated tools (such as those employed here) address a problem that is all too common in low- and middle-income contexts: a general “lack of data.” Local officials may be hesitant to use pre-populated tools and to publicize results that are based on global datasets in the absence of their own (i.e., locally-derived) quality-assured emissions data. Early integration of GHG and AQ inventory work, before and during the process of local validation, can avoid errors, increase buy-in, and benefit work on both climate change mitigation and AQ management; while decreasing staff time required.
AQ-oriented analysis of city-scale GHG emission inventories can reveal under- or over-estimation of sectoral activity (fuel use) that may have gone unnoticed in the GHG inventory creation process. Applying AQ emission factors to GHG inventory-derived fuel use, and then comparing the result to other sources of data (e.g., AQ observations, satellite data or local-level activity data) can reveal areas of misalignment. Some sources are not as relevant for GHG emissions as they are for AQ emissions (e.g., brake and tire wear from vehicles, or the specific type of stove used for cooking with solid fuels). Also, some sectors are more relevant for AQ and may not have been considered in a GHG inventory (e.g., biogenic emission sources of VOC or the industrial sources in the Guadalajara example below). GHG inventory development often tends to use empirical consumption/production level activity data (e.g., barrels of oil, tons of coal). This metric often differs from that used in AQ inventory development, which typically favors bottom-up activity modeling (e.g., No. of persons traveling × distance per day per vehicle mode × fuel efficiency by mode or # of coal stoves × hours/day of stove use × stove efficiency) and can result in higher accuracy.
An integrated inventory needs to account for these mismatches. The proper methods for alignment depend in part on what types of starting inventories are available. For example, GPC-compliant inventories require significant review and re-categorization of some activity data (e.g., See charcoal rotisseries in the Lima example below or residential and industrial fuel wood in the Addis Ababa example) to enable alignment within Pathways-AQ scenario modeling. These steps to compare GHG inventories against AQ inventories, modeling and observations not only evaluate and ground-truth the GHG inventories in a way that is not possible using standard methodologies alone, but also can improve GHG tracking of mitigation progress using AQ data as one indicator of common sources of emissions.
Addis Ababa
Use of both GPC activity data and external air quality-related studies revealed data inconsistencies in Addis Ababa's fuelwood use. After reviewing literature and various city documents in Addis Ababa, as well as the city's GHG emissions data, C40 and city staff discovered some inconsistencies in the baseline fuelwood use estimates. When C40 converted fuelwood activity data from Addis Ababa's GPC inventory into PM2.5, using Pathways-AQ, it became apparent that wood use had been overestimated due to methodological errors in Addis' GPC inventory. Residential fuelwood use in Addis Ababa's GPC inventory equated to primary energy consumption that was 14 times higher than primary energy consumed in the form of electricity. When used to calculate air pollution concentrations in Pathways-AQ, the amount of residential fuelwood used in the base year (2016), as represented in the GPC inventory, alone produced a PM2.5 concentration of >40 μg/m3, which was more than the total measured average concentration in the city (33 μg/m3). Asfaw and Demissie (2012) estimated that the energy content in residential fuelwood use was five times higher than that in electricity used by households. In this study, estimated electricity use was similar to that in Addis Ababa's GPC inventory. Based on these findings, residential fuelwood use was scaled down, in the Pathways AQ model, so that its energy content was five times higher than the energy content of electricity use in the GPC inventory, matching the Asfaw and Demissie (2012) study. In Addis Ababa's GPC inventory, fuelwood use in the commercial and industrial sectors were calculated from residential fuelwood use. As a result, these activity data were also scaled down in accordance with the scaling done for residential fuelwood use.
Guadalajara
In Guadalajara, use of an integrated GHG and air pollutant inventory, alongside the city's GPC inventory, allowed C40 and city staff to discover specific sources of air pollution that had not previously been accounted for in the climate action planning process. An integrated GHG and air pollutant inventory was developed for the Metropolitan Region of Guadalajara by the World Resources Institute (WRI) along with the Metropolitan Institute of Planning of the Metropolitan Area of Guadalajara (IMEPLAN). It was used during the CAP-AQ analysis for comparative purposes. Smaller industrial and residential sources, such as solvents or handling and distribution of LPG, which taken individually did not account for much of the emissions, were together found to have a significant influence on air quality. However, as they were not included in the city's 2016 GPC inventory, they were not included in the Pathways-AQ modeling and therefore, not accounted for in the CAP-AQ analysis; instead, they were presented as non-modeled sources of emission.
Lima
When C40 staff reviewed the Province of Lima's 2019 Air Quality Diagnosis Report, they found that important source of PM2.5, accounting for 16% of total concentrations in the city, had not been included in Lima's GPC inventory: charcoal combustion in commercial rotisseries. The addition of this sector to Pathways-AQ resulted in an additional 1.1 μg/m3 in modeled city-wide annual average ambient PM2.5. Other industrial sources were not reflected in the GPC inventory, including zinc and copper refineries, cement production, fish flour and oil refineries. Together, these sources accounted for an additional 14.1 μg/m3 of ambient PM2.5 in the city, which was not initially reflected when using the GPC inventory alone. There is a possible risk of double counting if some of the emissions from the Diagnosis Report were included in other categories of fuel combustion in the GPC inventory. Careful review of all local data is needed.
Local Engagement Is Critical for Reliable Local Emissions Estimates
It is critical to clearly define a process for achieving multi-level (local, national, regional, etc.) and multi-sector (environment, transport, industry, etc.) engagement at the beginning of the process. With systematic cross-level and cross-sectoral engagement, cities can establish a shared understanding of the multiple benefits of integration; agree on data inputs and tools; design processes for policy prioritization; and avoid the tendency to see some benefit categories as competing with others. The role of C40—with engaged “on the ground” staff in/near local offices—was critical in bridging the gap between development of modeling tools and real-world application of the tools in a format that is useful and understandable to non-technical municipal staff charged with developing and justifying municipal plans.
Johannesburg
After preliminary Pathways-AQ analysis, C40 identified several important air pollution emission sources that had not been well-represented in Johannesburg's GHG inventory. These sources included residential solid fuel combustion, waste burning, and mine tailings (a source of local dust). The city highlighted that open waste burning is an important source that needs to be considered from the AQ perspective. This was not included in the city's GPC inventory and, as such, data had to be collected from the city to include in the analysis. This data was difficult to come by, as informal activities are seldom tracked, but the city was able to provide valuable information that served as a basis for estimation. After focusing on the sources that seemed to be underrepresented or missing in the GHG inventory, C40 updated/improved the estimates through a combination of literature searches and meetings with city and regional officials, as well as research institutions. As a result of these meetings, for example, the quantity of waste in the city was updated using census data for 2011 and Community Survey data for 2016 on population and refuse disposal statistics, which were obtained from Statistics SA. The CAP-AQ discussions had the benefit of helping Johannesburg identify collaborators within the city and assign ownership to related CAP actions. This collaboration is helpful in cases of budget limitation, as the planned actions are now owned by various departments and form part of their respective business plans.
Guadalajara
In the Metropolitan Region of Guadalajara, brick kilns (ladrilleras) are widespread. As the process is artisanal and informal, emissions from this sector are not well-accounted for in the GPC inventory but are likely to have a negative impact on air quality because of their ubiquity and their use of biomass, wood fuel, waste oils, textiles, tires, and plastics fuels. Some local studies have been carried out, but data is scarce. The development of an integrated inventory by WRI and IMEPLAN enabled C40 to consider these air pollution sources in the CAP-AQ analysis even though they were not well-represented in the city's GPC inventory. C40's analysis raised the visibility of this issue and underscored the necessity of specific, accurate local data. In total, only 27% of the total PM10 and 32% of the total PM2.5 were included in Pathways-AQ based on the GPC inventory alone, if considering all the sources that were excluded from the GPC inventory but were included in the integrated inventory.
To identify air pollution sources that were not accounted for in the region's GPC inventory, C40 convened meetings with technical staff from IMEPLAN, the local metropolitan agency that spearheaded the creation of the CAP. C40 also met with other agencies and organizations working on air quality in the region, including WRI, which developed the integrated air quality and greenhouse gas emissions inventory. Notably, state-level air quality officials were also invited to attend these meetings, providing context for air quality work happening at the state level with their program, Jalisco Respira. Through these meetings, C40 staff were able to learn more about the related work being done by IMEPLAN and SEMADET [Secretaría de Medio Ambiente y Desarrollo Territorial (SEMADET), 2020], as well as their motivations and interests for integrating air quality into their CAP. They also provided helpful feedback on data queries, improving the Pathways-AQ analysis that would eventually be considered for integration into a second version of the CAP.
Accra
It is challenging to find and access data for the Accra Metropolitan Assembly area due to a complicated reporting structure between municipal and national levels of government. Data are collected by national level authorities, like the EPA, by law, and there is currently no intermediate or local level data collection. As such, national level approval is required for the sharing and use of reliable local data even though the EPA has been collecting and analyzing data since 2005.
Sensitivity Around Health Data Argues for Engagement With Health Departments
It is often challenging to acquire local health data, and in many cases, proxy data were needed for these analyses. While local health data are generally lacking, requesting a specific format upfront (e.g., ICD-10 codes), may yield success where such data are available. Engaging with and improving communication with public health staff throughout the process strengthens ties between different government departments and builds the infrastructure for deeper collaboration on climate change, air quality and health work moving forward.
The overall lack of local health data further complicates analysis because municipalities without experience in risk communication and public health awareness can have initial hesitancy to share air pollution-related health impacts publicly without a plan to address those impacts or to increase access to healthcare. Examples below highlight that local officials can be sensitive to releasing health information to the public in cases where the environment department does not feel comfortable releasing health information without buy-in from health colleagues or where using national level data and local data may give very different results.
Additionally, our approach excludes non-PM2.5 health co-benefits, including those related to NO2, which is associated with, e.g., pediatric asthma incidence (Khreis et al., 2017; Achakulwisut et al., 2019); ozone, which is associated with, e.g., respiratory disease (GBD 2019 Risk Factor Collaborators, 2020); physical activity; noise; and access to green space. Many GHG-reduction strategies would create multiple non-PM2.5 health benefits; our omission of those co-benefits results in us under-estimating the true health benefits. In addition, we were not able to incorporate the health benefits from reduced CO2. CO2 impacts health through a variety of pathways, including heat exposure, extreme weather events, wildfire smoke, dust storms, ozone pollution, aeroallergens, water- and vector-borne disease, and nutritional effects, among others (Smith et al., 2014; Romanello et al., 2021). While some studies have quantified health damages from CO2 emissions for a particular country or region (e.g., Hutton and Menne, 2014; Rohat et al., 2018; Martinich and Crimmins, 2019) or through a particular exposure pathway (e.g., Silva et al., 2013; Cromar et al., 2022), currently no robust approach exists for estimating the overall global health damages of each ton of CO2 emissions (Scovronick et al., 2019; Cromar et al., 2021). A small number of articles look at local impacts from local GHG concentrations, e.g., Jacobson (2010) and Jacobson et al. (2019).
Johannesburg
City staff were skeptical about allowing mortality projections from Pathways-AQ to be seen by higher authorities. They preferred to have the mortality projections presented as percentages and not in absolute numbers. The city required specific statements in the analysis to indicate that estimated percentages were projections from the Pathways-AQ scoping level tool. This reflects local government trepidation to mention health implications of air pollution–either current conditions or future projections–and presents an opportunity to create stronger relationships with local health ministries to ensure buy-in around air pollution and health analyses.
Buenos Aires
Concerns regarding the sharing of health results emerged from the environment department rather than the health department. Part of the sensitivity around health results emerged because national-level health data were more readily available than city-level health data, and thus were used in initial iterations of Pathways-AQ analyses for the city. Results based on national-level data were seen as a potentially inaccurate representation of real-world conditions within the city. After further collaboration with city staff, C40 accessed and analyzed local health data, collected at the city level. This data was used in place of the original national-level mortality data, and the subsequent analysis provided the opportunity to verify that local disease rates and underlying health factors within a city can differ significantly from national averages. Getting access to local health data is a particularly valuable step in the CAP-AQ integration process, because it both strengthens health estimates and builds confidence within city staff about using CAP-AQ health findings.
Conclusion
Our new integrated climate, AQ, and health framework and Pathways-AQ tool represent an advance beyond the present common approach–wherein urban climate action planning and AQ planning are largely separated. Integrating climate action planning, AQ management planning, and health considerations can save city staff time, increase stakeholder and municipal government buy-in, result in better data coordination and cohesiveness, and—most importantly—reveal the emission reduction strategies that have the greatest potential to benefit climate action, air quality, and public health.
The approach described here has limitations. First, our approach does not include non-PM2.5 health co-benefits (see Section Sensitivity Around Health Data Argues for Engagement With Health Departments for Specific Examples). Future efforts could usefully address these gaps to provide a more comprehensive accounting of the societal benefits of implementing CAPs. Second, our method provides only steady-state annual-average PM2.5 concentrations and linearized relationships between PM2.5 precursors and PM2.5 concentrations. Addressing this aspect (i.e., accounting for non-linearities in atmospheric chemistry) would require computational resources beyond what was available to this project. We specifically designed Pathways-AQ to be a screening-level tool; it can be used to narrow the policies and mitigation pathways that are analyzed in greater depth using tools that incorporate full chemistry and transport. Third, results are dependent on robust information about emissions. However, those inputs are often highly uncertain at the city scale.
Unique aspects of the new Pathways-AQ model include that it is specifically designed for city-scale use; it integrates climate change, AQ, and health considerations and provides quantitative findings; and it does not require much technical expertise to operate. Several other AQ and climate mitigation decision-support tools are available (e.g., Urban LEAP-IBC, BenMAP, AirQ+, GAINS-City, etc.), but were developed for different policy contexts or require more technical expertise, computational time, and/or data to operate (Anenberg et al., 2016). The new tool employed here fills a key gap, especially for cities that may wish to integrate their climate and AQ planning but lack substantial resources for full-scale modeling of emissions, concentrations, and health impacts (though confidence in the outputs is strongly associated with the robustness of the input data).
Pathways-AQ is currently available for immediate use in ~40 C40 cities. The potential for scaling up to more cities depends on the global availability of detailed municipal-scale activity datasets to complement IIASA's global dataset of emission factors, InMAP's global computationally efficient development of PM2.5 sensitivities, and high spatial resolution exposure estimates. Two barriers to scaling this work are (1) the ability to develop or find existing accurate, local inventory data, and (2) the need for municipal officials to have the time and resources available to apply these tools to their climate and air pollution challenges, including the significant data validation and verification processes required to produce meaningful results.
This work demonstrates the benefits and challenges of integrating quantitative air quality and health findings into city-level climate action planning, within the framework of a partnership between academic researchers, city officials, and a boundary organization spanning research and policy. We hope this effort serves as a model for future integration of air quality management and climate action planning, to guide and maximize the efficacy of emission reductions within cities, nationally, and internationally.
Data Availability Statement
All original contributions developed for the study are included here or within the Supplementary Material. Further inquiries can be directed to the corresponding authors.
Author Contributions
GK, SA, and ZC led the work of drafting this manuscript. AK helped to draft the methods section. SN, NP, and AB worked with city officials (including DC, MM, and AR) to understand unique challenges in each city and develop inputs for analysis. TC and CT conducted the Pathways-AQ modeling including the integration of inputs from CWT, JM, DH, SA, and PK. All authors have given approval to the final version of the manuscript, and contributed equally to the development and implementation of the integrated planning process that is the subject of the paper. All authors contributed to the article and approved the submitted version.
Funding
This work was supported by Clean Air Fund (grant #190401A) to C40 Cities and Wellcome Trust grant (#216075-Z-19-Z) to George Washington University.
Conflict of Interest
GK is a principal at Orbis Air LLC.
The remaining authors declare that the research was conducted in the absence of any commercial or financial relationships that could be construed as a potential conflict of interest.
Publisher's Note
All claims expressed in this article are solely those of the authors and do not necessarily represent those of their affiliated organizations, or those of the publisher, the editors and the reviewers. Any product that may be evaluated in this article, or claim that may be made by its manufacturer, is not guaranteed or endorsed by the publisher.
Acknowledgments
We acknowledge the following individuals for their contributions to this work: Sharen Alvis (Metropolitan Municipality of Lima), Emmanuel Appoh (Ghana EPA), Rafael Arku (University of Massachusetts, Amherst), Beatriz Cardenas (World Resources Institute), María Inés de Casas (APRA, City of Buenos Aires), Michael Doust (C40), Daniel Essel (Ministry of Transport, Ghana), Martina Ferrarino (C40), Federico García (Buenos Aires), Anderson Huayna (Metropolitan Municipality of Lima), Fantu Kifle (Addis Ababa), Ingrid Krahn (Buenos Aires), Tania López (World Resources Institute), Lebo Molefe (City of Johannesburg), Mary Oshinyo (Ghana Health Service), Diana Porlles (Metropolitan Municipality of Lima), Nadia Shah (C40), Carolina Theler (City of Buenos Aires), Rabelani Tshikalanke (City of Johannesburg), Carlos Vázquez Castañeda (C40), and Paola Vela (Metropolitan Municipality of Lima).
Supplementary Material
The Supplementary Material for this article can be found online at: https://www.frontiersin.org/articles/10.3389/frsc.2022.934672/full#supplementary-material
References
Achakulwisut, P., Brauer, M., Hystad, P., and Anenberg, S. C. (2019). Global, national, and urban burdens of pediatric asthma incidence attributable to ambient NO2 pollution. Lancet Planet. Health 3, e166–e178. doi: 10.1016/S2542-5196(19)30046-4
Akbar, S., Kleiman, G., Menon, S., and Segafredo, L. (2014). Climate-Smart Development: Adding Up the Benefits of Actions That Help Build Prosperity, End Poverty and Combat Climate Change: Main Report (English). Washington, DC: World Bank Group. Available online at: http://documents.worldbank.org/curated/en/794281468155721244/Main-report
Amann, M., Bertok, I., Borken-Kleefeld, J., Cofala, J., Heyes, C., Höglund-Isaksson, L., et al. (2011). Cost-effective control of air quality and greenhouse gases in Europe: modeling and policy applications. Environ. Model. Softw. 26, 1489–1501. doi: 10.1016/j.envsoft.2011.07.012
Anenberg, S. C., Achakuwisut, P., Brauer, M., Moran, D., Apte, J. S., and Henze, D. K. (2019). Particulate matter-attributable mortality and relationships with carbon dioxide in 250 urban areas worldwide. Sci. Rep. 9:11552. doi: 10.1038/s41598-019-48057-9
Anenberg, S. C., Belova, A., Brandt, J., Fann, N., Greco, S., Guttikunda, S., et al. (2016). Survey of ambient air pollution health risk assessment tools. Risk Anal. 36, 1718–1736. doi: 10.1111/risa.12540
Asfaw, A., and Demissie, Y. (2012). Sustainable household energy for Addis Ababa, Ethiopia. Consilience 8, 1–11. doi: 10.7916/D86W99RV
C40 (2020a). C40 Deadline 2020 Blueprint for Climate Action. New York, NY: C40 Cities Leadership Group. Available online at: https://www.c40.org/other/deadline_2020
C40 (2020b). Climate Action Planning Framework. New York, NY: C40 Cities Leadership Group. Available online at: https://resourcecentre.c40.org/climate-action-planning-framework-home
C40 (2022). C40 Knowledge Hub. New York, NY: C40 Cities Leadership Group. Available online at: https://www.c40knowledgehub.org/s/article/Pathways-Air-Quality-Pathways-AQ?language=en_US
Castillo, M. D., Kinney, P. L., Southerland, V., Arno, A., Crawford, K., van Donkelaar, A., et al. (2021). Estimating intra-urban inequities in PM2.5-attributable health impacts: a case study for Washington, D.C. GeoHealth 5:e2021GH000431. doi: 10.1002/essoar.10506837.1
Cromar, K., Howard, P., Vásquez, V. N., and Anthoff, D. (2021). Health impacts of climate change as contained in economic models estimating the social cost of carbon dioxide. Geohealth 5:e2021GH000405. doi: 10.1029/2021GH000405
Cromar, K. R., Anenberg, S. C., Balmes, J. R., Fawcett, A. A., Ghazipura, M., and Gohlke, J. M. (2022). Global health impacts for economic models of climate change: a systematic review and meta-analysis. Ann. Am. Thorac. Soc. doi: 10.1513/AnnalsATS.202110-1193OC [Epub ahead of print].
EMEP/EEA (2019). EMEP/EEA Air Pollutant Emission Inventory Guidebook 2019: Technical Guidance to Prepare National Emission Inventories. EEA Report No 13/2019, European Modeling and Evaluation Programme of the European Environment Agency. Luxembourg: Publications Office of the European Union. Available online at: https://www.eea.europa.eu/publications/emep-eea-guidebook-2019
Fiore, A. M., Naik, N., and Leibensperger, E. M. (2015). Air quality and climate connections. J. Air Waste Manage. Assoc. 65, 645–685. doi: 10.1080/10962247.2015.1040526
GAHP (2020). “Air pollution interventions: seeking the intersection between climate and health,” in Global Alliance on Health and Pollution, eds D. Hanrahan, R. Fuller, J. Redwood, R. Poveda, and F. Murray (New York, NY: GAHP), 10115.
GBD 2019 Risk Factor Collaborators (2020). Global burden of 87 risk factors in 204 countries and territories, 1990-2019: a systematic analysis for the Global Burden of Disease Study 2019. Lancet 396, 1223–1249. doi: 10.1016/S0140-6736(20)30752-2
GHG Protocol (2014). Global Protocol for Community-Scale Greenhouse Gas Emission Inventories: An Accounting and Reporting Standard for Cities, GHG Protocol. Washington, DC: GHG Protocol. Available online at: https://ghgprotocol.org/greenhouse-gas-protocol-accounting-reporting-standard-cities
Heaps, C. G (2020). Low Emissions Analysis Platform (LEAP). [Software Version: 2020.0.12]. Somerville, MA: Stockholm Environment Institute. Available online at: https://www.energycommunity.org
Henze, D. K., Hakami, A., and Seinfeld, J. H. (2007). Development of the adjoint of GEOS-Chem. Atmos. Chem. Phys. 7, 2413–2433. doi: 10.5194/acp-7-2413-2007
Heo, J., Adams, P. J., and Gao, H. O. (2016). Reduced-form modeling of public health impacts of inorganic PM2.5 and precursor emissions. Atmos. Environ. 137, 80–89,. doi: 10.1016/j.atmosenv.2016.04.026
Hoesly, R. M., Smith, S. J., Feng, L., Klimont, Z., Janssens-Maenhout, G., Pitkanen, T., et al. (2018). Historical (1750-2014) anthropogenic emissions of reactive gases and aerosols from the Community Emissions Data System (CEDS). Geosci. Model Dev. 11, 369–408. doi: 10.5194/gmd-11-369-2018
Hutton, G., and Menne, B. (2014). Economic evidence on the health impacts of climate change in Europe. Environ. Health Insights. 8, 43–52. doi: 10.4137/EHI.S16486
Jacobson, M. Z (2010). Enhancement of local air pollution by urban CO2 domes. Environ. Sci. Technol. 44, 2497–2502. doi: 10.1021/es903018m
Jacobson, T. A., Kler, J. S., Hernke, M. T., Braun, R. K., Meyer, K. C., and Funk, W. E. (2019). Direct human health risks of increased atmospheric carbon dioxide. Nat. Sustain. 2, 691–701. doi: 10.1038/s41893-019-0323-1
Khreis, H., Kelly, C., Tate, J., Parslow, R., Lucas, K., and Nieuwenhuijsen, M. (2017). Exposure to traffic-related air pollution and risk of development of childhood asthma: a systematic review and meta-analysis. Environ. Int. 100, 1–31. doi: 10.1016/j.envint.2016.11.012
Klimont, Z., Kupiainen, K., Heyes, C., Purohit, P., Cofala, J., Rafaj, P., et al. (2017). Global anthropogenic emissions of particulate matter including black carbon. Atmos. Chem. Phys. 17, 8681–8723. doi: 10.5194/acp-17-8681-2017
Kuylenstierna, J. C. I., Heaps, C.G, Ahmed, T., Vallack, H. W., Hicks, W. K., et al. (2020). Development of the low emissions analysis platform - integrated benefits calculator (LEAP- IBC) tool to assess air quality and climate co-benefits: application for Bangladesh. Environ. Int. 145:106155. doi: 10.1016/j.envint.2020.106155
López-Murillo, E (2019). Atención al Sector Ladrillero. Taller Hallazgos Científicos en Contaminación Atmosférica y sus Implicaciones en la política pública de Jalisco. Guadalajara: WRIMéxico- IMEPLAN-SEMADE.
Loughlin, D. H., Benjey, W. G., and Nolte, C. G. (2011). ESP v1.0: methodology for exploring emission impacts of future scenarios in the United States. Geosci. Model Dev. 4, 287–297. doi: 10.5194/gmd-4-287-2011
Martinich, J., and Crimmins, A. (2019). Climate damages and adaptation potential across diverse sectors of the United States. Nat. Clim. Change 9, 397–404. doi: 10.1038/s41558-019-0444-6
McDuffie, E., Martin, R., Yin, H., and Brauer, M. (2021). Global Burden of Disease From Major Air Pollution Sources (GBD MAPS): A Global Approach. Research Report 210. Boston, MA: Health Effects Institute.
Muller, N. Z (2014). Boosting GDP growth by accounting for the environment. Science 345, 873–874. doi: 10.1126/science.1253506
Nemet, G. F., Holloway, T., and Meier, P. (2010). Implications of incorporating air-quality co-benefits into climate change policymaking. Environ. Res. Lett. 5:014007. doi: 10.1088/1748-9326/5/1/014007
Ravishankara, A. R., Dawson, J. P., and Winner, D. A. (2012). New directions: adapting air quality management to climate change: a must for planning. Atmos. Environ. 50, 387–389. doi: 10.1016/j.atmosenv.2011.12.048
Rohat, G., Flacke, J., Dosio, A., Pedde, S., Dao, H., and van Maarseveen, M. (2018). “Influence of changes in socioeconomic and climatic conditions on future heat-related health impacts in Europe,” in 5th International Climate Change Adaptation Conference (Cape Town). Available online at: https://archive-ouverte.unige.ch/unige:105838
Romanello, M., McGushin, A., Di Napoli, C., Drummond, P., Hughes, N., Jamart, L., et al. (2021). The 2021 report of the Lancet Countdown on health and climate change: code red for a healthy future. Lancet 398, 1619–1662. doi: 10.1016/S0140-6736(21)01787-6
Schmale, J., van Aardenne, J., and von Schneidemesser, E. (2014). New directions: support for integrated decision-making in air and climate policies-Development of a metrics-based information portal. Atmos. Environ. 90, 146–148. doi: 10.1016/j.atmosenv.2014.03.016
Scovronick, N., Vasquez, V. N., Errickson, F., Dennig, F., Gasparrini, A., Hajat, S., et al. (2019). Human health and the social cost of carbon. Epidemiology 30, 642–647. doi: 10.1097/EDE.0000000000001057
Secretaría de Medio Ambiente y Desarrollo Territorial (SEMADET) (2020). Inventario de Emisiones Año Base 2016.
Silva, R. A., West, J. J., Zhang, Y., Anenberg, S. C., Lamarque, J.-F., Shindell, D. T., et al. (2013). Global premature mortality due to anthropogenic outdoor air pollution and the contribution of past climate change. Environ. Res. Lett. 8:034005. doi: 10.1088/1748-9326/8/3/034005
Smith, K. R., Woodward, A., Campbell-Lendrum, D., Chadee, D. D., Honda, Y., Liu, Q., et al. (2014). “Human health: impacts, adaptation, and co-benefits,” in Climate Change 2014: Impacts, Adaptation, and Vulnerability. Part A: Global and Sectoral Aspects. Contribution of Working Group II to the Fifth Assessment Report of the Intergovernmental Panel on Climate Change, eds C. B. Field, V. R. Barros, D. J. Dokken, K. J. Mach, M. D. Mastrandrea, T. E. Bilir, M. Chatterjee, K. Ebi, Y. O. Estrada, R. C. Genova, B. Girma, E. S. Kissel, A. N. Levy, S. MacCracken, P. R. Mastrandrea, and L. L. White (Cambridge, UK; New York, NY: Cambridge University Press), 709–754.
Southerland, V. A., Brauer, A., Mohegh, A., Hammer, M. S., van Donkelaar, A., Martin, R. V., et al. (2022). Global urban temporal trends in fine particulate matter (PM2.5) and attributable health burdens: estimates from global dataset. Lancet Planet. Health. 6, e139–e146. doi: 10.1016/S2542-5196(21)00350-8
Tatem, A. J (2017). WorldPop, open data for spatial demography. Sci. Data 4:170004. doi: 10.1038/sdata.2017.4
Tessum, C. W., Hill, J. D., and Marshall, J. D. (2017). InMAP: a model for air pollution interventions. PLoS ONE 12:e176131. doi: 10.1371/journal.pone.0176131
Tessum, M. W., Anenberg, S. C., Chafe, Z. A., Henze, D. K., Kleiman, G., Kheirbek, I., et al. (2022). Sources of ambient PM2.5 exposure in 96 global cities. Atmosph. Environ. 286:119234, doi: 10.1016/j.atmosenv.2022.119234
Thakrar, S. K., Tessum, C. W., Apte, J. S., Balasubramanian, S., Millet, D. B., Pandis, S. N., et al. (2022). Global, high-resolution, reduced-complexity air quality modeling for PM2.5 using InMAP (Intervention Model for Air Pollution). PLoS ONE. 17, e0268714. doi: 10.1371/journal.pone.0268714
Thunis, P., Clappier, A., de Meij, A., Pisoni, E., Bessagnet, B., and Tarrason, L. (2021). Why is the city's responsibility for its air pollution often underestimated? A focus on PM2.5. Atmos. Chem. Phys. 21, 18195–18212. doi: 10.5194/acp-21-18195-2021
Tong, D., Zhang, Q., Davis, S. J., Liu, F., Zheng, B., Geng, G., et al. (2018). Targeted emission reductions from global super-polluting power plant units. Nat. Sustain. 1:59. doi: 10.1038/s41893-017-0003-y
USEPA (2015). Environmental Benefits Mapping and Analysis Program - Community Edition (BenMAP-CE) Version 1.1. Research Triangle Park, NC: U.S. Environmental Protection Agency. Available online at: http://www2.epa.gov/benmap/
Van Dingenen, R., Dentener, F., Crippa, M., Leitao, J., Marmer, E., Rao, S., et al. (2018). TM5-FASST: a global atmospheric source-receptor model for rapid impact analysis of emission changes on air quality and short-lived climate pollutants. Atmos. Chem. Phys. 18, 16173–16211. doi: 10.5194/acp-18-16173-2018
WHO (2019). AirQ+: Software Tool for Health Risk Assessment of Air Pollution. Geneva: World Health Organization. Available online at: https://www.euro.who.int/en/health-topics/environment-and-health/air-quality/activities/airq-software-tool-for-health-risk-assessment-of-air-pollution
WHO (2021). WHO Global Air Quality Guidelines: Particulate Matter (PM2.5 and PM10), Ozone, Nitrogen Dioxide, Sulfur Dioxide and Carbon Monoxide. World Health Organization. Available online at: https://apps.who.int/iris/handle/10665/345329. License: CC BY-NC-SA 3.0 IGO
Keywords: climate change, air quality, public health, climate action planning, air quality management planning, urban planning, particulate matter, greenhouse gases
Citation: Kleiman G, Anenberg SC, Chafe ZA, Appiah DC, Assefa T, Bizberg A, Coombes T, Cuestas D, Henze DK, Kessler A, Kheirbek I, Kinney P, Mahlatji M, Marshall JD, Naidoo S, Potwana N, Rodriguez A, Tessum CW and Thomas C (2022) Enhanced Integration of Health, Climate, and Air Quality Management Planning at the Urban Scale. Front. Sustain. Cities 4:934672. doi: 10.3389/frsc.2022.934672
Received: 02 May 2022; Accepted: 09 June 2022;
Published: 13 July 2022.
Edited by:
Jennifer Ann Salmond, The University of Auckland, New ZealandReviewed by:
Guy Coulson, National Institute of Water and Atmospheric Research (NIWA), New ZealandSergio Ibarra Espinosa, National Oceanic and Atmospheric Administration (NOAA), United States
Paul Crimmins, Auckland Council, New Zealand
Copyright © 2022 Kleiman, Anenberg, Chafe, Appiah, Assefa, Bizberg, Coombes, Cuestas, Henze, Kessler, Kheirbek, Kinney, Mahlatji, Marshall, Naidoo, Potwana, Rodriguez, Tessum and Thomas. This is an open-access article distributed under the terms of the Creative Commons Attribution License (CC BY). The use, distribution or reproduction in other forums is permitted, provided the original author(s) and the copyright owner(s) are credited and that the original publication in this journal is cited, in accordance with accepted academic practice. No use, distribution or reproduction is permitted which does not comply with these terms.
*Correspondence: Gary Kleiman, Z2FyeUBvcmJpc2Fpci5jb20=
†Present address: Culley Thomas, ADEC Innovations, Irvine, CA, United States
Nwabisa Potwana, Tshwane University of Technology, Pretoria, South Africa