 Jussi Torkko
 Age Poom
 Elias Willberg
 Tuuli Toivonen
- 1Digital Geography Lab, Department of Geosciences and Geography, University of Helsinki, Helsinki, Finland
- 2Mobility Lab, Department of Geography, University of Tartu, Tartu, Estonia
- 3Helsinki Institute of Sustainability Science, Institute of Urban and Regional Studies, University of Helsinki, Helsinki, Finland
Urban greenery has been shown to impact the quality of life in our urbanizing societies. While greenery is traditionally mapped top-down, alternative computational approaches have emerged for mapping greenery from the street level to mimic human sight. Despite the variety of these novel mapping approaches, it has remained unclear how well they reflect human perception in reality. We compared a range of both novel and traditional mapping methods with the self-reported perception of urban greenery at randomly selected study sites across Helsinki, the capital of Finland. The mapping methods included both image segmentation and point cloud-based methods to capture human perspective as well as traditional approaches taking the top-down perspective, i.e., land cover and remote sensing-based mapping methods. The results suggest that all the methods tested are strongly associated with the human perception of greenery at the street-level. However, mapped greenery values were consistently lower than the perceived values. Our results support the use of semantic image segmentation methods over color segmentation methods for greenery extraction to be closer to human perception. Point cloud-based approaches and top-down methods can be used as alternatives to image segmentation in case data coverage for the latter is limited. The results highlight a further research need for a comprehensive evaluation on how human perspective should be mimicked in different temporal and spatial conditions.
1. Introduction
In our steadily urbanizing societies (Knudsen et al., 2020), urban greenery provides people with nearby opportunities to experience nature (WHO Regional Office for Europe, 2017). Greenery has been an intrinsic part of our cities for a long time as it has been associated with livability and positive health and wellbeing effects (Hartig et al., 2014). Research evidence indeed links urban greenery to several physical, social, and psychological benefits (Chiesura, 2004; Sugiyama et al., 2008; Hartig et al., 2014; WHO Regional Office for Europe, 2016; Nieuwenhuijsen, 2021). Consequently, ensuring urban greenery has been progressively incorporated into cities' quality of life programs and policies (Escobedo et al., 2011).
Urban greenery has been defined and described in a variety of ways (see Hartig et al., 2014). A conventional approach to observe and quantify urban greenery takes a top-down perspective by treating greenery as areas and polygons on surfaces (Yang et al., 2009). This approach is predominantly based on remote sensing methods, which apply the sensors of aerial vehicles and satellites (Yang et al., 2009; Li et al., 2015a). Satellite images can be acquired as both open and proprietary data (Fong et al., 2018) and remote sensing methods capture the big picture from large swaths of land while being easily repeatable (Gupta et al., 2012). However, this approach streamlines vegetation into two-dimensional biomass or canopy cover (Yang et al., 2009), which tends to dismiss the vertical dimension of greenery (Gupta et al., 2012). Therefore, the surfaces inspected from high above, indicating the broad presence of greenery, do not directly reflect the ground-level greenery perceived by people (Yang et al., 2009; Long and Liu, 2017). This challenge has recently gained considerable research attention and several novel methods that aim to capture the human perspective of greenery have been developed (Long and Liu, 2017).
The amount of greenery, which is perceived at the street-level, can be of great importance for our health and wellbeing (Villeneuve et al., 2018; Zhang and Dong, 2018; Helbich et al., 2019; Ki and Lee, 2021; Liu et al., 2021). Ulrich showed already in 1984 that the amount of visible greenery can be inversely related to the number of days and the number of painkillers needed for the recovery after surgery (Ulrich, 1984). Visible greenery can increase the time spent on recreational outdoor activities (Villeneuve et al., 2018), reduce weight and mitigate cardiovascular diseases (Leng et al., 2020). Greenery in urban landscapes can be associated with reduced negative feelings (Liu et al., 2021) and more positive mental health (Helbich et al., 2019). In general, people tend to perceive scenery with greenery more positively compared to scenery with less greenery (Aoki, 1976, 1991; Schroeder and Cannon, 1983; Ohno, 1991). This has resulted in more support for urban greenery projects in locations visible to the public (Yang et al., 2009). Also, the benefits measured through green views may differ from the benefits measured through approximations of general presence of greenery. Research has found that several health benefits and effects are related to street-level green views rather than greenery that is visible via top-down remote sensing methods (e.g., Villeneuve et al., 2018; Zhang and Dong, 2018; Helbich et al., 2019; Ki and Lee, 2021; Liu et al., 2021).
However, an increase of urban greenery can also cause some negative effects due to introduced allergens and infectious pathogens, eventual water shortages (Hartig et al., 2014; Lõhmus and Balbus, 2015; Chen et al., 2020), or the ecological unsuitability of introduced species that people find attractive (Schroeder and Cannon, 1983; Chong et al., 2014). Furthermore, aesthetically appealing green vegetation makes city space more desirable (Schroeder and Cannon, 1983). This may lead to green gentrification (Hwang and Sampson, 2014) with increased real estate prices (Zhang and Dong, 2018; Fu et al., 2019) and neighborhood income levels (Li et al., 2015a).
The earliest attempts to capture perceived greenery by people came from Japan. Early research relied on photographs and site appraisals to evaluate how green scenery appeared to people (e.g., Utashiro and Ohsuga, 1974; Aoki, 1976, 1991; Schroeder and Cannon, 1983; Aoki et al., 1985). An early study by Aoki et al. (1985: 9) aimed to “establish a method of quantifying the amount of the green environment that is perceived by respondents.” Aoki also coined the first term for capturing perceived greenery, calling it the “greenness visibility ratio” (Aoki, 1987, cit. Chen et al., 2020). This premise was later honed by Yang et al. (2009) who introduced the index “Green View,” which estimates the amount of greenery visible to people on the ground in urban area.
While computational methods for modeling and mapping perceived greenery have been in use since the first works by Ohno (1991) for over three decades, Li et al. (2015b) were among the first to advance the computational process by using automatically extracted Google Street View images instead of self-taken photographs or manually surveyed environments. They were also the first to automate the greenery calculation process by using automatic image segmentation of greenery. After this, many novel approaches have been introduced: color segmentation of images (e.g., Long and Liu, 2017; Dong et al., 2018; Larkin and Hystad, 2019; Chen et al., 2020), semantic segmentation of images (e.g., Helbich et al., 2019, 2021; Ye et al., 2019; Ki and Lee, 2021; Kido et al., 2021; Xia et al., 2021), and diverse point cloud-based approaches (e.g., Susaki and Komiya, 2014; Yu et al., 2016; Susaki and Kubota, 2017; Labib et al., 2021; Virtanen et al., 2021).
However, there is an obvious lack of knowledge on how the various methods aiming at quantifying the perceived greenery manage to mimic the human perception. The attempts to solve the problem have been limited (e.g., Leslie et al., 2010; Falfán et al., 2018) and the vantages of different approaches are not yet fully understood.
The aim of this study is to provide evidence on how well most common computational methods and spatial data sources capture and mimic the human perception of street-level greenery. We compared mapped greenery values with the empirically collected data of self-reported greenery levels at randomly selected study sites in Helsinki, the capital of Finland. We focused on methods that are specifically developed for quantifying perceived street-level greenery and represent the distinct types of approaches applied in scholarly literature. Our results will inform the broader urban planning and research community about the suitability and advantages of contemporary approaches for quantifying human perceived greenery in the urban fabric. Finally, we discuss challenges on capturing human perceived greenery to guide future research on the topic.
2. Methods for capturing human-scale greenery
2.1. Surveying perceived greenery
During previous decades, most studies of the perception of greenery have taken a qualitative approach (Yang et al., 2009). Visual experiences have been studied both by on-site evaluations or surveys (Yang et al., 2009) and by laboratory-based experiments (Aoki, 1991). Common approaches include the manual segmentation or appraisal of photographs (e.g., Utashiro and Ohsuga, 1974; Aoki, 1976, 1991; Schroeder and Cannon, 1983; Aoki et al., 1985,?; Yang et al., 2009; Falfán et al., 2018) and on-site evaluations regarding the amount of greenery (e.g., Aoki et al., 1985; Sugiyama et al., 2008; Leslie et al., 2010; Falfán et al., 2018).
Early examples of the on-site evaluation of visible greenery include the studies by Utashiro and Ohsuga (1974), Aoki (1976), Aoki (1991), and Aoki et al. (1985). In those studies, the participants were asked to evaluate the amount of greenery, which was then compared to greenery extracted from photographs at the same locations. Among more recent studies, Sugiyama et al. (2008), Leslie et al. (2010) used postal surveys to gather responses about perceived greenery in participants' neighborhoods. Falfán et al. (2018) interviewed subjects about street-level greenery and compared their responses to greenery values extracted from remote sensing and street view images.
Manual segmentation was the earliest method for greenery extraction from photographs. While previously used to extract people's preferences (Yang et al., 2009), it has now been applied more as a reference or validation method for other segmentation techniques (Long and Liu, 2017). The benefits of manual segmentation of pictures in comparison to on-site evaluation of greenery is that more locations can be inspected during one occasion (Aoki, 1991). However, both evaluation methods are affected by the subjects' specific characteristics and their cultural heritage (Aoki, 1999).
Compared to objective methods, subjective measures of studying greenery often cost more time and funds and are prone to human induced biases (Gupta et al., 2012). For example, photographs portray the photographer's interpretation of a scene and thus can be somewhat biased (Aoki, 1991). However, subjective measures can better capture the qualitative aspect of greenery that could be missed by quantitative approaches (Leslie et al., 2010).
2.2. Mapping perceived greenery
Since the introduction of the big data driven computational approach by Li et al. (2015b), several indices and methods have been developed for computing and mapping the amount of perceived greenery. The underlying premise of these methods is the quantification of perceived greenery levels from the ground by using computational methods and vast data sources, as proposed by Yang et al. (2009), who calculated the share of perceived greenery in different parts of the city as percentage reaching from zero to one hundred. Subsequent studies have also adopted a similar range to describe perceived greenery. The premise indicates that values close to 0 have no visible greenery, while values near 100 demonstrate locations where only greenery is visible in all directions.
The variety of terminology applied in the field is large. Specific indices have been labeled the Green View Index (GVI, Yang et al., 2009), the Floor Green View Index (FGVI, Yu et al., 2016), the Standardized Green View Index (SGVI, Kumakoshi et al., 2020), the Panoramic Green View Index (PGVI, Dong et al., 2018), the Viewshed Greenery Visibility Index (VGVI, Labib et al., 2021), the Green Space Ratio (GSR, Susaki and Komiya, 2014), or the Panoramic View Green View Index (PVGVI, Kido et al., 2021). Also, researchers have calculated the amount of greenery in the field of view without using a specific term (e.g., Jiang et al., 2017).
These novel methods can be broadly split into two categories: (1) image-based methods that rely on the segmentation of the vegetation elements of images, and (2) point cloud-based methods that calculate the visibility of greenery from a range of locations from three-dimensional data gained from LiDAR sensors. Both types of methods are described below.
2.2.1. Image-based methods
Since the early attempts to quantify perceived greenery with photography-based methods, images have remained a popular data source for analyzing greenery levels from a human perspective. Photographs can be taken by researchers themselves (e.g., Yang et al., 2009; Falfán et al., 2018) or extracted from novel, iterable data sources, which represent street-level views and allow users to gather a large amount of data from cities automatically (Long and Liu, 2017). Both proprietary (e.g., Google Street View) and crowd-sourced services (e.g., Mapillary or KartaView) are available. However, crowd-sourced platforms may suffer from issues such as biased contributor ratios, varied spatial coverage, and use of a highly diverse set of devices to capture the images (Quinn and León, 2019; Ma et al., 2020). The use of different devices and technical parameters may affect the quality of and the perception of greenery in images. E.g., different focal lengths can distort the dimensions of greenery in an image (Aoki, 1987). Also, the methods for stitching images together to compile panoramic images may vary considerably (e.g., Li et al., 2015a; Dong et al., 2018; Chen et al., 2019; Helbich et al., 2019; Xia et al., 2021). If technical parameters have not been documented and published, different greenery studies may not be comparable (Virtanen et al., 2021).
Segmentation methods to extract greenery ratio from images also vary considerably. Apart from the subjective evaluation (e.g., Aoki et al., 1985) and manual segmentation of greenery discussed above, contemporary computational methods include two main approaches: color and semantic segmentation (Long and Liu, 2017). Color segmentation is an approach that classifies images according to color values of individual pixels. The presumption of this method is that various pixel colors represent different color clusters and objects (Khattab et al., 2014). There are many color spaces available with varying suitability for specific segmentation tasks (Khattab et al., 2014). A fundamental concern of the color segmentation is that colors are shared by many objects and objects can be multi-colored. E.g., non-vegetated green objects, such as cars, fences or building facades, can fulfill the parametrical requirements and be interpreted as green vegetation (Long and Liu, 2017; Tong et al., 2020; Kido et al., 2021). Similarly, non-green parts of vegetation that are covered by bark may not be identified as vegetation (Kido et al., 2021).
Semantic segmentation is an image classification method that uses machine learning to understand and segment images based on their content (Xia et al., 2021). The goal of semantic segmentation is to classify pixels into discrete objects (Xia et al., 2021). A semantic segmentation model needs to be trained before use with prelabelled raw training data (Lecun et al., 2015). In the post-training phase, the model captures features as topological objects regardless of their color. Hence, non-green parts of vegetation, such as trunks and branches, can be successfully classified as vegetation (Long and Liu, 2017; Tong et al., 2020). Machine learning methods have improved over time and additional training can further enhance their ability to capture greenery (Lecun et al., 2015; Xia et al., 2021; Zhang et al., 2021).
2.2.2. Point cloud-based methods
Point clouds are three-dimensional data sets, which are collected by the Light Detection and Ranging (LiDAR) method, also known as laser scanning technology. The structures of vegetation are identified through the penetration of a laser through the tree and shrub canopy layer and received echoes (Zieba-Kulawik et al., 2021). Point cloud-based computational methods are used to capture greenery either directly from raw data sets (e.g., Susaki and Komiya, 2014; Susaki and Kubota, 2017) or from data products derived from raw point clouds (e.g., Yu et al., 2016; Labib et al., 2021; Virtanen et al., 2021).
In the first pathway, objects are classified into greenery based on the structure of the point cloud. Point clouds can be collected by both ground-based (e.g., Susaki and Kubota, 2017) and airborne (e.g., Susaki and Komiya, 2014) sensors. Ground-based sensors can better capture vegetation than airborne sensors as occlusion is limited (Susaki and Kubota, 2017), but the success rate depends on the point cloud density (Zhen et al., 2016). Airborne sensors have broader coverage, but building walls, multi-story roofs, and lower levels of vegetation can cause classification errors (MacFaden et al., 2012; Susaki and Komiya, 2014). Both ground-based and airborne sensors have difficulties with new and short vegetation (MacFaden et al., 2012).
The other pathway is to use point cloud derived products, such as surface models, and combining them with other data sources. Labib et al. (2021) inferred the visibility of greenery by combining a ready-made land use and land cover dataset with point cloud derived surface and terrain models. Yu et al. (2016) extracted greenery from Normalized Difference Vegetation Index (NDVI) and used surface and building models for visibility calculations. Virtanen et al. (2021) examined the visibility of greenery within a browser based three-dimensional city model created from aerial images and point cloud data.
The advantage of any point cloud-based method is the ability to modify the relative height of the observer, the vertical horizon, which can be useful in urban landscapes (Yu et al., 2016). Also, point-cloud derived measures can be used to model greenery perception of future landscapes by simulating artificial buildings (Yu et al., 2016). The concerns of using point cloud-based derivates include information loss when compressing point cloud data to a flat raster surface (Yang et al., 2020). The results also depend on the original resolution and accuracy of the datasets in use (Labib et al., 2021; Virtanen et al., 2021). Furthermore, when combining point cloud data with remote sensing images, issues related to varied lighting conditions (MacFaden et al., 2012) or environmental factors, such as weather and air quality (Yu et al., 2016), can emerge.
3. Materials and methods
3.1. Study area
Our study area was Helsinki, the capital of Finland (Figure 1). With a population of 658,457 inhabitants, it is the largest city in Finland and houses 12% of the total population of the country (Mäki and Sinkko, 2023). Helsinki is a green city from both an aerial and a street-level perspective. Out of a total land surface area of 214 km2, 111 km2 (52%) is classified as vegetation (Helsinki Region Environmental Services, 2021). At the street level, the median Green View Index (GVI) value for Helsinki is 32% (Toikka, 2019), which is among the higher values when compared to cities in the world (see Ratti et al., 2020).
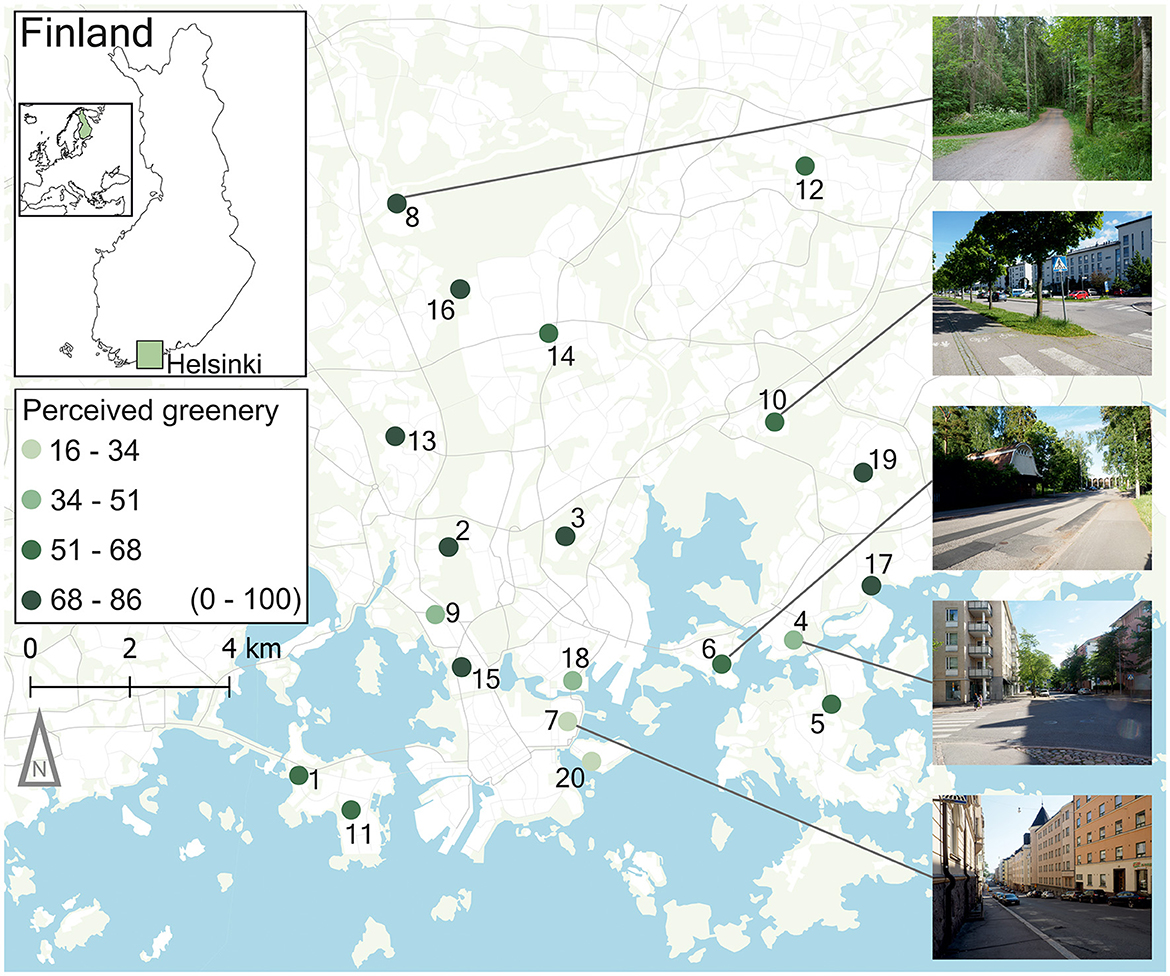
Figure 1. Study area and sites in Helsinki, Finland. A site number and the mean perceived greenery value from interviews are shown for each site. Photographs taken by J. Torkko exemplify the sites.
We based our choice of study sites on existing street-level greenery quantification methods with the goal of covering multiple levels of street-level greenery. As a first and second baseline, we used the open access street-aggregated greenery dataset for Helsinki (Toikka et al., 2020), which includes both Green View Index based on street view images and land cover-based greenery index for street segments. We used ready-made indices only for the study site selection and later produced similar indices for greenery comparison on our own by using the photographs, which were taken from the study sites (described in more detail in Sections 3.4.1 and 3.4.6). As a third baseline, we used Viewshed Greenness Visibility Index (VGVI), which we calculated based on point cloud and land cover data for the same street segments following Labib et al. (2021) (described in more detail in Section 3.4.3).
To generate the study sites, we randomly chose one street segment centroid from every tenth percentile of each baseline method. The street view image-based Green View Index varied from completely non-green to mostly green (range of 0–70), while the other two baseline methods using the land cover and point cloud data varied by location from non-green to fully green (range of 0–100). Due to these ranges of values, we chose 7, 10, and 10 sites based on GVI, land use, and VGVI values, respectively. The total number of selected study sites was 27. If the sites happened to be on private property or were otherwise obstructed, we identified a new random segment from the same percentile range before starting the fieldwork.
The aim of the fieldwork was to collect self-declared greenery values with in situ interviews. During the fieldwork, we deemed 9 of the 27 initial sites to be unusable due to current or recent road construction, unsafe areas for stopping pedestrians for an interview, or lack of participants in a reasonable timespan. The 18 successful sites represented 25 of the 27 percentile ranges of our initial classification. To include all percentile ranges of the classification, we randomly selected two additional study sites for interviews to fill the two missing percentile ranges. Figure 1 presents the final 20 study sites, which represent the 27 initially defined percentile ranges of GVI, land use, and VGVI greenery values.
3.2. Workflow
Our research aim was to assess how well greenery quantification methods manage to capture the human perception of street-level greenery, with a focus on methods that are specifically designed for perceived greenery. To do this, we collected self-declared greenery values from people in each study site with short on-site interviews. After conducting the interviews, we calculated greenery values at the same sites with a set of mapping methods (Table 1). Subsequently, we compared the surveyed and mapped values of perceived greenery statistically. Our workflow is presented in Figure 2.
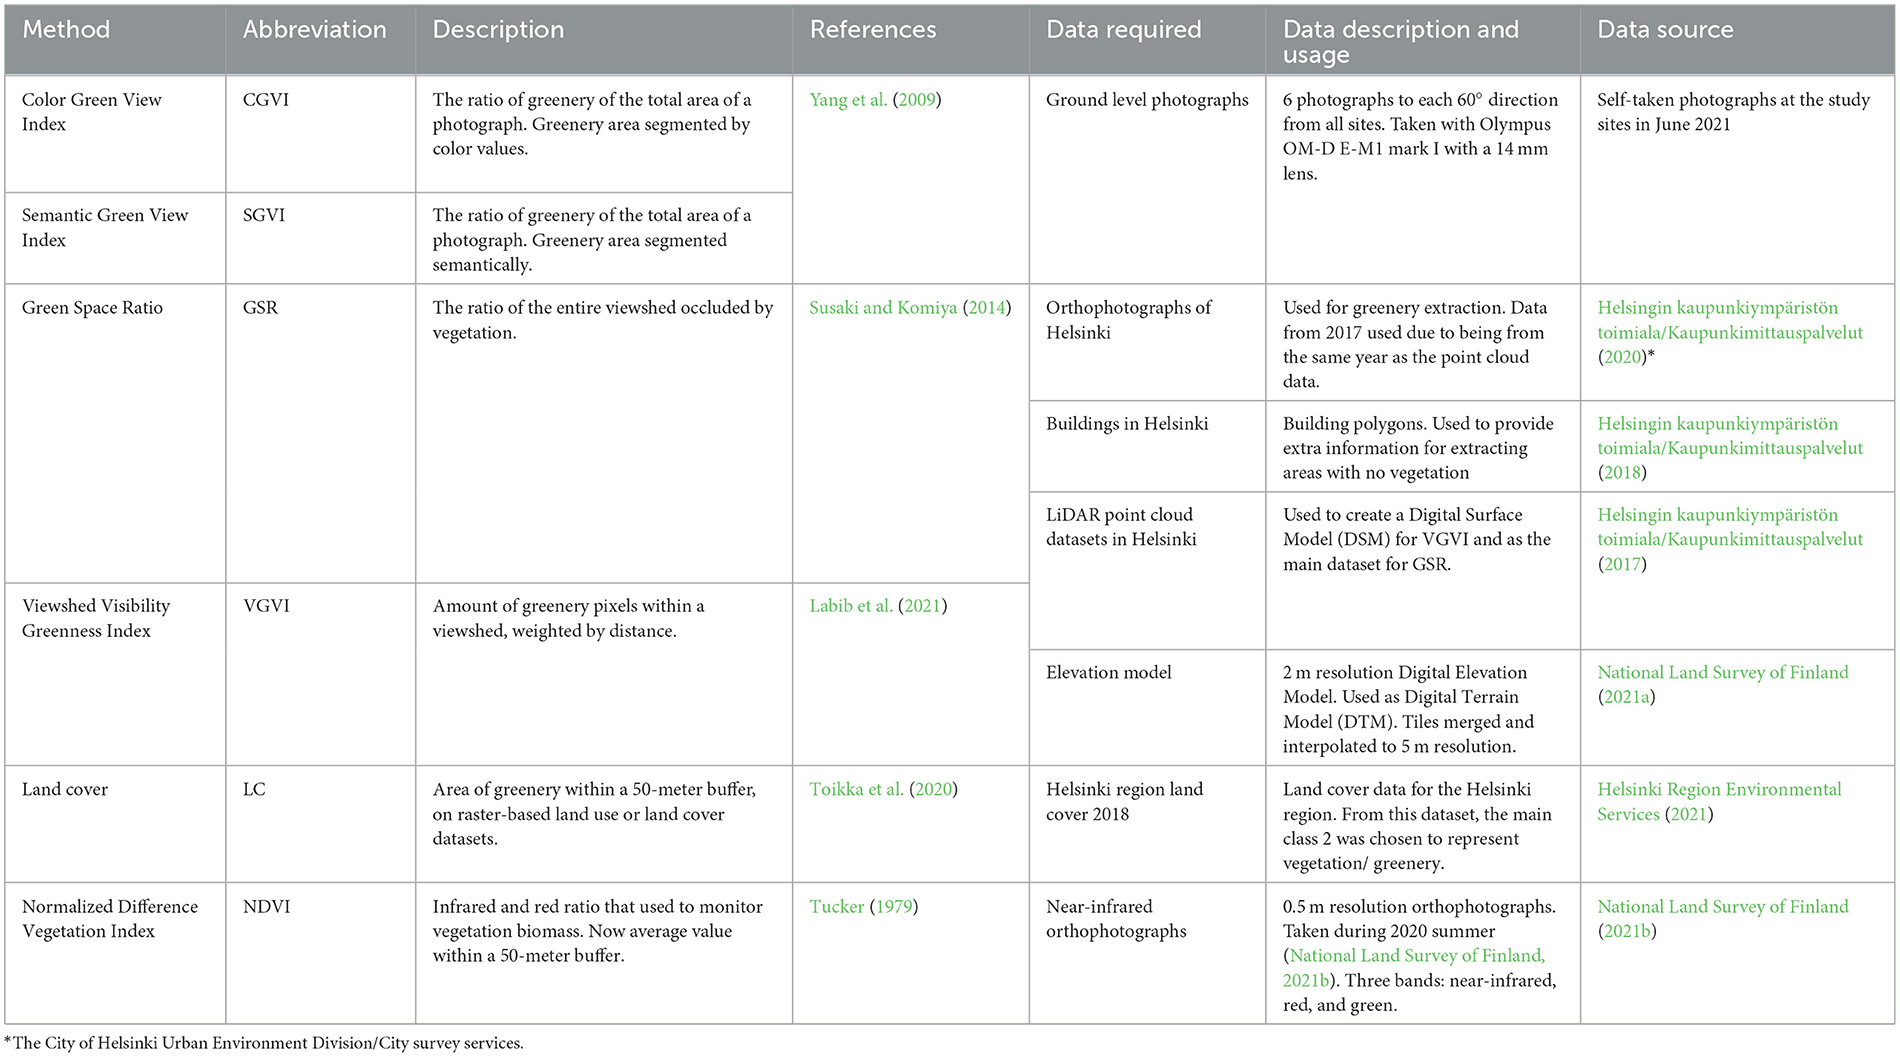
Table 1. Methods and data used for mapping perceived greenery.
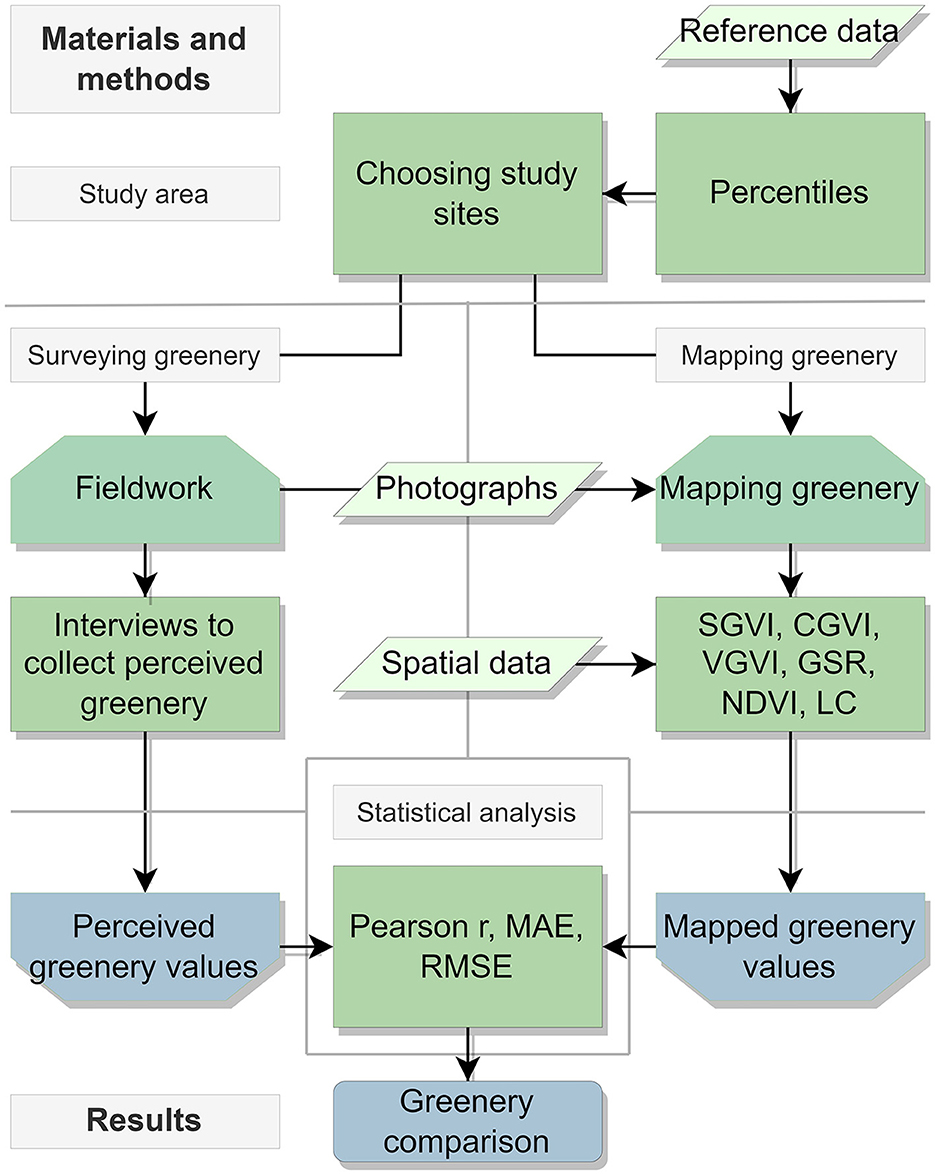
Figure 2. The workflow of the study. Light gray boxes mark the names of relevant subchapters, green boxes the workflow phases, input data and methods, and blue boxes the output of respective phases. The methods and their abbreviations are described in Table 1. MAE stands for Mean Absolute Error and RMSE stands for Root Mean Squared Error.
We mapped greenery in our study sites with six methods. Four of the methods were developed specifically for mapping perceived greenery values on the street level while the other two represent top-down methods for capturing the amount of greenery. Methods for capturing perceived greenery included two image segmentation and two point cloud-based methods. Image segmentation methods follow the Green View Index methodology proposed by Yang et al. (2009). To avoid confusion, we designated them as Color Green View Index (CGVI) and Semantic Green View Index (SGVI) according to the segmentation method. Both approaches use six photographs, which were taken with a 14 mm lens with 60-degree intervals from each study site. Point cloud-based methods to estimate the visibility of greenery included Viewshed Greenness Visibility Index (VGVI, Labib et al., 2021) and Green Space Ratio (GSR, Susaki and Komiya, 2014). Top-down methods used either Normalized Difference Vegetation Index (NDVI), which is the most common indicator of quantified greenery (Fong et al., 2018), or land cover data (LC) based greenery values, which were derived similarly to Toikka et al. (2020). These were used by calculating the average NDVI value or share of green land use within fixed sized buffers. We tested various buffer sizes and for both methods, we found 50-meter buffers to most accurately capture perceived greenery. All the tested methods are further described in detail in Section 3.4.
The set of methods we selected enabled us to provide a methodological comparison between the recent methods developed for capturing perceived greenery and conventional top-down methods. We collected data that were required to calculate greenery values by field work or from online sources. All the data used had a high spatial resolution to prevent resolution induced biases. Where possible, we used data from the same year and season as the field study interviews. We prioritized open-source options and did not use proprietary datasets. All the methods we tested, and the data requirements, are listed in Table 1.
3.3. Surveying perceived greenery
We collected perceived greenery values for each study site with in situ interviews by asking randomly selected pedestrians to voluntarily stop for a short interview regarding a study. The interviews were conducted from 8 to 19 June, 2021, each of them between 2:30 pm and 8:15 pm. During the interview days, the weather was sunny or partially cloudy, with the temperature being near 20° Celsius (68° Fahrenheit). Before starting the interviews at each site, we took photographs of the sites to enable the calculation of greenery values with segmentation methods.
For each participant, we first explained the purpose of the interview. The interviewees were then asked to evaluate the amount of greenery visible in their surrounding scenery. We used a scale from 0 (meaning no visible greenery) to 100 (only greenery is visible). We asked the interviewees to concentrate on natural greenery, i.e., to exclude green-colored cars, buildings, and other artificial objects. The mean value of the self-declared values from each site was then assigned as a perceived greenery value for each study site.
In total, 412 participants were interviewed at the study sites. The average number of participants was 20.6 per site, ranging between 18 and 25. We conducted most interviews in Finnish, but some interviews were done in English. Genders of the participants were assumed. The sample included 216 presumed females and 196 presumed males.
3.4. Mapping greenery
3.4.1. Color Green View Index
To calculate the Color Green View Index (CGCI), we used the Treepedia Python library (Mittrees, 2018). As the original library was created for the now deprecated Python 2.7, we used a Python 3 fork instead (Chan, 2020; Kumakoshi et al., 2020). The script identifies green pixels and classifies them as green vegetation. It delivers a percentage value for greenery in an image, following Yang et al. (2009). We used the average score of six images in each direction to calculate the CGVI value of each study site.
3.4.2. Semantic Green View Index
For Semantic Green View Index (SGVI), we processed the images using a Bilateral Segmentation Network (Yu et al., 2021), which is a semantic segmentation method based on a fully convolutional neural network. We chose this method because it has been tested with the Cityscapes Dataset (see: Yu et al., 2021), a large, annotated dataset meant especially for training semantic segmentation algorithms for urban views (Cordts et al., 2016). We used a recent implementation of the Bilateral Segmentation Network that included a Cityscapes pre-trained model (MaybeShewill-CV, 2021). Following Kido et al. (2021), we chose classes vegetation and terrain to represent green vegetation in the classification. Then we ran our images from the study sites with this implementation of the segmentation network. The final greenery score was calculated in a similar manner to CGVI, by assessing the number of respective pixels from six images for each study site.
3.4.3. Viewshed Greenness Visibility Index
We calculated the Viewshed Greenness Visibility Index (VGVI) by following the original script by Jonnyhuck (2020). The script requires three main datasets: Digital Terrain Model, Digital Surface Model, and a binary greenery surface. We used the Digital Terrain Model developed by the National Land Survey of Finland (2021a) and merged and rescaled it to a 5 m resolution. We created a new Digital Surface Model from the LiDAR dataset of the City of Helsinki (Helsingin kaupunkiympäristön toimiala/Kaupunkimittauspalvelut, 2017), using the las2dem tool (Rapidlasso GmbH, 2021). We created the binary greenery surface from a land cover dataset of 2018 (Helsinki Region Environmental Services, 2021), in which the main class 2 marks greenery. After collecting all the data required, we ran the script with an 800 m maximum viewshed parameter. Finally, we sampled the return raster values to the study sites.
3.4.4. Green Space Ratio
For Green Space Ratio (Susaki and Komiya, 2014), we followed the approach set up by the original authors. However, to ensure a working script, some adjustments and compromises were required. First, we joined a 1 m resolution grid with the point cloud data of Helsinki from 2017 (Helsingin kaupunkiympäristön toimiala/Kaupunkimittauspalvelut, 2017). Second, we followed Susaki and Kubota (2017) and used principal component analysis to find the normal vector for the points of each cell. Due to the differences in the point clouds used in this study and the original one, we had to choose a different Root Mean Square Error (RMSE) value than in the original paper. Thus, RMSE of 0.1 meter instead of 1 meter was used to distinguish buildings. The equation used for RMSE is as follows:
In which Predictioni-Actuali is the distance between a point i and a normal plane and n is the total number of points within that segment.
Similarly to Susaki and Komiya (2014), we also used airborne images (Helsingin kaupunkiympäristön toimiala/Kaupunkimittauspalvelut, 2020) to further classify the cells. The RGB band of the images was converted to Hue-Saturation-Value and the segmentation thresholds were adapted from the original paper. Despite the changes to RMSE and the use of airborne images, building walls and edges were poorly distinguished from vegetation. We suspected this to be caused by the higher density of points in the point cloud we used compared to the one in the original study. The problem could be related to the classification errors presented by MacFaden et al. (2012). To compensate, we used building polygons (Helsingin kaupunkiympäristön toimiala/Kaupunkimittauspalvelut, 2018) with a 3 m buffer as an additional support and created a greenery grid. Finally, we calculated the occlusion by greenery from each position by mimicking the approach used by Susaki and Komiya (2014).
3.4.5. Normalized Difference Vegetation Index
We created a Normalized Difference Vegetation Index (NDVI) for each study site by calculating the average NDVI value within a set of buffer zones: 30, 50, 100, and 300 m range. For that, we used 0.5 m high resolution color-infrared orthophotos from the summer 2020 (National Land Survey of Finland, 2021b). NDVI was calculated based on the following equation:
The NDVI raster data was afterwards normalized to 0–100 scale for better comparability with other greenery methods according to the following equation:
In which Zi is the normalized NDVI cell, x marks all the NDVI values within the data, and xi is the original NDVI cell. After calculating the average NDVI values within each buffer value, we compared them to the perceived greenery values from the sites. The 50 m buffer had the highest correlation coefficient with perceived greenery and was therefore chosen for the statistical comparison.
3.4.6. Land cover
We created the land cover (LC) value for each study site by calculating the proportion of area classified as vegetation from the total area within the same set of buffer zones similarly to NDVI. This is also similar to the approach used by Toikka et al. (2020) in Helsinki. We tested several buffer sizes for correlation with perceived greenery values and the greenery within a 50 m buffer zone was found to have the highest correlation coefficient. Therefore, we picked it to represent the Land Cover greenery value for each study site (2020). The binary vegetation and non-vegetation data were created from a land cover dataset available from the Helsinki Region Environmental Services (2021). Polygons, which belonged to the main class 2 in the dataset, were assigned to vegetation and the rest of the polygons to the non-vegetation category similarly to the calculation of VGVI.
3.5. Statistical analysis
We compared mapped and perceived values of greenery results using three main methods: correlation analysis with Pearson r, mean absolute error (MAE), and Root Mean Square Error (RMSE). Correlation analysis has been extensively used to compare perceived greenery mapping methods (e.g., Falfán et al., 2018; Helbich et al., 2019; Larkin and Hystad, 2019; Tong et al., 2020). It is also a common method for matching modeled results to surveyed results (Kobayashi and Salam, 2000). Following the conventional example of Schober et al. (2018), we determined that correlation coefficient r ≥ 0.9 indicates a very strong relationship and 0.7 ≤ r ≤ 0.89 a strong relationship.
Mean absolute error marks the average error between a mapped and the perceived value, gained from the interviews. We calculated mean absolute error with the following equation based on Willmott and Matsuura (2005):
In which ei is the error (variance) between the model derived value and the perceived value.
Root Mean Square Error is the square root of the average squared error between the mapped and the perceived greenery values. It prioritizes outlier errors over smaller ones and is a better option when the errors follow Gaussian distribution (Chai and Draxler, 2014). We presented the equation for RMSE earlier with the Green Space Ratio.
We chose both error assessment methods to provide additional clarity to the results. The advantage of the error assessment methods is that they aim to determine the differences between two variables, instead of trying to fit one variable to another (Kobayashi and Salam, 2000). Both MAE and RMSE are dimensioned, providing results in the same units as the studied variable (Willmott and Matsuura, 2005). As RMSE is more sensitive to the magnitude of error and always larger than MAE, their differences can indicate major deviations or unequal distribution in magnitude.
4. Results
4.1. Perceived and mapped greenery
The perceived in situ greenery values of the study sites gained from the interviews were negatively skewed (−0.86). Mean perceived greenery value for all sites combined was x = 60.91 with a standard deviation of 19.69. Minimum and maximum mean values for all sites were 16.15 and 85.6, respectively. Standard deviation of mean perceived greenery values varied across the study sites, ranging from 8.44 to 21.47. Supplementary Table 1 and Supplementary Figure 1 present the descriptive statistics and spatial distribution of perceived greenery for all respondents, respectively.
Among the mapping methods we tested, Normalized Difference Vegetation Index had the highest (NDVI, x = 56.04) and Color Green View Index the lowest mean value (CGVI, x = 38.07). The mean greenery values for the other methods were the following: Viewshed Greenness Visibility Index (VGVI): x = 55.51, Semantic Green View Index (SGVI): x = 51.50, Green Space Ratio (GSR): x = 43.88, and Land Cover (LC): x = 43.77. Further, NDVI had a lower standard deviation than the other methods (VGVI: σ = 29.12, LC: σ = 28.41, SGVI: σ = 26.20, CGVI: σ = 23.23, GSR: σ = 21.96, NDVI: σ = 10.17) and its distribution is visibly different from the others (Figure 3).
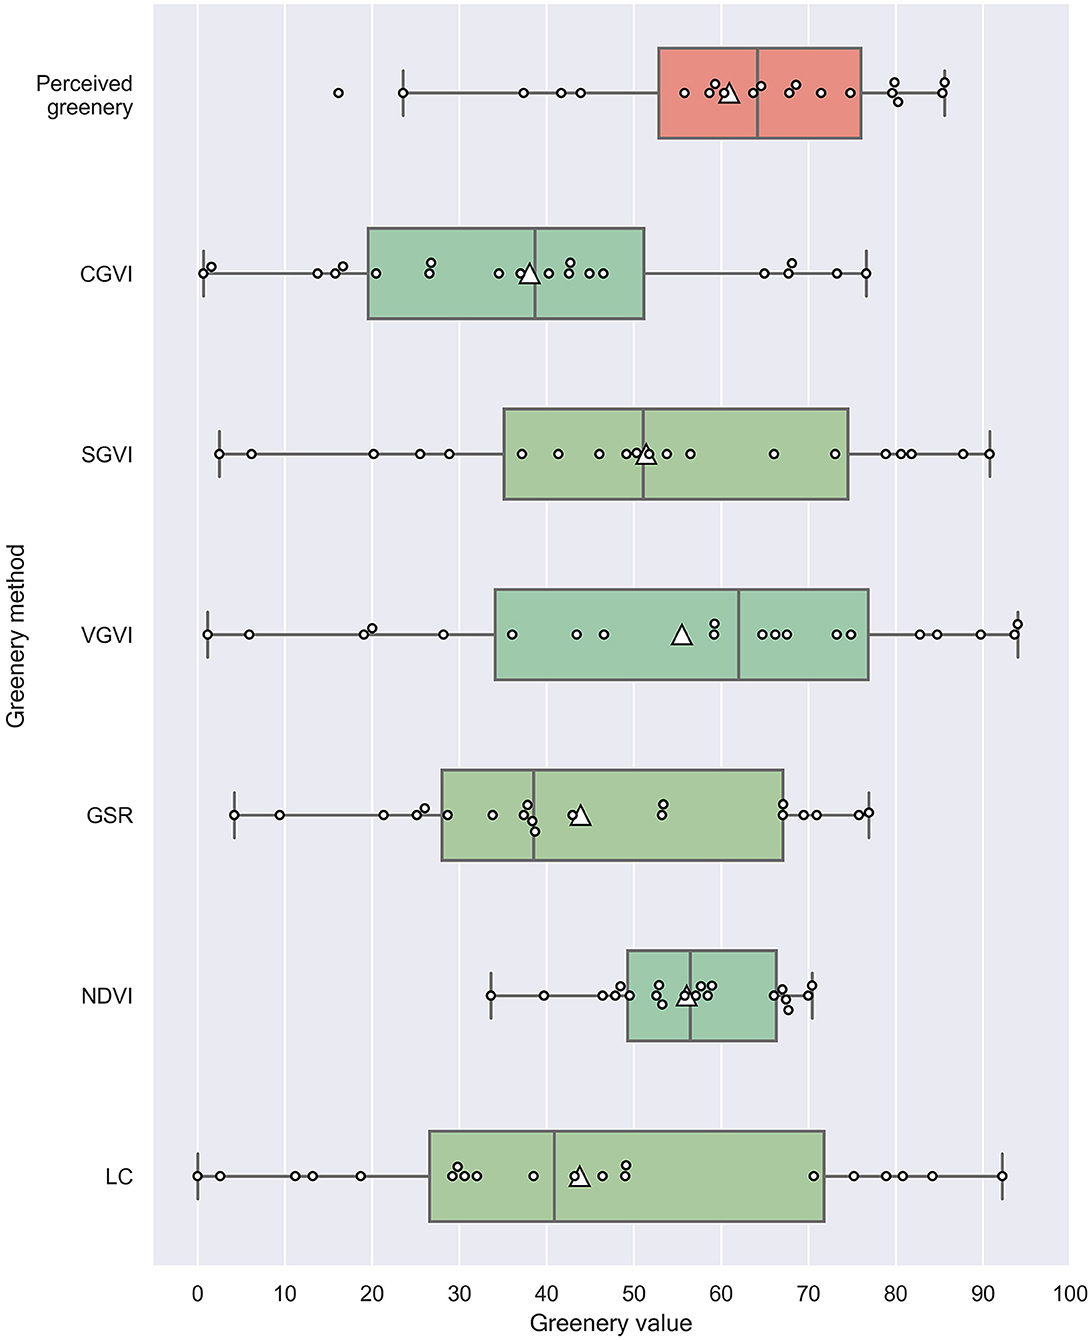
Figure 3. The distribution of reported (perceived) and mapped greenery values. Data is displayed in quartiles. Mean and median values are indicated by a white triangle and a centerline, respectively. Small white circles show the individual values.
Viewshed Greenness Visibility Index, Normalized Difference Vegetation Index, and Semantic Green View Index showed negatively skewed greenery value distribution over all study sites while Color Green View Index and Land Cover values were positively skewed. Green Space Ratio had a nearly normal distribution. Supplementary Table 2 presents the full descriptive statistics of mapping methods and Figure 4 shows the spatial distribution of both perceived and mapped greenery values. Site specific values for both the methods tested, and perceived greenery can be found in Supplementary Table 3.
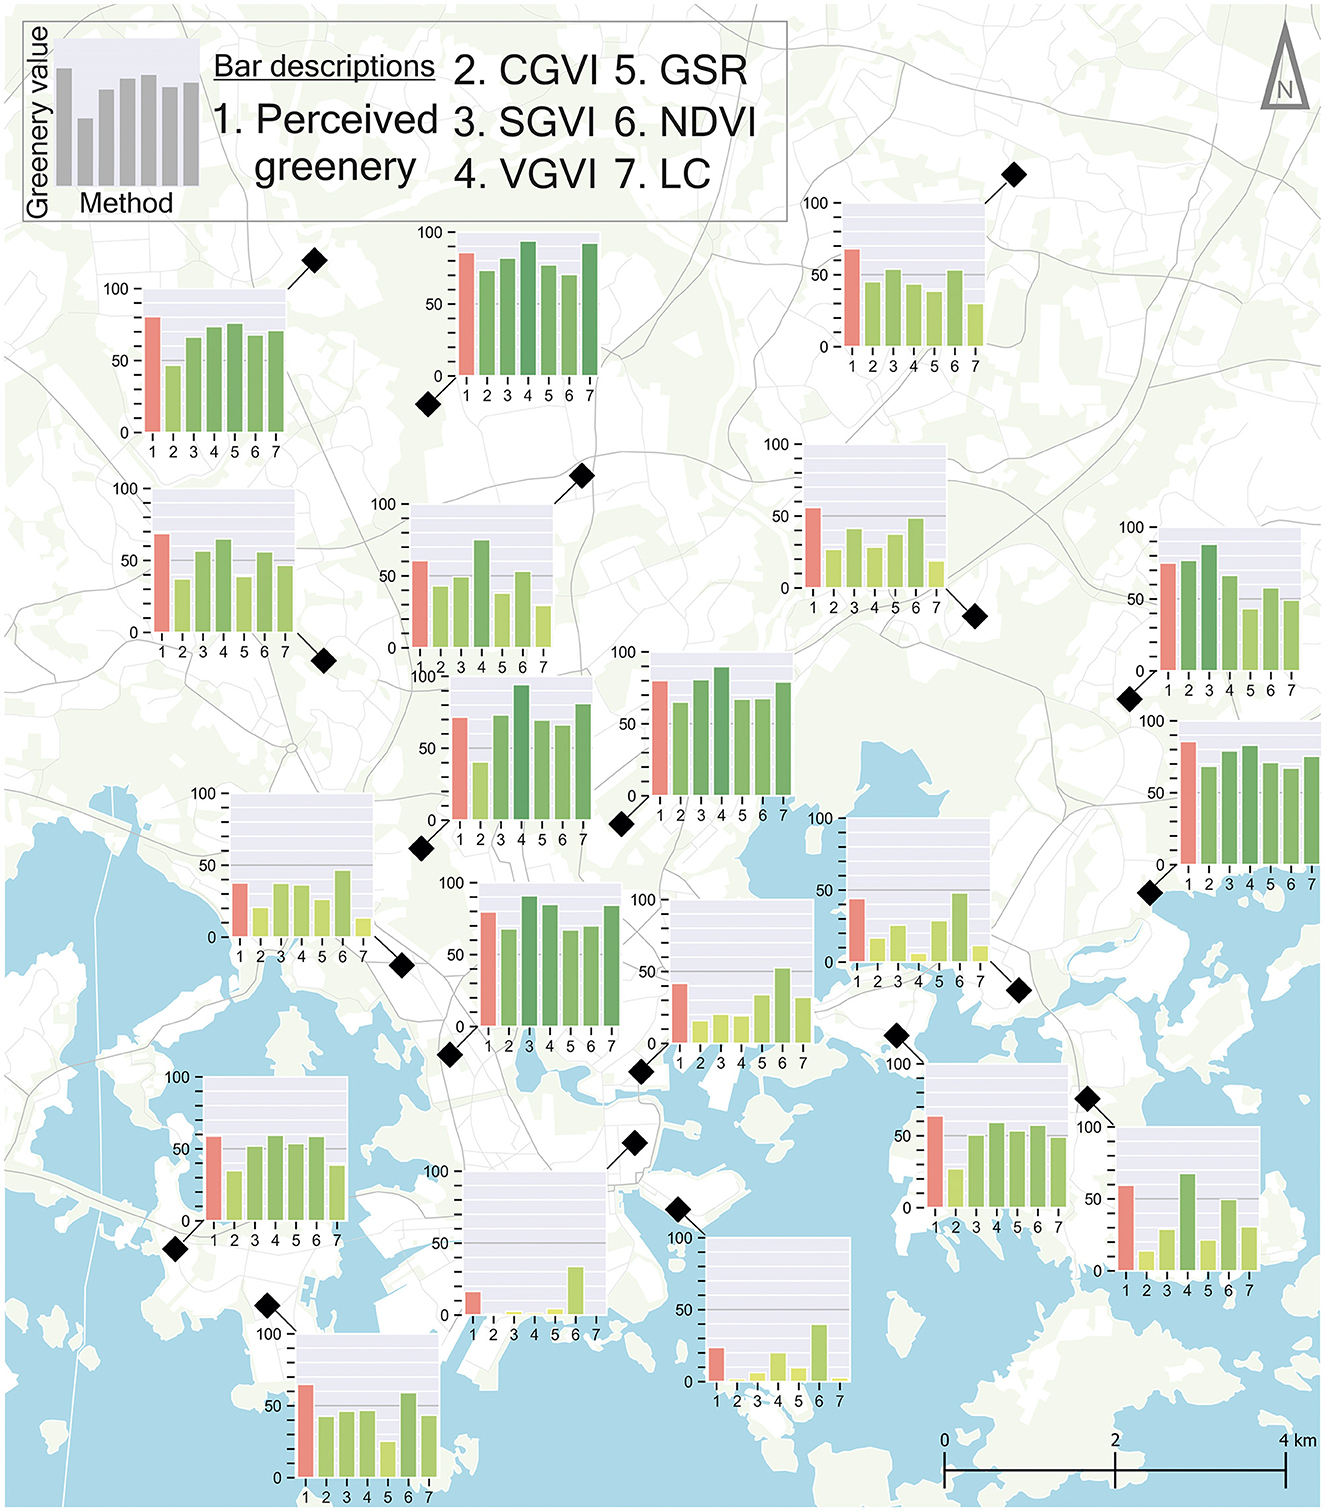
Figure 4. Mapped greenery values for the study sites. Vertical bar hue is weighted on the value with higher values having darker green hues and vice versa. Perceived greenery is highlighted in red for comparison.
4.2. The comparison of methods
The perceived greenery values (both mean and median statistics, p < 0.05) as reported by the participants were on average greater than the mapped greenery values. Perceived greenery had a greater negative skewness than the mapped methods, as seen from Figure 3. Thus, we can deduce that there is an underestimation of perceived greenery by mapping methods. The correlation between perceived and mapped values of greenery is presented in Figure 5. The overall pattern shows a very strong or strong positive linear relationship between perceived and mapped greenery: r ranged from 0.93 for NDVI to 0.863 for Green Space Ratio (SGVI: r = 0.928, CGVI: r = 0.893, LC: r = 0.891, VGVI: r = 0.874). All correlations were statistically significant (p < 0.05).
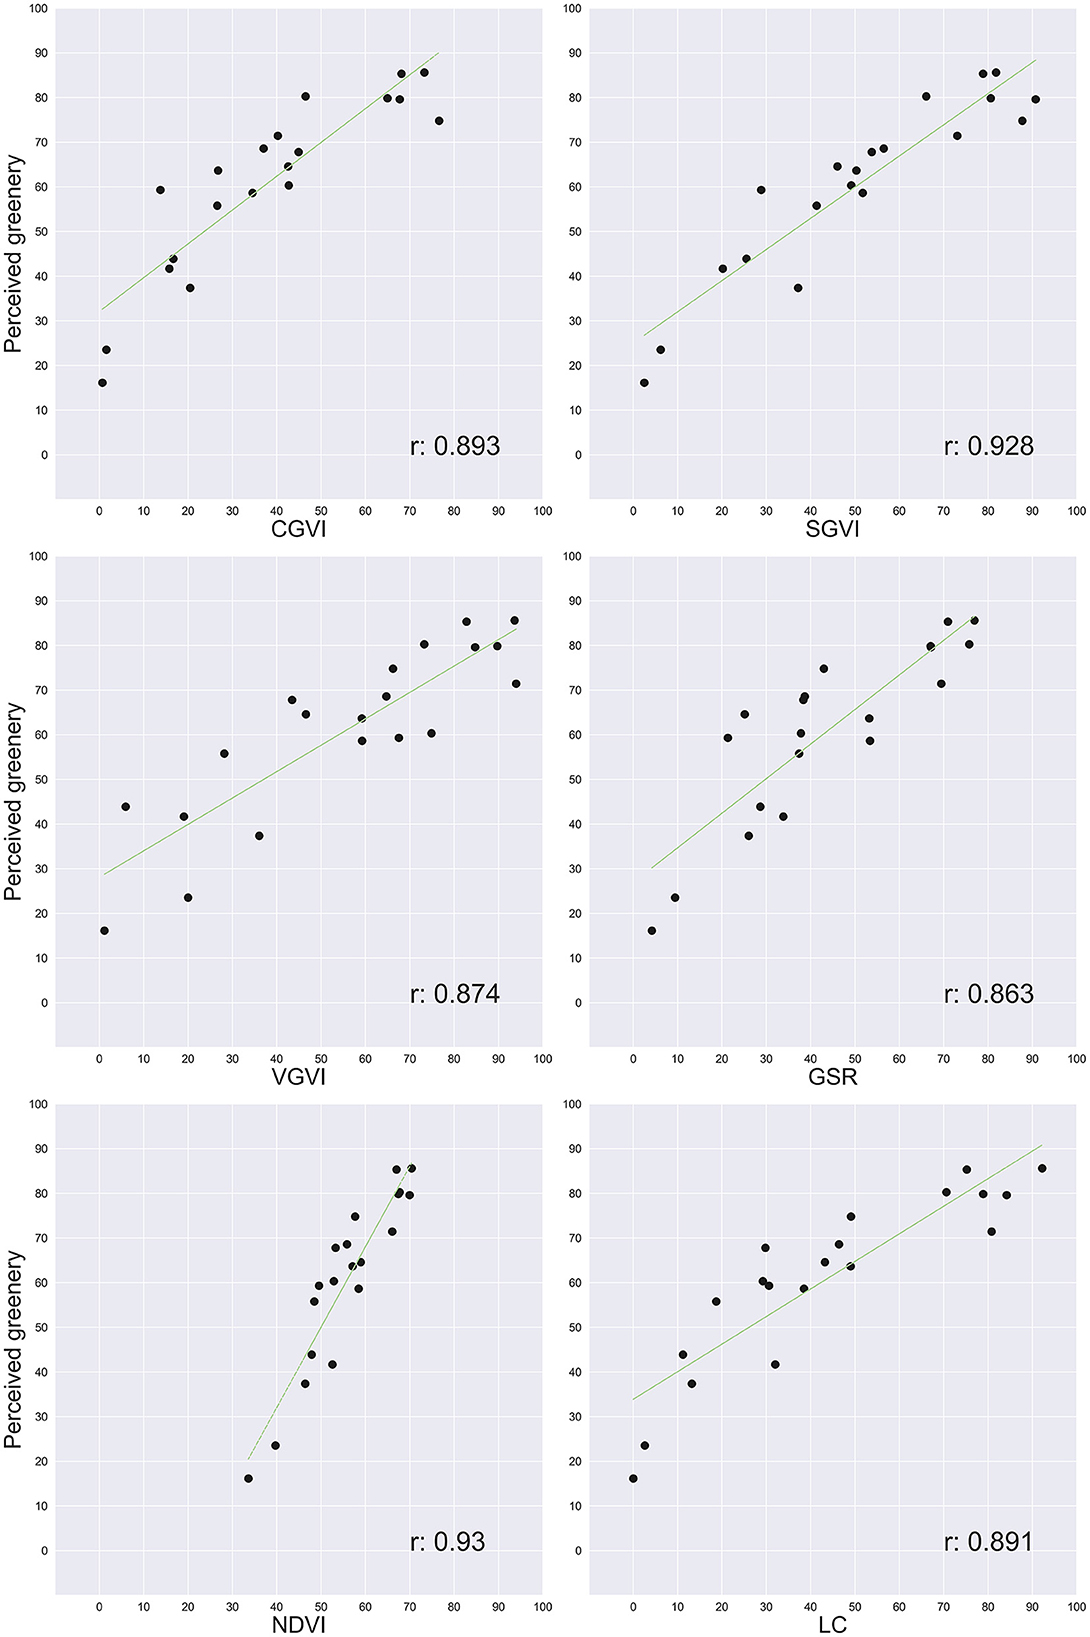
Figure 5. Scatterplots of mapped and perceived values of greenery on X and Y axes, respectively. Green line indicates the regression line. The correlation coefficient is provided within the plots.
Also, the correlation between individual greenery mapping methods was strong or very strong (Figure 6). The highest correlation appeared between NDVI and Land Cover (r = 0.97), which both calculated the average greenery value within circular buffers. Similarly, two image segmentation methods, Color and Semantic Green View Index, had a very strong correlation (r = 0.96). The correlation between two point cloud-based indices tested, Viewshed Greenness Visibility Index and Green Space Ratio, was somewhat weaker (r = 0.81). Very strong relationships also appeared between the pairs of some other methods, e.g., NDVI and GSR (r = 0.94), GSR and LC (r = 0.92), and NDVI and SGVI (r = 0.90).
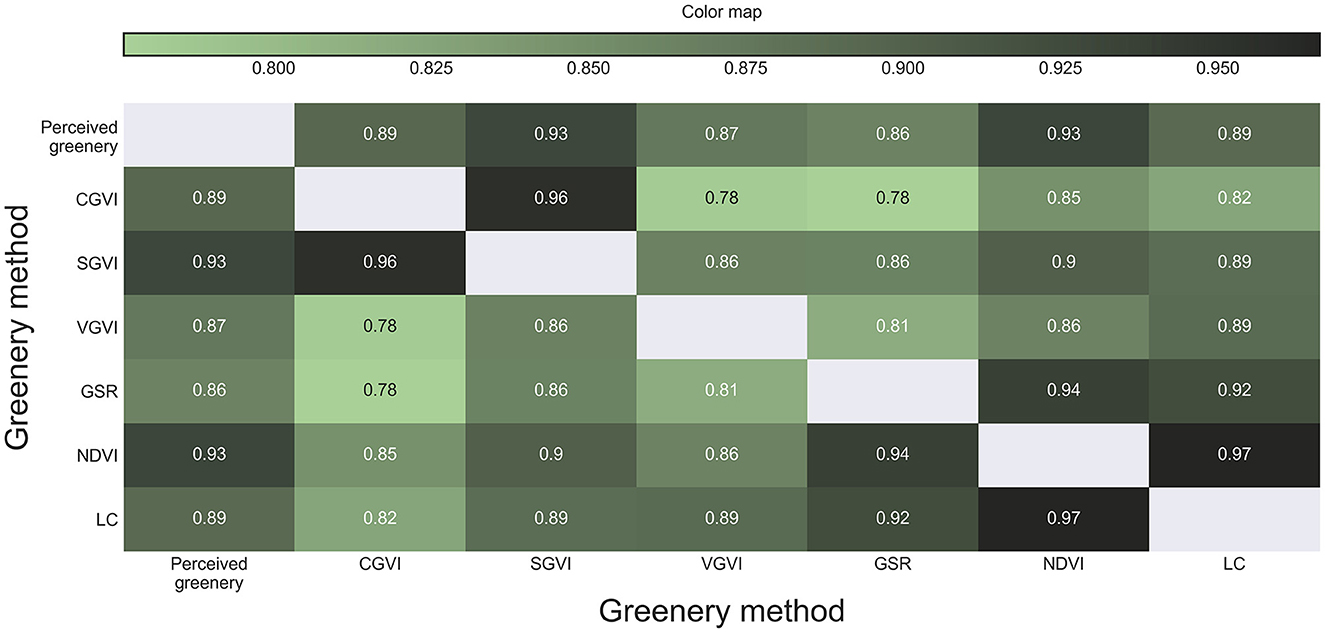
Figure 6. Correlation matrix between the mapped and perceived values of greenery. Darker colors indicate stronger correlation.
Mean Average Error and Root Mean Square Error scores between the surveyed and mapped greenery values indicated major error deviations between the mapping methods (Table 2). NDVI showed the smallest and Color Green View Index the largest deviation from the perceived greenery values. Noticeable differences between MAE and RMSE for some of the methods occurred, suggesting that the range of error deviations for some of the methods was larger. This is apparent for Viewshed Greenness Visibility Index, but it is also noticeable for GSR, SGVI, and LC. For CGVI and NDVI, the smaller difference between MAE and RMSE indicates that their errors are more equally divided in magnitude.
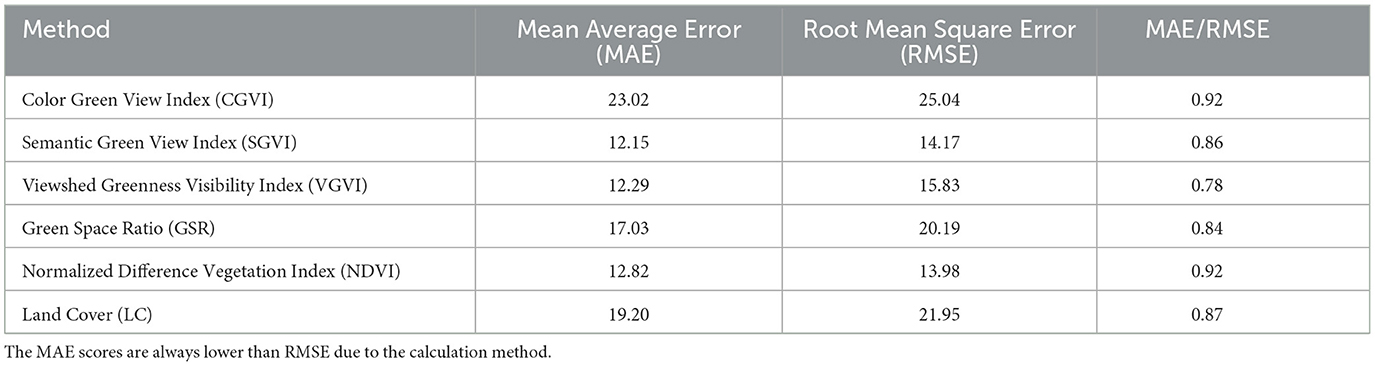
Table 2. Error deviation comparison between the mapped and perceived values of greenery by mapping method.
5. Discussion
5.1. The functionality of the indices
In this study, we compared self-reported human perception of urban greenery with traditional and novel greenery quantification methods to understand the ability of those methods to capture and mimic human perceptions. Our results show that all the tested mapping methods had a strong or very strong correlation with the perceived greenery values reported by participants, indicating their suitability to be used as a proxy for human perception of street-level greenery in Helsinki.
Urban greenery provides a wide array of socio-ecological services, which are positively associated with health and wellbeing benefits for people (Hartig et al., 2014; Nieuwenhuijsen, 2021). As manual methods for documenting human perceptions of their surrounding greenery and its importance can be applied only in limited spatial and temporal scope, more robust methods that are based on available spatial data and can ensure scalability are needed. According to Ohno (1991), the greenery perceived by humans on the ground does not just include the view in front of a person, but the whole surrounding scene. The methods tested by this study, based on high-resolution spatial data, successfully mimic the 360-degree perception of greenery, as shown by the linear relationship with the perceived values.
Our results suggest that deriving the Green View Index from the semantic, object-based segmentation of street view images provides a better alternative for human perceived greenery mapping than the color-based (pixel-based) image segmentation approach. The reasons include the sensitivity to lighting conditions of color-based segmentation, as dimmer or brightly lit greenery often remains unquantified (Pietikainen et al., 1996; Batlle et al., 2000). The same challenge is less pronounced in case of the semantic segmentation approach. Other reasons for the lower performance of color-based approach include the misclassification of green paint as greenery and the inability to distinguish non-green vegetation or non-green parts of vegetation from the images (Li et al., 2015b; Kido et al., 2021). Therefore, color-based approach is the most suitable for the Green View Index mapping from those images, which are taken during the vegetation season (Li et al., 2015b; Larkin and Hystad, 2019), in cases when the seasonal variety of the Green View Index is not in focus. In our study, all images were taken during the vegetation season in June, similarly to the interviews of greenery perception, which means the results describe particularly this season.
Among the point cloud-based methods tested, the Viewshed Greenness Visibility Index performed better for mapping perceived greenery than the Green Space Ratio. While both methods among all the methods tested had the weakest correlation with perceived greenery gained from the interviews, the error comparison results for the Viewshed Greenness Visibility Index were similar to the Semantic Green View Index. Therefore, the Viewshed Greenness Visibility Index could be especially useful in locations for which ground level images are not available. Poorer correlation between the two point cloud-based methods tested and the other greenery measures may suggest that point cloud-based methods catch greenery differently compared to the other methods. However, this aspect was not separately tested in this study and would require further investigation in the future.
We also tested two top-down methods, the Normalized Difference Vegetation Index and green land cover, which both provided reliable results for mapping perceived greenery within a 50 m buffer area in Helsinki. The Normalized Difference Vegetation Index derived from 0.5 m resolution orthophotographs showed slightly better performance than green land cover in both correlation analysis with perceived greenery and error assessment. Even though these methods represent a birds-eye view approach for viewing scenery, they can be used to supplement ground level approaches to capture greenery perception by humans, or even be combined into a single value (see Larkin and Hystad, 2019). However, other research has found a clearer disconnection between the top-down and street-level assessment of greenery (e.g., Leslie et al., 2010; Larkin and Hystad, 2019; Kumakoshi et al., 2020; Tong et al., 2020). The explanation for this may lie in the study area vegetation: for example, cities having green walls or otherwise vertical greenery, might have high street view greenness, which is difficult to map top-down. This suggests that contextual information is valuable when choosing the mapping methods.
5.2. Questions of quantifying perceived greenery
In our comparison of mapping and surveying methods of perceived greenery, we found that the mapping methods tested often underestimate the amount of greenery as reported by people. Previous research has also reported similar findings of underestimation (e.g., Leslie et al., 2010; Falfán et al., 2018). The objective presence of greenery might be amplified by human perception. Future research could overcome this issue by finding a coefficient or function, which brings mapped greenery values closer to the perceived ones.
Image-based, point cloud-based, and top-down methods for mapping greenery differ from their needs for data and computational power, and hence from their suitability to be scaled up for larger studies. As each type of the methods represent the space and greenery by different means, their data and resolution requirements are not directly comparable. However, we acknowledge that the quality of a single dataset may affect the capability of the respective method to reflect human perceived greenery. Approaches based on point cloud and its derivates are especially data-hungry and computationally demanding, and often require a multitude of data sources for proper utilization. For Green View Indices, street view images are usually proprietary data accompanied by acquisition costs (e.g., Google, 2023). Open-source alternatives can be considered, but they often lack the qualities of monetary options (Alvarez Leon and Quinn, 2019; Ma et al., 2020). Thus, without the necessary funds or data infrastructure, methods developed specifically for capturing perceived greenery can be hard to implement compared to the methods that use more established public or private data sources. However, data collection and processing for these new methods can be automated with limited human intervention, especially when comparing with manual data collection methods or surveying perceived greenery with an in-person approach (see also Li et al., 2015b).
Although all the methods tested provided a reliable indication of human perceived greenery, methodological advances could improve their performance. For example, creating dedicated training datasets for greenery extraction from specific geographic areas could increase the accuracy of semantic segmentation models (Yin and Wang, 2016; Ye et al., 2019). Ensuring dense point cloud datasets, solving frequent methodological issues such as detecting short vegetation (MacFaden et al., 2012), and increasing the computational power of related greenery extraction methods could result in more accurate resolution and mapping results. Furthermore, point cloud-based methods could detect specific typology of vegetation or assess various viewshed aspects (Yin and Wang, 2016; Fu et al., 2019; Helbich et al., 2019; Liu et al., 2021). It is even possible to model the perceived greenery of future landscapes (Yu et al., 2016; Kido et al., 2021).
Research on perceived greenery would also benefit from a deeper attention to seasonality and lighting conditions (Li et al., 2015b; Larkin and Hystad, 2019). In many parts of the world, deciduous trees have green leaves only during the warm/humid season. Nevertheless, greenery perception studies have predominately focused on the vegetation season, leaving seasonal variation in the perception mostly understudied. Considering seasonal and diurnal rhythms in lighting conditions increases the complexity of understanding human perception of greenery (see also Leng et al., 2020). However, these rhythms should not be neglected as the cyclic character of nature has a strong effect on human behavior and greenery-related wellbeing (Villeneuve et al., 2018; Leng et al., 2020). Future research could address more the impacts of seasonality on people's perceptions of greenery and how well different mapping methods are able to capture greenery perceptions during the leafless period of the year. These aspects are currently poorly understood.
Hence, quantifying perceived greenery into a single index or value might oversimplify how people perceive greenery and its qualities (see Leslie et al., 2010). People distinguish visually many aspects of vegetation, which may create specific benefits for their wellbeing, depending on their sociocultural background, previous knowledge, and individual values (Aoki, 1999; Tyrväinen et al., 2003; Liu et al., 2021). Furthermore, perceived greenery may be a better proxy for certain types of behavior such as physical activity than mapped greenery measures (Leslie et al., 2010). Advancing greenery perception methods with the functionality to detect perceived biodiversity, its components and meanings for people would provide important insights for sociological, psychological, and health-related research.
Our research has some limitations. The photographs used in the calculation of image-based Green View Indices share some overlap areas due to the focal length used. The calculation method of the point cloud-based Green Space Ratio needed modifications from the original version (see Susaki and Komiya, 2014) because of the different density of the original datasets, which reduced the comparability of our results with studies using the method in its original form. Using NDVI average value within a buffer area required normalization, which led to a low standard deviation, a centralized distribution, and hence affected the error comparison. Future research could consider the underestimation bias of perceived greenery by greenery perception methods to reach a more balanced set of study sites. Furthermore, comparative studies from different regions and different times may produce different results, as seen from Falfán et al. (2018). Comparative studies on perceived and mapped greenery would also benefit from a more sophisticated approach to individual perceptions, previous knowledge and experiences, and the sociodemographic background of participants as these might determine the pathways how people perceive greenery.
6. Conclusions
Our study contributes to the use of novel computational methods of quantifying urban perceived greenery. There has been a critical gap in understanding how people perceive greenery and how the approaches used for mapping capture it. We attempted to bridge this gap for the benefit of urban greenery studies. Our results indicate that all the methods tested have a strong relationship with people's perception, which suggests them to be viable alternatives for mapping perceived greenery. The most suitable method for mapping perceived greenery thus often depends on other factors, such as data or computational constraints. However, our findings support previous research by showing that the calculated values mostly underestimate the extent of how people perceive greenery on the ground level. The study also shows that high-resolution top-down methods using limited buffer size can sometimes capture people's perception on-par with methods that use the street-level perspective. Perspective-related aspects become more important in the presence of vertical greenery. Future research on the computational methods for perceived greenery could disentangle the seasonal and diurnal variation in the perceptions of greenery, the biodiversity-related and behavioral aspects of perceived greenery, as well as mapping the eventual health and wellbeing impacts that greenery perception can have on urban population groups.
Data availability statement
The raw data supporting the conclusions of this article will be made available by the authors, without undue reservation.
Ethics statement
Ethical review and approval was not required for the study on human participants in accordance with the local legislation and institutional requirements. Written informed consent for participation was not required for this study in accordance with the national legislation and the institutional requirements.
Author contributions
JT, AP, EW, and TT contributed to the conception and design of the study. JT collected and analyzed the data and wrote the first draft of the manuscript. AP contributed to a substantial revision. All authors contributed to interpreting the results. All authors contributed to the manuscript reading and critical revision and approved the submitted and the revised version.
Funding
This work was supported by the European Regional Development Fund (Healthy Outdoor Premises for Everyone, UIA03-240), the Estonian Research Council (grant no. MOBTP1003), European Union's Horizon 2020 Funding Program (URBANAGE, 101004590), the Amer Foundation (Sporttia Stadiin/Urban Exerciser Project), and the European Research Council Consolidator Grant (GREENTRAVEL, 101044906).
Acknowledgments
We wish to thank the members of the Digital Geography Lab at the University of Helsinki and the Mobility Lab at the University of Tartu and project partners from the Healthy Outdoor Premises for Everyone (HOPE) project for the discussions on the study.
Conflict of interest
The authors declare that the research was conducted in the absence of any commercial or financial relationships that could be construed as a potential conflict of interest.
Publisher's note
All claims expressed in this article are solely those of the authors and do not necessarily represent those of their affiliated organizations, or those of the publisher, the editors and the reviewers. Any product that may be evaluated in this article, or claim that may be made by its manufacturer, is not guaranteed or endorsed by the publisher.
Author disclaimer
Views and opinions expressed are those of the authors only and neither the funders nor the granting authorities can be held responsible for them.
Supplementary material
The Supplementary Material for this article can be found online at: https://www.frontiersin.org/articles/10.3389/frsc.2023.1160995/full#supplementary-material
References
Alvarez Leon, L. F., and Quinn, S. (2019). The value of crowdsourced street-level imagery: examining the shifting property regimes of OpenStreetCam and Mapillary. Geo J. 84, 395–414. doi: 10.1007/s10708-018-9865-4
Aoki, Y. (1976). “An evaluation method of green environment by residential impressions,” in Papers of 11th Scientific Research Meeting (City Planning Institute of Japan), 145–150.
Aoki, Y. (1987). Relationship between percieved greenery and width of visual fields. J. Japanese Inst. Landsc. Archit. 51, 1–10. doi: 10.5632/jila1934.51.1
Aoki, Y. (1991). Evaluation methods for landscapes with greenery. Landsc. Res. 16, 3–6. doi: 10.1080/01426399108706344
Aoki, Y. (1999). Review article: trends in the study of the psychological evaluation of landscape. Landsc. Res. 24, 85–94. doi: 10.1080/01426399908706552
Aoki, Y., Yasuoka, Y., and Naito, M. (1985). Assessing the impression of street-side greenery. Landsc. Res. 10, 9–13. doi: 10.1080/01426398508706131
Batlle, J., Casals, A., Freixenet, J., and Martí, J. (2000). A review on strategies for recognizing natural objects in colour images of outdoor scenes. Image Vis. Comput. 18, 515–530. doi: 10.1016/S0262-8856(99)00040-2
Chai, T., and Draxler, R. R. (2014). Root mean square error (RMSE) or mean absolute error (MAE)?– arguments against avoiding RMSE in the literature. Geosci. Model Dev. 7, 1247–1250. doi: 10.5194/gmd-7-1247-2014
Chan, S. Y. (2020). Treepedia. Github Repos. Available online at: https://github.com/y26805/Treepedia_Public (accessed July 06, 2021).
Chen, H., Meng, Q., Hu, D., Zhang, L., and Yang, J. (2019). Evaluating greenery around streets using baidu panoramic street view images and the panoramic green view index. Forests 10, 1109. doi: 10.3390/f10121109
Chen, J., Zhou, C., and Li, F. (2020). Quantifying the green view indicator for assessing urban greening quality: an analysis based on Internet-crawling street view data. Ecol. Indic. 113, 106192. doi: 10.1016/j.ecolind.2020.106192
Chiesura, A. (2004). The role of urban parks for the sustainable city. Landsc. Urban Plan. 68, 129–138. doi: 10.1016/j.landurbplan.2003.08.003
Chong, K. Y., Teo, S., Kurukulasuriya, B., Chung, Y. F., Rajathurai, S., and Tan, H. T. W. (2014). Not all green is as good: different effects of the natural and cultivated components of urban vegetation on bird and butterfly diversity. Biol. Conserv. 171, 299–309. doi: 10.1016/j.biocon.2014.01.037
Cordts, M., Omran, M., Ramos, S., Rehfeld, T., Enzweiler, M., Benenson, R., et al. (2016). “The cityscapes dataset for semantic urban scene understanding,” in 2016 IEEE Conference on Computer Vision and Pattern Recognition (CVPR) (Las Vegas, NV: IEEE), 3213–3223. doi: 10.1109/CVPR.2016.350
Dong, R., Zhang, Y., and Zhao, J. (2018). How green are the streets within the sixth ring road of Beijing? An analysis based on tencent street view pictures and the green view index. Int. J. Environ. Res. Public Health 15, 1367. doi: 10.3390/ijerph15071367
Escobedo, F. J., Kroeger, T., and Wagner, J. E. (2011). Urban forests and pollution mitigation: analyzing ecosystem services and disservices. Environ. Pollut. 159, 2078–2087. doi: 10.1016/j.envpol.2011.01.010
Falfán, I., Muñoz-Robles, C. A., Bonilla-Moheno, M., and MacGregor-Fors, I. (2018). Can you really see “green”? Assessing physical and self-reported measurements of urban greenery. Urban For. Urban Green. 36, 13–21. doi: 10.1016/j.ufug.2018.08.016
Fong, K. C., Hart, J. E., and James, P. (2018). A review of epidemiologic studies on greenness and health: updated literature through 2017. Curr. Environ. Heal. reports 5, 77–87. doi: 10.1007/s40572-018-0179-y
Fu, X., Jia, T., Zhang, X., Li, S., and Zhang, Y. (2019). Do street-level scene perceptions affect housing prices in Chinese megacities? An analysis using open access datasets and deep learning. PLoS ONE 14, e0217505. doi: 10.1371/journal.pone.0217505
Google (2023). Street View Static API Overview. Available online at: https://developers.google.com/maps/documentation/streetview/overview (accessed January 24, 2023).
Gupta, K., Kumar, P., Pathan, S. K., and Sharma, K. P. (2012). Urban neighborhood green index – a measure of green spaces in urban areas. Landsc. Urban Plan. 105, 325–335. doi: 10.1016/j.landurbplan.2012.01.003
Hartig, T., Mitchell, R., de Vries, S., and Frumkin, H. (2014). Nature and health. Annu. Rev. Public Health 35, 207–228. doi: 10.1146/annurev-publhealth-032013-182443
Helbich, M., Poppe, R., Oberski, D., Zeylmans van Emmichoven, M., and Schram, R. (2021). Can't see the wood for the trees? An assessment of street view- and satellite-derived greenness measures in relation to mental health. Landsc. Urban Plan. 214, 104181. doi: 10.1016/j.landurbplan.2021.104181
Helbich, M., Yao, Y., Liu, Y., Zhang, J., Liu, P., and Wang, R. (2019). Using deep learning to examine street view green and blue spaces and their associations with geriatric depression in Beijing, China. Environ. Int. 126, 107–117. doi: 10.1016/j.envint.2019.02.013
Helsingin kaupunkiympäristön toimiala/Kaupunkimittauspalvelut (2017). Lidar Datasets of the City of Helsinki, CC BY 4.0. Available online at: https://hri.fi/data/en_GB/dataset/helsingin-laserkeilausaineistot (accessed April 05, 2021).
Helsingin kaupunkiympäristön toimiala/Kaupunkimittauspalvelut (2018). Buildings in Helsinki, CC BY 4.0. Available online at: https://hri.fi/data/en_GB/dataset/helsingin-rakennukset (accessed April 05, 2021).
Helsingin kaupunkiympäristön toimiala/Kaupunkimittauspalvelut (2020). Ortophotographs of Helsinki, CC BY 4.0. Available online at: https://hri.fi/data/en/dataset/helsingin-ortoilmakuvat (accessed April 05, 2021).
Helsinki Region Environmental Services (2021). Helsinki Region Land Cover, CC-BY 4.0. Available online at: https://www.hsy.fi/en/environmental-information/open-data/avoin-data—sivut/helsinki-region-land-cover-dataset/ (accessed April 05, 2021).
Hwang, J., and Sampson, R. J. (2014). Divergent pathways of gentrification: racial inequality and the social order of renewal in Chicago neighborhoods. Am. Sociol. Rev. 79, 726–751. doi: 10.1177/0003122414535774
Jiang, B., Deal, B., Pan, H., Larsen, L., Hsieh, C.-H., Chang, C.-Y., et al. (2017). Remotely-sensed imagery vs. eye-level photography: evaluating associations among measurements of tree cover density. Landsc. Urban Plan. 157, 270–281. doi: 10.1016/j.landurbplan.2016.07.010
Jonnyhuck (2020). Green-visibility-index. Github Repos. Available online at: https://github.com/jonnyhuck/green-visibility-index (accessed April 05, 2021).
Khattab, D., Ebied, H., Hussein, A., and Tolba, M. (2014). Color image segmentation based on different color space models using automatic GrabCut. Sci. World J. 2014, 126025. doi: 10.1155/2014/126025
Ki, D., and Lee, S. (2021). Analyzing the effects of Green View Index of neighborhood streets on walking time using Google Street View and deep learning. Landsc. Urban Plan. 205, 103920. doi: 10.1016/j.landurbplan.2020.103920
Kido, D., Fukuda, T., and Yabuki, N. (2021). Assessing future landscapes using enhanced mixed reality with semantic segmentation by deep learning. Adv. Eng. Informatics 48, 101281. doi: 10.1016/j.aei.2021.101281
Knudsen, C., Moreno, E., Arimah, B., Otieno Otieno, R., Ogunsanya, O., Arku, G., et al. (2020). World Cities Report 2020. The Value of Sustainable Urbanization. Nairobi: United Nations Human Settlements Programme.
Kobayashi, K., and Salam, M. (2000). Comparing simulated and measured values using mean squared deviation and its components. Agron. J. 92, 345–352. doi: 10.2134/agronj2000.922345x
Kumakoshi, Y., Chan, S. Y., Koizumi, H., Li, X., and Yoshimura, Y. (2020). Standardized green view index and quantification of different metrics of urban green vegetation. Sustainability 12, 7434. doi: 10.3390/su12187434
Labib, S. M., Huck, J. J., and Lindley, S. (2021). Modelling and mapping eye-level greenness visibility exposure using multi-source data at high spatial resolutions. Sci. Total Environ. 755, 143050. doi: 10.1016/j.scitotenv.2020.143050
Larkin, A., and Hystad, P. (2019). Evaluating street view exposure measures of visible green space for health research. J. Expo. Sci. Environ. Epidemiol. 29, 447–456. doi: 10.1038/s41370-018-0017-1
Lecun, Y., Bengio, Y., and Hinton, G. (2015). Deep learning. Nature 521, 436–444. doi: 10.1038/nature14539
Leng, H., Li, S., Yan, S., and An, X. (2020). Exploring the relationship between green space in a neighbourhood and cardiovascular health in the winter city of China: a study using a health survey for Harbin. Int. J. Environ. Res. Public Health 17, 513. doi: 10.3390/ijerph17020513
Leslie, E., Sugiyama, T., Ierodiaconou, D., and Kremer, P. (2010). Perceived and objectively measured greenness of neighbourhoods: are they measuring the same thing? Landsc. Urban Plan. 95, 28–33. doi: 10.1016/j.landurbplan.2009.11.002
Li, X., Zhang, C., Li, W., Kuzovkina, Y. A., and Weiner, D. (2015a). Who lives in greener neighborhoods? The distribution of street greenery and its association with residents' socioeconomic conditions in Hartford, Connecticut, USA. Urban For. Urban Green. 14, 751–759. doi: 10.1016/j.ufug.2015.07.006
Li, X., Zhang, C., Li, W., Ricard, R., Meng, Q., and Zhang, W. (2015b). Assessing street-level urban greenery using Google Street View and a modified green view index. Urban For. Urban Green. 14, 675–685. doi: 10.1016/j.ufug.2015.06.006
Liu, Y., Xiao, T., Liu, Y., Yao, Y., and Wang, R. (2021). Natural outdoor environments and subjective well-being in Guangzhou, China: comparing different measures of access. Urban For. Urban Green. 59, 127027. doi: 10.1016/j.ufug.2021.127027
Lõhmus, M., and Balbus, J. (2015). Making green infrastructure healthier infrastructure. Infect. Ecol. Epidemiol. 5, 30082. doi: 10.3402/iee.v5.30082
Long, Y., and Liu, L. (2017). How green are the streets? An analysis for central areas of Chinese cities using tencent street view. PLoS ONE 12, e0171110. doi: 10.1371/journal.pone.0171110
Ma, D., Fan, H., Li, W., and Ding, X. (2020). The state of mapillary: an exploratory analysis. ISPRS Int. J. Geo Inform. 9, 10. doi: 10.3390/ijgi9010010
MacFaden, S., O'Neil-Dunne, J., Royar, A., Lu, J., and Rundle, A. (2012). High-resolution tree canopy mapping for New York City using LIDAR and object-based image analysis. J. Appl. Remote Sens. 6, 3567. doi: 10.1117/1.JRS.6.063567
Mäki, N., and Sinkko, H. (2023). Helsingin väestö vuodenvaihteessa 2021/2022 ja väestönmuutokset vuonna 2021. Tilastoja 2022:7. Helsinki. Available online at: https://www.hel.fi/hel2/tietokeskus/julkaisut/pdf/23_01_10_Tilastoja_7_Maki_Sinkko.pdf (accessed January 26, 2023).
MaybeShewill-CV (2021). BiseNetv2-Tensorflow. Github Repos. Available online at: https://github.com/MaybeShewill-CV/bisenetv2-tensorflow (accessed May 11, 2021).
Mittrees (2018). Treepedia. Github Repos. Available online at: https://github.com/mittrees/Treepedia_Public (accessed July 06, 2021).
National Land Survey of Finland (2021a). Elevation model 2 m, CC BY 4.0. Available online at: https://www.maanmittauslaitos.fi/en/maps-and-spatial-data/expert-users/product-descriptions/elevation-model-2-m (accessed April 05, 2021)
National Land Survey of Finland (2021b). NLS orthophotos, CC BY 4.0. Available online at: https://www.maanmittauslaitos.fi/en/maps-and-spatial-data/expert-users/product-descriptions/orthophotos (accessed April 05, 2021).
Nieuwenhuijsen, M. J. (2021). Green infrastructure and health. Annu. Rev. Public Health 42, 317–328. doi: 10.1146/annurev-publhealth-090419-102511
Ohno, R. (1991). “Ambient vision of the environmental perception: describing ambient visual information,” in Proceedings of the 22nd Annual Conference of the Environmental Design Research Association (Environmental Design Research Association), 237–245.
Pietikainen, M., Nieminen, S., Marszalec, E., and Ojala, T. (1996). ”Accurate color discrimination with classification based on feature distributions,” in Proceedings of 13th International Conference on Pattern Recognition, vol. 3 (Vienna: IEEE Xplore), 833–838. doi: 10.1109/ICPR.1996.547285
Quinn, S., and León, L. (2019). Every single street? Rethinking full coverage across street-level imagery platforms. Trans. GIS 23, 1251–1272. doi: 10.1111/tgis.12571
Rapidlasso GmbH (2021). LAStools. Available online at: https://rapidlasso.com/lastools/ (accessed April 05, 2021).
Ratti, C., Seiferling, I., Li, X., Ghaeli, N., Duarte, F., and So, W. (2020). Treepedia. Available online at: http://senseable.mit.edu/treepedia (accessed July 06, 2021).
Schober, P., Boer, C., and Schwarte, L. A. (2018). Correlation coefficients: appropriate use and interpretation. Anesth. Analg. 126, 1. doi: 10.1213/ANE.0000000000002864
Schroeder, H. W., and Cannon, W. (1983). The esthetic contribution of trees to residential streets in Ohio towns. J. Arboric. 9, 237–243. doi: 10.48044/jauf.1983.058
Sugiyama, T., Leslie, E., Giles-Corti, B., and Owen, N. (2008). Associations of neighbourhood greenness with physical and mental health: do walking, social coherence and local social interaction explain the relationships? J. Epidemiol. Community Heal. 62, e9–e9. doi: 10.1136/jech.2007.064287
Susaki, J., and Komiya, Y. (2014). Estimation of Green Space Ratio for Assessing Urban Landscapes Using Digital Surface Models and Images. IEEE, 1–4. doi: 10.1109/PRRS.2014.6914284
Susaki, J., and Kubota, S. (2017). Automatic assessment of green space ratio in urban areas from mobile scanning data. Remote Sens. 9, 215. doi: 10.3390/rs9030215
Toikka, A. (2019). Mapping the green view of Helsinki through Google Street View images [in Finnish] (MSc Thesis). University of Helsinki. Available online at: https://helda.helsinki.fi/handle/10138/302224 (accessed July 15, 2021).
Toikka, A., Willberg, E., Mäkinen, V., Toivonen, T., and Oksanen, J. (2020). The green view dataset for the capital of Finland, Helsinki. Data Br. 30, 105601. doi: 10.1016/j.dib.2020.105601
Tong, M., She, J., Tan, J., Li, M., Ge, R., and Gao, Y. (2020). Evaluating street greenery by multiple indicators using street-level imagery and satellite images: a case study in Nanjing, China. Forests 11, 1347. doi: 10.3390/f11121347
Tucker, C. J. (1979). Red and photographic infrared linear combinations for monitoring vegetation. Remote Sens. Environ. 8, 127–150. doi: 10.1016/0034-4257(79)90013-0
Tyrväinen, L., Silvennoinen, H., and Kolehmainen, O. (2003). Ecological and aesthetic values in urban forest management. Urban For. Urban Green. 1, 135–149. doi: 10.1078/1618-8667-00014
Ulrich, R. S. (1984). View through a window may influence recovery from surgery. Science 224, 420–421. doi: 10.1126/science.6143402
Utashiro, M., and Ohsuga, T. (1974). “The image of green in urban area,” in Architectural Institute of Japan Conference Academic Abstracts, 1995–1996.
Villeneuve, P. J., Ysseldyk, R. L., Root, A., Ambrose, S., Dimuzio, J., Kumar, N., et al. (2018). Comparing the normalized difference vegetation index with the google street view measure of vegetation to assess associations between greenness, walkability, recreational physical activity, and health in Ottawa, Canada. Int. J. Environ. Res. Public Health 15, 1719. doi: 10.3390/ijerph15081719
Virtanen, J.-P., Jaalama, K., Puustinen, T., Julin, A., Hyyppä, J., and Hyyppä, H. (2021). Near real-time semantic view analysis of 3D city models in web browser. ISPRS Int. J. Geo-Information 10, 138. doi: 10.3390/ijgi10030138
WHO Regional Office for Europe (2016). Urban Green Spaces and Health. Copenhagen: World Health Organization. Regional Office for Europe. Available online at: https://apps.who.int/iris/handle/10665/345751 (accessed July 15, 2021).
WHO Regional Office for Europe (2017). Urban Green Spaces: A Brief for Action. Copenhagen: World Health Organization. Regional Office for Europe. Available online at: https://apps.who.int/iris/handle/10665/344116 (accessed July 15, 2021).
Willmott, C., and Matsuura, K. (2005). Advantages of the mean absolute error (MAE) over the root mean square error (RMSE) in assessing average model performance. Clim. Res. 30, 79. doi: 10.3354/cr030079
Xia, Y., Yabuki, N., and Fukuda, T. (2021). Development of a system for assessing the quality of urban street-level greenery using street view images and deep learning. Urban For. Urban Green. 59, 126995. doi: 10.1016/j.ufug.2021.126995
Yang, J., Kang, Z., Cheng, S., Yang, Z., and Akwensi, P. H. (2020). An individual tree segmentation method based on watershed algorithm and three-dimensional spatial distribution analysis from airborne LiDAR point clouds. IEEE J. Sel. Top. Appl. Earth Obs. Remote Sens. 13, 1055–1067. doi: 10.1109/JSTARS.2020.2979369
Yang, J., Zhao, L., Mcbride, J., and Gong, P. (2009). Can you see green? Assessing the visibility of urban forests in cities. Landsc. Urban Plan. 91, 97–104. doi: 10.1016/j.landurbplan.2008.12.004
Ye, Y., Richards, D., Lu, Y., Song, X., Zhuang, Y., Zeng, W., et al. (2019). Measuring daily accessed street greenery: a human-scale approach for informing better urban planning practices. Landsc. Urban Plan. 191, 103434. doi: 10.1016/j.landurbplan.2018.08.028
Yin, L., and Wang, Z. (2016). Measuring visual enclosure for street walkability: using machine learning algorithms and Google Street View imagery. Appl. Geogr. 76, 147–153. doi: 10.1016/j.apgeog.2016.09.024
Yu, C., Gao, C., Wang, J., Yu, G., Shen, C., and Sang, N. (2021). BiSeNet V2: bilateral network with guided aggregation for real-time semantic segmentation. Int. J. Comput. Vis. 129, 3051–3068. doi: 10.1007/s11263-021-01515-2
Yu, S., Yu, B., Song, W., Wu, B., Zhou, J., Huang, Y., et al. (2016). View-based greenery: a three-dimensional assessment of city buildings' green visibility using Floor Green View Index. Landsc. Urban Plan. 152, 13–26. doi: 10.1016/j.landurbplan.2016.04.004
Zhang, Y., and Dong, R. (2018). Impacts of street-visible greenery on housing prices: evidence from a hedonic price model and a massive street view image dataset in Beijing. ISPRS Int. J. Geo Inform. 7, 104. doi: 10.3390/ijgi7030104
Zhang, Y., Sidibé, D., Morel, O., and Mériaudeau, F. (2021). Deep multimodal fusion for semantic image segmentation: a survey. Image Vis. Comput. 105, 104042. doi: 10.1016/j.imavis.2020.104042
Zhen, Z., Quackenbush, L. J., and Zhang, L. (2016). Trends in automatic individual tree crown detection and delineation—evolution of LiDAR data. Remote Sens. 8, 333. doi: 10.3390/rs8040333
Keywords: urban greenery, human perception, image segmentation, green view index, point cloud methods, NDVI, street-level greenery
Citation: Torkko J, Poom A, Willberg E and Toivonen T (2023) How to best map greenery from a human perspective? Comparing computational measurements with human perception. Front. Sustain. Cities 5:1160995. doi: 10.3389/frsc.2023.1160995
Received: 07 February 2023; Accepted: 18 April 2023;
Published: 11 May 2023.
Edited by:
Didit Okta Pribadi, Indonesian Institute of Sciences, IndonesiaReviewed by:
Yingru Li, University of Central Florida, United StatesAnzhelika Antipova, University of Memphis, United States
Copyright © 2023 Torkko, Poom, Willberg and Toivonen. This is an open-access article distributed under the terms of the Creative Commons Attribution License (CC BY). The use, distribution or reproduction in other forums is permitted, provided the original author(s) and the copyright owner(s) are credited and that the original publication in this journal is cited, in accordance with accepted academic practice. No use, distribution or reproduction is permitted which does not comply with these terms.
*Correspondence: Age Poom, YWdlLnBvb21AdXQuZWU=; Elias Willberg, ZWxpYXMud2lsbGJlcmdAaGVsc2lua2kuZmk=; Tuuli Toivonen, dHV1bGkudG9pdm9uZW5AaGVsc2lua2kuZmk=