 Gubu Muga
 Chong Liu2
 Penglai Ran
- 1College of Economics and Management, Mianyang Teachers’ College, Mianyang, China
- 2School of Public Administration, China University of Geosciences, Wuhan, China
- 3China–Africa Institute, China University of Geosciences, Wuhan, China
- 4College of Public Management, Guizhou University of Finance and Economics, Guiyang, China
As new progress has been made in urban–rural integration in recent years, the gap between urban and rural development in China has gradually narrowed. However, balancing urban–rural relations, especially accelerating rural development, remains a great challenge. Quantitative research on the level of urban–rural integrated development (URIDL) and its drivers is essential for establishing harmonious urban–rural relations. By utilizing a URIDL indicator system, vertical and horizontal scatter degree method and Geodetector methods, this study evaluates the URIDL in the three agglomerations in China’s Yangtze River Economic Belt from 2010 to 2019, and provides an in-depth exploration of their spatiotemporal evolution and its influencing factors. The results show that: (1) Overall, the URIDL has been on the rise from 2010 to 2019, but the Chengdu-Chongqing urban agglomeration (CYUA) is significantly lower than the Yangtze River Delta urban agglomeration (YRDUA) and the middle reaches of the Yangtze River urban agglomeration (MRYRUA). (2) In terms of spatial distribution, the URIDL exhibits a clear clustering effect, with high value areas concentrated in the east (north) and low value areas concentrated in the west (south). (3) The study found that the interaction effects of factors such as the proportion of non-agricultural population to total population (X1), per capita arable land area (X3), and industrial structure (X6) are significant, surpassing the impact of single factors. In addition, the volatility of industrial structure (X6) reflects the impact of China’s economic transformation on URID. This study provides scientific guidance for the high-quality development of urban–rural integration in urban agglomerations. It also provides important theoretical and practical references for optimizing regional development layouts and promoting the coordinated development of urban and rural areas.
1 Introduction
As an inseparable whole, the city and countryside are indispensable, based on their interdependence, mutual promotion, and assistance. Urban–rural integration strives for a harmonious blend and mutual penetration of urban and rural areas, aiming for full integration. It signifies the deepening and enhancement of urban and rural development coordination and integration (Zhang and Du, 2019; Li et al., 2018). Over the past 70 years, China’s urban–rural relations have moved from differentiation to integration (Zhang and Lu, 2018; Liu et al., 2021). Despite significant progress, challenges such as unbalanced development, inadequate rural advancement, limited bi-directional factor flow, and poor resource allocation persist, which hinder further integration (Zhan et al., 2023; He, 2018; Shuqian et al., 2022). Promoting the bi-directional flow of urban–rural factors, equalizing basic public services, and rationalizing resource allocation are crucial for implementing urban–rural integration strategies. This also poses a significant challenge to the governance capabilities of all levels of government. For localities, as the primary implementers of these policies, effectively planning development, formulating policies, and optimizing the flow and allocation of resources are key to advancing urban–rural integration. Thus, it is urgent and necessary to conduct a scientific quantitative assessment of URIDL, to analyze its current characteristics, evolutionary trends, and driving factors, and to formulate targeted policy recommendations based on these findings.
The disparities in socioeconomic development across countries have resulted in divergent characteristics of urban–rural development, thereby expanding the scope of related research. In contrast to the evolution of urban–rural relations in China, the trajectory of urban–rural relations in foreign countries typically encompasses a cyclical process of “integration-separation-integration.” Within this context, approaches such as “urban bias,” “rural bias,” and “balanced development” have emerged. Despite the fact that they discuss urban–rural interactions, these theories do not deeply explore urban–rural integration. While explorations into urban–rural social welfare (Cattaneo et al., 2022), land use (Boudet et al., 2020), population mobility (Zarifa et al., 2019), and public services (Rickardsson, 2021), the breadth of research remains somewhat narrow. Conversely, research in China primarily focuses on theoretical analysis (Xiao et al., 2017; Liu et al., 2016; Fang, 2022; Cao et al., 2021), implementation strategies (Chen et al., 2022; Long et al., 2011; Shi and Wu, 2024), and policy development (Liu et al., 2022; Li, 2012). Recently, innovations in research methods have led to a growing focus on quantitative analysis of URID, emphasizing the development of a comprehensive evaluation index to analyze its spatio-temporal dynamics. Most studies are conducted at provincial and municipal levels, revealing significant regional disparities in URIDL within China (Liu et al., 2013; Yang et al., 2021; Zhou et al., 2020; Zhao and Jiang, 2022). High-level areas predominantly lie in the east, with lower-level areas in the central and western regions, showing a gradient from southeast to northwest. Farther research (Zeng and Chen, 2023) have highlighted regional variations in types of urban–rural integration, with the eastern region notably outpacing the central and western regions. Spatial analysis (Zhou et al., 2020; Zhou et al., 2019) shows an annual increase in URIDL, along with notable spatial agglomeration effects. There is also evidence of club convergence and internal differentiation, with higher values predominantly in the east and lower values in the central and western regions.
Considering China’s vast geographical and significant environmental variations, it is crucial to tailor URID studies to local conditions (Shi et al., 2022). Municipal research indicates specific spatial distribution patterns in China’s URIDL. The Hu Huanyong Line and Kunlun-Qinling-Huaihe Line divide regions showing distinct patterns: high URIDL in the east and north, and low in the west and south (Liu et al., 2015). Building on this, researchers have studied the spatiotemporal evolution of URID in the Qinling-Daba Mountains region over the last decade, which revealed spatial imbalances, i.e., with high URIDL values in the west and low values in the east (Wu and Cui, 2016). Additionally, studies (Rao and Gao, 2022; Shan et al., 2022; Sun and Yang, 2022; Ma et al., 2020; Muga et al., 2023; Yang et al., 2021) in various municipal-level cities across China have shown that higher URIDL values tend to cluster in economically prosperous areas along railways, coastlines, and in urban agglomerations. Although the aforementioned studies have provided extensive quantitative research on URIDL, these studies mostly focus on the provincial and municipal levels, with relatively limited research at the scale of urban agglomerations. Existing research primarily centers on individual urban agglomerations. For example, in the Beijing-Tianjin-Hebei urban agglomeration, studies using coupling coordination models and obstacle diagnosis methods revealed that although the URIDL has generally increased, it exhibits a “core-periphery” spatial structure. Beijing and Tianjin drive integration in surrounding cities through their radiation effects, with the core of integration shifting from the east to the north, while southern cities, such as Shijiazhuang, have weaker driving effects (Zhang et al., 2021; Wu et al., 2025). In the CYUA, studies using entropy method and ESDA technology found that the URIDL is generally low, with only Chengdu and Chongqing showing clear advantages, while peripheral mountainous counties form low-value marginal areas, presenting a significant “core-periphery” gradient (Liu et al., 2024). For the YRDUA, research shows that the integration level exhibits an “inverted U-shaped” spatial differentiation, with core cities developing robustly, while peripheral cities lag behind (Shi et al., 2022; Shi et al., 2021). Additionally, spatial econometric studies in the Huaihai Economic Zone indicated that the integration exhibits enhanced agglomeration, with urban factors playing a leading role, but lower-tier cities are constrained by employment and policy environments, which reduces their development momentum (Zhang et al., 2020). However, these studies still have the following shortcomings: (1) Limitations in Research Objects: Existing studies mostly focus on the internal mechanisms of individual urban agglomerations and lack cross-regional comparative studies, making it difficult to systematically reveal the common patterns and regional heterogeneity in urban–rural integration evolution; (2) Limitations in Temporal Scale: Most existing studies rely on data from discontinuous years for cross-period comparisons, which lacks a detailed depiction of the continuous process of urban–rural integration, leading to insufficient precision in revealing its temporal and spatial changes; (3) Insufficient Analysis of Driving Mechanisms: Existing literature primarily focuses on the driving mechanisms within a specific study area, with insufficient attention to the spatial heterogeneity, factor coupling relationships, and policy response differences in different regions, limiting the depth of understanding of policy impacts.
To address these gaps, this study selects the three major national urban agglomerations in the Yangtze River Economic Belt—YRDUA, MRYRUA, and CYUA—covering 73 cities, for a cross-regional comparative analysis. The Yangtze River Economic Belt, as one of China’s key regional development strategies, spans the eastern, central, and western regions with significant economic development disparities, making it a representative area for this study (Ren and Tian, 2022). This research aims to fill the gap in cross-regional URID comparisons by revealing the differences and commonalities among urban agglomerations, and analyzing the driving factors under different policies and economic conditions. Using panel data from 2010 to 2019, this study systematically reveals the spatio-temporal evolution characteristics of urban–rural integration in the three urban agglomerations of the Yangtze River Economic Belt and further explores the key driving factors and regional differences. These findings will provide empirical evidence for promoting coordinated regional development and formulating targeted policy measures.
2 Materials and methods
2.1 Study area
The Yangtze River Economic Belt extends across eastern, central, and western China, encompassing nine provinces and two centrally administered municipalities, covering an area of about 2.05 million square kilometers. It represents over 40% of the national population and GDP, benefiting from excellent geographical conditions, plentiful natural resources, and a robust industrial base. Specifically, the Yangtze River Delta, Middle Yangtze River, and CYUA are typical and representative national key urban agglomerations situated in the upper, middle, and lower reaches of the Yangtze River, which correspond to the eastern, central, and western parts of China and include 71 municipal-level cities and two directly administered municipalities (Figure 1).
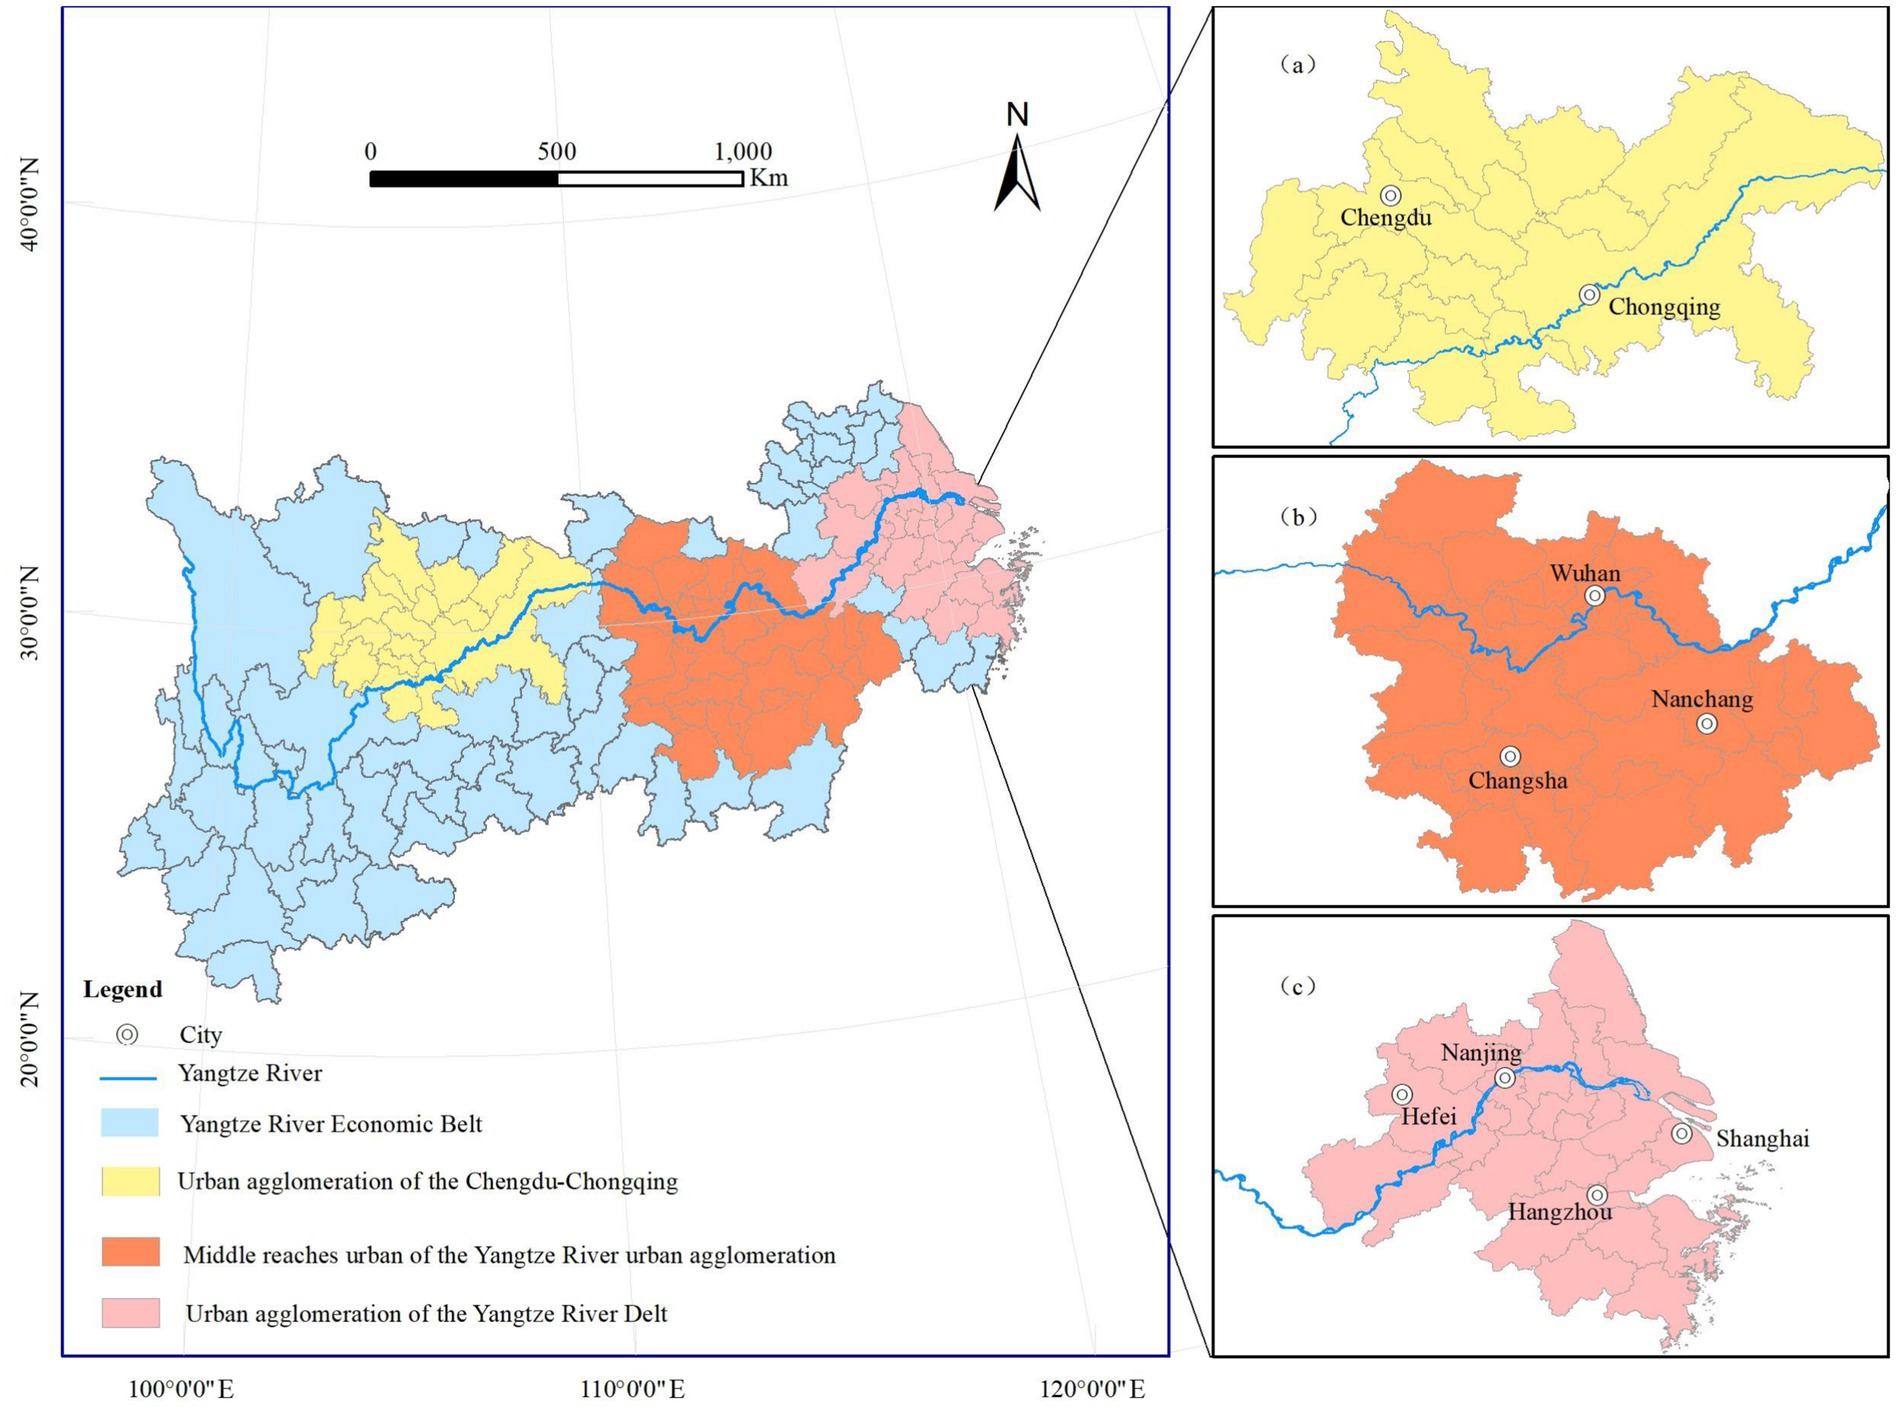
Figure 1. Spatial distribution of the three major urban agglomerations within the Yangtze River Economic Belt (YREB). (a) CYUA, Chengdu–Chongqing Urban Agglomeration; (b) MRYRUA, Middle Reaches of the Yangtze River Urban Agglomeration; (c) YRDUA, Yangtze River Delta Urban Agglomeration.
The CYUA acts as a critical ecological barrier in the upper Yangtze River, linking east to west and forming a vital transportation hub between north and south (Figure 1A). It spans approximately 185,000 km2, includes 15 cities from Sichuan and the municipality of Chongqing, and had a population of about 95 million in 2019, with a GDP of 6.1 trillion yuan (6.15% of the national total). The region’s economy is supported by pillar industries such as electronics, automotive, and equipment manufacturing; The MRYRUA, located in central China, covers 326,100 km2 across Hubei, Hunan, and Jiangxi, with a population of 133 million and a GDP of 9.36 trillion yuan (9.4% of the national total). It benefits from favorable geography, transport, and educational resources, and its economy is driven by manufacturing, aviation, metallurgy, and petrochemicals; The YRDUA, as China’s most economically advanced urban agglomeration, covers 211,700 km2 with 238 million people, and reached a GDP of 23.7 trillion yuan in 2019 (23.9% of the national total), dominated by the digital economy, finance, and high-end manufacturing. These three urban agglomerations differ significantly in economic development, geography, and urban–rural interaction. The YRDUA represents a mature integration model, the MRYRUA reflects a transitional pattern, while the CYUA relies heavily on national policy. This regional heterogeneity provides a valuable comparative foundation for studying spatial disparities and driving mechanisms of urban–rural integration. Therefore, it is necessary to analyze their spatiotemporal dynamics and driving forces to support evidence-based policy formulation and promote high-quality development across the Yangtze River Economic Belt.
2.2 Data sources
The primary data sources for this study are the China Urban Statistical Yearbook and the provincial and municipal statistical yearbooks within the Yangtze River Economic Belt. Additional data were derived through calculations based on yearbook figures. NDVI data, with a resolution of 1 km, were sourced from the United States Geological Survey (USGS).1 Land use data, covering construction and arable land, come from the 2010–2019 China Land Cover Dataset at a resolution of 30 m x 30 m (Yang and Huang, 2021). Land use data were precisely extracted using ArcGIS software by clipping to the administrative boundaries of the three major urban agglomerations, standardizing coordinates to WGS1984. Slope data, using Feng Zhi Ming’s method (Feng et al., 2007), were acquired via ArcGIS, clipped to the administrative boundaries of the urban agglomerations. This raster data covers 2010–2019, with a resolution of 10 km x 10 km, and coordinates standardized to WGS1984. Missing data were addressed using linear interpolation to ensure data continuity and integrity.
2.3 Methods
2.3.1 Evaluation of the URIDL
2.3.1.1 Construction of indicator system
Urban–rural integration has evolved beyond the simple models of industry promoting agriculture and cities leading villages into a multidimensional and comprehensive concept. To scientifically assess URIDL, this study selected 17 indicators across five dimensions—economic, social, cultural, spatial, and ecological integration—based on urban–rural integration concepts and literature reviews (Yang et al., 2021; Zhou et al., 2019; Rao and Gao, 2022) (Table 1). Additionally, URID indicators are categorized into comprehensive and comparative types. Comprehensive indicators reflect the overall development of urban and rural regions, whereas comparative indicators highlight the differences between these areas. Both types of indicators are essential and complementary. Without comparative indicators, the results might only reflect overall regional development while diverging from specific research goals. Similarly, the absence of comprehensive indicators could skew the results away from intended goals.
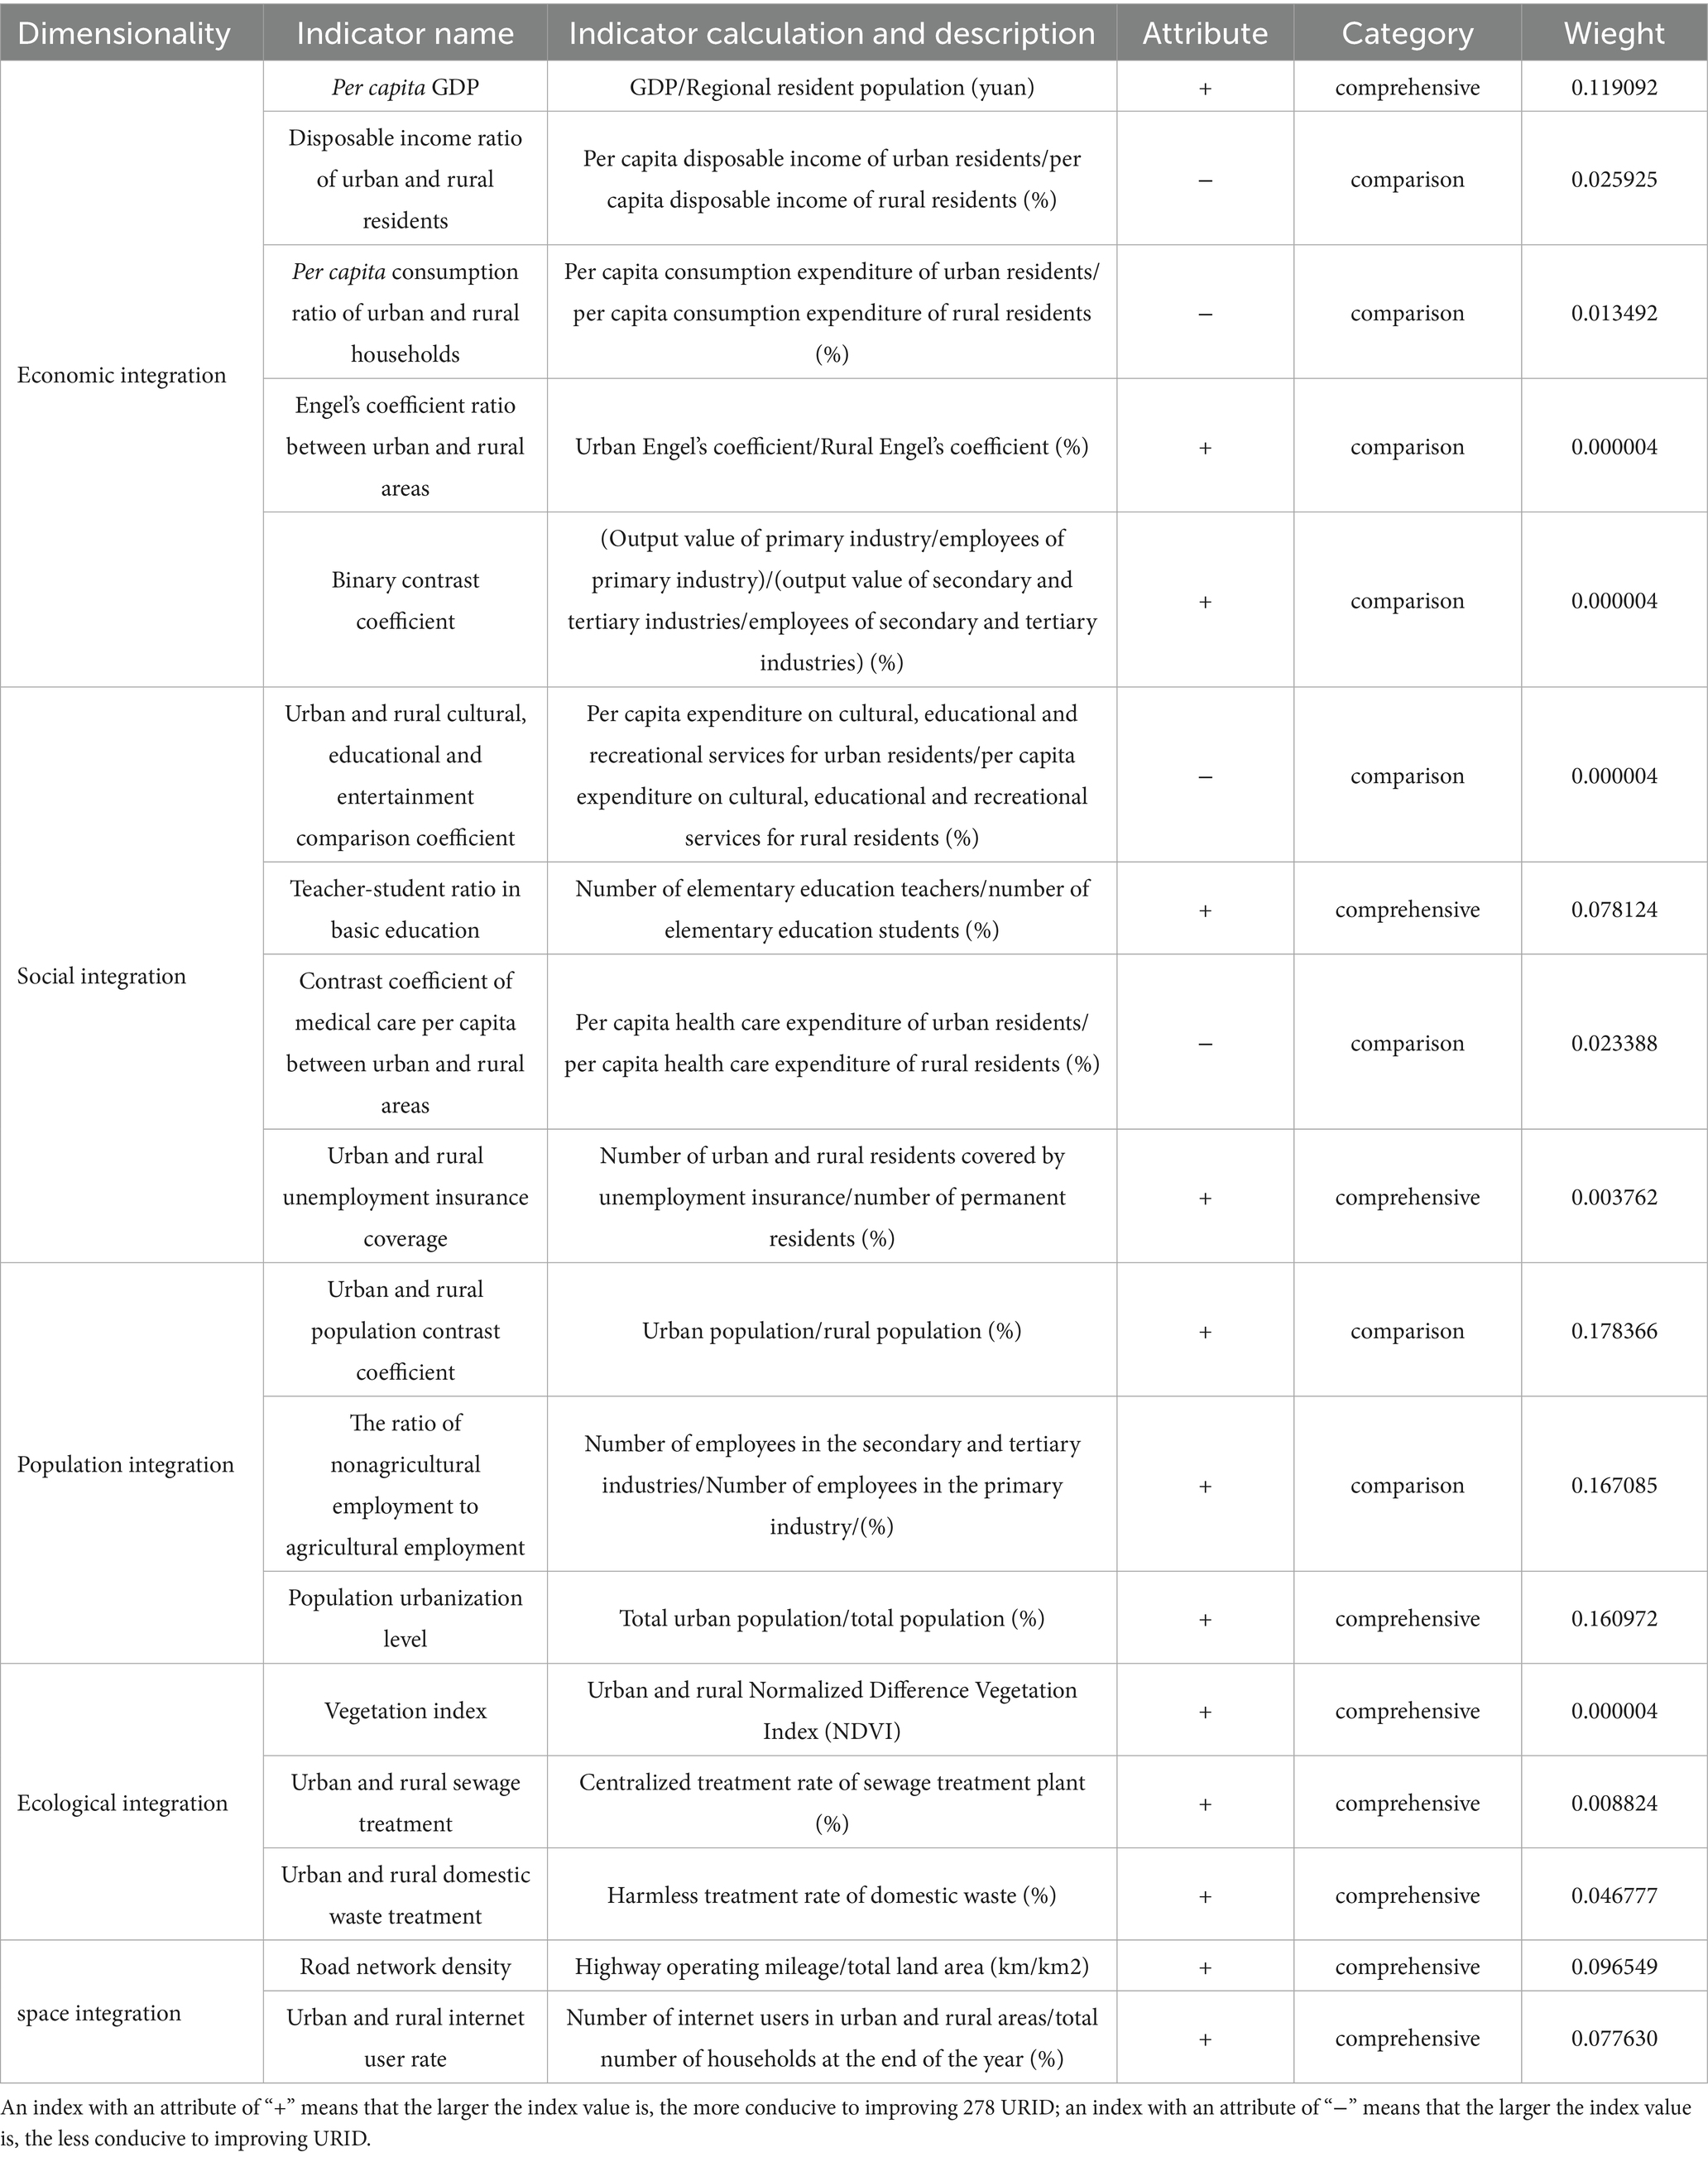
Table 1. Indicator system for urban–rural integration development level (URIDL) measurement.
2.3.1.2 Comprehensive measurement method
Multiple approaches have been applied to measure the URIDL, including principal component analysis (PCA), entropy method, and analytic hierarchy process (AHP). While these traditional methods offer insights into multidimensional evaluation, they generally rely on static cross-sectional data and subjective weighting schemes, which limit their ability to capture longitudinal variation and dynamic processes. In contrast, the Vertical-and-Horizontal Scatter-Degree Method provides a dynamic evaluation framework that integrates both temporal and spatial variation. It not only reveals the disparity among cities at a given time but also reflects the evolution of integration over time. This method mitigates subjective bias, enhances comparability across years, and is particularly suited for studies involving panel data and urban agglomeration scales (Guo et al., 2015). All simulations were performed using Matlab R2024a. The specific model is as follows (Equations 1–4):
Where T is the research year, is the number of cities, is the number of indicators, and the eigenvector u corresponding to the largest eigenvalue of the matrix H is the weight determination vector. After u is obtained, normalization is performed. At this time, takes the maximum value. This determines the weight vector u, where u(w1, w2, w3, w4, wn). Among these terms, t is the research year, n is the research city, n is the number of indicators in the study, and gti is the urban–rural integration degree of the ith city in the tth year. The weight of each index is multiplied by the corresponding standardized index value of the city in the current year to obtain the urban–rural integration degree of the ith city in the tth year.
2.3.2 Detection of spatial–temporal characteristics of URIDL
2.3.2.1 Trend-surface analysis
Trend-surface analysis is a mathematical-geographic method that fits a polynomial surface to spatial data to reveal overall spatial tendencies and directional patterns. It is especially useful for visualizing and interpreting the spatial evolution of geographical phenomena over large regions. In this study, trend-surface analysis is used to simulate spatial and temporal variation in urban–rural integration levels (URIDL) across the three major urban agglomerations from 2010 to 2019. The approach helps capture the east–west and north–south gradient structures of URID. Let (xi, yi) represent the spatial coordinates of the ith municipality, where Zi (xi, yi) is the trend function. The X-axis corresponds to the east–west direction and the Y-axis to the north–south direction. All simulations were performed using Matlab R2024a.
2.3.2.2 Spatial autocorrelation analysis
Exploratory Spatial Data Analysis (ESDA) is widely employed to detect spatial dependence, clustering, and heterogeneity. Among its tools, Moran’s I index is a fundamental statistic that quantifies the degree of spatial autocorrelation (Anselin, 2019). This study applies both Global Moran’s I (to assess the overall spatial dependence of URIDL across the study area) and Local Moran’s I (to identify localized clusters or outliers). These two indicators together reveal not only whether spatial clustering exists, but also where it is concentrated. This dual-level approach helps uncover both macro and micro spatial patterns in urban–rural integration development. All spatial autocorrelation analysis was conducted using ArcGIS 10.8. The Moran’s I index consists of Global Moran’s I and Local Moran’s I, modeled as follows (Equations 5, 6):
Here, xi and xj are the observed geographical attributes of regions i and j, respectively, and represents the mean of these observations. n is the number of sampled cities, and S2 represents the sample variance. Ωij, the element of the spatial weight matrix, equals ωij = 1/dij2 with dij being the Euclidean distance between the centroids of cities i and j. The Global Moran’s I index (I) ranges from −1 to 1. A positive I (>0) indicates spatial clustering of similar attributes; a negative I (<0) indicates clustering of dissimilar attributes; an I of 0 suggests random spatial distribution of attributes. The Local Moran’s I index (Ii) measures the similarity between a location’s attribute value and that of its immediate neighbors. An Ii > 0 suggests spatial clustering of similar values locally, an Ii < 0 indicates clustering of dissimilar values, and an Ii = 0 implies a random spatial distribution.
2.3.3 Analysis of driving mechanisms of URIDL
2.3.3.1 Selection of potential driving factors
From a systemic perspective, urban–rural integration constitutes a complex system where cities and rural areas, as fundamental components, are interconnected and interact (Li et al., 2019). Cities rely on rural areas for resources, labor, and markets, whereas rural revitalization depends on urban support and guidance (Huang, 2018). Within this system, the flow and allocation of elements like people, land, money, and industry are key drivers of URID and are essential for effective urban–rural integration (He, 2018). Urban–rural integration involves not just the merging of physical spaces but also the exchange and sharing of elements like people, land, money, and industry between urban and rural settings. Therefore, this study identifies eight key variables—labor force, land, capital, industry, business environment, and terrain—as independent variables X, to comprehensively assess their impact on URIDL (dependent variable Y) (Table 2). This analysis aims to elucidate the mechanisms by which these key factors role in urban–rural integration and to provide a decision-making foundation for policymakers.
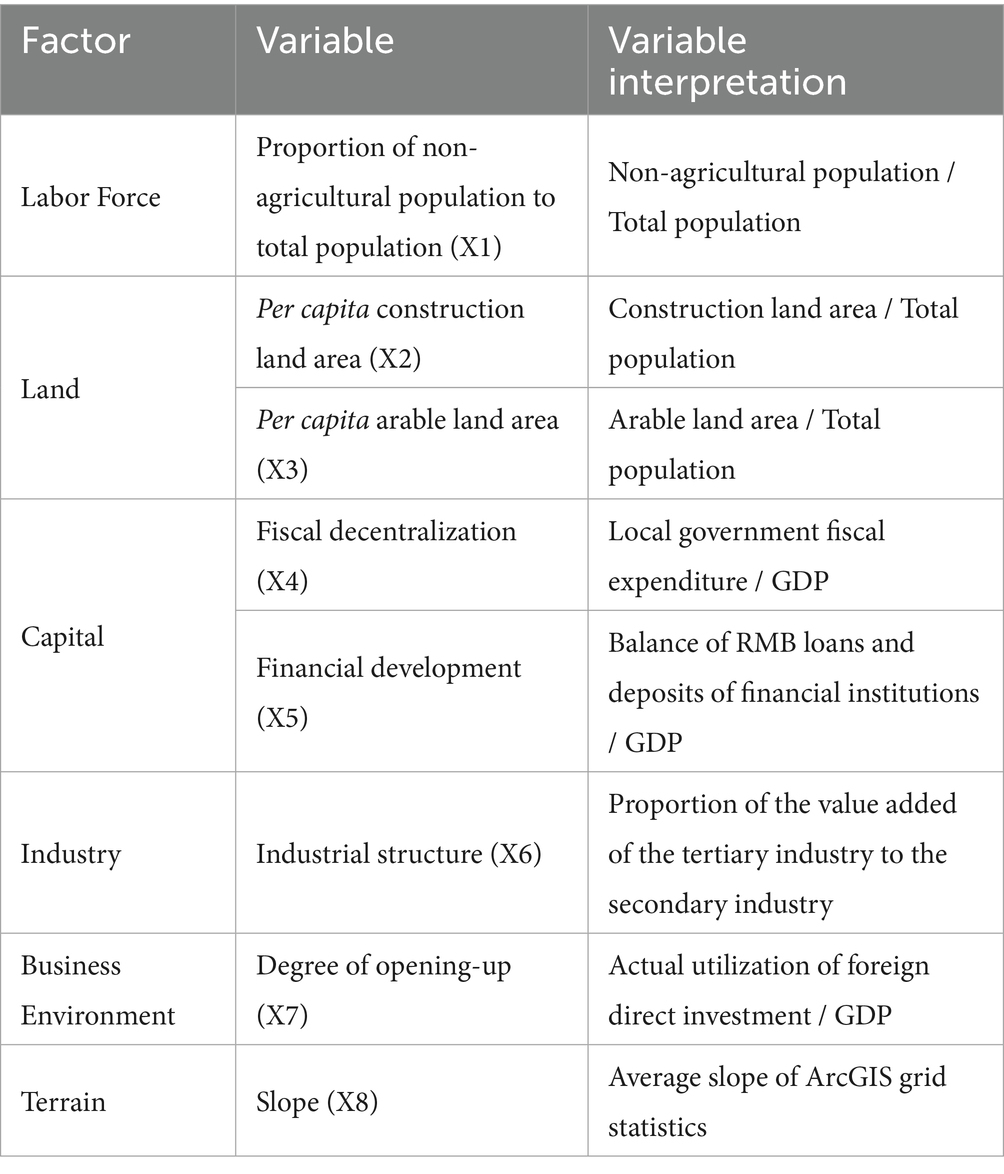
Table 2. Potential influencing factors of urban–rural integration development level (URIDL).
2.3.3.2 Quantitative identification of driving factors
Geodetector is a statistical tool designed to assess the spatial stratified heterogeneity and to identify the factors that significantly influence spatial patterns. It is particularly suited for geographic problems involving complex interactions among variables. The factor detection module is used to quantify the explanatory power of each variable with respect to URIDL, while the interaction detection module identifies synergetic or nonlinear enhancement effects between variables (Wang and Xu, 2017). A major advantage of Geodetector is its compatibility with both qualitative and quantitative data. In this study, the model is applied to assess the main influencing factors of URIDL and uncover their regional differentiation mechanisms in the Yangtze River Economic Belt. The Geodetector analysis was performed using the “geodetector” package in R. The specific models used for detection are as follows (Equations 7, 8):
In the formula, L denotes the strata for the URID index Y or the influencing factor X, representing the number of categories or zones. N and Nh are the sample sizes for the entire region and for stratum ℎ respectively, indicating the number of research units in the entire urban agglomerations and in each stratum. and signify the variances of the entire study area and of stratum h, respectively. SSW and SST represent the within-stratum variance and the total variance of the entire region, respectively. q measures the degree of influence of a factor on URID, ranging from 0 to 1. A higher q value indicates stronger explanatory power for URID. A q of 0 suggests no relationship with URID, whereas a q of 1 implies complete explanatory power over URID’s distribution.
3 Results
3.1 Temporal and spatial changes in URIDL
From 2010 to 2019, the overall URIDL in the three major urban agglomerations of the Yangtze River Economic Belt exhibited an upward trend. Specifically, the CYUA’s URIDL rose significantly, recording an average annual growth rate of 6.4%. The MRYRUA maintained steady growth, with an average annual growth rate of 4.5%. Meanwhile, the YRDUA continued to lead with an average annual growth rate of 3.8%, indicating a consistent upward trend. Overall, the development trend ranks as follows: YRDUA > MRYRUA > CYUA (Figure 2). These results reflect the effectiveness of major national strategies such as the “New Urbanization Plan,” the Rural Revitalization Strategy, and the regional coordinated development plans, which collectively promoted the narrowing of urban–rural gaps and sustained improvements in integration level.
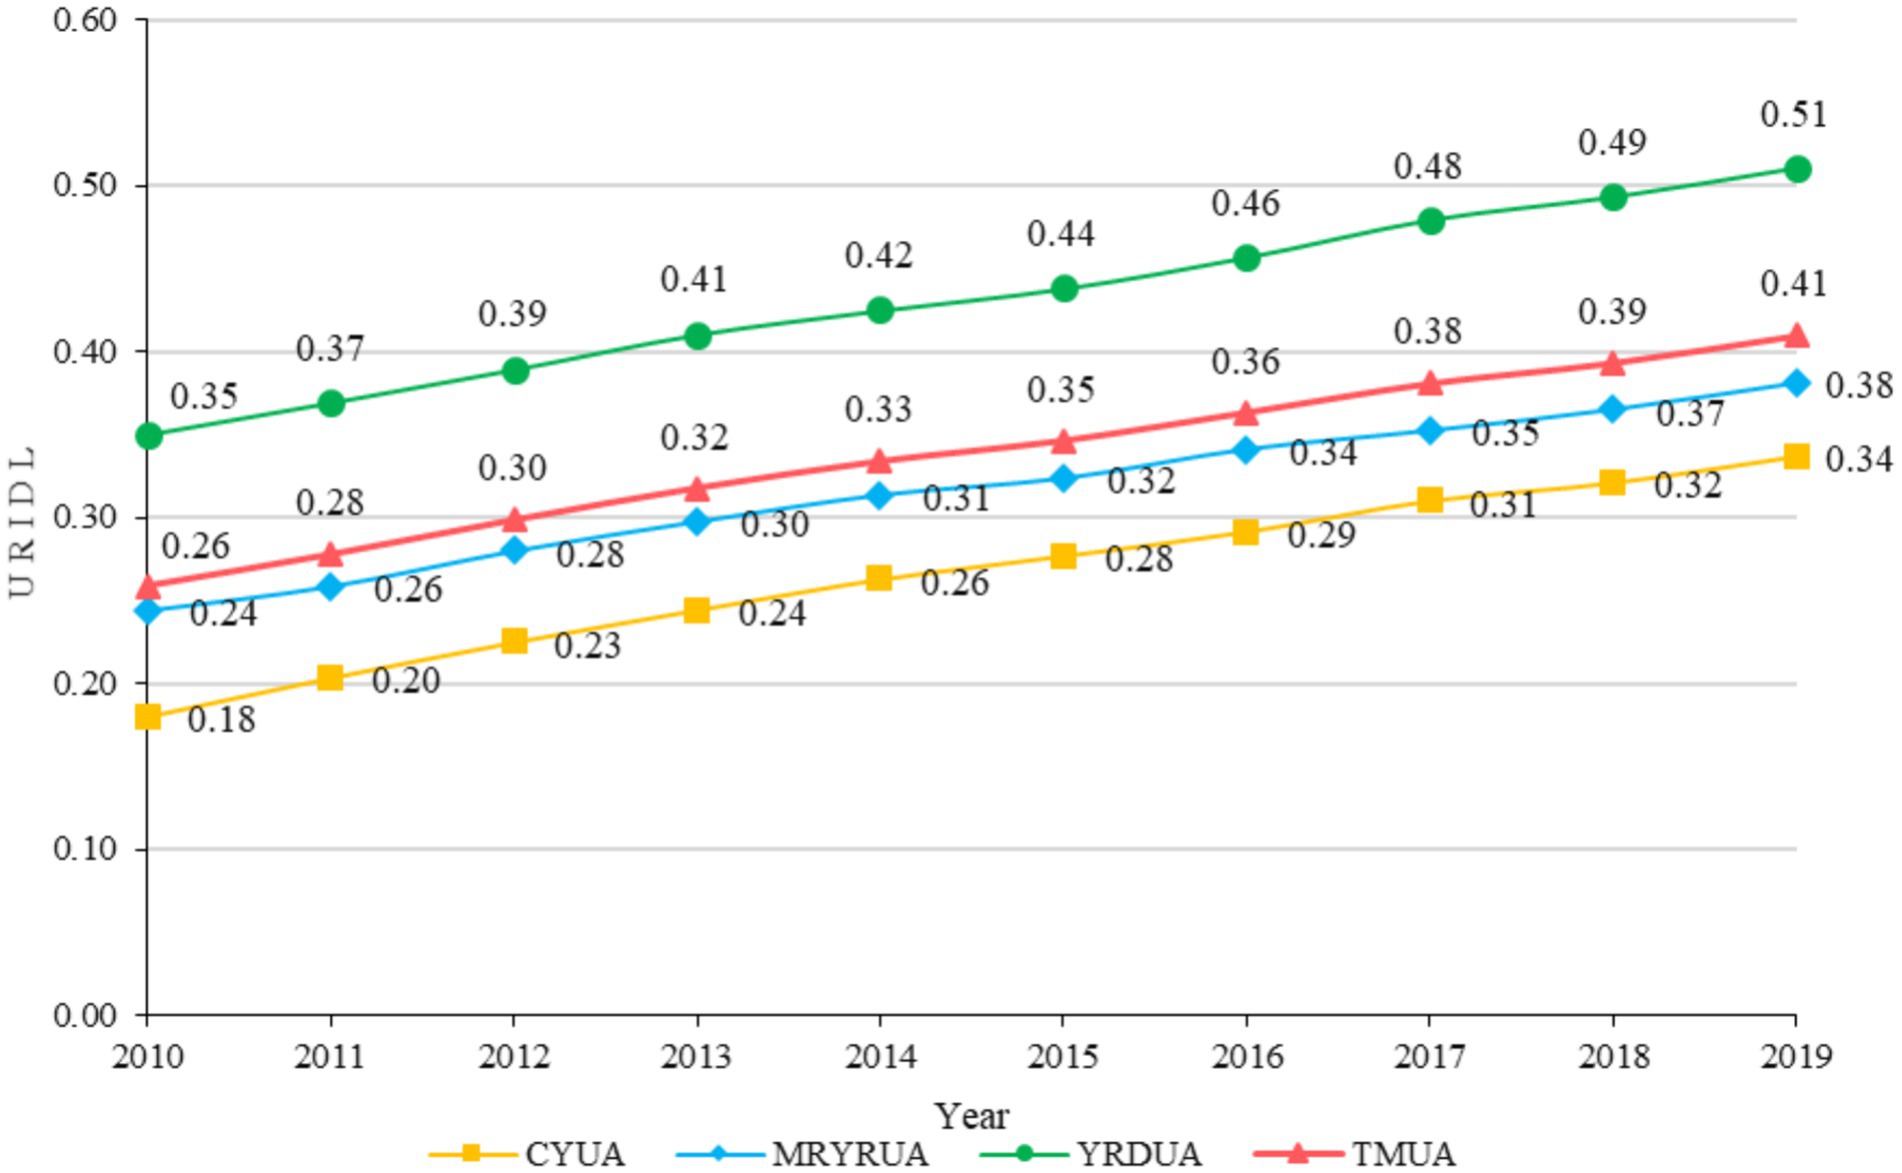
Figure 2. Temporal evolution of urban–rural integration development level (URIDL) in the three major urban agglomerations (2010–2019). CYUA, Chengdu-Chongqing urban agglomeration; MRYRUA, Middle Reaches of the Yangtze River urban agglomeration; YRDUA, Yangtze River Delta urban agglomeration. TMUA, Three Major Urban; Values represent the annual mean URIDL scores for each region.
To further reveal the spatial characteristics, trend surface analysis was used to visualize the spatial evolution of URIDL. The results show that the integration level exhibits a clear spatial gradient, decreasing from east to west and increasing from south to north. Notably, cities like Shanghai, Suzhou, and Wuxi maintain the highest URIDL, while cities like Yaan and Yibin in the western CYUA show lower levels. The overall structure reflects the economic development gradient of the Yangtze River Basin, with eastern core cities radiating positive externalities toward the interior (Figure 3).
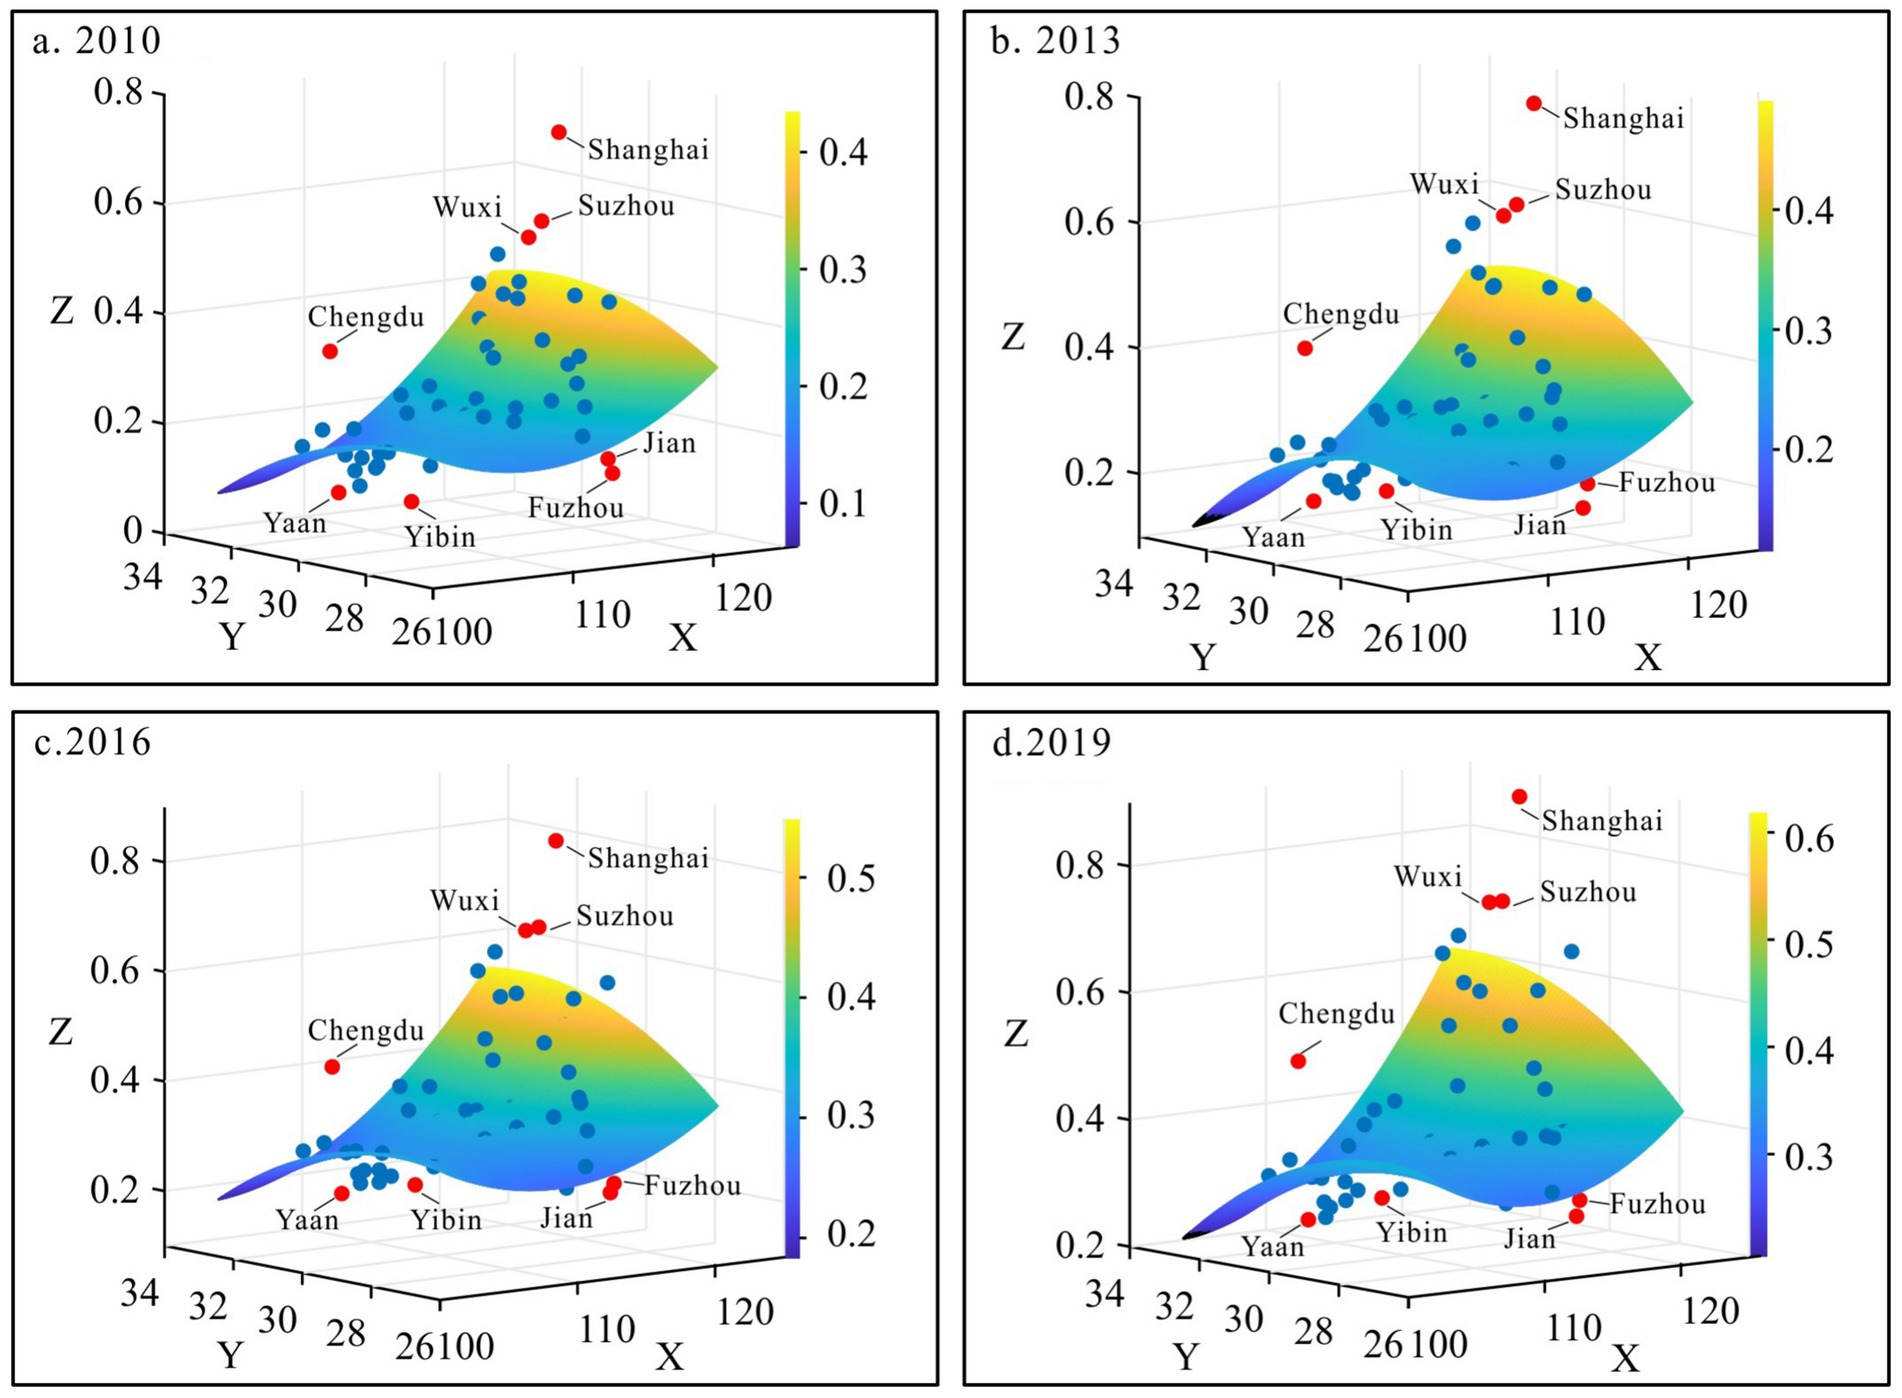
Figure 3. Trend surface analysis of URIDL in the three major urban agglomerations within the YREB (2010–2019). Subfigures correspond to: (a) 2010, (b) 2013, (c) 2016, (d) 2019. Z, urban–rural integration development level (URIDL); X = east–west axis; Y = north–south axis; ● dots represent cities.
3.2 Spatial dependency characteristics of URIDL
Using the Global Moran’s I index model and ArcGIS software, the Global Moran’s I index was calculated for URIDL across the three major urban agglomerations in the Yangtze River Economic Belt from 2010 to 2019. The results (Table 3) show that the Global Moran’s I index for these urban agglomerations was above 0, ranging from 0.3785 to 0.4310. Additionally, the annual p-values were all below 0.01, indicating that the global spatial autocorrelation is significantly positive in each year. This suggests that the spatial evolution of URIDL is not random but spatially dependent, confirming the presence of strong regional spillover or convergence mechanisms.
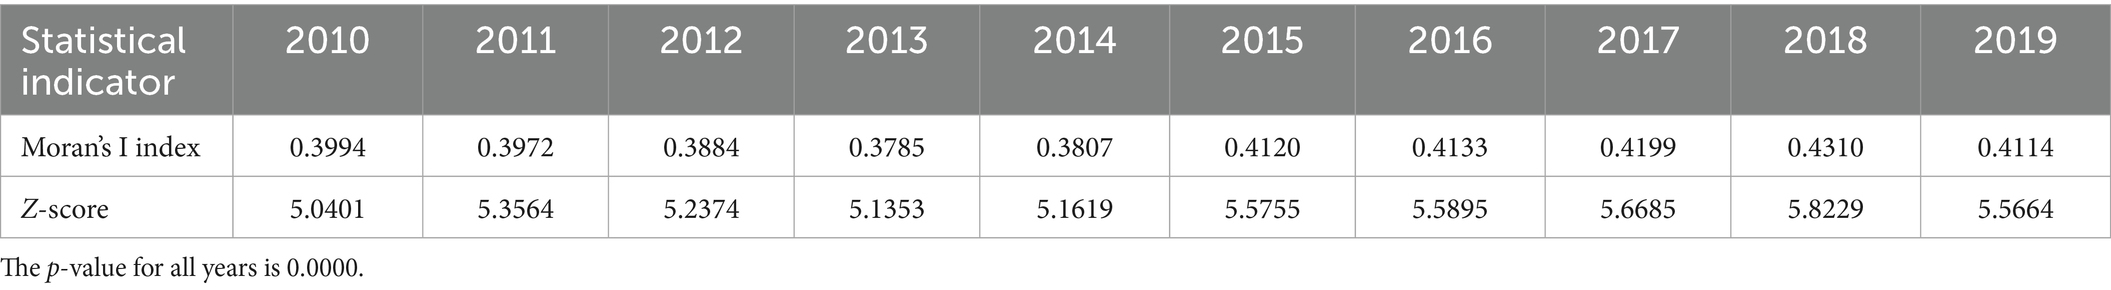
Table 3. Global Moran’s I index of urban–rural integration development level (URIDL) for the three major urban agglomerations (2010–2019).
To explore local patterns more precisely, the Local Moran’s I index was used. Four local spatial association types—HH (High-High), LL (Low-Low), HL (High-Low), and LH (Low-High)—were identified based on previous literature (Wu et al., 2025). The results (Figure 4) show a predominant presence of HH and LL clusters, suggesting simultaneous agglomeration of both highly and poorly integrated cities. Specifically, the YRDUA displays strong HH clusters in cities such as Shanghai, Suzhou, and Wuxi, forming a diffusion-driven integration belt. In contrast, the CYUA exhibits significant LL clustering in western cities like Yaan and Guang’an, indicating a persistence of low-integration states. These patterns suggest that cities with strong institutional, industrial, and infrastructural foundations tend to lead integration and positively influence adjacent areas, whereas lagging cities may face spatial inertia and low mobility.
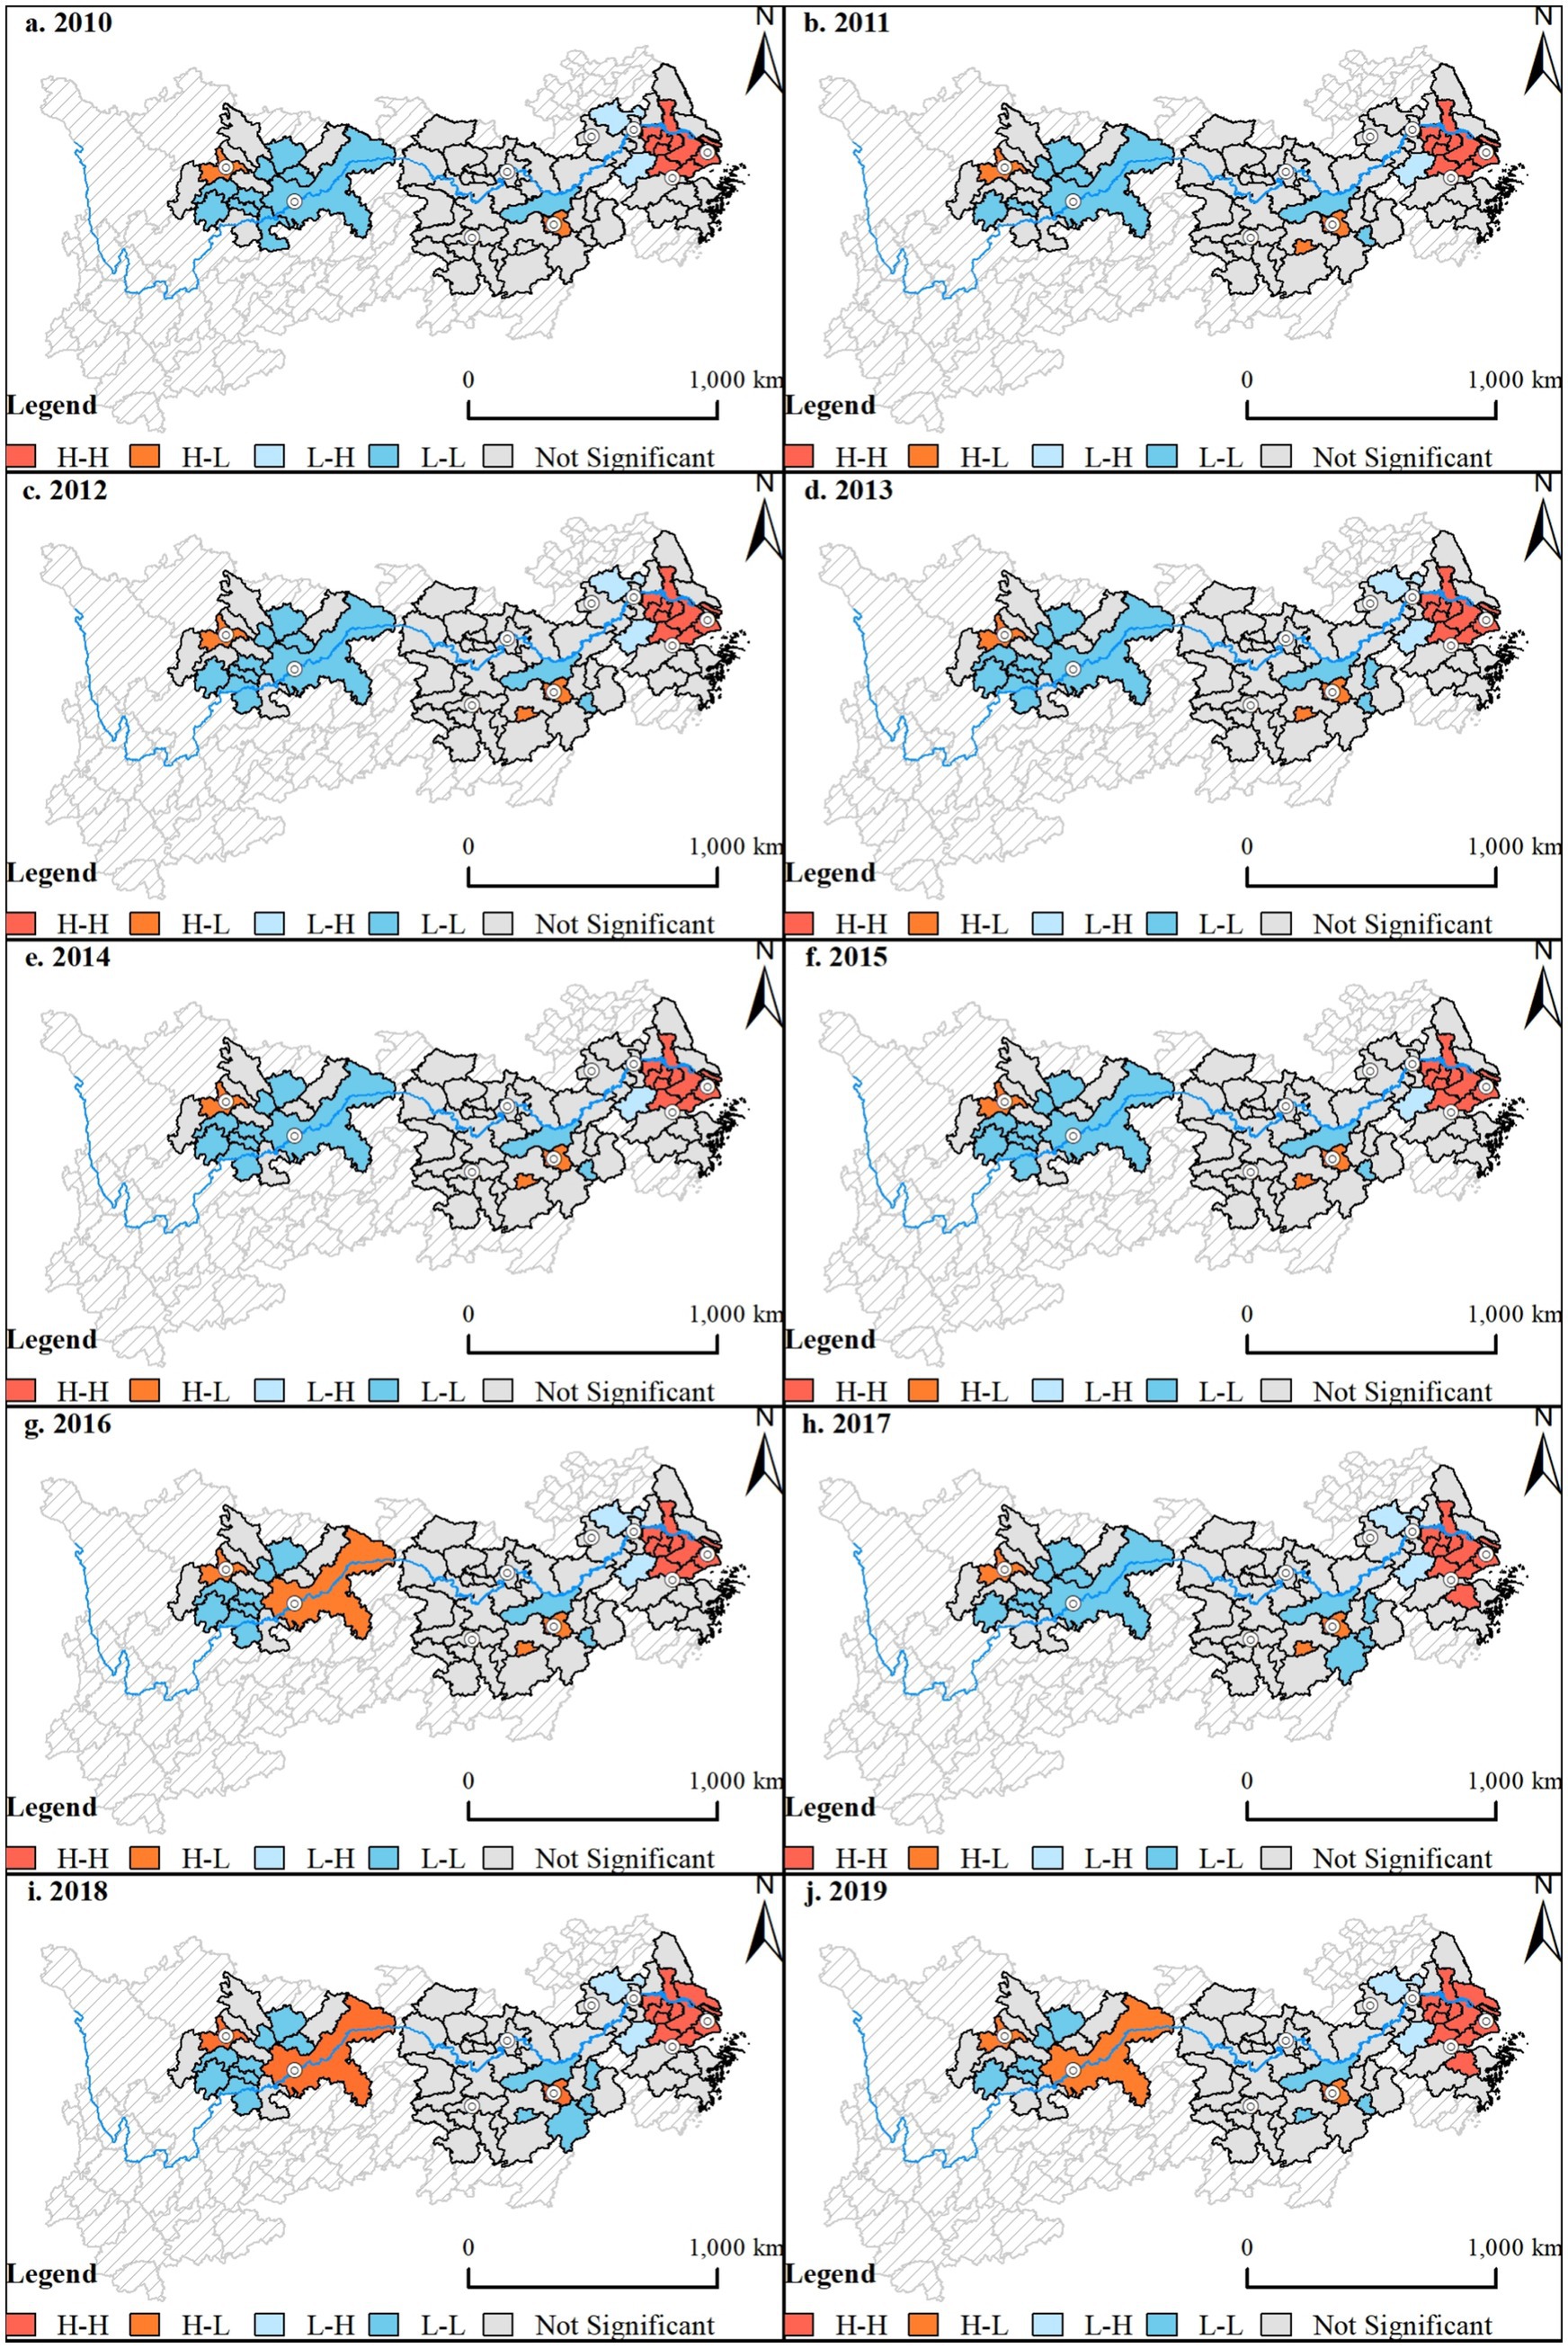
Figure 4. Spatiotemporal evolution of local spatial clusters of URIDL in the three major urban agglomerations (2010–2019). Subfigures (a-j) show annual progression from 2010 (a) to 2019 (j). HH, high–high cluster (a high value surrounded by high values); LL, low–low cluster (a low value surrounded by low values); HL, high–low outlier (a high value surrounded by low values); LH, low–high outlier (a low value surrounded by high values).
3.3 Impact of multidimensional factors on URIDL
3.3.1 Impact of a single factor
The single-factor detection analysis from 2010 to 2019 reveals that the dominant drivers of URIDL vary across urban agglomerations. In the CYUA, the industrial structure (X6) had the greatest explanatory power (Q = 0.5301), indicating that upgrading and transformation of industries play a pivotal role in promoting urban–rural economic integration. In the MRYRUA, the proportion of non-agricultural population (X1) ranked highest (Q = 0.4133), reflecting the decisive influence of population urbanization on resource allocation and spatial restructuring. In the YRDUA, X1 also ranked first (Q = 0.3965), followed by per capita arable land area (X3) and industrial structure (X6), underscoring the dual importance of demographic transformation and resource endowment. For the TMUA as a whole (d), per capita arable land (X3) emerged as the top contributor (Q = 0.4853), suggesting that land-based agricultural foundations remain crucial in shaping spatial integration at a national level (Figure 5A).
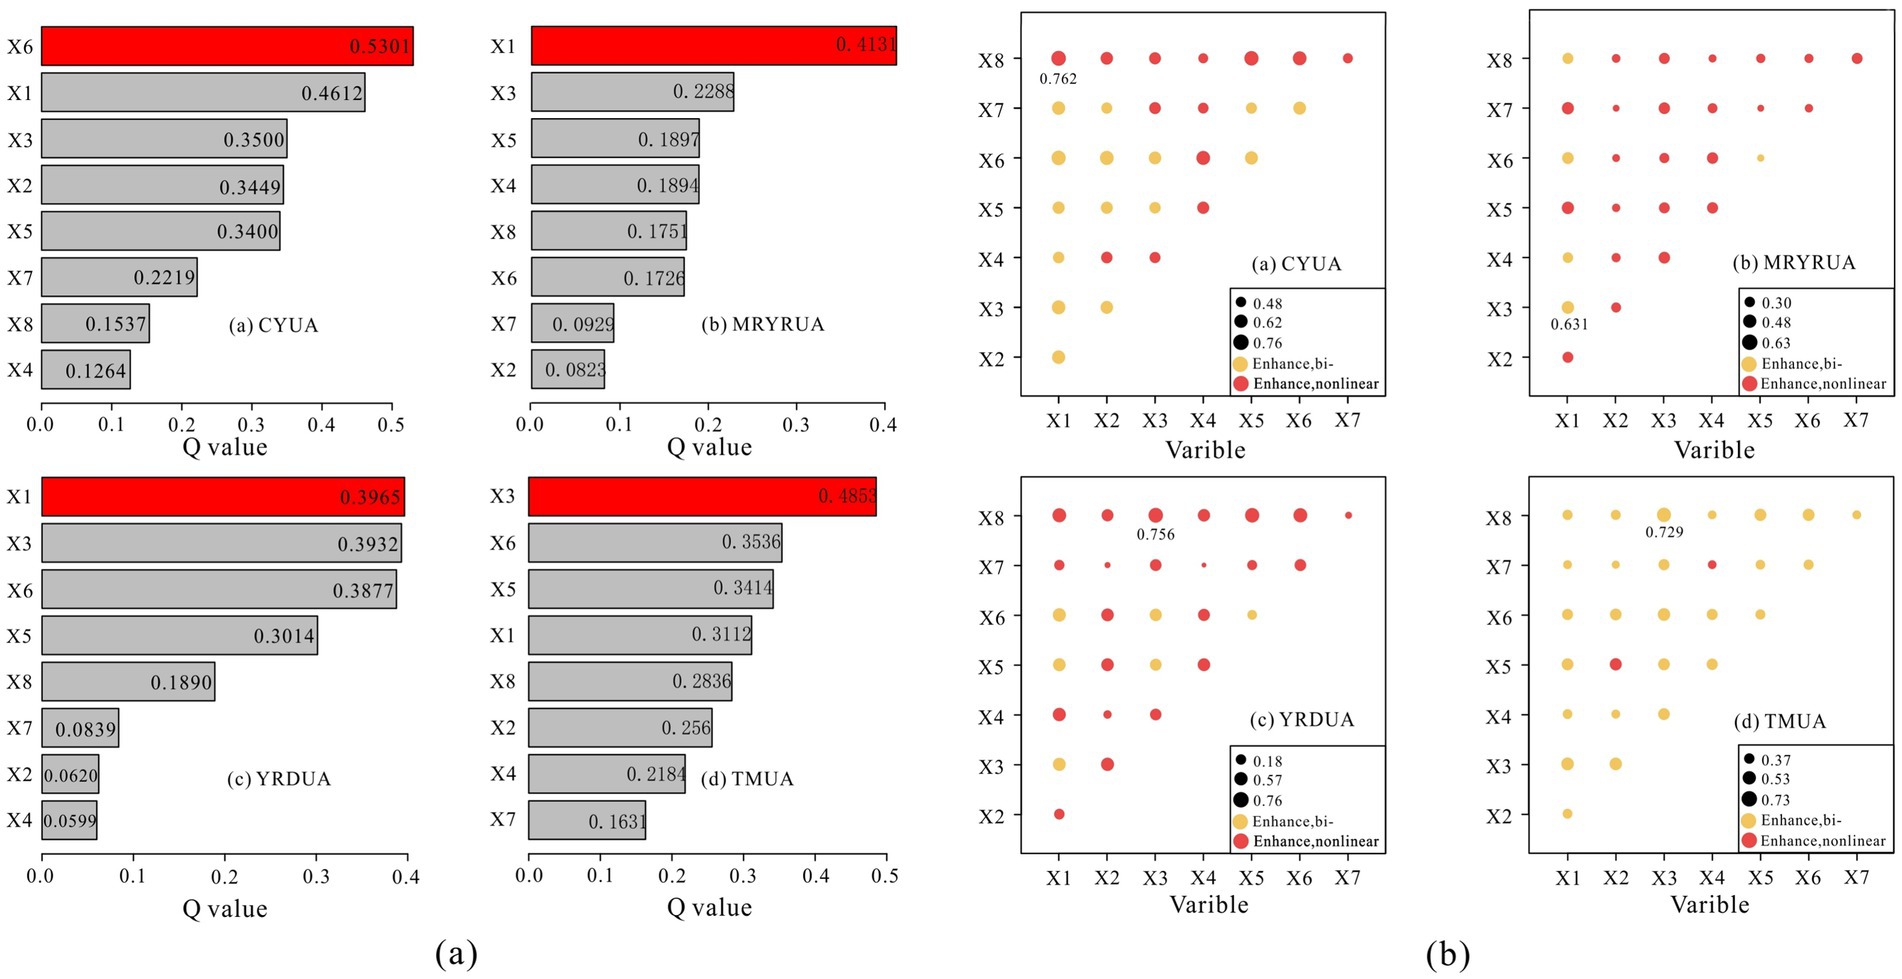
Figure 5. Detection results of driving factors influencing URIDL in the three major urban agglomerations: (a) single-factor explanatory power (Q values), and (b) interaction effects among factors. Panel (a) presents the Geodetector-based Q values for individual factors across CYUA, MRYRUA, YRDUA, and TMUA, indicating their relative explanatory strength. Panel (b) visualizes the interaction effects between paired factors, where color and size represent the magnitude and type of interaction (e.g., nonlinear or bivariate enhancement). CYUA, Chengdu-Chongqing urban agglomeration; MRYRUA, Middle Reaches of the Yangtze River urban agglomeration; YRDUA, Yangtze River Delta urban agglomeration; TMUA, Three Major Urban Agglomerations.
3.3.2 Interactive effects of multiple drivers
The interaction detection results demonstrate that bivariate combinations significantly enhance explanatory power compared to single factors. In CYUA, the interaction between slope (X8) and proportion of non-agricultural population (X1) reached the highest explanatory power (0.762), showing nonlinear enhancement (NE), which implies that geographic terrain constraints jointly shape integration outcomes with demographic transformation. In MRYRUA, the interaction of X3 and X1 had the strongest effect (0.631), characterized by bi-factor enhancement (BE), reflecting the coupling between land and labor in shaping integration capacity. In YRDUA, X8 and X3 was the dominant combination (0.756, NE), while at the TMUA level, the same combination X8 and X3 produced the highest explanatory power overall (0.729, BE), suggesting the spatial synergy between topography and land resources is the most critical compound driver across the entire study region (Figure 5B).
4 Discussion
4.1 Temporal and spatial evolution mechanism of URIDL
This study performed a detailed analysis of URIDL across the three major urban agglomerations within the Yangtze River Economic Belt to uncover the evolutionary mechanisms in both time and space. The findings indicate that URIDL not only varies distinctly over time but also differs significantly across the urban agglomerations (refer to Figures 2–5).
4.1.1 Mechanisms of temporal evolution of URIDL
From 2010 to 2019, URIDL across the three major urban agglomerations demonstrated a consistent upward trend. This result is in line with previous research that has shown a steady improvement in China’s urban–rural integration since the early 2000s. Some studies identified 2002 as the initial turning point, while others highlighted 2006 as the key moment when urban–rural policy adjustments began to yield visible effects. The alignment of these findings across different temporal and spatial scales supports a broader consensus that China’s sustained investment in rural development, poverty alleviation, and urbanization reform has significantly improved URIDL in recent decades (Yang et al., 2021; Muga et al., 2023). Although the national trend points to a general and continuous improvement in urban–rural integration, the Yangtze River Economic Belt demonstrates a distinct trajectory shaped by its river-basin characteristics, polycentric urban agglomeration structure, and developmental asymmetries, which together contribute to a regionally specific, stage-based pattern of integration. This trend is largely attributable to the Chinese government’s focus on the “three rural issues” and its sustained policy initiatives. Starting with coordinated urban–rural development and evolving through strategies like new countryside initiatives, urban–rural integration, targeted poverty alleviation, new urbanization, and rural revitalization, these policies have provided solid institutional support and a strong policy drive for URID. The deepening implementation of these policies has collectively enhanced URIDL in the three major urban agglomerations. Key factors including the proportion of non-agricultural population (X1), per capita arable land (X3), and industrial structure (X6) significantly contributed to this trend during this period (refer to Figure 5A). As urbanization progresses, agricultural land is increasingly converted to urban land, providing more space and resources for urban development. This trend has been widely documented not only in China but also in other developing countries. For instance, a study in Khulna City, Bangladesh, revealed that rapid urban expansion significantly transformed agricultural land into urban use, reshaping local land-use dynamics and enhancing urban resilience. This transformation not only physically extended urban areas but also improved infrastructure provision and economic vitality, thereby strengthening the city’s socioeconomic resilience and optimizing its spatial resource allocation (Siddika and Sresto, 2025). Similarly, recent studies have identified comparable phenomena in the Yangtze River Delta and other rapidly urbanizing regions in China, where the large-scale conversion of farmland to construction land has markedly reshaped the urban–rural spatial relationship and reallocated land-based resources (Niu et al., 2022; Pan et al., 2023). These findings collectively underscore that land-use transitions driven by urbanization are both a catalyst and a consequence of evolving urban–rural interactions—often accompanied by challenges related to sustainability, ecological resilience, and socioeconomic equity. Furthermore, rational land allocation and agricultural modernization have revitalized rural economies. The optimization and upgrading of industrial structures have further reinforced the integration of urban and rural economies, ultimately enhancing the overall economic strength of urban agglomerations.
Although URIDL across the three major urban agglomerations has generally been increasing, it has shown distinct characteristics at different time periods. From 2010 to 2014, URIDL in the three major urban agglomerations rose quickly, largely fueled by China’s swift economic recovery post-global financial crisis, which positively impacted the social and economic levels of both urban and rural areas. In contrast, from 2014 to 2019, the growth rate of URIDL in these agglomerations slowed, entering a phase of steady growth. This slowdown aligns with the Chinese economy transitioning to a “new normal” phase, where URID emphasis shifted from quantity to quality, prioritizing sustainability and coordination. Moreover, an in-depth analysis of the driving factors’ tendency revealed that while most of the driving factors remained stable trend from 2010 to 2019, the industrial structure (X6) varied significantly, marking a turning point in 2014. This indicates that, guided by policy, China’s economy and industrial structure have transitioned to a “new normal,” focusing on adjustment and optimization. This transformation has not only bolstered economic stability but also revitalized URID, steering it toward high-quality and sustainable development (Table 4), a shift that is further evidenced by recent studies documenting a notable deceleration in both economic and carbon emissions growth between 2012 and 2017, driven by slower GDP growth, improvements in energy efficiency, and a transition from investment-led to consumption-oriented development. These macroeconomic transformations fundamentally reshaped the structural conditions for regional development, thereby offering a theoretical explanation for the moderated pace of urban–rural integration observed during this period (Zheng et al., 2019).
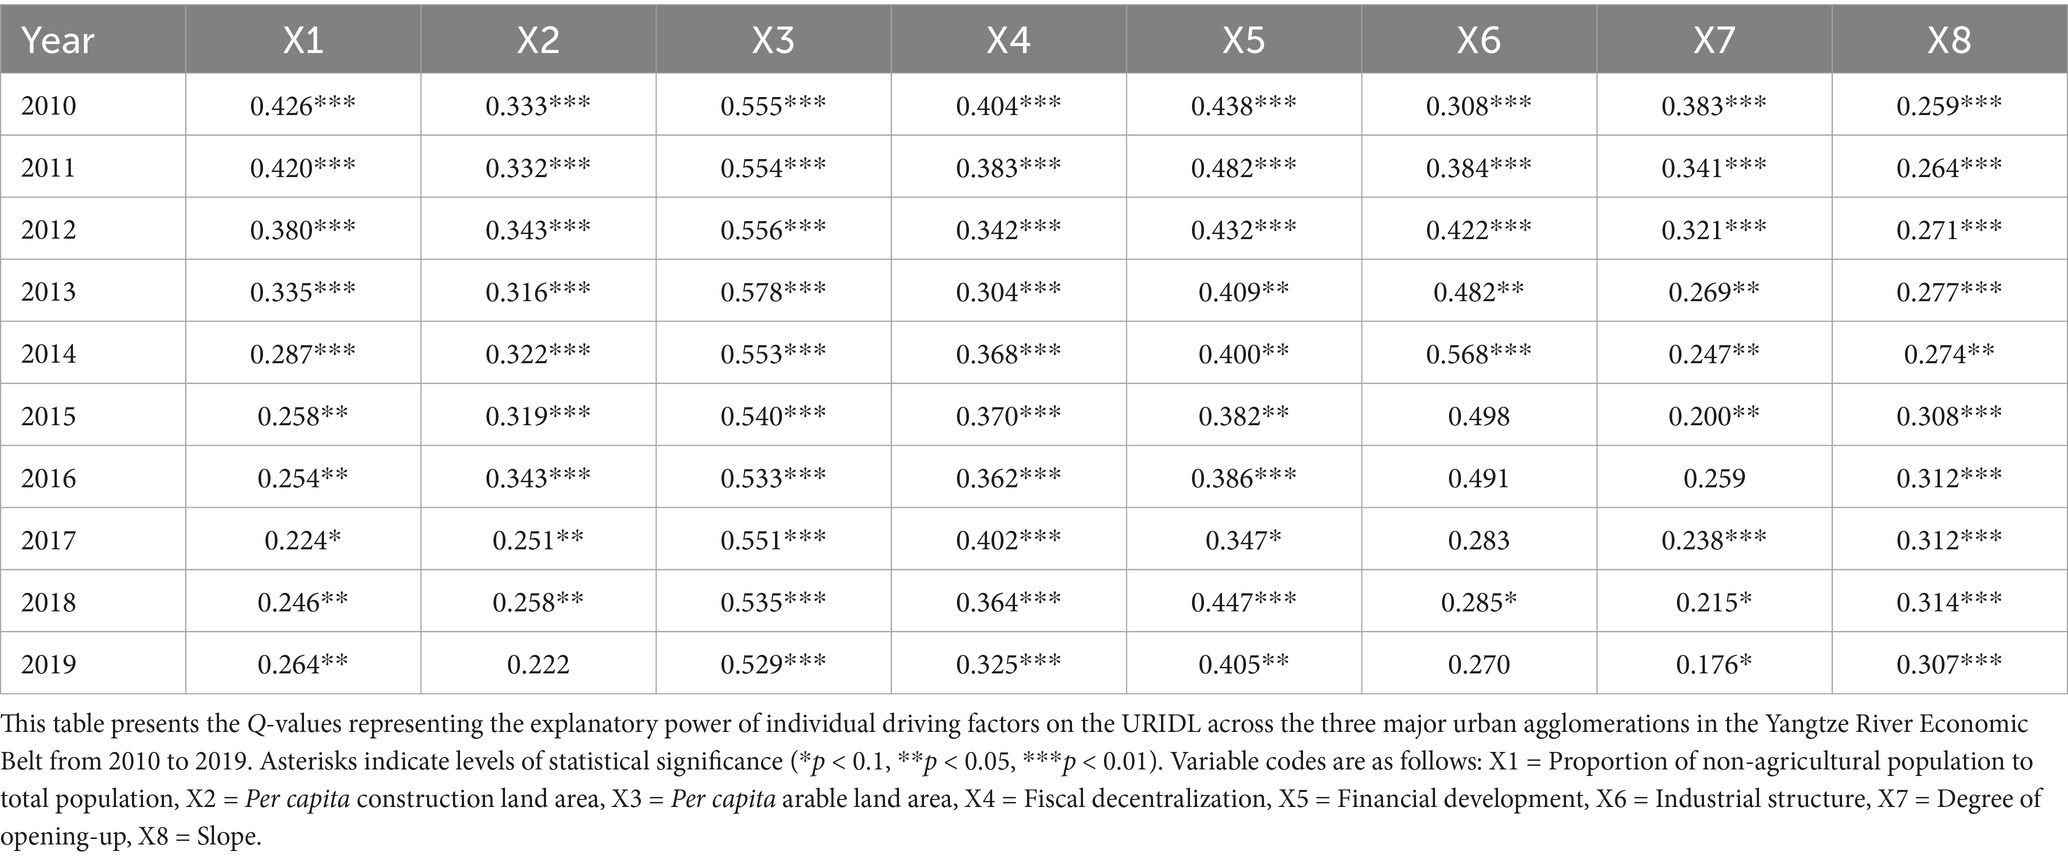
Table 4. Annual Q-values and significance of individual driving factors influencing URIDL in the three major urban agglomerations (2010–2019).
There are notable differences in the URIDL among the three major urban agglomerations. During the period from 2010 to 2019, the URIDL in the CYUA was approximately equivalent to that of the MRYRUA in 2010, while the MRYRUA exhibited a development level comparable to that of the YRDUA in 2010 (Figure 2). Detailed analysis shows that the YRDUA has utilized its geographical advantages and robust economic foundation to become a center for foreign trade, finance, and advanced manufacturing. The rapid growth of these high-value industries has driven GDP growth and strengthened economic ties between cities, thereby enhancing URID quality. Factor analysis indicates that the interaction between slope (X8) and per capita arable land (X3) significantly surpasses the impact of individual factors, demonstrating that the YRDUA’s flat topography supports efficient and refined agriculture, which accelerates modernization, increases farmers’ incomes, and narrows the urban–rural economic gap. The MRYRUA relies on traditional industries such as agriculture, energy, and automotive manufacturing. Factor analysis reveals that the interaction between per capita arable land (X3) and the proportion of non-agricultural population (X1) is significant, highlighting the close connection between agricultural development and urbanization. As urbanization progresses, agricultural land is increasingly converted to urban land, providing more space and resources for urban development. As previously discussed, this conversion facilitates urban expansion while simultaneously influencing agricultural modernization and rural economic restructuring. Similarly, urban development expands markets and opportunities for agriculture, spurring its modernization and upgrading. However, this interaction reveals issues like the singular industrial structure and limited innovation capacity within the Yangtze River Midstream urban agglomeration, somewhat restricting the pace and scope of its URID development. Despite significant advances in electronics and biomedicine, the CYUA still lags in URIDL. Factor analysis reveals that the interaction between slope (X8) and the proportion of non-agricultural population (X1) significantly affects population distribution and industrial development, underscoring the impact of topographical features. The complex topography of the CYUA, characterized by steep slopes and sparsely distributed population, which limits its industrial development to a certain extent. As the non-agricultural population grows, the tension between urbanization and topographical constraints becomes more apparent, significantly challenging URID (Figure 5B).
4.1.2 Mechanisms of spatial evolution of URIDL
From 2010 to 2019, URIDL across the three major urban agglomerations in the Yang-tze River Economic Belt showed a notable decline from east to west and a steady increase from south to north. Notably, in 2019, URIDL in the western CYUA improved significantly relative to the central region, creating a “U”-shaped spatial differentiation among the three urban agglomerations (Figure 3). This improvement is largely due to the CYUA’s proactive adoption of the national URID strategy and the effective implementation of the “Development Plan for CYUA” approved by the State Council in 2016. The flow and integration of urban and rural populations have been effectively enhanced through measures such as promoting industrial transformation, optimizing industrial layouts, relaxing household registration policies as well as integrating urban and rural registration systems.
The intra-urban agglomeration analysis reveals pronounced local spatial clustering patterns of URIDL, predominantly characterized by high-high (HH) and low-low (LL) types (Figure 4). In the YRDUA, the spatial pattern is dominated by HH clusters, reflecting a “core-periphery diffusion” model. Core cities such as Shanghai, Suzhou, and Wuxi, supported by their strong economic foundations, well-developed public services, and advanced industrial structures, have generated significant factor agglomeration and institutional spillover effects. These have effectively promoted urban–rural integration in neighboring cities, facilitating a progressive improvement from low to higher integration levels. This spatial distribution aligns with existing studies that highlight a strong spatial autocorrelation and “east-high, west-low” pattern in the region, underscoring the growing spatial spillover effect of highly integrated cities over time (Shi et al., 2022; Zhao and Jiang, 2022; Bingqing et al., 2017; Lisheng, 2016). In contrast, the MRYRUA and CYUA are dominated by LL clustering, exhibiting a typical “core-periphery” spatial structure. Although core cities such as Nanchang, Chengdu, and Chongqing show higher integration levels, their radiative influence remains limited due to constraints in transportation accessibility, industrial linkages, and policy coordination. This has resulted in insufficient spatial connectivity across the urban agglomeration. The lag in spatial diffusion is consistent with findings on the lack of endogenous drivers for integration in central and western regions, revealing a structural bottleneck that hampers internal spatial synergy (Muga et al., 2023; Liu et al., 2024; Heping et al., 2024). Moving forward, enhancing the leadership role of core cities and improving inter-city coordination mechanisms will be essential to strengthen spatial linkages and boost systemic integration capacity within these urban agglomerations.
4.2 Policy implications
Based on the above previous analysis, this paper offers several recommendations for government departments. Firstly, a systematic and comprehensive URID strategy should be developed, emphasizing its role in promoting high-quality development in the Yangtze River Economic Belt and defining its goals, pathways, and tasks. This strategy should aim to improve the balance and coordination of URID and to ensure that both urban and rural residents benefit from development.
Secondly, policies should be tailored to the specific circumstances of each urban agglomeration. For the YRDUA, policies should leverage its locational and industrial strengths to deeply integrate advanced manufacturing, finance, and foreign trade. Meanwhile, efforts should focus on protecting and efficiently using arable land, promoting agricultural modernization, and fostering agricultural innovation through science and technology, so that it can serve as a key driver of development in the Yangtze River Economic Belt. For the urban agglomeration in the middle reaches of the Yangtze River, the focus should be on enhancing agricultural infrastructure, boosting overall agricultural production, ensuring food security, fostering infrastructure connectivity and the sharing of public services to foster regional integration. Policy guidance and market mechanisms should facilitate the transformation and upgrading of traditional industries, cultivate emerging sectors, and enhance innovation within urban agglomerations, thereby invigorating the economic and social development of the middle reaches of the Yangtze River. The CYUA should enhance urban planning and infrastructure, optimize population and industry distribution, leverage favorable conditions to develop unique and emerging industries, and increase economic strength and competitiveness. Policies should support balanced development across the Chengdu-Chongqing region, reduce urban–rural disparities, and foster common prosperity. In parallel, strengthened cooperation and exchanges with neighboring regions are essential to collectively enhance the economic and social development of the upstream Yangtze River area.
Lastly, each urban agglomeration should implement a URID monitoring and evaluation mechanism to regularly assess and adjust policies based on their effectiveness and development status. Additionally, government cooperation and coordination should be enhanced to reduce administrative barriers and promote policy convergence and synergy. Moreover, participation in URID should be encouraged across all societal sectors, so as to foster a diverse governance model with governmental guidance, market leadership, and societal involvement to comprehensively advance URID in the Yangtze River Economic Belt.
4.3 Research limitations
Although this study offers valuable insights into the spatiotemporal evolution and driving mechanisms of URID across the three major urban agglomerations in the Yangtze River Economic Belt, several limitations remain. First, the indicator system, though comprehensive, still lacks the inclusion of certain soft dimensions such as institutional environment, governance efficiency, and subjective wellbeing of residents, which are difficult to quantify yet crucial for evaluating URID. Second, the analysis is based on prefecture-level panel data, which may mask finer-scale heterogeneity within counties and towns, particularly in regions where urban–rural boundaries are less defined. Third, while this study examined both individual and interactive effects of multiple drivers, it does not incorporate dynamic feedback loops or long-term path dependencies in the urban–rural system. In light of these limitations, future research could be improved in several ways. Future studies could incorporate richer data sources such as household surveys, high-resolution spatial data, and multi-source remote sensing information to capture more nuanced dynamics of URID. Additionally, expanding the spatial scale to include county-level or township-level data would allow for more granular analysis of regional disparities and better identification of policy entry points. Finally, integrating systems thinking approaches such as system dynamics models, spatial simulations, or agent-based models could enrich the understanding of the complex, nonlinear, and adaptive nature of urban–rural integration processes. By addressing these limitations, future research can better support evidence-based policy design and advance theoretical innovation in the study of urban–rural integration.
5 Conclusion
Drawing on an in-depth exploration of urban–rural integration, this study developed a comprehensive index system for URIDL across the three major urban agglomerations of the Yangtze River Economic Belt, encompassing social, economic, cultural, spatial, and ecological dimensions. Using methodologies like longitudinal and transverse contrast, Moran’s I, and trend surface analysis, the study systematically analyzed the temporal and spatial evolution of URIDL in the three major urban agglomerations from 2010 to 2019. Additionally, geographic detection methods were used to further explore the influencing mechanisms. The main conclusions are:
1. URIDL across the three urban agglomerations exhibited a sustained upward trend from 2010 to 2019. The growth was rapid during 2010–2014 and more stable during 2014–2019, reflecting a shift from speed-focused development to quality-oriented integration as China entered the “new normal” phase of economic development.
2. The three urban agglomerations displayed significant heterogeneity in both development level and growth dynamics. Overall, the URIDL followed the pattern of YRDUA > MRYRUA > CYUA, with CYUA showing the most notable growth momentum, largely benefiting from the steady advancement of regional coordinated development strategies.
3. Spatially, URIDL exhibited a clear gradient of “east high–west low” and “north high–south low.” The prevalence of high-high (HH) and low-low (LL) clusters indicates a bifurcated spatial structure, where the diffusion effect of highly integrated areas coexists with the developmental inertia of lower-performing regions.
4. Interaction effects between key factor pairs had a greater impact on URIDL than single-factor influences. Notably, the interactions between slope (X8) and per capita arable land (X3), between X3 and the proportion of non-agricultural population (X1), and between X8 and X1 played crucial roles. In addition, fluctuations in the industrial structure (X6) significantly influenced the evolution of integration levels across urban agglomerations.
In summary, this study systematically examined the spatiotemporal evolution, spatial dependencies, and driving mechanisms of urban–rural integration within the three major urban agglomerations of the YREB. By employing cross-regional comparative perspectives, continuous annual panel data analysis, and spatial econometric approaches, the research attempted to address existing gaps, notably the limited cross-regional comparisons and insufficient explo-ration of driving mechanisms. The findings highlighted regional heterogeneity in the urban–rural integration process and revealed complex multi-factor interactions underpinning these variations. The results provide essential empirical evidence and policy implications for promoting regional coordination and urban–rural integration in the YREB.
Data availability statement
Publicly available datasets were analyzed in this study. This data can be found at: publicly available datasets were analyzed in this study. This data can be found at: The data underlying the results presented in the study are available from the official websites of various provincial bureaus of statistics. The specific URLs where the data can be accessed are: https://tjj.sc.gov.cn/ for Sichuan, https://tjj.cq.gov.cn/ for Chongqing, https://tjj.hubei.gov.cn/ for Hubei, https://tjj.hunan.gov.cn/ for Hunan, http://tjj.jiangxi.gov.cn/ for Jiangxi, https://tjj.ah.gov.cn/ for Anhui, https://tj.jiangsu.gov.cn/ for Jiangsu, https://tjj.zj.gov.cn/ for Zhejiang, and https://tjj.sh.gov.cn/ for Shanghai.
Author contributions
GM: Writing – original draft, Writing – review & editing. CL: Conceptualization, Software, Writing – review & editing. DT: Data curation, Writing – original draft. JY: Supervision, Writing – original draft. PR: Formal analysis, Funding acquisition, Writing – review & editing.
Funding
The author(s) declare that financial support was received for the research and/or publication of this article. This research was supported by the Open Fund of the Key Laboratory for Legal Studies in Natural Resources (Ministry of Natural Resources) (Project Number: CUGFZ-2511). The funding body primarily assumed the role of financial supporter, providing necessary financial support for core research activities including topic demonstration, data collection, and academic investigations to ensure the smooth progress of the study. The funder did not participate in specific academic processes such as research design, data analysis, manuscript preparation, or publication decisions. All research conclusions are independently drawn by the authors, who take full responsibility for the findings.
Conflict of interest
The authors declare that the research was conducted in the absence of any commercial or financial relationships that could be construed as a potential conflict of interest.
Generative AI statement
The authors declare that no Gen AI was used in the creation of this manuscript.
Publisher’s note
All claims expressed in this article are solely those of the authors and do not necessarily represent those of their affiliated organizations, or those of the publisher, the editors and the reviewers. Any product that may be evaluated in this article, or claim that may be made by its manufacturer, is not guaranteed or endorsed by the publisher.
Supplementary material
The Supplementary material for this article can be found online at: https://www.frontiersin.org/articles/10.3389/frsc.2025.1528062/full#supplementary-material
Footnotes
References
Anselin, L. (2019). The Moran scatterplot as an ESDA tool to assess local instability in spatial association. New York: Routledge, 111–126.
Bingqing, C., Yuqi, L., and Yi, W. (2017). Study on the morphological evolution of urban-rural spatial integration in Jiangsu Province. Res. Environ. Yangtze Basin 26, 1022–1031. doi: 10.11870/cjlyzyyhj201707008 (In Chinese).
Boudet, F., MacDonald, G. K., Robinson, B. E., and Samberg, L. H. (2020). Rural-urban connectivity and agricultural land management across the global south. Glob. Environ. Change 60:101982. doi: 10.1016/j.gloenvcha.2019.101982
Cao, W., Zhou, S., and Zhou, M. (2021). Operational pattern of urban-rural integration regulated by land use in metropolitan fringe of China. Land 10:515. doi: 10.3390/land10050515
Cattaneo, A., Adukia, A., Brown, D. L., Christiaensen, L., Evans, D. K., Haakenstad, A., et al. (2022). Economic and social development along the urban–rural continuum: new opportunities to inform policy. World Dev. 157:105941. doi: 10.1016/j.worlddev.2022.105941
Chen, K. Z., Mao, R., and Zhou, Y. (2022). Rurbanomics for common prosperity: new approach to integrated urban-rural development. China Agric. Econ. Rev. 15:256. doi: 10.1108/CAER-12-2021-0256
Fang, C. L. (2022). Theoretical analysis on the mechanism and evolution law of urban-rural integration development. Acta Geograph. Sin. 4, 759–776. doi: 10.11821/dlxb202204001 (In Chinese).
Feng, Z., Tang, Y., Zhang, Y., and Zhang, D. (2007). Relief degree of land surface in China and its correlation with population distribution. Acta Geograph. Sin. 62, 1073–1082. doi: 10.11821/xb200710007 (In Chinese).
Guo, Y. J., Li, L. Y., Yi, P. T., and Li, W. W. (2015). Analysis of Stability on Scatter Degree Method and the Improvement. Operations Research and Management Science. 24, 155–162. doi: 10.12005/orms.2015.0059
He, R. W. (2018). Urban-rural integration and rural revitalization: theory, mechanism and implementation. Geogr. Res. 11, 2127–2140. doi: 10.11821/dlyj201811001 (In Chinese).
Heping, Y., Hongbo, L. I., Daoyan, X., et al. (2024). Measurement and regional difference of the urban-rural common prosperity of the urban agglomerations in the middle reaches of the Yangtze River. Econ. Geogr. 44, 87–96. doi: 10.15957/j.cnki.jjdl.2024.08.011
Huang, Z. (2018). On the strategy of rural revitalization in China. Chin. Rural Econ. 4, 2–12. doi: 10.20077/j.cnki.11-1262/f.2018.04.001 (In Chinese).
Li, Y. (2012). Urban–rural interaction patterns and dynamic land use: implications for urban–rural integration in China. Reg. Environ. Chang. 12, 803–812. doi: 10.1007/s10113-012-0295-4
Li, Y. H., Jia, L. R., Wu, W. H., Yan, J. Y., and Liu, Y. S. (2018). Urbanization for rural sustainability-rethinking China’s urbanization strategy. J. Clean. Prod. 178, 580–586. doi: 10.1016/j.jclepro.2017.12.273
Li, N., Qu, L., and Liu, Y. (2019). Research on identification method and application of rural regional multi-body system. Geogr. Res. 38, 563–577. doi: 10.11821/dlyj020181003 (In Chinese).
Lisheng, Z. (2016). Spatio-temporal evolution of county-level urbanization and its influencing factors: a case study of Zhejiang Province. Geogr. Res. 35, 1151–1163. doi: 10.11821/dlyj201606012 (In Chinese).
Liu, Y., Long, H., Chen, Y., Wang, J., Li, Y., Li, Y., et al. (2016). Progress of research on urban-rural transformation and rural development in China in the past decade and future prospects. J. Geogr. Sci. 26, 1117–1132. doi: 10.1007/s11442-016-1318-8
Liu, Y., Long, H., and Li, Y. (2021). Human geography research based on the new thinking of global rural-urban relationship. Acta Geograph. Sin. 76, 2869–2884. doi: 10.11821/dlxb202112001
Liu, Y., Lu, S., and Chen, Y. (2013). Spatio-temporal change of urban–rural equalized development patterns in China and its driving factors. J. Rural. Stud. 32, 320–330. doi: 10.1016/j.jrurstud.2013.08.004
Liu, H., Lu, G., Luo, K., and Zong, H. (2024). Measurement and spatio–temporal pattern evolution of urban–rural integration develop-ment in the Chengdu-Chongqing economic circle. Land 13:942. doi: 10.3390/land13070942
Liu, Y., Schen, C., and Li, Y. (2015). Differentiation regularity of urban-rural equalized development at prefecture-level city in China. J. Geogr. Sci. 25, 1075–1088. doi: 10.1007/s11442-015-1220-9
Liu, Y., Zhang, X., Xu, M., Zhang, X., Shan, B., and Wang, A. (2022). Spatial patterns and driving factors of rural population loss under urban–rural integration development: a micro-scale study on the village level in a hilly region. Land 11:99. doi: 10.3390/land11010099
Long, H., Zou, J., Pykett, J., and Li, Y. (2011). Analysis of rural transformation development in China since the turn of the new millennium. Appl. Geogr. 31, 1094–1105. doi: 10.1016/j.apgeog.2011.02.006
Ma, L., Liu, S., Fang, F., Che, X., and Chen, M. (2020). Evaluation of urban-rural difference and integration based on quality of life. Sustain. Cities Soc. 54:101877. doi: 10.1016/j.scs.2019.101877
Muga, G., Hu, S., Wang, Z., Tong, L., Hu, Z., Huang, H., et al. (2023). The efficiency of urban–rural integration in the Yangtze River Economic Belt and its optimization. Sustain. For. 15:2419. doi: 10.3390/su15032419
Niu, X., Liao, F., Liu, Z., and Wu, G. (2022). Spatial–temporal characteristics and driving mechanisms of land–use transition from the perspective of urban–rural transformation development: a case study of the Yangtze River Delta. Land 11:631. doi: 10.3390/land11050631
Pan, W., Wang, J., Li, Y., Chen, S., and Lu, Z. (2023). Spatial pattern of urban-rural integration in China and the impact of geography. Geogr. Sustain. 4, 404–413. doi: 10.1016/j.geosus.2023.08.001
Rao, C., and Gao, Y. (2022). Evaluation mechanism design for the development level of urban-rural integration based on an improved TOPSIS method. Mathematics 10:380. doi: 10.3390/math10030380
Ren, Y., and Tian, Y. (2022). Spatial effects of transportation infrastructure on the development of urban agglomeration integration: evidence from the Yangtze River Economic Belt. J. Transp. Geogr. 104:103431. doi: 10.1016/j.jtrangeo.2022.103431
Rickardsson, J. (2021). The urban–rural divide in radical right populist support: the role of resident’s characteristics, urbanization trends and public service supply. Ann. Reg. Sci. 67, 211–242. doi: 10.1007/s00168-021-01046-1
Shan, B., Zhang, Q., Ren, Q., Yu, X., and Chen, Y. (2022). Spatial heterogeneity of urban–rural integration and its infuencing factors in Shandong province of China. Sci. Rep. 12:14317. doi: 10.1038/s41598-022-18424-0
Shi, J. G., Duan, K. F., and Wu, G. D. (2022). The measurement of urban-rural integration development level in the Yangtze River Delta and analysis of its spatio-temporal characteristics. J. Tongji Univ. 33, 78–89. doi: 10.3969/j.issn.1009-3060.2022.01.009 (In Chinese).
Shi, J. G., Duan, K. F., Wu, G. D., and Li, J. (2021). Effificiency of urban-rural integration development in the Yangtze River Delta under the background of carbon emission constraint. Econ. Geogr. 41, 57–67. doi: 10.15957/j.cnki.jjdl.2021.06.007 (In Chinese).
Shi, J. G., and Wu, G. D. (2024). Driving factors and paths of urban-rural integration development. China Popul.·Resour. Environ. 1, 150–161. doi: 10.12062/cpre.20230902 (In Chinese).
Shuqian, C., Guohua, Z., Liuyan, D., Guohua, W., and Yanhua, H. (2022). Research progress and prospects of urban-rural integrated development based on geographical perspective. Econ. Ceogr. 42, 104–113. doi: 10.15957/j.cnki.jjdl.2022.02.012
Siddika, S., and Sresto, M. A. (2025). Assessing urban resilience of Khulna City in response to environmental and socioeconomic challenges. DYSONA-Appl. Sci. 6, 134–144. doi: 10.30493/das.2024.481910
Sun, Y., and Yang, Q. (2022). Study on spatial–temporal evolution characteristics and restrictive factors of urban–rural integration in Northeast China from 2000 to 2019. Land 11:1195. doi: 10.3390/land11081195
Wang, J., and Xu, C. (2017). Geodetector: principle and prospective. Acta Geograph. Sin. 72, 116–134. doi: 10.11821/dlxb201701010 (In Chinese).
Wu, Q., Chang, W., Song, M., and Zhu, H. (2025). Measurement of urban–rural integration development level and diagnosis of obstacle factors: evidence from the Beijing–Tianjing–Hebei urban agglomeration, China. Land 14:261. doi: 10.3390/land14020261
Wu, X., and Cui, P. (2016). A study of the time–space evolution characteristics of urban–rural integration development in a mountainous area based on ESDA-GIS: the case of the Qinling-Daba Mountains in China. Sustain. For. 8:1085. doi: 10.3390/su8111085
Xiao, L., He, Z., Wang, Y., and Guo, Q. (2017). Understanding urban-rural linkages from an ecological perspective. Int. J. Sustain. Dev. World Ecol. 24, 37–43. doi: 10.1080/13504509.2016.1157105
Yang, Y., Bao, W., Wang, Y., and Liu, Y. (2021). Measurement of urban-rural integration level and its spatial differentiation in China in the new century. Habitat Int. 117:102420. doi: 10.1016/j.habitatint.2021.102420
Yang, J., and Huang, X. (2021). 30m annual land cover and its dynamics in China from 1990 to 2019. Earth Syst. Sci. Data Disc 13, 3907–3925. doi: 10.5194/essd-13-3907-2021
Yang, Z., Shen, N., Qu, Y., and Zhang, B. (2021). Association between rural land use transition and urban–rural integration development: from 2009 to 2018 based on county-level data in Shandong Province, China. Land 10:1228. doi: 10.3390/land10111228
Zarifa, D., Seward, B., and Milian, R. P. (2019). Location, location, location: examining the rural-urban skills gap in Canada. J. Rural. Stud. 72, 252–263. doi: 10.1016/j.jrurstud.2019.10.032
Zeng, Q., and Chen, X. (2023). Identification of urban-rural integration types in China–an unsupervised machine learning approach. China Agric. Econ. Rev. 15, 400–415. doi: 10.1108/CAER-03-2022-0045
Zhan, L., Wang, S. L., Xiao, Z. X., and Yu, Q. (2023). Spatial path to achieve urban-rural integration development− analytical framework for coupling the linkage and coordination of urban-rural system functions. Habitat Int. 142:102953. doi: 10.1016/j.habitatint.2023.102953
Zhang, K. J., and Du, C. (2019). From urban-rural coordination, urban-rural integration to urban-rural integrated development: inheritance and sublimation. Rural Econ. 11, 19–26. (In Chinese).
Zhang, H., He, R., Li, N., and Li, G. (2021). Spatio-temporal differentiation of urban-rural integration level and rural revitalization path in the capital region. J. Nat. Resour. 36, 2652–2671. doi: 10.31497/zrzyxb.20211014 (In Chinese).
Zhang, Z., and Lu, Y. (2018). China’s urban-rural relationship: evolution and prospects. China Agric. Econ. Rev. 10, 260–276. doi: 10.1108/CAER-02-2018-0038
Zhang, X., Qiu, F., and Zhu, C. (2020). Evolution of urban–rural integration in Huaihai economic zone from the perspective of spatio temporal interaction. J. Nat. Resour. 35, 1867–1880. doi: 10.31497/zrzyxb.20200809
Zhao, W., and Jiang, C. (2022). Analysis of the spatial and temporal characteristics and dynamic effects of urban-rural integration development in the Yangtze River Delta region. Land 11:1054. doi: 10.3390/land11071054
Zheng, J., Mi, Z., Coffman, D. M., Coffman, D., Shan, Y., Guan, D., et al. (2019). The slowdown in China’s carbon emissions growth in the new phase of economic development. One Earth 1, 240–253. doi: 10.1016/j.oneear.2019.10.007
Zhou, J., Bi, X., and Zou, W. (2020). Driving mechanism of urban-rural integration in Huaihai economic zone: based on the space of flow. J. Nat. Resour. 35, 1881–1896. doi: 10.31497/zrzyxb.20200810 (In Chinese).
Zhou, J., Qin, F., Liu, J., Zhu, G., and Zou, W. (2019). Measurement, spatial-temporal evolution and influencing mechanism of urban–rural intgration level in China from a multidimensional perspective. China Popul. Resour. Environ. 29, 166–176. doi: 10.12062/cpre.20190510 (In Chinese).
Keywords: urban–rural integration development level, Spatio-temporal evolution, driving mechanism, urban agglomeration, Yangtze River Economic Belt, geographical detector
Citation: Muga G, Liu C, Tiando DS, Yang J and Ran P (2025) Urban–rural integration of urban agglomerations in China’s Yangtze River Economic Belt: spatiotemporal evolution and driving mechanism. Front. Sustain. Cities. 7:1528062. doi: 10.3389/frsc.2025.1528062
Edited by:
Mengyao Han, Chinese Academy of Sciences (CAS), ChinaReviewed by:
Zahid Hussain, Liaoning University, ChinaZaijun Li, Yangzhou University, China
Hazem Abdo, Tartous University, Syria
Sanjoy Barman, University of North Bengal, India
Copyright © 2025 Muga, Liu, Tiando, Yang and Ran. This is an open-access article distributed under the terms of the Creative Commons Attribution License (CC BY). The use, distribution or reproduction in other forums is permitted, provided the original author(s) and the copyright owner(s) are credited and that the original publication in this journal is cited, in accordance with accepted academic practice. No use, distribution or reproduction is permitted which does not comply with these terms.
*Correspondence: Penglai Ran, cmFucGVuZ2xhaUBtYWlsLmd1ZmUuZWR1LmNu