 Gregory Trencher
 Toshihiro Hamano1
 Jair Campfens
 Mert Duygan
- 1Graduate School of Global Environmental Studies, Kyoto University, Kyoto, Japan
- 2Institute of Industrial Science, University of Tokyo, Tokyo, Japan
- 3School of Architecture, Civil and Environmental Engineering, Swiss Federal Institute of Technology Lausanne (EPFL), Lausanne, Switzerland
- 4Department of Environmental Social Sciences, Eawag, Dübendorf, Switzerland
- 5Centre for Development and Environment, University of Bern, Bern, Switzerland
Introduction: Regional urban and rural areas outside major metropolitan centres are facing escalating mobility challenges driven by declining socio-economic vitality and demographic shifts like population decline and ageing. Smart mobility innovations – including Autonomous Vehicles (AV), Demand-Responsive Transport (DRT), ridesharing and Mobility-as-a-Service (MaaS) – have attracted attention as potential solutions. Yet most scholarship on these innovations has focused on user acceptance or theoretical potential, offering limited empirical assessment of their actual problem-solving effectiveness. It consequently remains unclear whether these smart mobility technologies can live up to lofty expectations about their benefits, especially in regional settings facing declining socio-economic conditions.
Objective and method: We examine the experiences of regional Japan, where declining ridership and revenue – triggered by population aging and shrinkage – are forcing the contraction of public transport services and threatening their financial sustainability. Drawing on evidence from questionnaires and interviews, we comparatively examine the challenges, approaches and outcomes of 67 smart mobility projects implemented in 65 cities, towns and villages across Japan. A key contribution lies in our application of a common, systemic perspective – grounded in systems mapping methods – to analyse transport challenges across larger and smaller municipalities.
Results: Findings show that both larger and smaller municipalities are grappling with broadly the same challenges despite vastly differing geographical conditions. Our structural analysis indicates that challenges consist of root causes (driver shortages, declining revenue, poor convenience, downscaling of transport networks) and symptoms (poor access). In terms of effectiveness at tackling these challenges, the analysis reveals a mixed picture. On the one hand, projects reported substantial success in improving convenience, reducing accessibility barriers for users, and filling gaps in transport networks. On the other hand, we find less success at ameliorating other root-cause problems, notably driver shortages and low profitability.
Discussion: Our empirics suggest that smart mobility innovations do not provide a panacea for all transport challenges, particularly when macro-level demographic conditions such as population ageing and decline pose a structural impediment to their effectiveness. Japan’s experiences in dealing with the impacts of population ageing and associated socio-economic decline on regional mobility carry high instructive value for other countries facing similar demographic changes.
1 Introduction
As metropoles continue to expand globally, they attract a disproportionate share of human and economic capital, further concentrating opportunities and resources (Balland et al., 2020). In contrast, regional areas – defined here as cities, towns, villages and rural settings located outside major metropolitan centres – have seen a marked decline in socio-economic vitality (OECD, 2020; UN, 2021), with per capita GDP in regional areas now averaging 32% lower than in metropolitan areas (OECD, 2023). Population shrinkage and ageing are key drivers of regional decline (Jarzebski et al., 2021). Few countries have escaped this global megatrend, with population aging and decline in regional areas accelerating across all G20 countries over the past decade (UN, 2023). This demographic transformation is exacerbating many pre-existing challenges faced by regional areas, including fewer resources in key areas such as education, public and medical services, slow progress in digitalization, and deteriorating infrastructures (OECD, 2020). Consequently, people living in regional areas face diminishing opportunities to access quality employment, education, healthcare and essential services necessary for daily life and well-being (Camarero and Oliva, 2019; OECD, 2023).
Transport networks are a critical infrastructure in which regional areas continue to experience widening disparities compared to metropoles (Avary et al., 2020; Vitale Brovarone, 2022; Flipo et al., 2023). Extensive scholarship has shown that regional transport networks typically suffer from low-ridership and high operational costs due to lower population densities and greater travel distances (Mulley et al., 2023; Ahonen et al., 2024). Indeed, approximately half of all bus and train services globally run at a loss (Avary et al., 2020), with fare revenues continuously declining across many countries (ITF, 2024). As a result, these services are becoming increasingly dependent on government subsidies for survival, creating a growing fiscal strain on regional municipalities. With many transport operators forced to curtail services to mitigate profit losses, the availability and convenience of regional mobility systems is declining, adversely affecting residents’ well-being (Trencher et al., 2024). Regional networks are also characterised by sparser coverage and fewer public transport options than in metropolitan areas, deepening reliance on private vehicles (Porru et al., 2020). This not only increases the climate footprint of regional mobility but also creates safety concerns – especially for older residents who continue driving despite age-related declines in physical and cognitive functions (Fitt et al., 2019). At the same time, car-dependant regional lifestyles exacerbate social inequalities for individuals unable to drive, including the elderly, youth and people with disabilities (Poltimäe et al., 2022; Flipo et al., 2023).
The introduction of smart mobility innovations in public transport systems harbours significant promise as a means of tackling these interlinked and self-reinforcing challenges (Bosworth et al., 2020; Porru et al., 2020; Vitale Brovarone, 2022). The literature has foregrounded four innovations in particular. Autonomous Vehicles (AV) have potential to enhance the profitability of bus and taxi operations by reducing driver-related costs (Goldbach et al., 2022; Qiao and Briceno-Garmendia, 2024). Similarly, Demand-Responsive Transport (DRT), in which vehicles adjust routes and scheduling based on user requests, can lower inconvenience and access hurdles for public transport users (Jittrapirom et al., 2019; Poltimäe et al., 2022), thereby boosting ridership and profitability (Ward and Oakley, 2022; Mulley et al., 2023). Ridesharing can further reduce the per-passenger cost of personalised DRT services for both operators and users (Poltimäe et al., 2022), especially when leveraging AI technologies to optimise routing and scheduling to cater for the varying pick-up and destination needs of multiple users. Meanwhile, Mobility-as-a-Service (MaaS) promises to increase the efficiency and utilisation of public transport by integrating otherwise poorly connected – or even competing – transport modes into a single, digitalised service (Papaioannou et al., 2023). Recognising this potential, a rapidly growing body of literature has begun to examine the introduction of these smart mobility innovations across diverse geographies – including both urban and rural areas (Fujisaki et al., 2022; Poltimäe et al., 2022; Servou et al., 2022; Ahonen et al., 2024).
Yet, important knowledge gaps and limitations remain. First, the topic of innovations in regional mobility has received limited attention in policymaking and scholarship, which predominantly focus on solutions developed for urban areas (McCarrol and Cugurullo, 2022; Poltimäe et al., 2022; Flipo et al., 2023; Ryghaug et al., 2023). Meanwhile, studies on rural areas tend to investigate transport challenges and smart mobility innovations in isolation of urban areas. A geographical divide has consequently occurred in the literature, with few studies explicitly examining the nature of challenges and mobility solutions in both rural and urban contexts from an integrated perspective (Porru et al., 2020). Second, much of the scholarship on innovations such as AVs, ridesharing and MaaS centres on user acceptance or their potential to address mobility challenges (Bosworth et al., 2020; Zandieh and Acheampong, 2021). There remains, however, a dearth of empirical knowledge about the actual problem-solving effectiveness of these solutions. It consequently remains unclear whether emerging smart mobility technologies can live up to lofty expectations about their benefits, especially in regional areas experiencing socio-economic decline (van Oers et al., 2020; Yamasaki, 2024).
Accordingly, this study examines the experiences of a sample of 67 smart mobility projects implemented in diverse regional settings across Japan to empirically investigate their defining characteristics and effectiveness in addressing various transport-related challenges. Combining evidence sourced from a questionnaire and interviews with project implementers, we address four research questions:
1. What are the primary transport-related challenges faced by regional areas?
2. What are the characteristics of smart mobility innovations developed for public transport services in regional municipalities of varying sizes across Japan
3. How effective are these innovations at ameliorating transport-related challenges?
4. What barriers hinder the successful implementation and deployment of smart mobility innovations?
A core contribution of this study lies in our analysis of regional transport challenges from a systemic perspective. The theoretical and methodological foundation for this approach draws on systems mapping methods from fields such as innovation systems (Kieft et al., 2017) and socio-ecological transformation (Jiren et al., 2020). These fields have developed diverse approaches for identifying and visualising various system components with the goal of identifying interlinkages, interdependencies and feedback loops. Central to our analysis is the concept of ‘systemic problems’ – also referred to as systemic barriers or failures – which are understood as interlinked and self-reinforcing dynamics that inhibit the diffusion of innovations or the emergence of alternative socio-technical arrangements (De Oliveira et al., 2020; Trencher and Wesseling, 2022). Systems scholars often use tools such as causal loop diagrams (Turner et al., 2016; Wesseling and Van der Vooren, 2017) to visualise interlinked variables that form self-reinforcing or stabilising feedback loops in social, technological or ecological systems. These diagrams, however, typically rely on data that is hardly traceable, thereby limiting reproducibility and comparability across cases. In contrast, a key methodological innovation in our study is to have systemically collected semi-quantitative data via questionnaires to construct a structural ‘influence matrix’ (Godet, 1987; Wiek and Binder, 2005). This matrix allowed us to empirically map the common structure of the causal relations arising across the transport-related challenges perceived by actors in diverse geographic areas. This procedure offers a standardised and traceable means of identifying interactions between variables, root causes and downstream symptoms. Critically, our application of this approach focuses on the interrelations among social rather than strictly socio-technical problems. This approach reveals how a complex web of socio-economic factors is simultaneously driving the uptake of smart mobility services across Japan’s regions while, at the same time, structurally undermining their effectiveness.
Beyond its methodological novelty, this study offers valuable practical insights gained from project implementers across Japan about the potential of four key smart mobility technologies – AVs, DRT, ridesharing and MaaS – to address the decline of regional public transport infrastructure. Japan’s regions, grappling with the most rapid population ageing and shrinkage in the world, are losing socio-economic vitality at a much faster pace than metropolitan areas (Jarzebski et al., 2021). Consequently, regional public transport services – despite their globally reputation for being highly developed and efficient – are contracting and becoming financially unsustainable due to falling ridership and declining profitability (Avary et al., 2020). At the same time, Japan is home to a globally competitive automotive industry and possesses advanced capabilities in smart mobility technologies including AV, DRT, ridesharing and MaaS. Harnessing these resources, government agencies are collaborating with industry and regional municipalities to deploy smart mobility services across diverse geographical settings (Fujisaki et al., 2022; Tran and Hashimoto, 2022). The World Economic Forum (Avary et al., 2020) has recently highlighted Japan’s mobility innovations as particularly instructive, underscoring that regional transport networks in other advanced economies are likely to face similar challenges in the near future due to population ageing and shrinkage.
In this paper’s remaining sections, the Methods outlines the sample of smart mobility projects, the questionnaire design and the interview procedure. Our Results and discussion examine the questionnaire results by comparing differences between larger and smaller municipalities and four key innovations: AV, ridesharing, DRT, and MaaS. Adhering to the aforementioned research questions, this section examines the interdependent nature of transport-related problems in regional areas, the characteristics and effectiveness of smart mobility systems developed in response, and barriers to smooth implementation, upscaling and commercialisation. Finally, the Conclusion summarises key findings, practical implications and future research directions.
2 Methods
2.1 Scope of analysis and sample construction
Our analysis focuses on a sample of projects that received funding through a series of strategic programmes established by the national government to support the demonstration and deployment of smart mobility services across Japan. Smart mobility projects fostered under these programmes were conceived in response to various challenges such as population ageing, depopulation and socio-economic decline, which as noted, are driving the contraction and financial sustainability of public transport services in regional areas (Avary et al., 2020; Tran and Hashimoto, 2022; Trencher et al., 2024). Most projects involve collaborations between local municipalities and private firms. Given our interest in community-based public transport systems, our investigation concentrates on projects involving road vehicles (e.g., buses, taxis, shuttles, trucks), excluding those focused on rail.
To create an initial pool of smart mobility projects for our questionnaire (explained below), we identified 100 candidates from lists published by six national funding programmes1. Focusing on government-funded projects ensures that all cases share basic attributes, including innovative features, exploratory approaches and uncertainty regarding long-term viability due to recent launches and uncertain market conditions. To ensure representation of diverse urban and rural geographical conditions, we selected projects from all geographic regions outside Japan’s three largest cities: Tokyo, Osaka and Nagoya. We prioritised projects using any of four smart mobility innovations emphasised in the literature: AV, ridesharing, DRT and MaaS. To ensure coverage of ongoing or recently implemented projects, we selected those funded at any time during the period April 2021 to March 2024 (a period covering the latest three fiscal years of funding programmes). While some projects in our sample were chiefly implemented as short-term demonstrations, most continued over multiple years, including throughout 2024, the year of our questionnaire implementation.
2.2 Questionnaire
We designed a questionnaire targeting the aforementioned pool of 100 projects (see Supplementary material). This gathered quantitative data on respondents’ views regarding the transport-related challenges that triggered the project’s implementation, basic project attributes (e.g., smart mobility technologies used, destinations, user age groups), project effectiveness at ameliorating the community’s transport challenges, and barriers to implementation, scaling or commercialisation. Responses were recorded using either a five-point scale of relevance – ranging from ‘no relevance’ to ‘extremely relevant’ – or binary yes/no options.
When designing the survey questions and responses, we reviewed the relevant literature to ensure coverage of the key challenges affecting existing regional transport services and smart mobility initiatives. Additionally, response options for the barriers section were informed by prior qualitative research on factors hindering the deployment of AV and MaaS services in Japan (Trencher et al., 2024).
The questionnaire was administered by email between May and September 2024. Potential respondents were identified by searching publicly available information for the organisation responsible for implementation or coordination of each project. Each organisation was subsequently contacted to request participation. In most instances, surveys were completed by public servants from the local municipality, although the sample includes several responses from private consulting firms serving as lead coordinators or project implementors.
Out of 100 projects contacted, a total of 67 completed questionnaires from 67 unique projects were received, yielding a response rate of 67%. All responses were checked for completeness and errors. In cases of missing or contradicting responses – for example, accidently ticking both ‘extremely important’ and ‘not important’ – we contacted respondents for clarification.
After validation, all questionnaire responses were retained for analysis, thereby constituting the final sample of smart mobility initiatives (n = 67) underpinning our study. A complete list of the projects comprising our final sample is provided in Supplementary Table 1.
We acknowledge the potential for mild sampling bias, primarily because our sample of 67 smart mobility projects represents only a portion of the larger population of similar, nationally funded initiatives across Japan (the size of this population is unknown but likely to be several hundred). Nevertheless, foundational principles in statistical inference – namely the Law of Large Numbers and the Central Limit Theorem – suggest that a sample size of >30 is generally adequate to approximate key characteristics of the wider population (Casella and Berger, 2022), particularly in the context of niche or hard-to-reach populations like smart mobility projects. Moreover, even if generously assuming that that 50% of the 1724 municipalities in Japan are currently implementing a comparable smart mobility project – an unlikely scenario – the resulting representation of approximately 8% of the total population (i.e., 67 projects divided by 862 municipalities) would still offer reasonable coverage if considering norms in survey research (Groves et al., 2009). However, since our objective is to identify the main patterns descriptively rather than statistically, we are not concerned with the limitations that the sample size may impose on statistical power and the precision of estimates. Finally, some degree of sampling bias may also have arisen due to non-response and volunteer effects, as respondents from under-resourced or less successful projects may have been less eager to respond. Taken together, while our sample can be considered sufficiently large to yield meaningful insights about challenges, approaches and outcomes, caution is warranted if generalising the results to the full population of smart mobility projects in Japan.
2.3 Questionnaire responses and analysis
The 67 projects exhibit strong variation in terms of geographic conditions (e.g., urban, peri-urban, residential, downtown, rural – reflecting differences in population size and density) and the smart mobility innovations employed (AVs, ridesharing, DRT and MaaS). Given our assumption that differing geographies and innovations would affect the questionnaire responses, we categorised the questionnaire data based on the variables shown in Table 1.
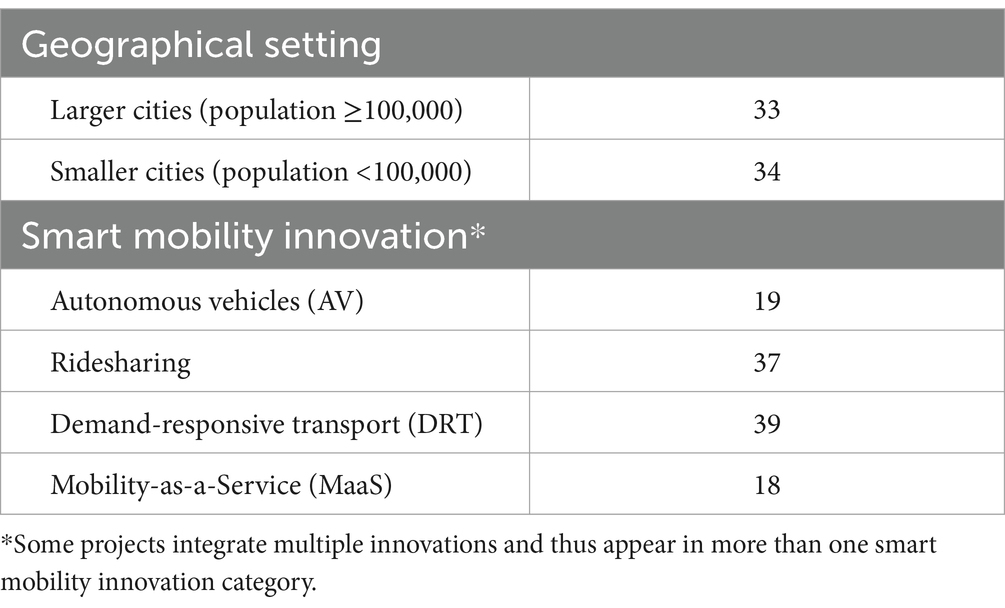
Table 1. Categorisation of sampled projects (n = 67).
This core of our classification distinguishes projects implemented in larger municipalities (primarily large regional cities) from those implemented in smaller municipalities (encompassing small to medium cities, towns, villages and rural areas). Municipality sizes were classified based on the population of the targeted area in 2024, as obtained from government data (MIC, 2024a) (see Supplementary Table 1). Following a classification system used by the Japanese government (MIC, 2024b), we set the threshold population between larger and smaller municipalities at 100,000.
Figure 1 presents the spatial distribution of projects implemented by larger municipalities (n = 33) and smaller municipalities (n = 34). Together, the sample includes projects from 65 unique cities, towns and villages across 33 of Japan’s 47 prefectures. The geographical spread broadly mirror’s Japan’s overall population distribution, with projects in the larger municipality cohort primarily concentrated in cities within the Kanto and Chubu regions (areas adjacent to Tokyo and Nagoya). Meanwhile, projects implemented in smaller municipalities are more prevalent in sparsely populated regions in the north (Hokkaido) and south (Okinawa).
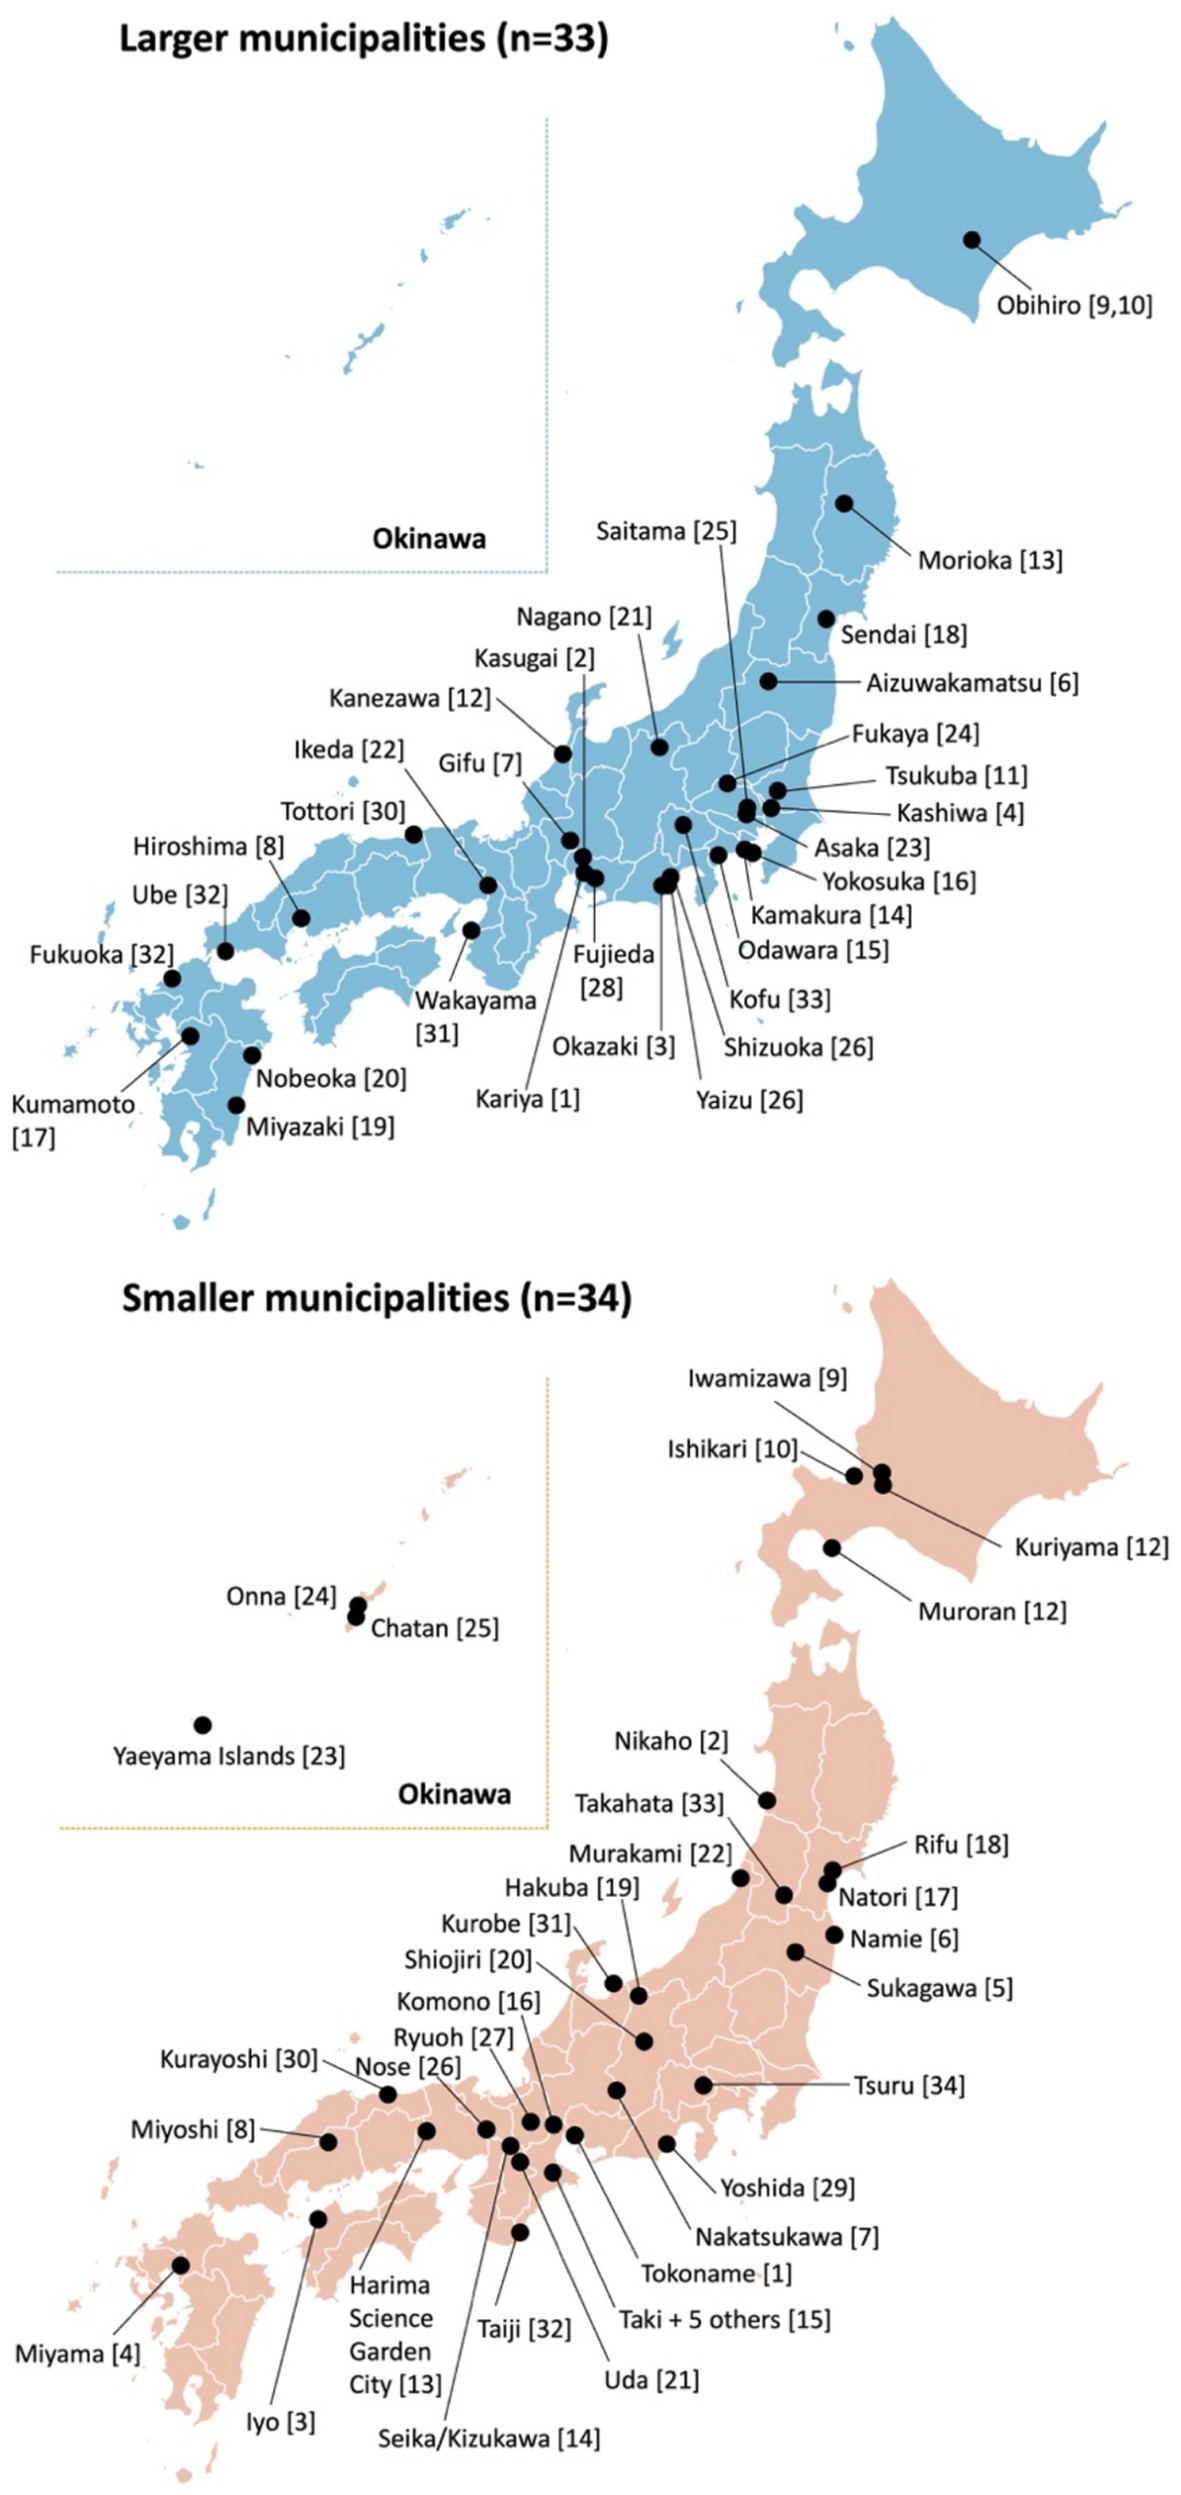
Figure 1. Geographical distribution of surveyed projects Larger municipalities show cities with a population ≥100,000 while smaller municipalities consist of cities, towns and villages with a population <100,000. Full project names and populations of locations are listed in Supplementary Table 1.
We acknowledge the existence of alternative methods of categorising the geographically diverse conditions of the regional areas targeted by the smart mobility projects – e.g. urban vs. rural or finer-grained classifications such as downtown, peri-urban, residential or rural. However, classifying geographic settings based on population size has several advantages. First, and critically, our classification procedure results in a situation where most of the cities, towns and villages in the ‘smaller municipality’ group contain extensive rural or semi-rural areas. This qualitatively distinguishes them from the ‘larger municipalities’ group, which predominantly consist of more densely populated urban areas with more developed transport infrastructure. Second, this classification is objective, relying on government data, and resulting in a roughly even distribution between larger municipalities (n = 33) and smaller municipalities (n = 34). This balanced split ensures sufficient representation of each municipality size and avoids creating small sample categories, which would render difficult the identification of generalisable trends from the data. Third, a population-based binary classification circumvents categorisation issues arising from projects implemented in both rural and urban areas within the same municipality jurisdiction, which would otherwise lead to classification overlaps.
Furthermore, the decision to analyse results based on the geographical setting aligns with the nature of policy discussions within Japan (Avary et al., 2020) and the broader field of mobility studies (Bosworth et al., 2020; Poltimäe et al., 2022). This body of literature highlights the distinct transport challenges faced by urban and rural contexts, advocating for their separate consideration in research and policymaking (Bosworth et al., 2020; Porru et al., 2020; Ahonen et al., 2024). This literature also argues that mobility services should also be designed to fit local conditions (Avary et al., 2020). By distinguishing between larger and smaller municipalities as well as four key smart mobility innovations, our study therefore aims to identify the unique features, effectiveness and barriers of the solutions developed for these contrasting contexts.
2.4 Interviews
We conducted a total of 24 interviews before and after the questionnaire implementation. These targeted project implementers in local municipalities, private firms, think tanks, universities and a national ministry (Table 2). The pre-questionnaire interviews aimed to inform the questionnaire design by building understanding about the core features of the smart mobility projects and the nature of the transport-related problems they address. A key insight from pre-questionnaire interviews was that the transport challenges faced by regions are interdependent and self-reinforcing. This prompted the inclusion of a questionnaire section dedicated to structural analysis, as elaborated in Section 2.5. Conversely, the post-questionnaire interviews primarily focused on contextualisation and interpretation of the questionnaire results by gaining qualitative insights about key trends and findings.
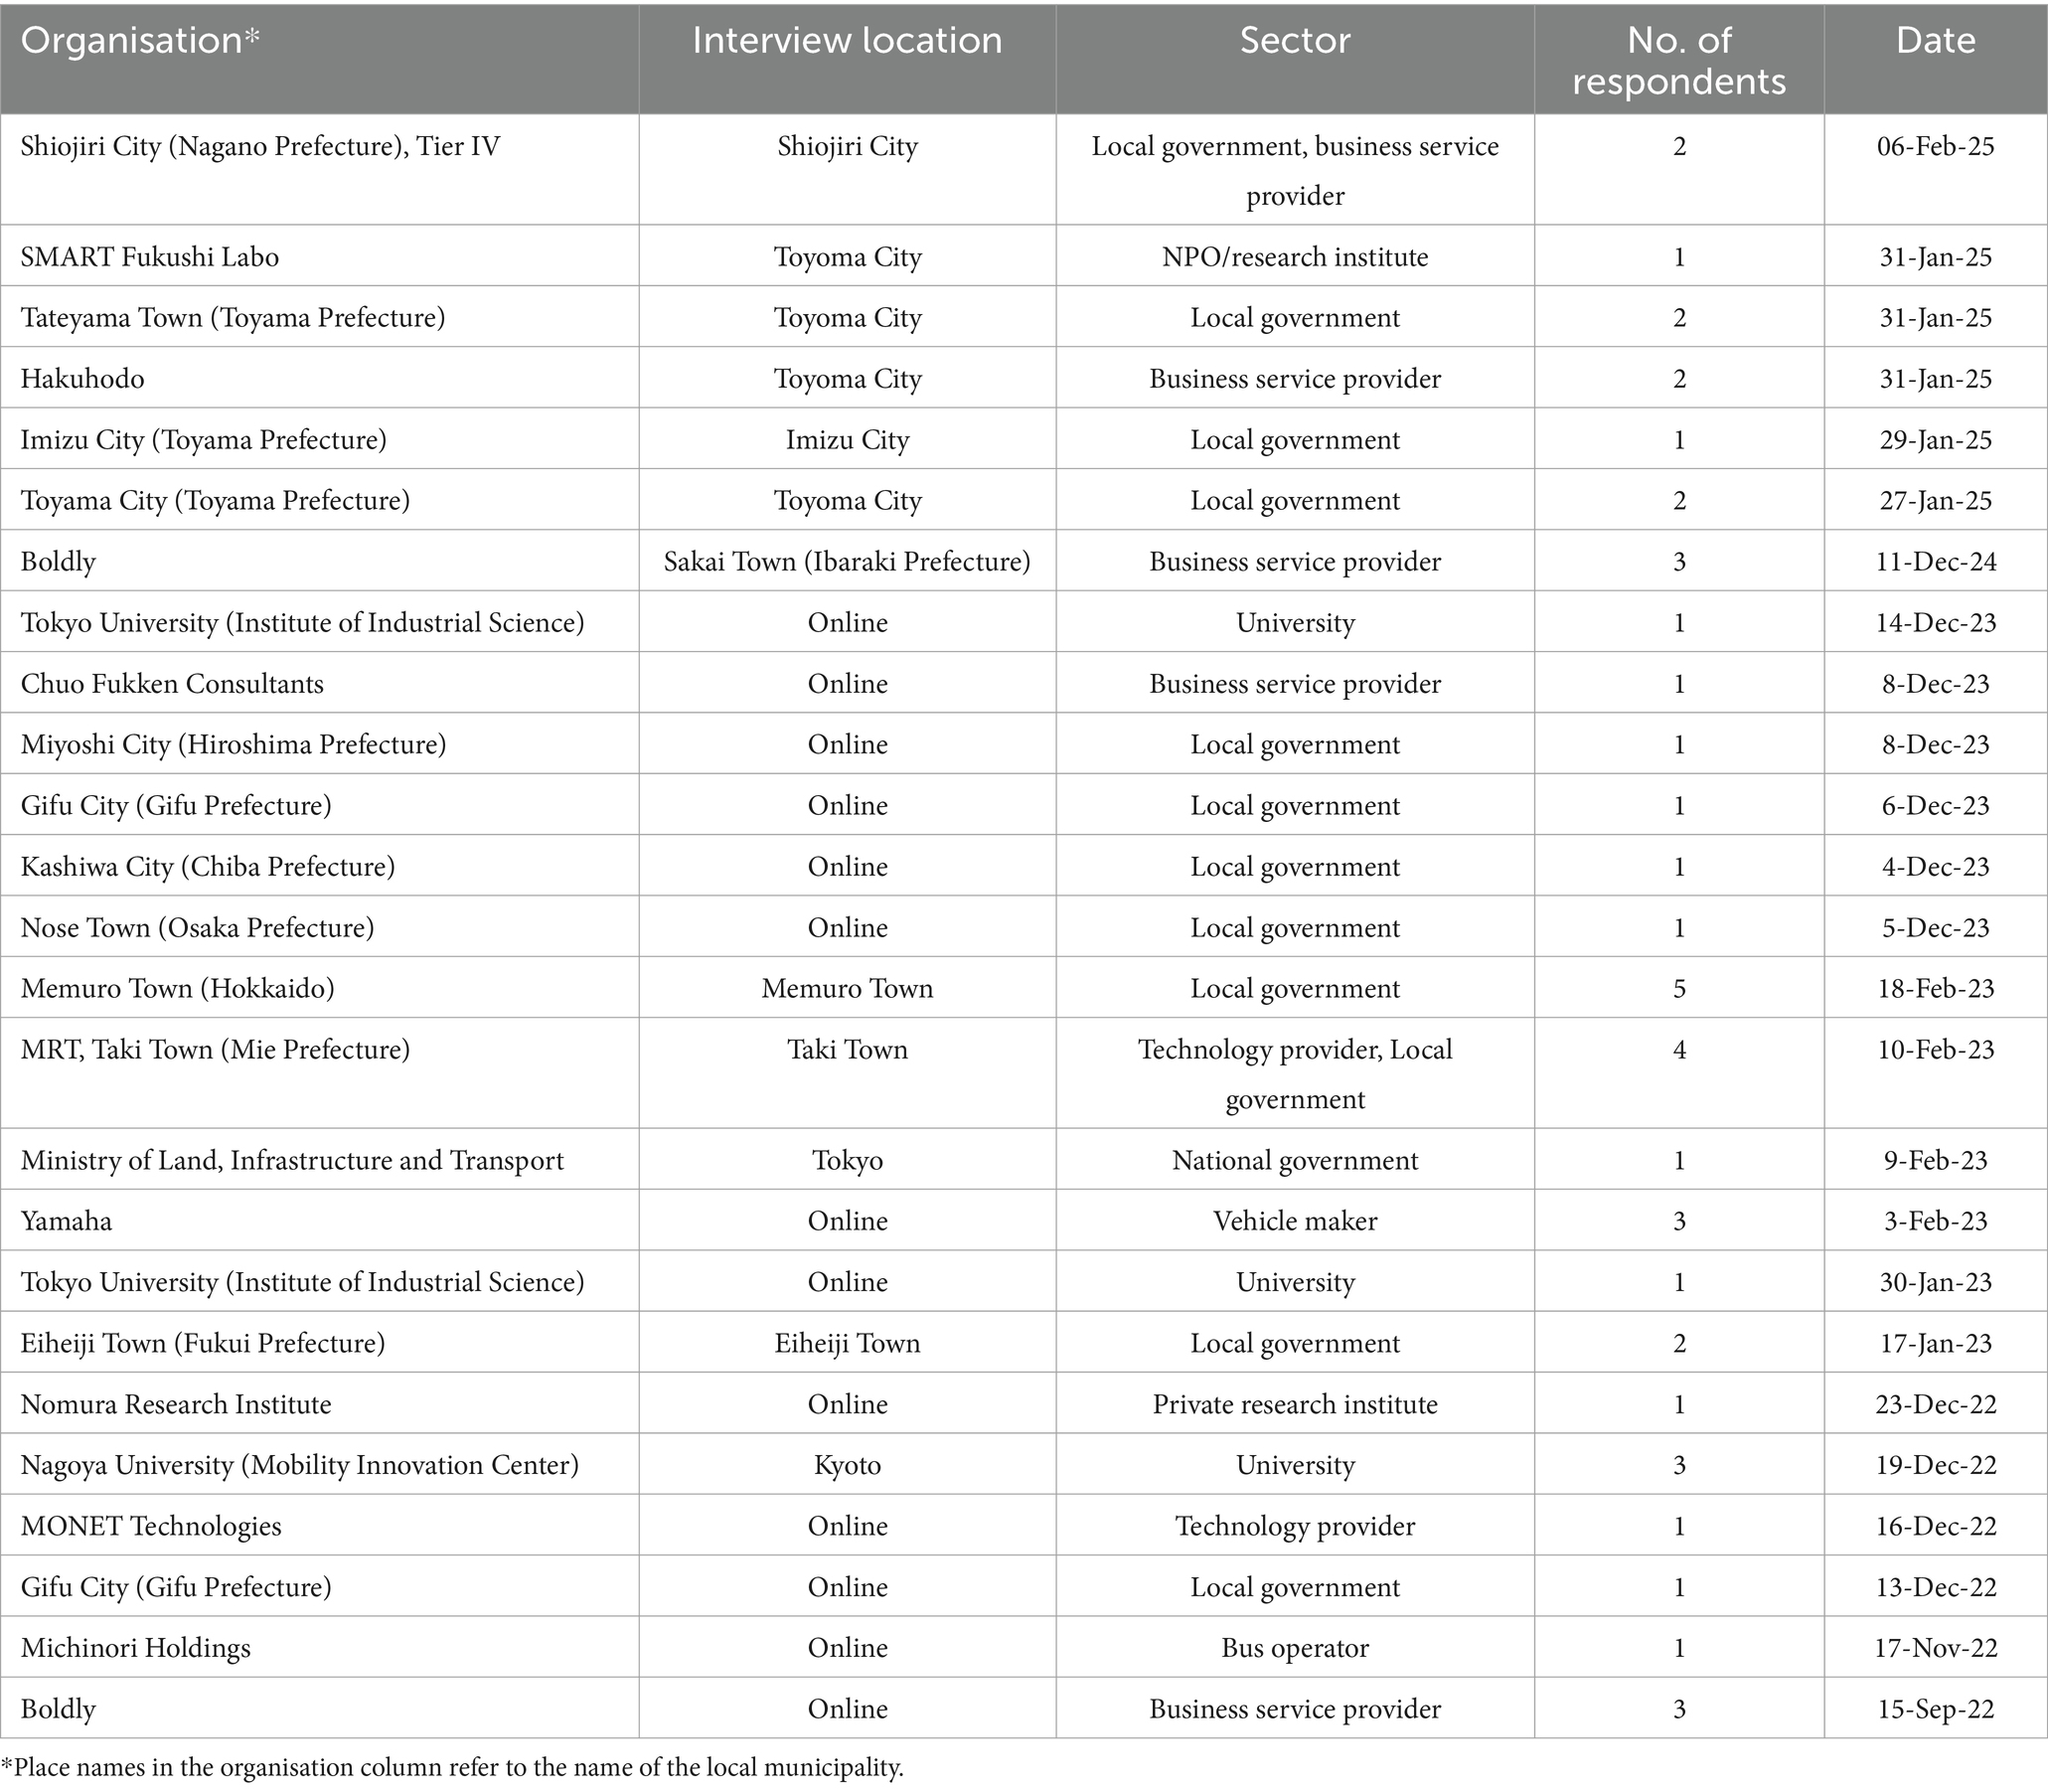
Table 2. Details of interviews (n = 24).
All interviews followed a standardised protocol. All were conducted in Japanese by the lead author – either in person or remotely – between December 2022 and February 2025. With respondents’ consent, all were recorded and subsequently converted to detailed notes or complete transcripts, thereby providing important secondary data during questionnaire design and the analysis of results. To maintain respondent anonymity while demonstrating transparency about our interview sources, references in the findings are indicated with anonymised codes (e.g., int. 1,4).
2.5 Structural analysis
A key feature of the questionnaires was the inclusion of an ‘influence matrix’ (also known as impact matrix) (Scholz and Tietje, 2002; Wiek and Binder, 2005; Duygan et al., 2025), which requested respondents to select directional relationships among the transport-related challenges experienced in their project implementation area. Specifically, respondents were invited to assign a value of ‘1’ to each challenge perceived to influence or be influenced by another challenge. A stylised illustration of the matrix structure is provided in Figure 2 (see also questionnaire in Supplementary material). The rationale for including this analysis is underpinned by qualitative evidence from prior research, which highlighted the interlinked and self-reinforcing nature of the transport challenges affecting the quality and availability of regional transport services across Japan (Trencher et al., 2024). Following a procedure described by Godet (1987, 2000), the influence matrix provides a formal tool for investigating the causal relations between the key elements defining a system. Although some studies use multi-value scoring to assess varying degrees of influence or dependence (see Weimer-Jehle, 2006; Duygan and Meylan, 2015; Campfens et al., 2025), we opted for binary scoring (0 or 1) to reduce the burden for questionnaire respondents and to cope with the lack of reliable data upon which respondents could base finer-grained judgements about the strength of a variable’s influence or dependence. This procedure resulted in an individual influence matrix for each project in our sample. Due to our interest in the common conditions experienced by smart mobility projects, we aggregated the project-level values for each variable into two matrices: one for larger municipalities and another for smaller municipalities (Supplementary Figure 4).

Figure 2. Stylised illustration of the influence matrix used for structural analysis. Respondents in each project were invited to assign a score of 1 to each cell where a specific variable influences or is influenced by another. Shaded cells account for the fact that a variable cannot influence itself. Individual scores from each project were then tallied to produce an aggregated matrix for larger municipalities and smaller municipalities.
The values in the two aggregated matrices were then used to calculate the activity and passivity scores for each variable (see shaded colour region in Figure 2). An activity score denotes the total extent to which a given variable influences others in the system, whereas a passivity score reflects the extent to which a variable is influenced by others (Scholz and Tietje, 2002; Arcade et al., 2003). A high activity score indicates that a variable functions as a driver – a root cause or initiating factor – in the system. Conversely, a high passivity score indicates that a variable is influenced by others in the system and is thus dependent on them.
To visualise these relationships, we plotted the results on a system grid (also known as activity-passivity plot) (Scholz and Tietje, 2002; Wiek and Binder, 2005), each depicting the combined activity and passivity score for each variable. This analytical procedure allowed us to formally identify and compare the most influential and dependant transport-related problems addressed across the projects. We also depicted the interactions identified through the influence matrix by creating a causal loop diagram. This additional step revealed the structural relations among the challenges as well as the reinforcing feedback loop resulting from their interrelations.
3 Results and discussion
3.1 Transport-related challenges inducing smart mobility innovation
Our analysis firstly focuses on the various transport-related challenges that prompted the introduction of smart mobility services in regional areas across Japan. As illustrated in Figure 3, we organise the questionnaire results into challenges faced by larger municipalities (cities with a population ≥100,000) and those reported by smaller municipalities (cities, towns and villages with a population <100,000).
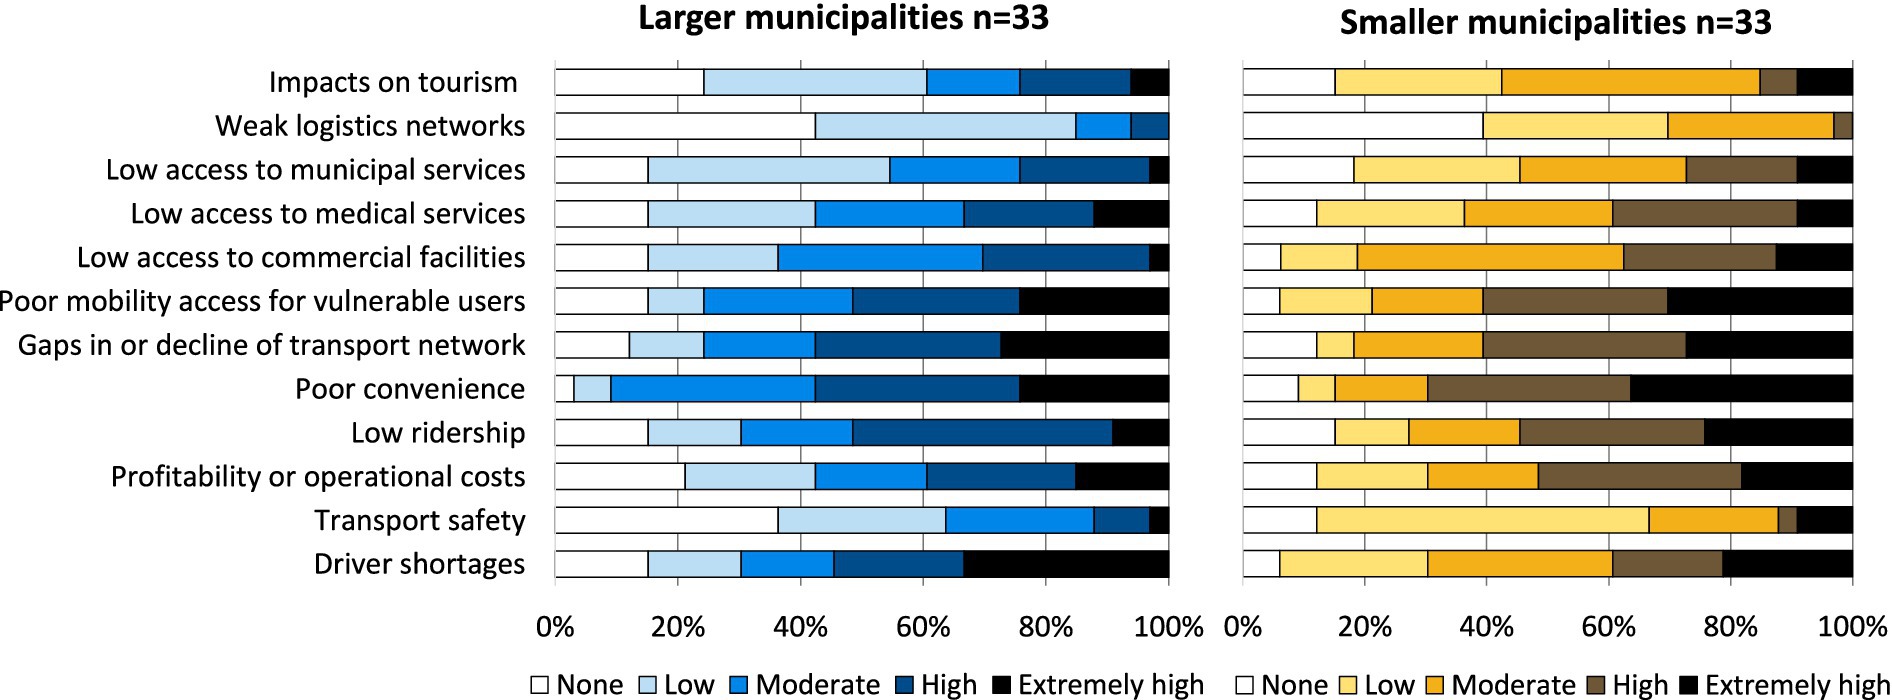
Figure 3. Transport-related challenges in communities implementing smart mobility projects. In all figures throughout this paper, data from projects that did not provide a completed response are excluded from some questionnaire items. In this figure, one project from the smaller municipalities group has been omitted.
An important finding is that the transport-related challenges experienced by larger and smaller municipalities are strikingly similar. The most commonly reported issues that affect transport users relate to the low convenience of existing transport services, network gaps or downsizing, and poor access for vulnerable users such as the elderly, young students or individuals without access to a private vehicle. From the perspective of transport operators, the most pressing challenges stem from driver shortages, financial difficulties (including profitability and operating costs), and declining ridership. Government data underscore the severity of these challenges (MILT, 2024). In 2023, 87.1% of route bus operators across Japan reported operating at a loss, while both taxi and bus companies continue to face worsening driver shortages alongside shrinking revenues. Rural areas are disproportionately affected by declining ridership, with the problem of passenger-less buses ‘carrying only air’ now a common sight across Japan (int. 12, 13). Confronted with ongoing financial losses due to shrinking ridership, bus operators across Japan collectively curtailed or discontinued 13,466 km of routes between 2013 and 2022 (MILT, 2024). As revealed in our survey, despite considerable variation in population size, density and the geographical conditions among the cities, towns and villages in our sample, Japanese municipalities are grappling with broadly similar transport-related challenges. Interviews strongly supported this finding, with one local government transport planner emphasising: ‘Municipalities facing the same types of problems as us can be found all across Japan’ (int. 15).
This said, as anticipated, certain challenges are more pronounced in smaller municipalities, many of which include rural or sparsely populated areas. For instance, profitability and operational costs were reported as an extremely high or highly relevant challenge by 52% of projects from smaller municipalities, compared to 39% in larger municipalities. Similarly, the issue of poor convenience is regarded as extremely high or highly relevant by 70% of projects in smaller municipalities against 58% in larger municipalities. Additionally, the severity of accessing commercial facilities such as supermarkets and shops and impacts on logistics and tourism are also more acute in smaller municipalities (see Supplementary Figure 1).
As highlighted in previous research (Avary et al., 2020; Fujisaki et al., 2022; Trencher et al., 2024), Japan’s ageing and shrinking population is significantly exacerbating these challenges. Peaking at 127 million in 2008, Japan has entered a period of rapid depopulation, seeing its population decline by an average of 551,000 persons each year between 2020 and 2023 (MIAC, 2024). In parallel, the share of aged persons (those above 65 years) continues to rise, reaching 30% in 2023 (MIAC, 2024). Questionnaire results reveal that 88% of projects in larger and smaller municipalities perceive populating ageing as a major factor influencing the transport challenges in their community (see Supplementary Figure 3). Indeed, some projects have emerged in rural areas where the share of aged persons (those 65 years or above) is 40% or higher (e.g., Project #2 in Nikaho City, Akita Prefecture). One critical issue catalysed by population ageing is driver shortages, as increasing retirements of older drivers and shrinking numbers of younger people make it harder to secure bus and taxi drivers (int. 13,14,21). Ridership and profitability are also negatively affected by ageing trends, as population shrinkage leads to reduced demand for transport services, which in turn erodes their profitability (int. 9). In response, many transport operators – including bus, taxi and train companies, most of which in Japan are privately owned – have been forced to curtail service frequency, cut routes, or, in some cases, withdraw from a community altogether (int. 3,9,13,15). The default coping strategy amongst most municipalities has been to fill the gaps left by downscaled or abandoned private bus networks with public shuttles, referred to in Japan as ‘community buses’. These services, however, tend to exacerbate fiscal pressures, as fare revenues typically recover only around 10% of operational costs (int. 12). Underscoring the gravity of this challenge, a national transport planner emphasised: ‘The number of (available) workers in community transport services is declining and virtually all operators are in the red. This is an extremely severe situation, affecting public transport more than other industry sectors’ (int. 9).
Given the interlinked and interdependent nature of the conditions undermining the vitality of collective transport services across Japan, our questionnaires invited respondents to indicate which issues were causing or exacerbating others. We then performed a structural analysis to obtain a systemic understanding of the interrelations between challenges (Supplementary Figure 4; Supplementary Table 2).
The structural analysis (Figures 4a,b) reveals a common group of issues. Variables with a high activity score can be understood as the root causes of various problems in both larger and smaller municipalities. Specifically, these root causes relate to driver shortages, financial hardship (profitability and operational costs), gaps in or reductions to transport networks, low ridership, poor convenience, and inadequate access for vulnerable users. Conversely, the analysis also identifies a distinct cluster of challenges with lower activity scores and relatively higher passivity scores in both larger and smaller municipalities. These problems can be interpreted as symptoms – primarily poor access to essential services such as medical, commercial and municipal facilities – which arise because of the aforementioned root causes.
The finding that transport-related challenges faced by larger and smaller municipalities share common root causes and symptoms not only reinforces the trend identified in Figure 3, but also remains robust despite variations in activity-passivity scores in each geographical setting. For instance, root-cause issues such as ‘gaps in or decline of transport network’ or ‘poor convenience’ exhibit differing activity scores between larger and smaller municipalities, the reason being that a slightly higher proportion of respondents in larger municipalities identified these challenges as causes of other problems. However, the relative strength of the influence of these challenges, as well as others, remains broadly consistent across both municipality size groups. Furthermore, ranking the highest and lowest passivity and activity scores in each municipality group (see Supplementary Table 2) reveals that the basic hierarchy of challenges faced by larger and smaller municipalities is highly similar.
As depicted in Figure 4b, the relationship between the various factors undermining the vitality and financial sustainability of community transport services can be conceptualised as a self-reinforcing loop, comprised of the aforementioned root-causes. The systemic nature of these challenges their complexity and difficultness to address, because multiple factors simultaneously contribute to the existence, persistence or severity of individual problems.
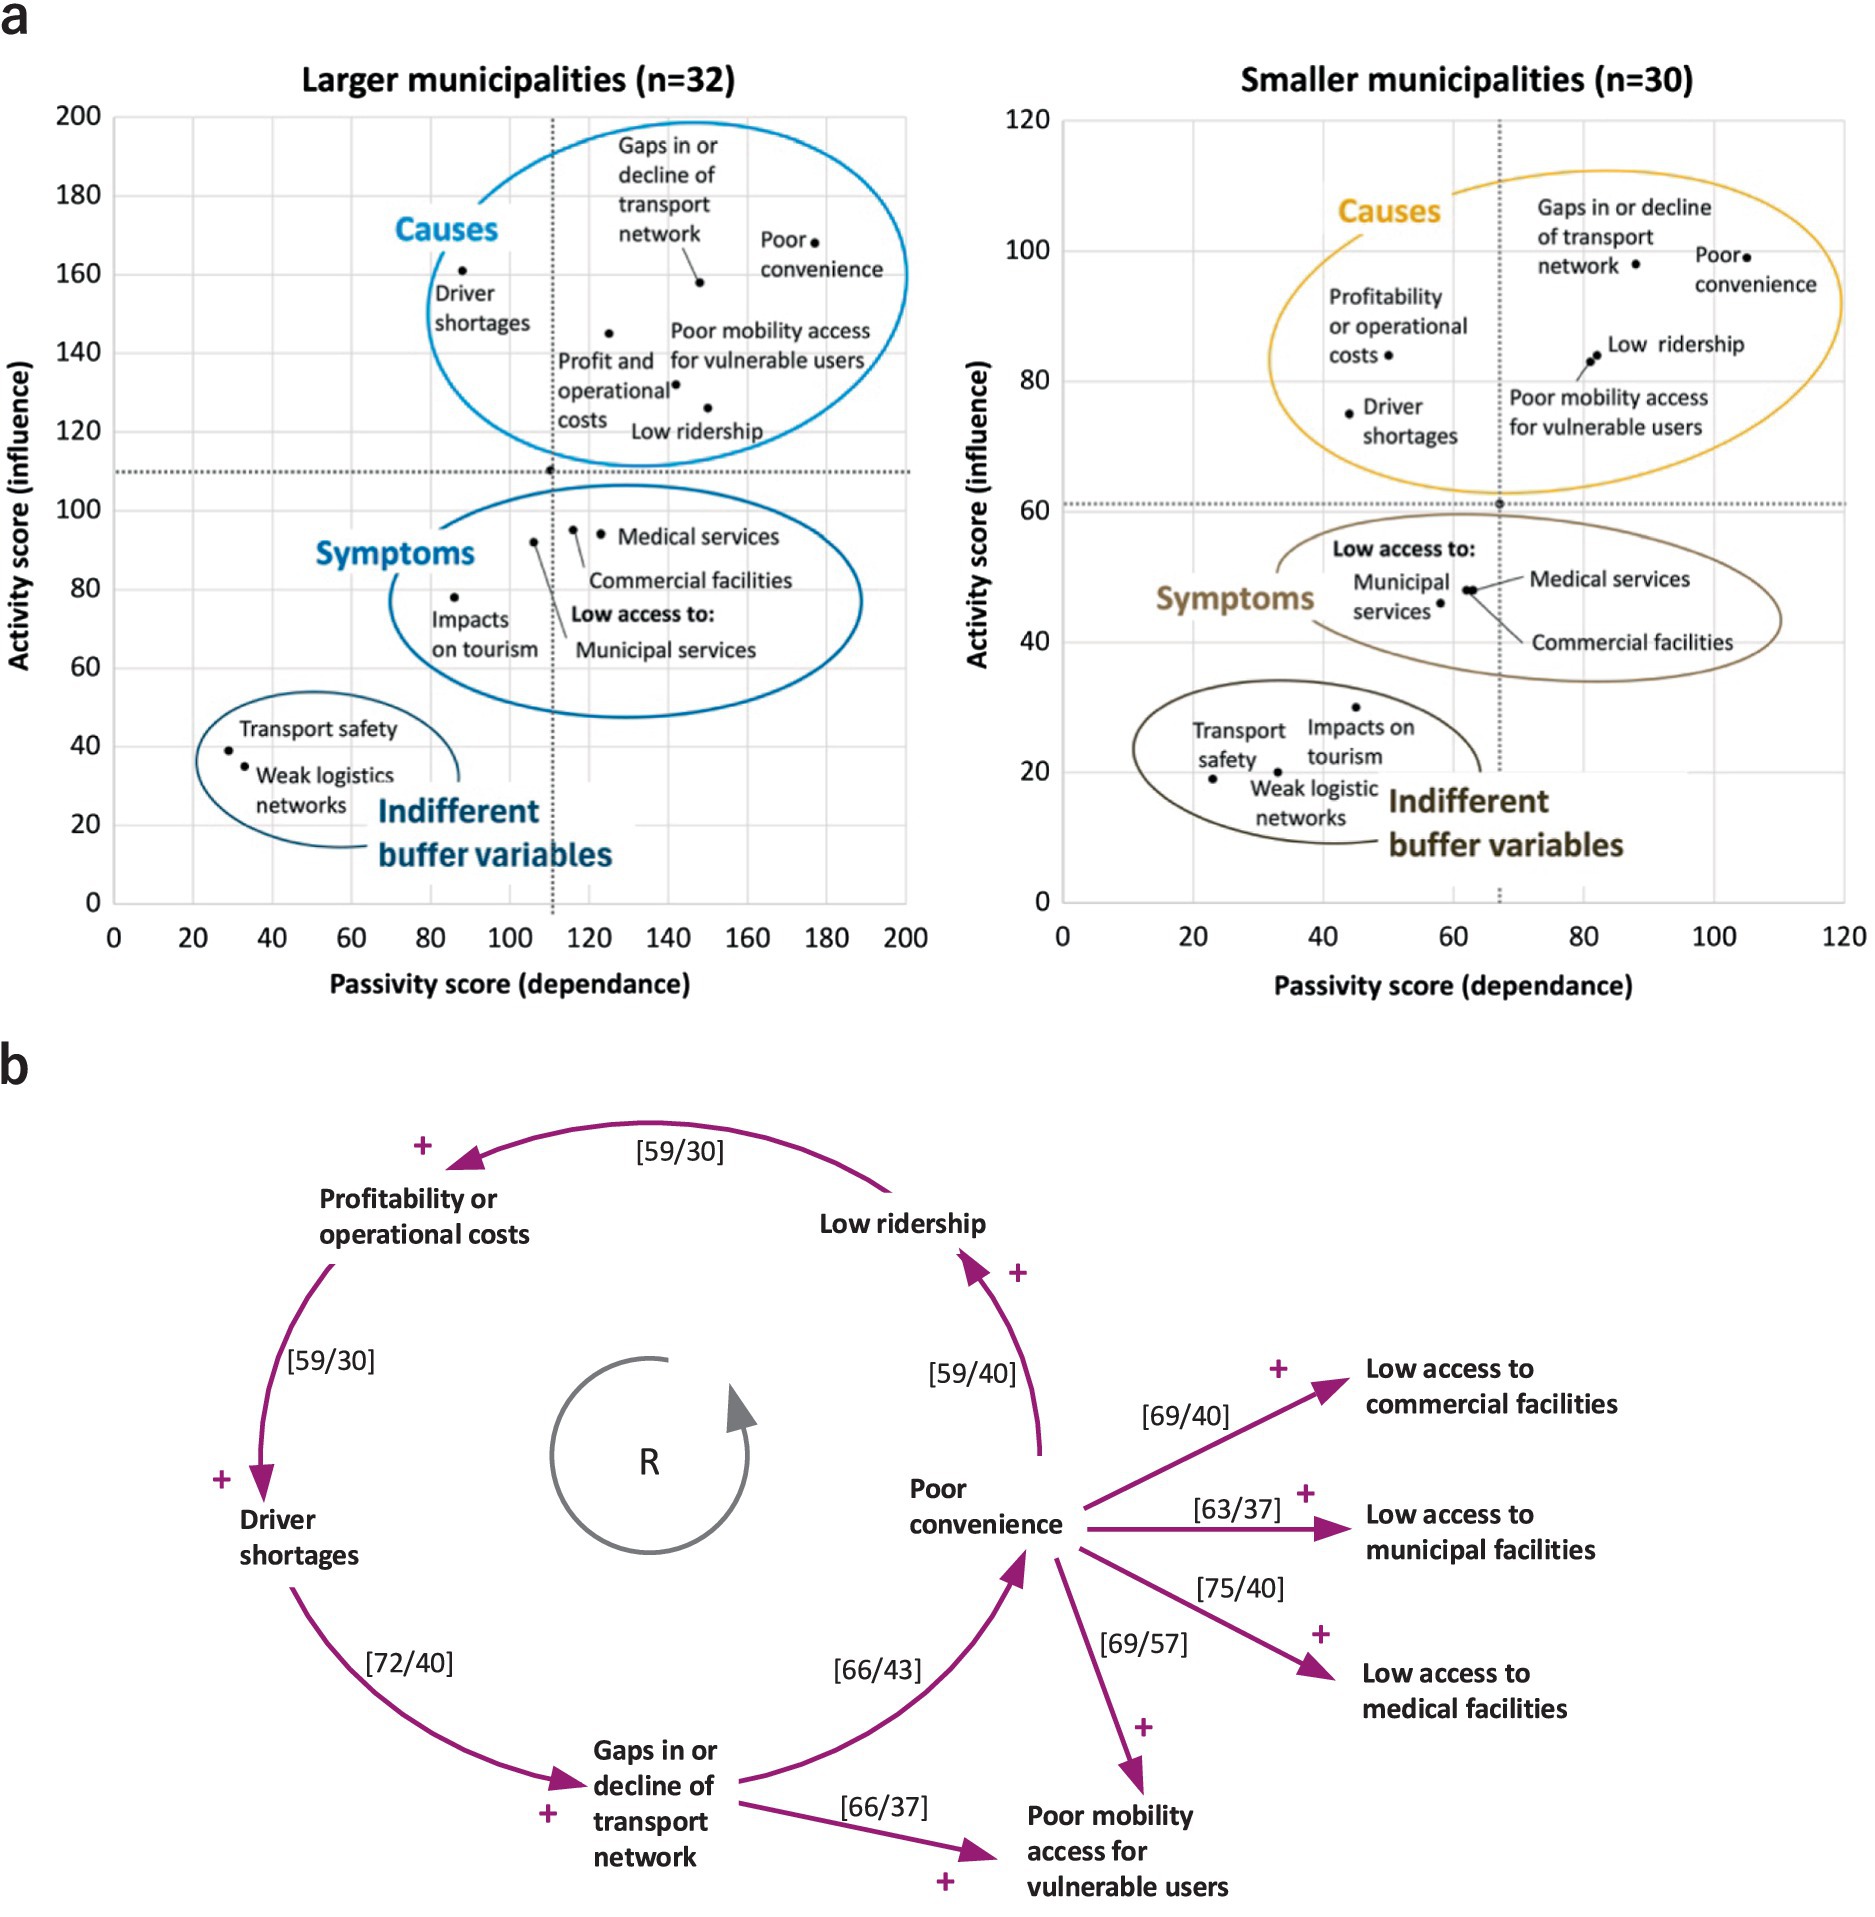
Figure 4. Structural analysis showing the influence and dependence of transport-related problems (a) Plotted scores reflect the total number of projects that selected a particular transport-related challenge as influencing or exacerbating another (a cause) or occurring because of another challenge (a symptom). Depicted challenges function as both causes and symptoms. Challenges depicted as ‘causes’ show those with a relatively higher activity scores while ‘symptoms’ show those with a relatively higher passivity score. Aggregated passivity and activity scores, along with rankings of relative importance, appear in Supplementary Table 2. The dotted axis in the middle of each figure represents the average passivity and activity score for all challenges. More information about this analytical procedure is provided in Section 2.5. (b) Causal relationships among the nine challenges receiving the highest scores, based on data from Supplementary Figure 4. All relationships are positive, denoted by a ‘+’, indicating that an increase in one variable leads to an increase in another. The values in brackets represent the relative share (%) of questionnaire responses indicating a direct influence between two variables, with arrows showing the direction of causality. Values to the left of slashes correspond to results from larger municipalities, while those on the right represent smaller municipalities. For example, within larger municipalities, the issue of ‘driver shortages’ was reported 23 times as directly influencing ‘gaps or decline in transport network’. Dividing this value by the number of valid responses (n = 32) yields a relative share of 72%. Higher values indicate a stronger causal influence. The loop marked ‘R’ denotes a cluster of challenges exhibiting a self-reinforcing relationship.
Interview statements strongly corroborate this picture of interlinked, self-reinforcing problems. Many respondents (int. 3,5,11,20) described how the low convenience of using public-transport services discourages usage, leading to reduced ridership and diminished profitability. In turn, issues such as driver shortages, declining ridership and low profitability drive the need to curtail or discontinue transport services, further decreasing convenience and perpetuating the cycle. Summarising this self-reinforcing loop, one respondent (int. 21) explained: ‘(Japanese municipalities) are facing a vicious cycle – because there is no money, they are cutting back on (transport) services. And after they cut back services, the number of users declines. And then they have to cut services again.’
3.2 Attributes of smart mobility projects developed in response to transport challenges
In response to the aforementioned challenges, municipalities across Japan, spanning both urban and rural areas, are experimenting with diverse configurations of smart mobility innovations. Figures 5a,b illustrate the key attributes of these projects.

Figure 5. Key attributes of smart mobility projects. Figures depict the type of vehicle and innovation used in each project along with the mobility target. Project codes refer to individual smart mobility projects listed in Supplementary Table 1.
The most commonly utilised vehicle types across both larger and smaller municipalities are buses, cars and taxis. In terms of differences across geographical settings, results indicate that smaller municipalities frequently use regular cars for ridesharing and DRT (on-demand) services. These projects aim to overcome challenges such as driver shortages, low ridership and high operational costs – characteristic of conventional bus services – by leveraging existing resources like taxi fleets or private vehicles driven by volunteer or paid residents (int. 4,12). Golf carts also feature in several projects, particularly those serving smaller municipalities and experimenting with AV technologies. Golf carts offer several advantages relative to other vehicle types such as microbuses, including low purchase cost, small size and ease of operation. These features lower the financial and technical barriers to automation while facilitating adoption within local communities (int. 10,17,20), where projects tend to rely on resident volunteers to assume daily driving and management responsibilities. Furthermore, the small size and agility of golf-carts makes them especially well-suited to navigating the narrow, maze-like streets that typify many regional towns and villages across Japan.
In terms of smart mobility innovations, ridesharing and DRT are by far the most prevalent approach, with many projects adopting both in parallel. Most of these projects leverage AI technologies to optimise route selection and timetabling, aiming to mitigate human resource shortages (int. 13). Electric vehicles are also widely adopted, with several municipalities seeking to reduce fuel-related operational costs or carbon emissions through electrification (int. 13). Notably, the majority of AV projects use electric drivetrains. However, among projects not employing AV technologies, only around one quarter (27%) have adopted electrification, indicating that most are delivering smart mobility services using conventional vehicles with internal combustion engines. Interviews with project implementers suggest that the low adoption of electrification is influenced by the limited availability of electric vans and buses from domestic manufacturers (int. 13,15).
Results for the mobility target indicate that all but two projects involve the direct transport of passengers. However, several projects, particularly in smaller municipalities, also transport objects. This approach reflects efforts to enhance operational profitability by integrating parcel and grocery delivery with DRT or ridesharing services. In addition, several projects deliver vehicle-based services in place of carrying people to a specific destination. A notable example is the ‘medical MaaS’ model (Okawa and Kitagawa, 2023), implemented across six rural villages in Mie Prefecture (project #15 in smaller municipalities). In this initiative, a van equipped with medical equipment, internet-based remote diagnostic tools and a nurse, directly visits residents directly at their domicile. This service eliminates the need to shuttle patients to and from distant medical facilities in sparsely populated rural locations. Another vehicle-based service model is the “marche bus” initiative introduced in the regional city of Obihiro in Hokkaido (project #10 in larger municipalities). This project repurposed a decommissioned city bus into a mobile general store, delivering foods and daily necessities such as cleaning products to residential communities where supermarket access is impeded by distance or the inability to drive for aged persons.
3.3 Objectives
As shown in Figure 6, the surveyed mobility projects are underpinned by strong ambitions to mitigate the many transport-related challenges impacting the socio-economic vitality of each municipality. Although national government actors funding smart mobility projects also aim to stimulate the development of new industries and technological development, our findings reveal a strong motivation among community-based protagonists to leverage smart mobility technologies as a tool for solving societal problems. Across both larger and smaller municipalities, the strongest objectives are to lower mobility access barriers, enhance convenience and fill gaps in transport networks. Meanwhile, we find comparatively less focus on the root causes of transport system deterioration, especially with regards to difficult-to-address challenges such as driver shortages, low profitability and high operational costs (see also Supplementary Figure 5).
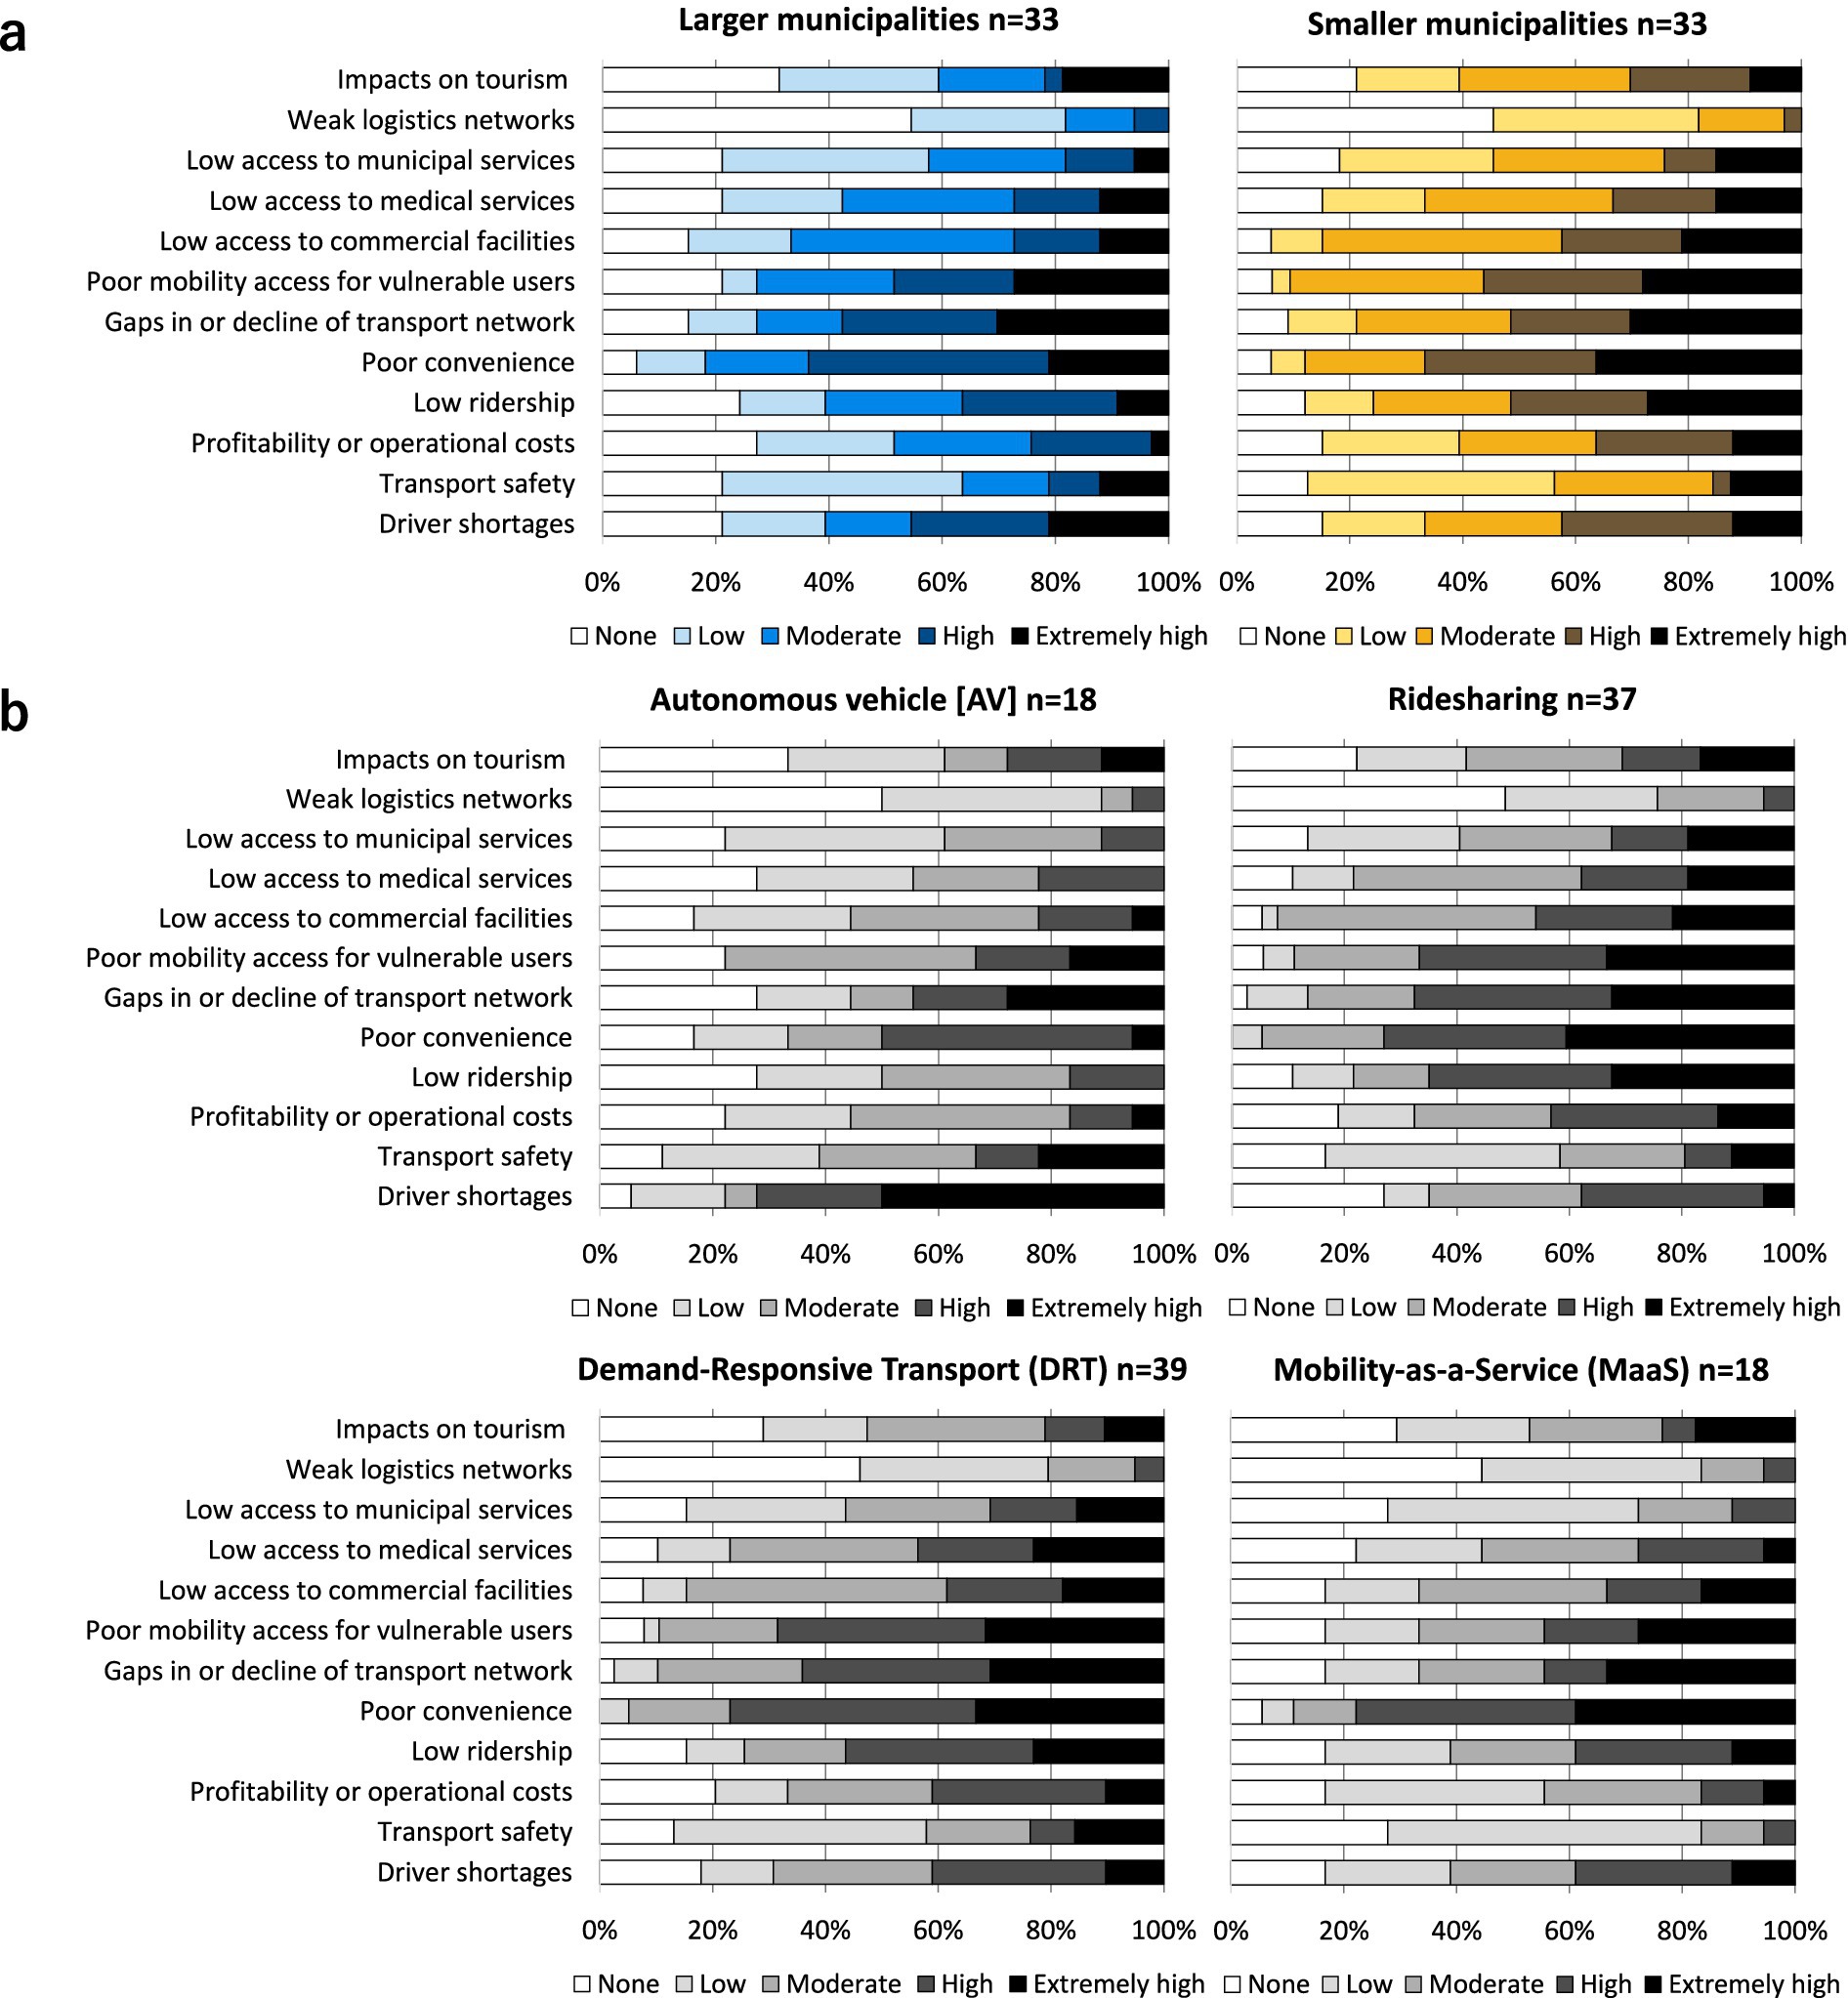
Figure 6. Objectives of smart mobility projects. Figures illustrate the transport-related problems addressed by projects. Shadings reflect the degree of relevance for each objective (from none to extremely high) reported in questionnaire responses. (a) Results broken down by larger municipalities and smaller municipalities. (b) Results categorised by the four key smart-mobility innovations. Due to the integration of multiple innovations in some projects, some projects are represented in multiple figures.
With regard to geographical context, the results are largely consistent across smaller and larger municipalities. This said, smaller municipalities exhibit a stronger resolve to tackling issues related to low profitability, ridership and poor accessibility to transport and services. This trend suggests that these problems are often more pronounced in rural or regional areas due to lower population densities and larger surface areas.
Breaking down results into four key smart mobility innovations (Figure 6B) reveals that certain types of projects have emerged more directly in response to specific transport challenges than other projects (Supplementary Figures 1, 2, 5). AV initiatives are characterised by a strong resolve to tackle driver shortages, with more than two thirds of projects (69%) rating the relevance of this objective as extremely high or high. With bus and taxi fleet operators across Japan struggling to maintain service coverage amidst worsening driver shortages, several interviews emphasised the necessity or inevitability of AV technologies as the primary solution to this problem (int. 17,23). Meanwhile, ride-sharing and DRT services, tend to be underpinned by ambitions to raise convenience, fill gaps in transport networks, boost ridership and lower mobility access hurdles for vulnerable populations (int. 4,11,12,13).
We also collected data on the age of primary users along with the destinations served, generating additional insights into the objectives of smart mobility projects. In both larger and smaller municipalities, older persons (aged 60 years or higher) make up more than half of the primary users (Supplementary Figure 6). Questionnaire responses also indicate that users of ridesharing and DRT services tend to be substantially older than those using AV and MaaS initiatives. This trend of serving older adults is reflected in the destinations served by projects, with medical facilities being the most common endpoint for ridesharing and DRT (Supplementary Figure 7). These findings, along with evidence from interviews, indicate that particularly ridesharing and DRT projects have emerged across Japan as a critical means of responding to the growing number of aged persons dependant on public transport to fulfil mobility needs (int. 4,11,12). In contrast, AV projects seek to address this ageing dynamic from the supply side, by reducing the need to secure drivers from Japan’s shrinking pool of workers (int. 3,17,14).
3.4 Problem solving effectiveness
The above analysis highlights that the smart mobility projects mushrooming across Japan are underpinned with explicit ambitions to mitigate the various challenges hampering the vitality and financial sustainability of community transport systems. This trend raises questions about the actual problem-solving effectiveness of these initiatives. To investigate this, our questionnaire invited project implementers to evaluate the impacts of their initiative from the perspective of the mobility challenges examined above.
Questionnaire responses (Figure 7) reveal that the most substantial improvements have occurred in the areas of mobility and service access, convenience, and, to a lesser extent, gaps in transport networks (primarily in larger municipalities). As demonstrated by the previous analysis, given that service network density and poor convenience are fundamental causes of the decline of community transport systems, these outcomes point to an important problem-solving potential in smart mobility technologies. That said, projects report considerably less success at alleviating other root-cause problems, such as driver shortages and profitability. A plausible explanation lies in the structural and self-reinforcing nature of these problems, as illustrated by our causal loop analysis above (Figure 4B). Moreover, as evidenced in previous research (Avary et al., 2020; Trencher et al., 2024) along with our questionnaire results (Supplementary Figure 2) and interviews (int. 4,9,12,14), the problems of driver shortages and poor profitability are tightly linked to Japan’s shrinking and ageing population. This demographic transformation – constituting an even more difficult-to-tackle macro-level problem that extends beyond the influence of community transport providers – may outweigh the benefits of improved network coverage and convenience. As one industry respondent (int. 6) explained: ‘As you know, the issue of population ageing and shrinking is progressing all over Japan, so the (larger) societal issue (we are facing) is clear and pretty much the same in all regions.’
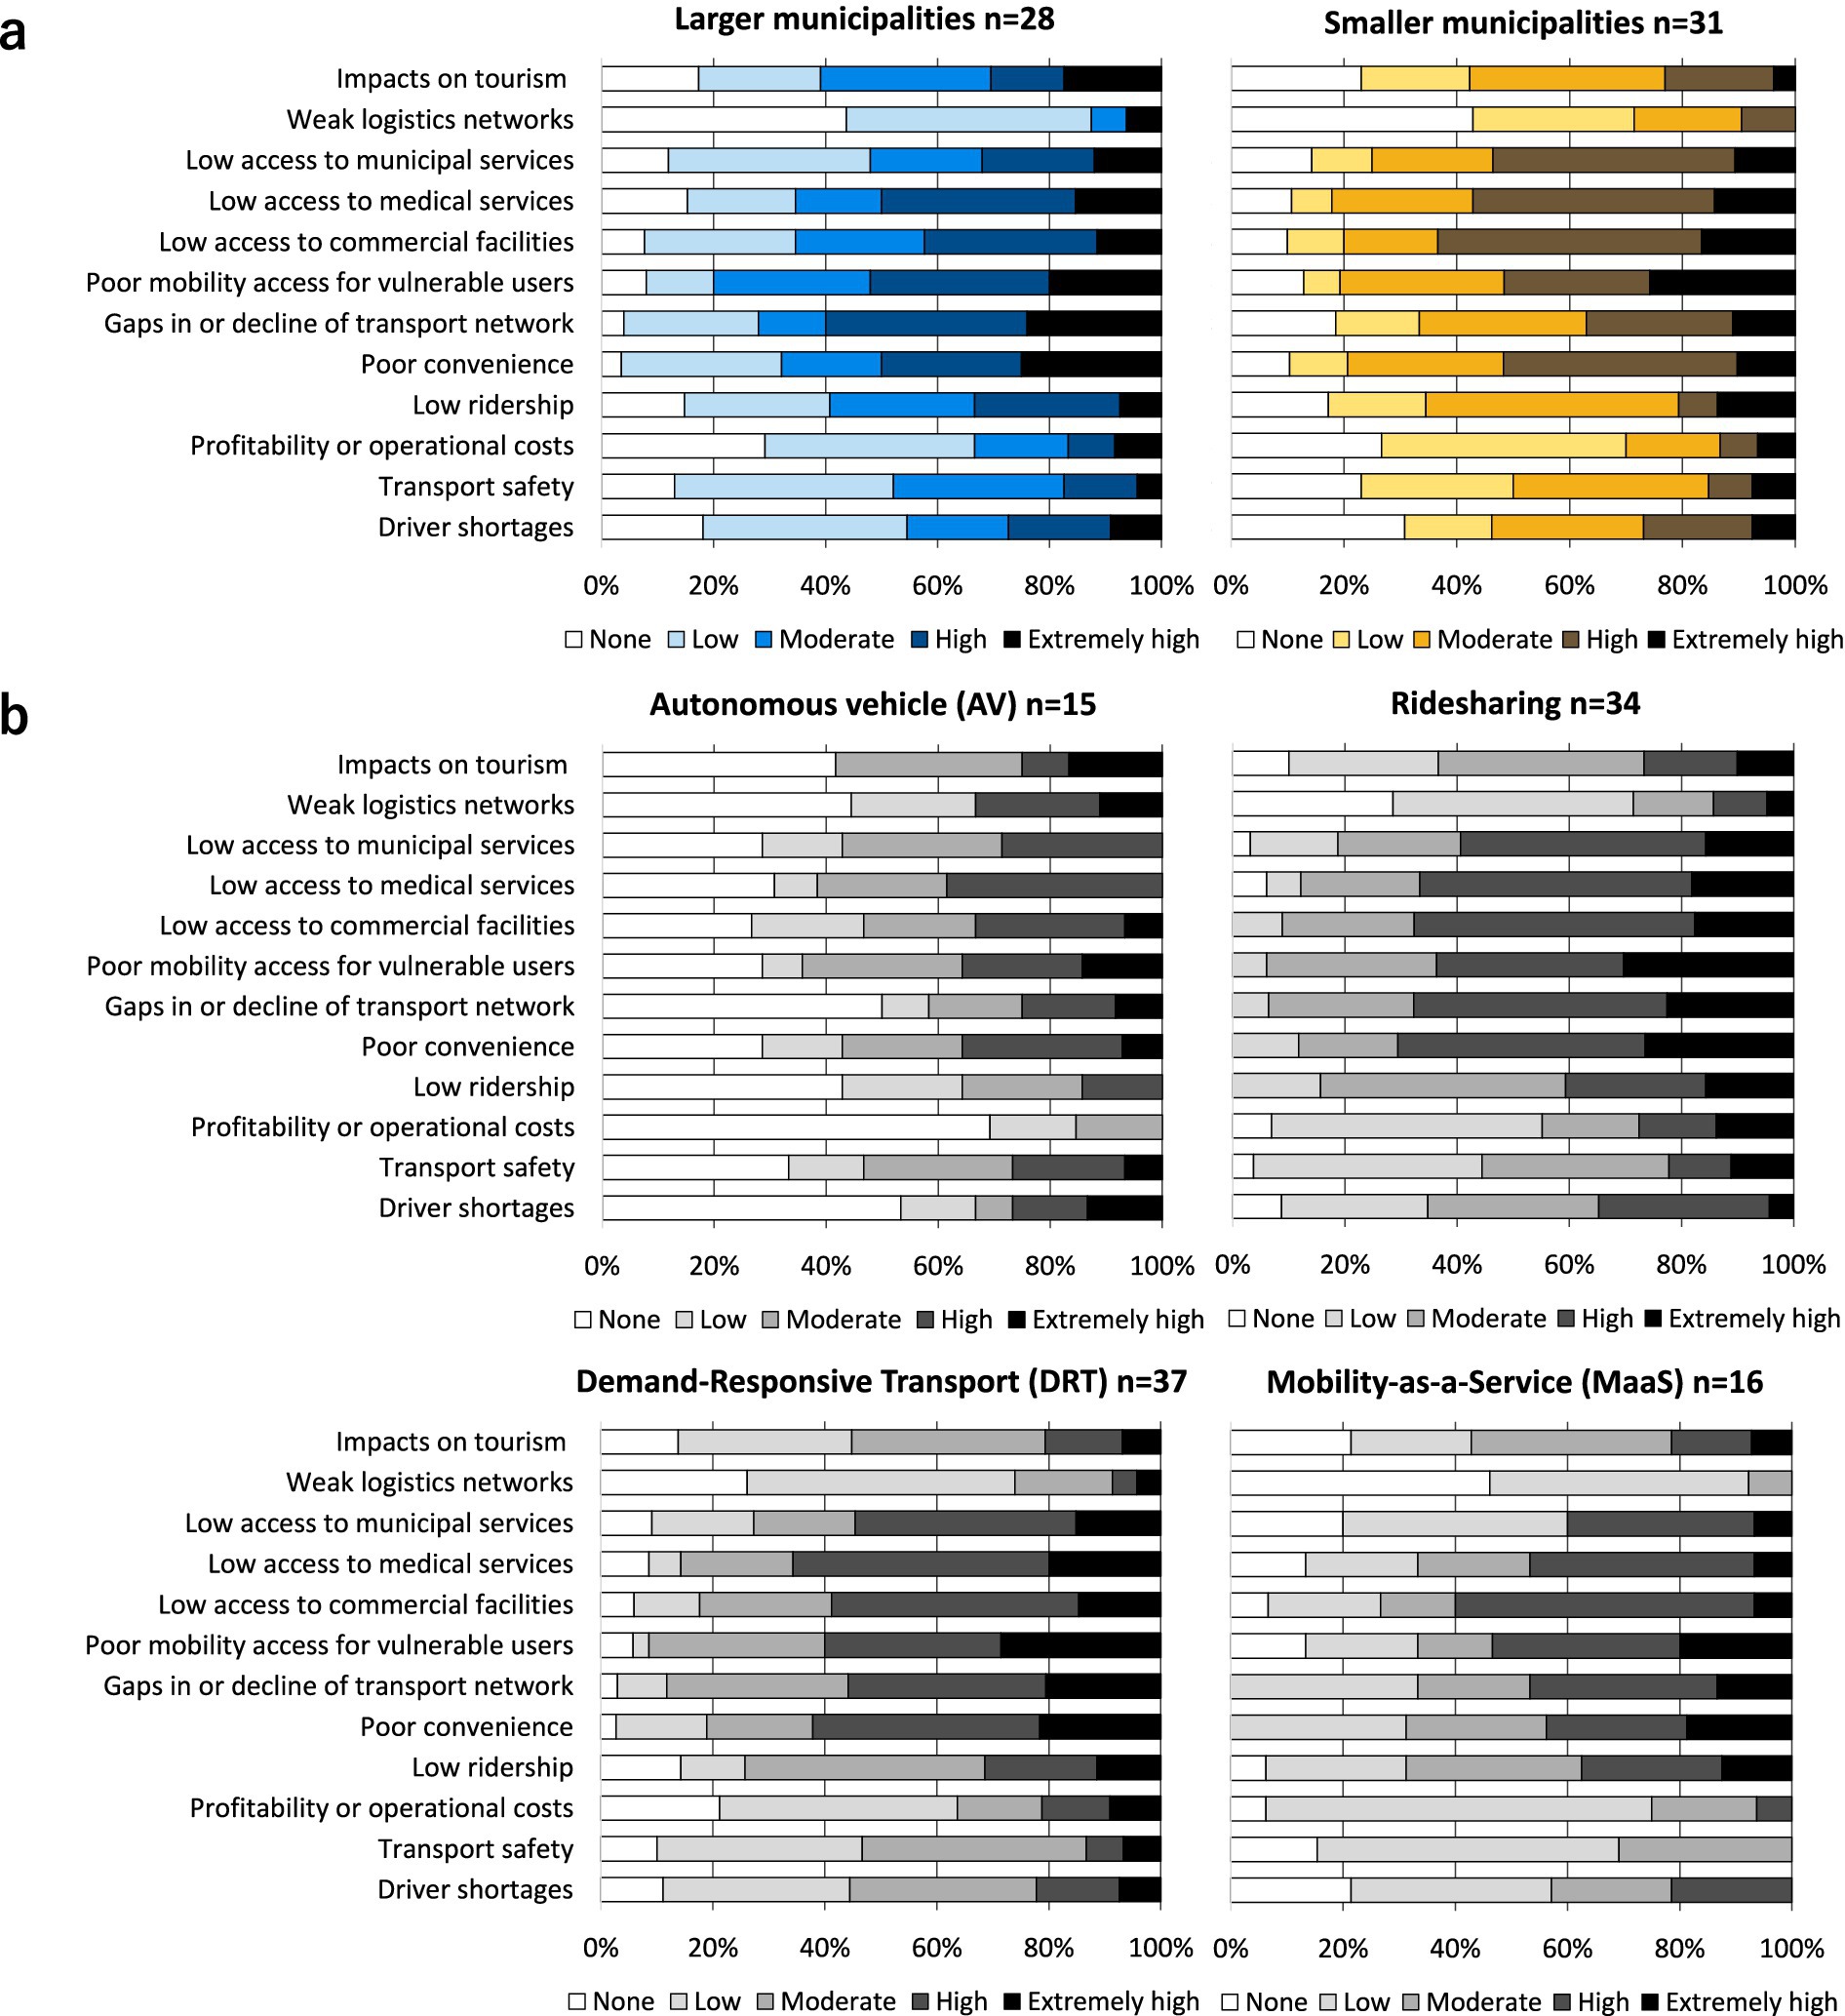
Figure 7. Improvements in transport challenges reported by projects. Figures show the extent and distribution of positive outcomes reported by each smart mobility project in questionnaires. All project categories have a lower n-size compared to previous figures, as several projects refrained from evaluating their project’s problem-solving effectiveness due to reasons such as insufficient data or implementation periods upon which to base judgements. (a) Results broken down by larger municipalities and smaller municipalities. (b) Results categorised by the four key smart-mobility innovations. Due to the integration of multiple innovations in some projects, some projects are represented in multiple figures.
When comparing findings across geographical settings, the degree of amelioration reported for most issues is broadly consistent between larger and smaller municipalities. However, three root-cause issues – driver shortages, ridership and inconvenience – show a higher degree of perceived problem-solving efficacy in smaller cities, towns and villages (Supplementary Figure 5). This finding suggests that the potential benefits of smart mobility may be just as important, if not more so, in rural areas.
Results also indicate that certain smart mobility innovations may be more effective at tackling certain challenges than others. Notably, ridesharing services report the greatest success at increasing ridership. Meanwhile, DRT and ridesharing projects both exhibit strong outcomes when it comes to raising convenience, filling network gaps and lowering accessibility barriers. Between 81 to 94% of DRT and ridesharing projects report moderate, high or extremely high improvement in these three areas. It should be noted that most on-demand services incorporate ridesharing (Figure 5). It is therefore likely that the ability of ridesharing projects to deliver positive outcomes for convenience and accessibility reflects the innate benefits for users of DRT services, including door-to-door transit, flexible routing and on-demand scheduling.
At the same time, questionnaire responses highlight the problem-solving limitations of smart mobility innovations. In the case of AV services, only 15% of projects reported a significant degree of amelioration (extremely high, high or moderate) in profitability and operational costs. By contrast, ridesharing models reported comparatively higher success, with 43% of projects indicating the same extent of improvement for financial performance. A similar pattern emerges for the challenge of overcoming driver shortages. While only one third (33%) of AV projects reported a substantial positive impact (extremely high, high or moderate), nearly two thirds (64%) of ridesharing services indicated improvements in this area. The comparatively lower ability of AV technologies to alleviate financial hardship and driver shortages likely reflects two factors. First, the high cost of vehicle acquisition, especially robobuses, poses a significant financial burden for cash-strapped regional municipalities (int. 17,24). Second, most AV projects have established remote monitoring centres to cope with the ongoing need for human intervention in route operations, as fully unsupervised automation remains unfeasible. However, this additional infrastructure further raises the per-vehicle operational costs. To mitigate this, AV projects share an eventual need to achieve economies of scale by operating multiple buses across multiple regions. However, the high costs of robobuses – currently around three times that of similarly sized conventional buses – remains a major obstacle to scalability (int. 13,15).
In evaluating the problem-solving capacity of smart mobility innovations, it is important to recognise that some projects will require several years to achieve their intended impacts. Furthermore, many projects functioned as demonstrations, running only at limited scale or for a restricted duration. Accordingly, we invited respondents to estimate the impacts likely to occur in the next few years if their project were upscaled or commercialised in the same location. This additional evaluative exercise reveals several areas where technological progress and future learning are expected to enhance the problem-solving efficacy of smart mobility initiatives.
As shown in Table 3 implementers of ridesharing, DRT and MaaS projects report the highest expectations about future prospects for ameliorating several root-cause issues, particularly profitability and operating costs, driver shortages and low ridership.
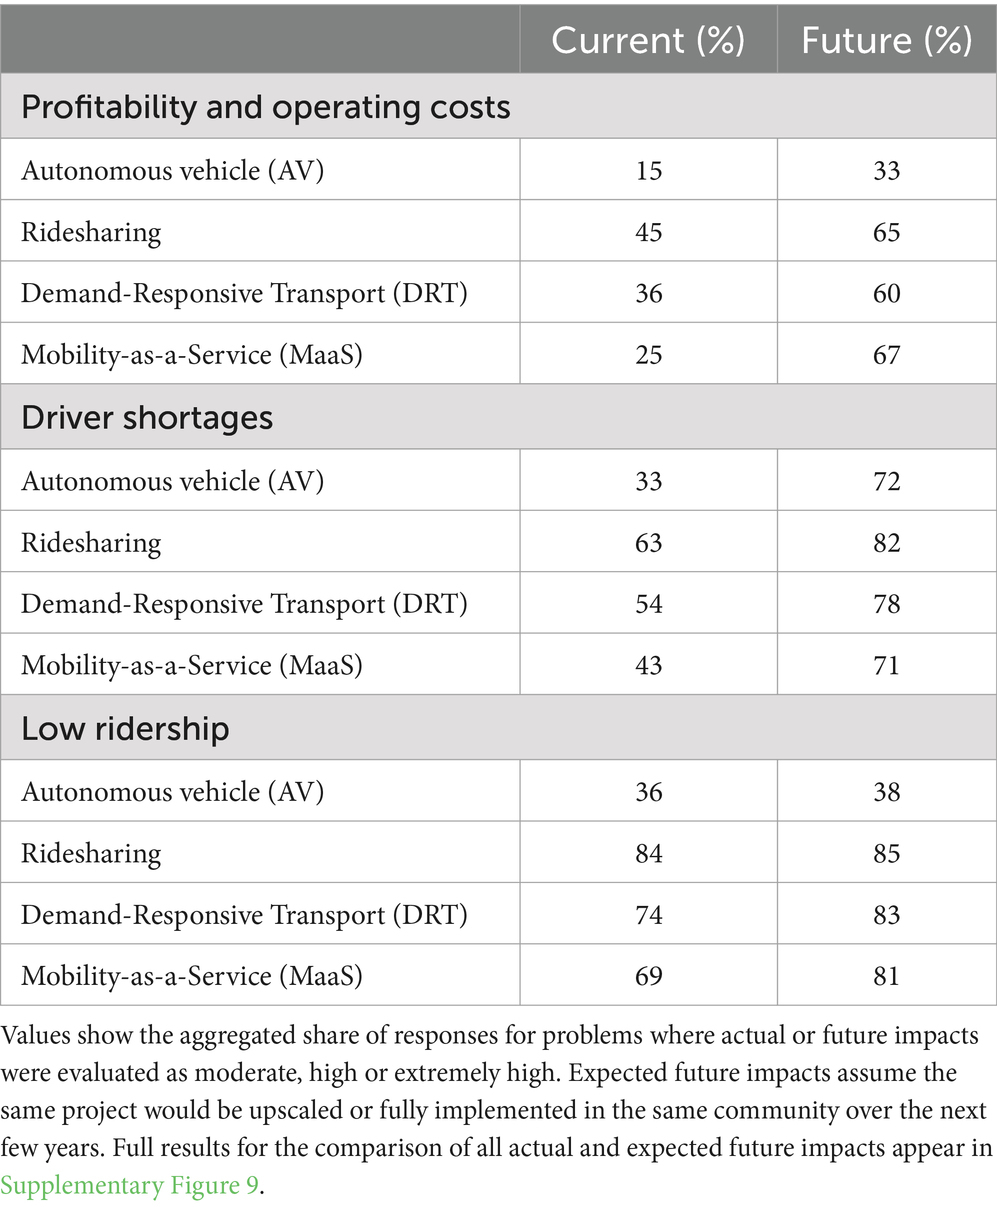
Table 3. Comparison of actual and expected outcomes for key root-cause issues.
Contrastingly, results for AV projects indicate that expectations for greater problem-solving potential in the coming years are less optimistic. While nearly three-quarters (72%) of AV projects anticipate substantial impacts (extremely strong, strong or moderate) for addressing driver shortages, expectations of future benefits for profitability and operation costs are duller, with only 33% of projects indicating similar optimism. This finding reflects the higher economic hurdles faced by AV projects, which as noted above, tend to incur significantly greater start-up and operating costs compared to mundane innovations like ridesharing. In parallel, our results suggest that until the cost and driving capabilities of AV technologies advance to the point where fully unsupervised driving becomes possible without compromising safety, less sophisticated innovations such as community ridesharing and DRT are likely to deliver more tangible benefits in the near and mid-term. As one project implementer of a DRT and ridesharing service stated, explaining their focus on cheaper technologies in place of AV systems: ‘We are waiting for AV technology to progress. We are currently unable to afford it due to its high costs (int. 13).
3.5 Implementation barriers
Questionnaire results (Figure 8) indicate that projects are grappling with a host of factors that hamper their effectiveness at improving the vitality and financial sustainability of regional transport systems through smart mobility innovations. The analysis here focuses on the existence of twelve barriers identified in previous work (Trencher et al., 2024). Five barriers stand out as particularly prevalent and severe. In order of stated importance,2 these are: (1) high costs of purchase and operation, (2) low profitability, (3) lack of human resources, (4) difficulties in obtaining data, and (5) low digital literacy among the elderly.
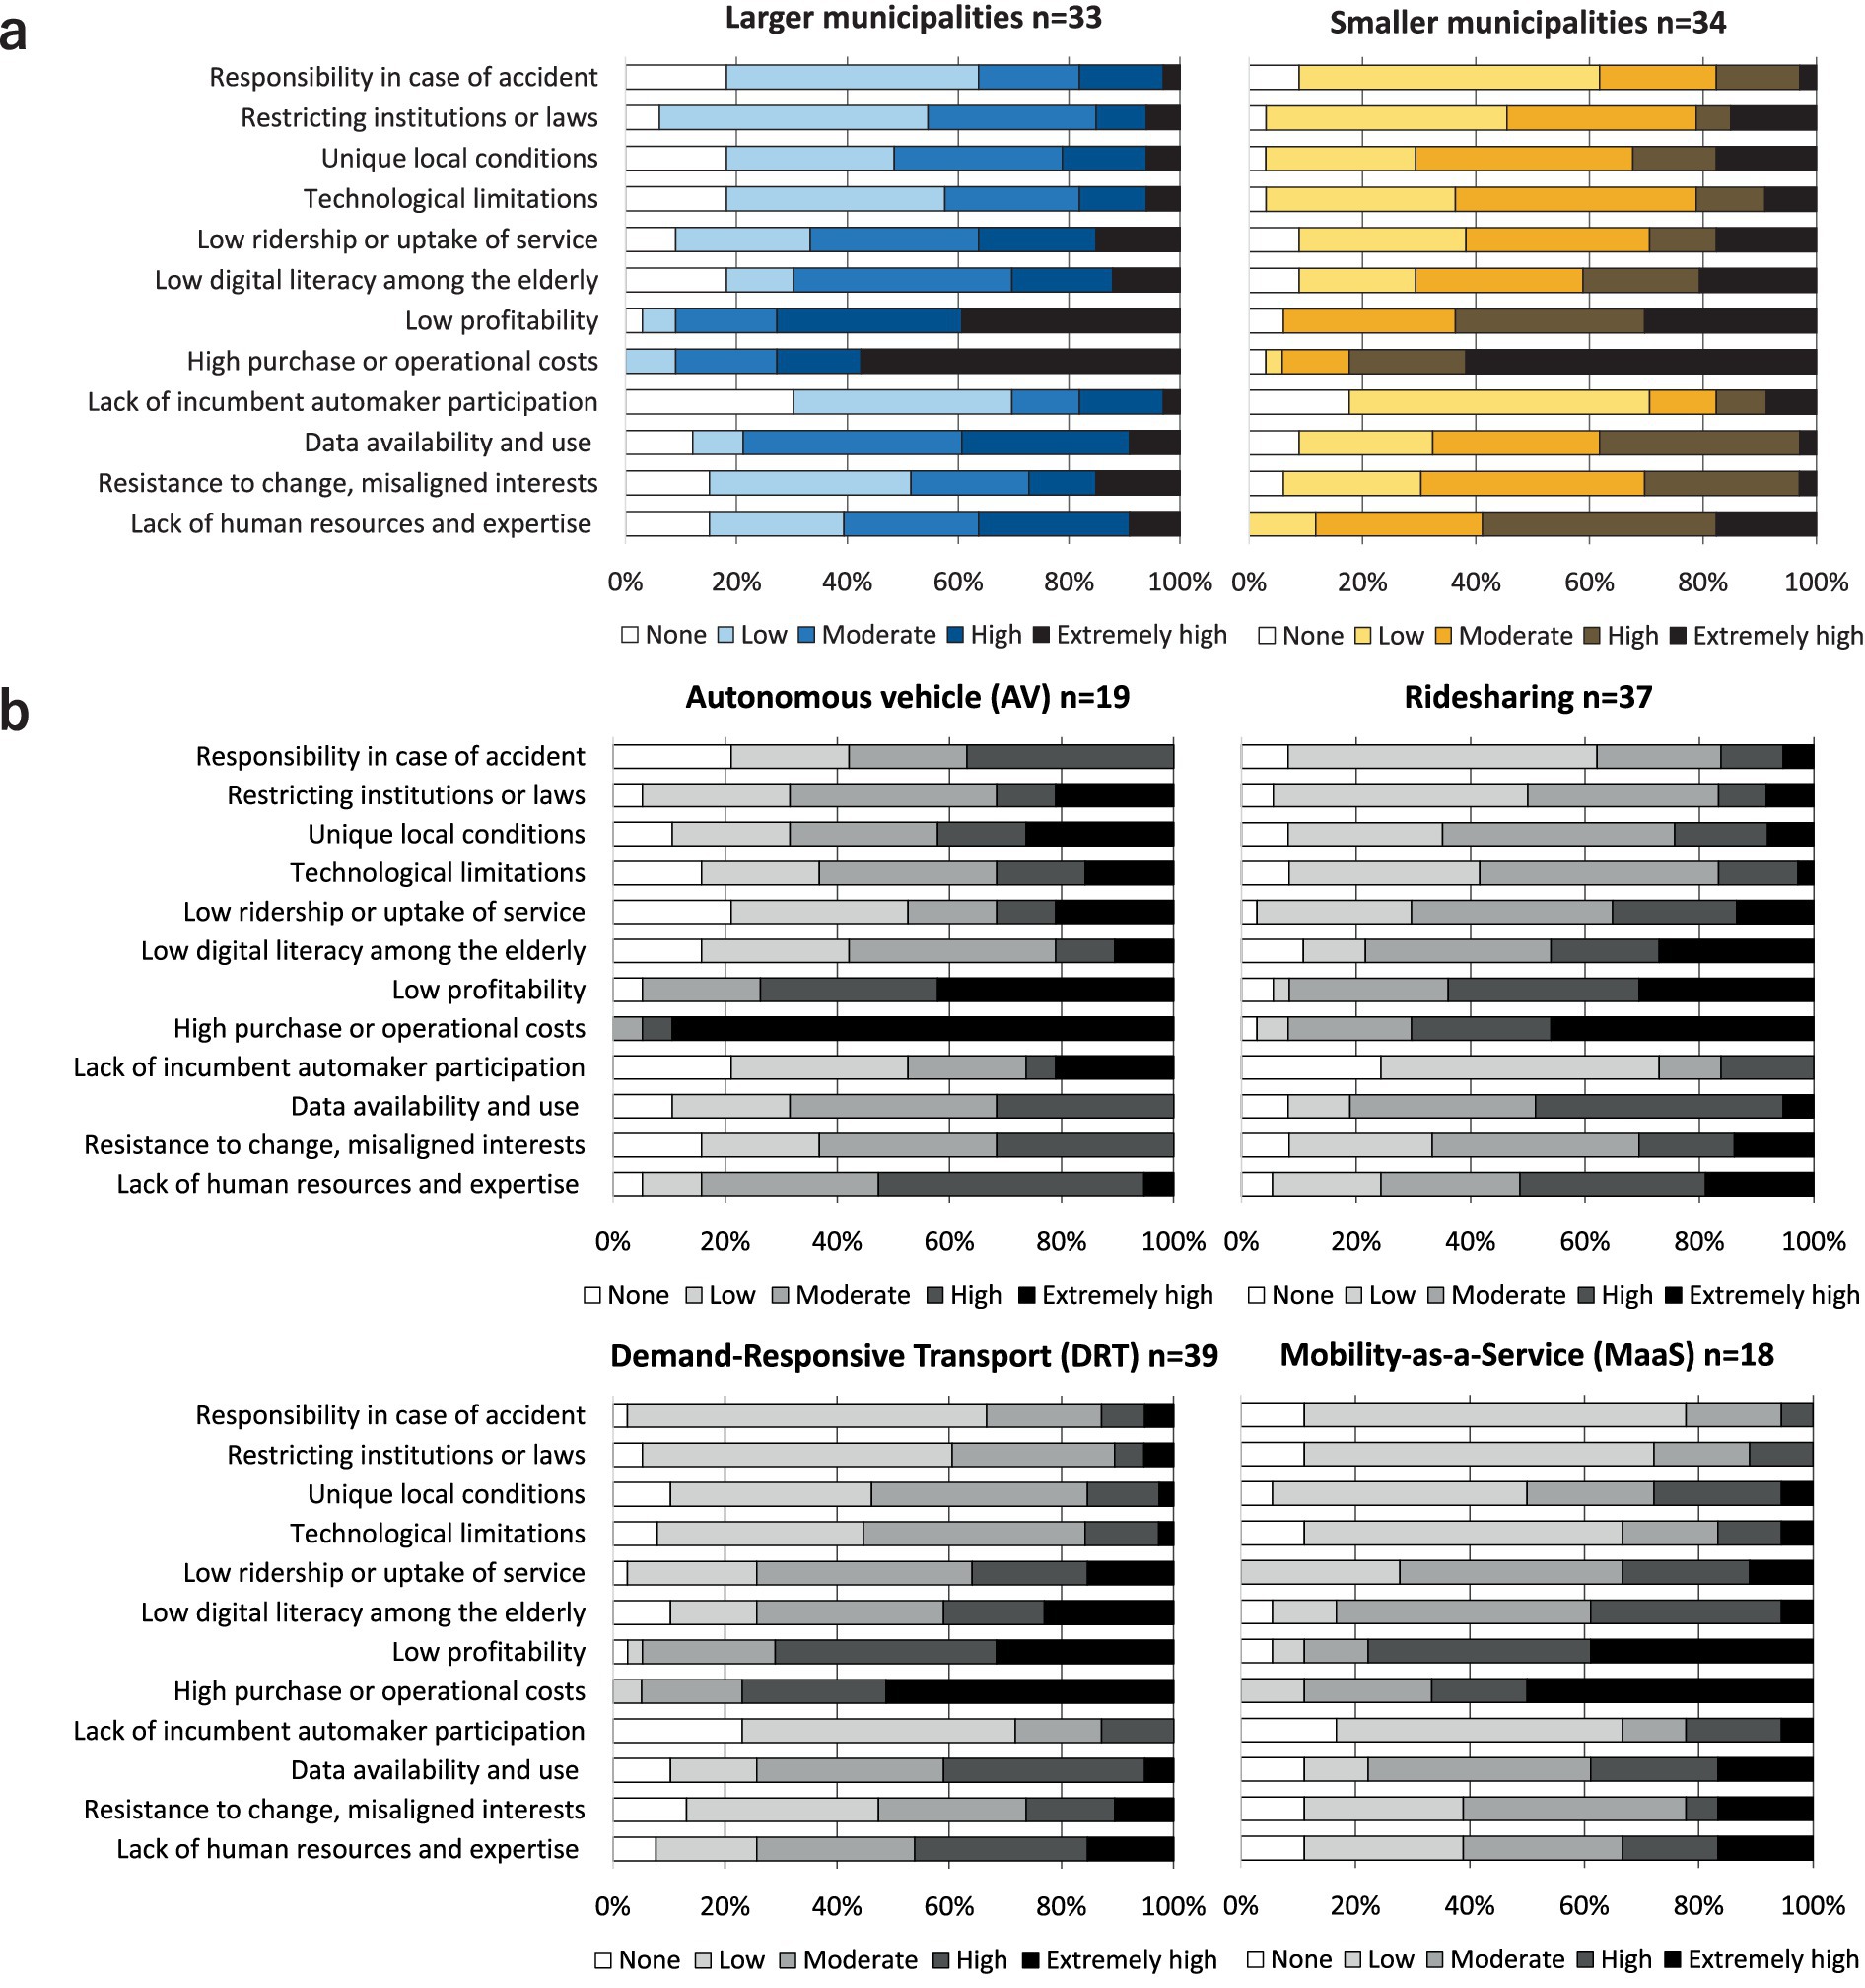
Figure 8. Barriers hampering implementation and upscaling of projects. Figures show the extent and distribution of barriers experienced by smart mobility projects during implementation. A dichotomised version appears in Supplementary Figure 10. (a) Results broken down by larger municipalities and smaller municipalities. (b) Results categorised by the four key smart-mobility innovations. Due to the integration of multiple innovations in some projects, some projects are represented in multiple figures.
The most pronounced barriers by far concern the burden of purchasing and operating smart mobility technologies, coupled with difficulties in attaining profitability. More than 90% of respondents in both larger and smaller municipalities described these two financial barriers as substantially relevant (extremely, highly or moderately) to their project. These barriers pose a two-fold challenge for project implementers. First, questionnaire results clearly show that in most cases new mobility innovations are unable to provide a panacea for overcoming the financial woes troubling existing community transport systems. Second, the high cost of implementing new technologies and the low likelihood of attaining profitability in declining socio-economic circumstances undermine the ability to upscale and rollout new innovations to other areas facing similar transport problems – a point explored below.
Similarly, data availability and utilisation was also widely reported as a substantial obstacle (extremely high, high and moderate) by all innovation types. This issue stems from the difficulties associated with obtaining information about the characteristics and performance of both existing and newly implemented transport systems. One manifestation of this problem is that municipalities and project operators often struggle to obtain reliable data about ridership and user behaviour from incumbent private transport operators (int. 12). Contributing factors include the absence of measures in small private bus and taxi companies to collect such data, inconsistencies in data formats, and a reluctance to share company data with external parties (int. 18,25).
The barrier of low digital literacy among the elderly is most pronounced in MaaS, DRT and ridesharing initiatives (Figure 8B; Supplementary Figure 10). These innovations share a reliance on smartphone apps and Internet-based platforms for reserving or accessing smart mobility services. However, many older residents in Japan, particularly those in their 80s and beyond, do not own smartphones or lack familiarity with Internet processes such as account registration and app usage. Consequently, numerous MaaS, DRT and ridesharing projects that leverage digital booking platforms reported difficulties in attracting elderly users (int. 1,12,13,18,20,21). To circumvent this issue, many municipalities complement digitally based services with telephone-based reservation systems when introducing smart mobility innovations. While this approach accommodates the needs of elderly users, it imposes an additional burden on municipalities with limited labour or monetary resources, thereby eroding the potential of smart mobility innovations to improve financial conditions and worker shortages.
For projects implemented in smaller municipalities, several barriers are considerably more prevalent and steeper than in larger cities. This is notably the case for deficiencies of human resources or expertise, reported by 88% of projects in smaller municipalities as substantial (extremely high, high or moderate) compared to 61% in larger municipalities. This situation likely reflects the lower population density of rural areas, where population decline and ageing are typically more pronounced than in larger cities, alongside difficulties in attracting skilled workers or companies (int. 20,22).
A further disadvantage for smaller municipalities, as highlighted by the results, is that unique geographical or socio-economic conditions are generally perceived as steeper obstacles than in larger cities. Many rural areas possess distinct geographical terrain, road conditions and tight-knit social communities, making it more challenging for smaller cities and towns to adopt generic mobility solutions developed elsewhere. Interviews revealed that this barrier is particularly relevant for AV models, since generic sensing and mapping technologies, as well as route designs, must be tailored to local conditions. For instance, a municipality leading one project in Western Japan (int. 15) described how local climatic and geographical peculiarities pose difficulties for the cameras and sensors on their robobus. Cited challenges include snowfall and interference from the setting sun as well as specific road features such as roadside trees and red-and-white poles used to mark lane edges for snow ploughs, which AV systems mistakenly identify as pedestrians. Additional obstacles include on-road farm machinery during harvesting season and the vertical orientation of traffic signals, a design intended to reduce snow accumulation. Given that such conditions undermine vehicle driving performance and safety, project implementers expressed concerns that while current AV technologies have reached the stage of being suitable for on-road demonstration projects, they remain insufficient for full implementation.
A final observation from the analysis on implementation barriers is that AV projects face stiffer hurdles across multiple realms compared to other innovations. From a financial standpoint, all AV projects (100%) cited high purchase and operating costs as substantial barriers (extremely high, high or moderate). Similarly, 95% of AV projects reported low profitability as a substantial barrier. Interviews with AV project implementers reinforced these findings, with several respondents (int. 15,21,23) asserting that attaining profitability is ‘impossible’ because of the high set-up and running costs and the difficulty of recovering costs amidst population decline. Cognising this structural issue, one AV project leader (int. 10) contended that the primary contribution of robobuses should be viewed as a means of preventing collapse of bus networks, which occur due to ongoing driver shortages, rather than financial benefits. Beyond financial considerations, however, the results indicate that AV projects also face stiffer obstacles in several other domains, including lack of human resources and expertise, restrictive laws and institutions, liability in the event of an accident, and the limited participation of incumbent automakers. Interestingly, the lack of engagement from major domestic automakers was not perceived as a critical issue for most other smart mobility models. Yet questionnaire results, interviews (int. 5,10,15,22) and informal conversations with experts and AV project implementers revealed a common sentiment that innovation, cost reduction and societal uptake could be accelerated if Japan’s incumbent car makers more actively supplied self-driving vehicle technologies for community transport systems. Currently, Japan’s incumbent automakers are concentrating their AV technology development on the private passenger segment, which offers higher prospects for profitability due to its larger market size. With incumbent bus makers yet to mass-produce compact electric buses suited to robobus applications, Japanese-made AVs are currently limited to electric golf carts or a narrow range of robobuses produced by domestic start-ups (e.g., Tajima Motors). Consequently, most robobuses currently operating in Japan rely on electric buses imported from Europe or China, which are subsequently fitted with domestically produced autonomous driving systems.
3.6 Likelihood of upscaling and commercialisation
Given that multiple factors hinder the smooth implementation and problem-solving effectiveness of smart mobility projects, a critical issue to consider is whether these projects are able to scale up or achieve commercialisation. This perspective is particularly relevant if considering that many projects in our sample were either conceived as demonstrations or remain in the early stages of implementation or commercialisation schedules. When queried about the likelihood of upscaling or commercialisation, 58 and 56% of projects in larger and smaller municipalities reported either a high likelihood or that they had already achieved this Supplementary Figure 11. Thus, more than half of the surveyed smart mobility projects are expected to progress beyond early demonstration or piloting stages toward more permanent, larger or commercialised operations. However, innovation-specific results reveal that it is especially ridesharing (57%), DRT (56%) and MaaS (56%) projects that report a higher likelihood of upscaling and commercialisation success. This trend likely reflects favourable outcomes in many projects at alleviating driver shortages while boosting ridership and convenience (int. 12,13). By contrast, the surveyed AV projects are less likely to progress beyond the early demonstration stage, with only 42% of projects reporting a high likelihood of upscaling or commercialisation. As noted in the above analysis, this trend undoubtedly reflects the steeper financial, technological, human and institutional barriers faced by AV projects.
4 Conclusion
Regional areas outside Japan’s major metropoles (Tokyo, Osaka and Nagoya) are increasingly struggling to maintain public transport services amidst declining demand and the weakening fiscal ability of local municipalities to subsidise unprofitable operations. The nationwide proliferation of smart mobility projects, implemented in response to the manifold causes and symptoms of this challenge, presents a valuable opportunity to empirically examine the nature of transport-related problems faced by communities, key attributes of these projects, and their effectiveness in ameliorating the conditions they address. Combining evidence from a questionnaire and interviews with project implementers, this study systematically investigated these perspectives by comparing the challenges, approaches and outcomes of 67 smart mobility projects implemented in large municipalities (primarily cities and urban areas) and smaller municipalities (encompassing medium to small cities, towns, villages and rural areas). In terms of unique contributions, we applied systems mapping approaches to systematically identify the structural and causal relations characterising the common societal challenges faced by contrasting regional settings. Furthermore, by systematically comparing four smart mobility approaches – Autonomous Vehicles (AV), ridesharing, Demand-Responsive Transport (DRT) and Mobility-as-a-Service (MaaS) – our study offers new insights into the specific trends and challenges associated with the implementation of each innovation.
4.1 Summary of key findings
Our analysis on the transport-related challenges affecting regional areas yields four key findings. First, we find that the nature of transport-related problems faced by both larger and smaller municipalities are remarkably similar, despite considerable variation in population size, density and geographical conditions. This indicates that both large cities and small towns and villages are grappling with fundamentally the same types of issues in trying to sustain their regional mobility services – an observation that contrasts with the tendency to discuss urban and rural settings separately in literature and policymaking (Porru et al., 2020; Flipo et al., 2023). Second, our structural analysis demonstrated that issues can be broadly conceived as causes (problems that catalyse or exacerbate others) and symptoms (problems that arise or worsen due to underlying causes). Symptoms primarily manifest as low accessibility to mobility and services that support day-to-day living, while the root causes of declining community transport systems were identified as inconvenience, driver shortages, low ridership and poor profitability. Third, these root-cause issues are interlinked and mutually reinforcing. Moreover, with almost all projects underscoring the influence of population aging, the fundamental origin of many challenges can be traced to the accelerating greying and contraction of the Japanese population. This systemic nature renders transport-related challenges structurally complex, persistent and inherently difficult to resolve. Fourth, the causal relationships between these issues are consistent across both larger and smaller municipalities. Our findings regarding the dynamics of the challenges affecting regional transport are thus generalisable across diverse geographical settings.
Our analysis of the effectiveness of the surveyed smart mobility projects in alleviating various transport-related challenges reveals a mixed picture. On the one hand, projects in both larger and smaller municipalities reported substantial success in improving convenience, reducing accessibility barriers for users, and filling gaps in existing transport networks. Considering that shrinking service networks and user inconvenience are two fundamental causes of the decline of community transport systems, these outcomes affirm an important problem-solving potential in smart mobility technologies. On the other hand, the projects reported considerably less success at improving the state of other root-cause problems, notably driver shortages and low profitability. Our analysis indicates that these two problems, especially low profitability, are primarily caused by low ridership. While expanding service network coverage and enhancing convenience can stimulate ridership, both ridership and profitability are heavily influenced by broader demographic trends. In Japan, these trends are dominated by the overarching challenge of an ageing and shrinking population (Avary et al., 2020; Trencher et al., 2024). As these demographic conditions lie beyond the control of transport service providers, the problem-solving efficacy of smart mobility projects is inherently constrained by these structural and persistent dynamics. The empirical evidence from this study, therefore, suggests that while smart mobility technologies offer valuable tools for mitigating certain challenges in regional transport services, they fail to provide a comprehensive silver-bullet solution to the broader, systemic forces driving these challenges.
Notwithstanding this limitation, the findings also suggest that some smart mobility innovations may possess greater problem-solving potential than others. Notably, projects using ridesharing and flexible routing or scheduling (DRT) reported higher improvements for convenience and mobility access, and to a lesser extent, mitigation of driver shortages. The strength of these innovations lies in their low reliance on costly technologies such as self-driving vehicles (AVs). By contrast, technologically sophisticated solutions like AVs face considerably higher barriers to smooth implementation, upscaling and commercialisation.
4.2 Implications for practice and future research
Here we distil three sets of implications from our key findings. First, the study demonstrates that while the transport-related problems occurring in Japan’s highly diverse regional areas – whether large cities or small towns and villages – are broadly similar, the effectiveness of different smart mobility interventions varies considerably. Notably, most ridesharing and DRT projects reported strong improvement of several critical transport-related challenges. This finding suggests that policymakers, both in Japan and internationally, should not neglect these relatively mature and readily deployable albeit mundane technologies. Although they tend to receive less attention than cutting-edge innovations like AVs, our results show that ridesharing and DRT solutions are already delivering tangible benefits, particularly with regard to lowering mobility access barriers, ameliorating ridership and coping with driver shortages. With ridesharing and DRT projects also mushrooming across Europe, North America and Australia (Mulley et al., 2023), the time is ripe to foster international knowledge exchanges about successful approaches in different mobility projects and optimal governance models. Policymakers should consider embedding these lessons and models into transport planning while incentivising further experimentation, refinement and upscaling (Sengers and Raven, 2015).
Second, while the challenges identified in this study are grounded in Japan’s unique demographic and socio-economic context, they mirror trends observed globally. As cautioned by the UN (2023), population ageing, declining birthrates and overall demographic contraction are emerging as defining megatrends of the 21st century. Policymakers and transport planners in many countries are already confronting these demographic shifts, notably in Northern Europe, Italy, China and South Korea. The implications of ageing populations for public transport systems, along with the effectiveness of different smart mobility innovations introduced in response, offer a growing and promising area of scholarly inquiry (Shergold et al., 2015; Lin and Cui, 2021; Thaithatkul et al., 2022). As the country grappling with the most rapid population ageing globally (World Bank, 2025), Japan offers valuable insights. Its early responses provide a pioneering case from which other countries can draw lessons (Avary et al., 2020) in managing the consequences of population ageing and shrinkage on regional mobility (Trencher et al., 2024).
Third, and largely due to population ageing and decline, the analysis on problem-solving effectiveness and implementation barriers indicates that all types of smart mobility projects in Japan are likely to encounter persistent difficulties in attaining profitability. This is because smart mobility technologies are inherently costly, and because these projects attempt to serve areas that have already experienced downscaling or abandonment by incumbent transport operators precisely because of low ridership and profitability. Consequently, there is a pressing need to reframe the societal value of public transport, expanding beyond a narrow focus on improving financial performance. In the past, public transport services in regional Japan and many industrialised countries were profitable due to higher utilisation rates (Avary et al., 2020; ITF, 2024). Today, however, the remaining services increasingly depend on public revenue for survival. Yet the fiscal capacity of local municipalities in Japan and elsewhere continues to shrink as a growing share of working adults shift from the workforce to retirement and pensions (OECD, 2023). These realities underscore an urgent need to foster societal consensus for publicly funding and modernising unprofitable regional transport services, recognising the critical role that collective mobility infrastructure plays in sustaining the basic functioning of human societies. Particularly in light of the growing disparity between rural and metropolitan areas in terms of public transport quality (Vitale Brovarone, 2022; Ahonen et al., 2024), policymakers should view smart mobility projects not only as means of modernising shared transport infrastructure, but as essential tools for promoting social inclusion, equity and well-being in regional development (Flipo et al., 2023). A critical question for future research and policy discussions is therefore: How can we better account for and integrate the non-monetary, socio-cultural value of regional mobility services into transport planning, policy evaluation, and funding mechanisms?
Finally, some methodological limitations of this study also suggest important avenues for future research. Our evaluation of the problem-solving potential of smart mobility projects relied on the subjective views of project implementers and lacked a systematic procedure to objectively measure actual impacts. This approach innately suffers from several reliability limitations. For example, respondents may have overestimated the impact of their own project due to vested interests or personal attachment. Additionally, the surveyed projects were at varying stages of implementation, and project implementers often lack sufficient data to make fully informed judgements about outcomes. We therefore invite scholars to develop easy-to-apply and standardised socio-economic indicators to objectively assess improvements in the various transport-related problems faced by regional communities experimenting with smart mobility services. Another critical task for researchers is to identify the conditions that lead to higher problem-solving effectiveness or successful upscaling of smart mobility initiatives. Relevant variables would include vehicle and innovation type, route design, business models and profitability, technical performance, public acceptance and geographical conditions. Methods such as Qualitative Comparative Analysis (QCA) or statistical modelling could provide valuable tools for advancing knowledge in this area.
Data availability statement
The original contributions presented in the study are included in the article/Supplementary material, further inquiries can be directed to the corresponding author.
Author contributions
GT: Conceptualization, Data curation, Formal analysis, Funding acquisition, Investigation, Methodology, Project administration, Visualization, Writing – original draft, Writing – review & editing. TH: Conceptualization, Data curation, Investigation, Writing – review & editing. KS: Methodology, Validation, Writing – review & editing. JC: Methodology, Visualization, Writing – review & editing. MD: Conceptualization, Data curation, Formal analysis, Methodology, Validation, Visualization, Writing – review & editing.
Funding
The author(s) declare that financial support was received for the research and/or publication of this article. This study received Kaken funding from the Japan Society for Promotion of Science (grant number 21H03666).
Acknowledgments
The authors are deeply grateful to all the organisations and individuals who kindly completed questionnaires and cooperated for interviews.
Conflict of interest
The authors declare that the research was conducted in the absence of any commercial or financial relationships that could be construed as a potential conflict of interest.
The author(s) declared that they were an editorial board member of Frontiers, at the time of submission. This had no impact on the peer review process and the final decision.
Generative AI statement
The authors declare that no Gen AI was used in the creation of this manuscript.
Publisher’s note
All claims expressed in this article are solely those of the authors and do not necessarily represent those of their affiliated organizations, or those of the publisher, the editors and the reviewers. Any product that may be evaluated in this article, or claim that may be made by its manufacturer, is not guaranteed or endorsed by the publisher.
Supplementary material
The Supplementary material for this article can be found online at: https://www.frontiersin.org/articles/10.3389/frsc.2025.1574300/full#supplementary-material
Footnotes
1. ^The five government funding programmes are: (1) Societal Implementation Project for Future Technologies (mirai gijutsu shakaijissou jigyou) by the Cabinet Office, (2) Project to Promote Smart Cities to Tackle Regional Issues (chiiki kadai kaiketsu no tame no smaatoshiti suishin jigyou) by the Ministry of Internal Affairs and Communications; (3) Project to Support Smart City Societal Implementation (sumaato shiti jissoka shien jigou) by the Ministry of Land, Infrastructure, Transport and Tourism; (4) Promotional Project for Creation of Novel Maas in Regional Areas (chiiki shin MaaS soushutsu suishin jigyou) by the Ministry of Economy, Trade and Industry; (5) Promotional and Support Project for Japanese MaaS (nihonban MaaS suishin shien jigyou) by the Ministry of Land, Infrastructure, Transport and Tourism; and (6) RoAD to the L4 by the Ministry of Economy, Trade and Industry and the Ministry of Land, Infrastructure, Transport and Tourism.
2. ^The ranked importance of barriers was calculated based on the share of responses indicating extremely high relevance or high relevance, regardless of municipality size.
References
Ahonen, V., Hussain, S., Merisalo, V., Pekkala, V., and Leviäkangas, P. (2024). Addressing sustainability in mobility: a study on Finnish smart mobility innovation projects. Eur. Transp. Res. Rev. 16:7. doi: 10.1186/s12544-023-00630-0
Arcade, J., Godet, M., Meunier, F., and Roubelat, F. (2003). “Structural analysis with the MICMAC method & actor's strategy with MACTOR method” in Futures research methodology futures research methodology (the millennium project). eds. C. Jerome and G. T. J. Glenn (American Council for the United Nations University), 1–69.
Avary, M., Kawasaki, M., Luczak, D., Mathis, R., and Suga, C. (2020). Transforming rural mobility in Japan and the world. Available online at: https://www.weforum.org/whitepapers/transforming-rural-mobility-in-japan-and-the-world/ (Accessed March 30, 2020).
Balland, P.-A., Jara-Figueroa, C., Petralia, S. G., Steijn, M. P. A., Rigby, D. L., and Hidalgo, C. A. (2020). Complex economic activities concentrate in large cities. Nat. Hum. Behav. 4, 248–254. doi: 10.1038/s41562-019-0803-3
Bosworth, G., Price, L., Collison, M., and Fox, C. (2020). Unequal futures of rural mobility: challenges for a “smart countryside”. Local Econ. 35, 586–608. doi: 10.1177/0269094220968231
Camarero, L., and Oliva, J. (2019). Thinking in rural gap: mobility and social inequalities. Palgrave Commun. 5:95. doi: 10.1057/s41599-019-0306-x
Campfens, J. K. E. K., Duygan, M., and Binder, C. R. (2025). Initiating social tipping dynamics in energy transitions: a novel analytical approach for exploring feedback loops and intervention points. Environ. Innov. Soc. Transitions 56:100973. doi: 10.1016/j.eist.2025.100973
Casella, G., and Berger, R. L. (2022). Statistical inference. 2nd Edn. Pacific Grove: Duxbury Press.
De Oliveira, L. G. S., Subtil Lacerda, J., and Negro, S. O. (2020). A mechanism-based explanation for blocking mechanisms in technological innovation systems. Environ. Innov. Soc. Transitions 37, 18–38. doi: 10.1016/j.eist.2020.07.006
Duygan, M., Binder, C. R., Meylan, G., and Fischer, M. (2025). Carving the transformation pathways to sustainable futures: a novel analytical framework for backcasting in sustainability transitions. Sustainable Futures 9:100553. doi: 10.1016/j.sftr.2025.100553
Duygan, M., and Meylan, G. (2015). Strategic management of WEEE in Switzerland—combining material flow analysis with structural analysis. Resour. Conserv. Recycl. 103, 98–109. doi: 10.1016/j.resconrec.2015.06.005
Fitt, H., Curl, A., Dionisio, M. R., Ahuriri-Driscoll, A., and Pawson, E. (2019). Considering the wellbeing implications for an ageing population of a transition to automated vehicles. Res. Transp. Bus. Manag. 30:100382. doi: 10.1016/j.rtbm.2019.100382
Flipo, A., Ortar, N., and Sallustio, M. (2023). Can the transition to sustainable mobility be fair in rural areas? A stakeholder approach to mobility justice. Transp. Policy 139, 136–143. doi: 10.1016/j.tranpol.2023.06.006
Fujisaki, K., Yasuda, T., Ishigami, T., Makimura, K., and Ishida, H. (2022). Empirical recommendations based on case studies in Japan for sustainable innovative mobility in rural areas. Asian Transp. Stud. 8:100079. doi: 10.1016/j.eastsj.2022.100079
Godet, M. (2000). The art of scenarios and strategic planning: tools and pitfalls. Technol. Forecast. Soc. Change 65, 3–22. doi: 10.1016/S0040-1625(99)00120-1
Goldbach, C., Sickmann, J., Pitz, T., and Zimasa, T. (2022). Towards autonomous public transportation: attitudes and intentions of the local population. Transp. Res. Interdiscip. Perspect. 13:100504. doi: 10.1016/j.trip.2021.100504
Groves, R. M., Fowler, F. J. Jr., Couper, M. P., Lepkowski, J. M., Singer, E., and Tourangeau, R. (2009). Survey methodology. 2nd Edn. New Jersey: Wiley.
ITF (2024) The Future of Public Transport Funding (ITF Research Reports). Paris. Available online at: https://www.oecd.org/content/dam/oecd/en/publications/reports/2024/02/the-future-of-public-transport-funding_d0cbc29f/82a4ba65-en (Accessed April 10, 2025).
Jarzebski, M. P., Elmqvist, T., Gasparatos, A., Fukushi, K., Eckersten, S., Haase, D., et al. (2021). Ageing and population shrinking: implications for sustainability in the urban century. NPJ Urban Sustain. 1:17. doi: 10.1038/s42949-021-00023-z
Jiren, T. S., Hanspach, J., Schultner, J., Fischer, J., Bergsten, A., Senbeta, F., et al. (2020). Reconciling food security and biodiversity conservation: participatory scenario planning in southwestern Ethiopia. Ecol. Soc. 25:24. doi: 10.5751/ES-11681-250324
Jittrapirom, P., van Neerven, W., Martens, K., Trampe, D., and Meurs, H. (2019). The dutch elderly's preferences toward a smart demand-responsive transport service. Res. Transp. Bus. Manag. 30:100383. doi: 10.1016/j.rtbm.2019.100383
Kieft, A., Harmsen, R., and Hekkert, M. P. (2017). Interactions between systemic problems in innovation systems: the case of energy-efficient houses in the Netherlands. Environ. Innov. Soc. Transitions 24, 32–44. doi: 10.1016/j.eist.2016.10.001
Lin, D., and Cui, J. (2021). Transport and mobility needs for an ageing society from a policy perspective: review and implications. Int. J. Environ. Res. Public Health 18:11802. doi: 10.3390/ijerph182211802
McCarrol, C., and Cugurullo, F. (2022). No city on the horizon: autonomous cars, artificial intelligence and the absence of urbanism. Front. Sustain. Cities 4:937933. doi: 10.3389/frsc.2022.937933
MIAC (2024) Population estiimate 2024. Available online at: https://www.stat.go.jp/data/jinsui/pdf/202412.pdf (Accessed: January 25, 2024).
MIC (2024a) Basic resident register population and number of households, 2023 population trends (by prefecture). Available online at: https://www.soumu.go.jp/main_sosiki/jichi_gyousei/daityo/jinkou_jinkoudoutai-setaisuu.html (Accessed: January 25).
MIC (2024b) Chiho Zaisei Hakusho Reiwa Roku Nen (White Paper on Local Public Finance FY 2024). In Japanese:. Available online at: https://www.soumu.go.jp/menu_seisaku/hakusyo/index.html (Accessed January 25, 2024).
MILT (2024) Kotsu Seisaku Hakusho (Public Transport Policy White Paper). Available online at: https://www.mlit.go.jp/report/press/content/001749070.pdf (Accessed January 20, 2024).
Mulley, C., Nelson, J. D., Ho, C., and Hensher, D. A. (2023). MaaS in a regional and rural setting: recent experience. Transp. Policy 133, 75–85. doi: 10.1016/j.tranpol.2023.01.014
OECD. (2020). Rural well-being: geography of opportunities. Available online at: https://www.oecd-ilibrary.org/urban-rural-and-regional-development/rural-well-being_d25cef80-en (Accessed March 30, 2020).
OECD. (2023). OECD regional outlook 2023: the longstanding geography of inequalities. Paris. Available online at: https://www.oecd.org/content/dam/oecd/en/publications/reports/2023/10/oecd-regional-outlook-2023_3a6174ba/92cd40a0-en.pdf.
Okawa, Y., and Kitagawa, F. (2023). Potential and issues for medical MaaS as a core for regional development. Available online at: https://www2.deloitte.com/content/dam/Deloitte/jp/Documents/strategy/md/jp-md-iryou-maas-01.pdf (Accessed: April 30, 2023).
Papaioannou, G., Polydoropoulou, A., Tsirimpa, A., and Pagoni, I. (2023). Development of mobility as a service (MaaS) for intercity travel & rural/island areas: the case study of Greece. Eur. Transp. Res. Rev. 15:48. doi: 10.1186/s12544-023-00619-9
Poltimäe, H., Rehema, M., Raun, J., and Poom, A. (2022). In search of sustainable and inclusive mobility solutions for rural areas. Eur. Transp. Res. Rev. 14:13. doi: 10.1186/s12544-022-00536-3
Porru, S., Misso, F. E., Pani, F. E., and Repetto, C. (2020). Smart mobility and public transport: opportunities and challenges in rural and urban areas. J. Traffic Transp. Eng. 7, 88–97. doi: 10.1016/j.jtte.2019.10.002
Qiao, W., and Briceno-Garmendia, C. (2024). Transformative technologies in transportation. Available online at: https://documents1.worldbank.org/curated/en/099062723131522743/pdf/P1740161f1ed340501a69916d7b0d2bff11.pdf (Accessed January 2, 2024).
Ryghaug, M., Subotički, I., Smeds, E., von Wirth, T., Scherrer, A., Foulds, C., et al. (2023). A social sciences and humanities research agenda for transport and mobility in Europe: key themes and 100 research questions. Transp. Rev. 43, 755–779. doi: 10.1080/01441647.2023.2167887
Scholz, R. W., and Tietje, O. (2002). Embedded case study methods: Integrating quantitative and qualitative knowledge. London: Sage.
Sengers, F., and Raven, R. (2015). Toward a spatial perspective on niche development: the case of bus rapid transit. Environ. Innov. Soc. Transitions 17, 166–182. doi: 10.1016/j.eist.2014.12.003
Servou, E., Mögele, M., and Torrens, J. (2022). Experimenting with automated driving for technology or for the city? A matter of governance cultures. Front. Sustain. Cities 4:956853. doi: 10.3389/frsc.2022.956853
Shergold, I., Lyons, G., and Hubers, C. (2015). Future mobility in an ageing society – where are we heading? J. Transp. Health 2, 86–94. doi: 10.1016/j.jth.2014.10.005
Thaithatkul, P., Chalermpong, S., Laosinwattana, W., and Kato, H. (2022). Mobility, activities, and happiness in old age: case of the elderly in Bangkok. Case Stud. Transp. Policy 10, 1462–1471. doi: 10.1016/j.cstp.2022.05.010
Tran, Y., and Hashimoto, N. (2022). Mobility-As-A-Service Trials in Japan: Initial Result from a National Project. IEEE International Conference on Consumer Electronics (ICCE 2022). p. 1–5.
Trencher, G., and Wesseling, J. (2022). Roadblocks to fuel-cell electric vehicle diffusion: evidence from Germany, Japan and California. Transp. Res. Part D Transp. Environ. 112:103458. doi: 10.1016/j.trd.2022.103458
Trencher, G., Yu, J., and Yarime, M. (2024). Using emerging technologies to tackle mobility challenges caused by population ageing: experiences from Japan. Technol. Forecast. Soc. Change 208:123729. doi: 10.1016/j.techfore.2024.123729
Turner, J. A., Klerkx, L., Rijswijk, K., Williams, T., and Barnard, T. (2016). Systemic problems affecting co-innovation in the New Zealand agricultural innovation system: identification of blocking mechanisms and underlying institutional logics. NJAS Wageningen J. Life Sci. 76, 99–112. doi: 10.1016/j.njas.2015.12.001
UN. (2021). World social report 2021: reconsidering rural development. Available online at: https://desapublications.un.org/publications/world-social-report-2021-reconsidering-rural-development (Accessed March 30, 2021).
UN (2023) World social report 2023. Available online at: https://www.un.org/development/desa/dspd/wp-content/uploads/sites/22/2023/01/2023wsr-fullreport.pdf (Accessed April 3, 2023).
van Oers, L., de Hoop, E., Jolivet, E., Marvin, S., Späth, P., and Raven, R. (2020). The politics of smart expectations: interrogating the knowledge claims of smart mobility. Futures 122:102604. doi: 10.1016/j.futures.2020.102604
Vitale Brovarone, E. (2022). Accessibility and mobility in peripheral areas: a national place-based policy. Eur. Plan. Stud. 30, 1444–1463. doi: 10.1080/09654313.2021.1894098
Ward, C., and Oakley, D. (2022). Equitable, inclusive and sustainable public transit mobility through mobility on demand? A critical perspective. Front. Sustain. Cities 4:926549. doi: 10.3389/frsc.2022.926549
Weimer-Jehle, W. (2006). Cross-impact balances: a system-theoretical approach to cross-impact analysis. Technol. Forecast. Soc. Change 73, 334–361. doi: 10.1016/j.techfore.2005.06.005
Wesseling, J., and Van der Vooren, A. (2017). Lock-in of mature innovation systems: the transformation toward clean concrete in the Netherlands. J. Clean. Prod. 155, 114–124. doi: 10.1016/j.jclepro.2016.08.115
Wiek, A., and Binder, C. (2005). Solution spaces for decision-making—a sustainability assessment tool for city-regions. Environ. Impact Assess. Rev. 25, 589–608. doi: 10.1016/j.eiar.2004.09.009
World Bank (2025) Population ages 65 and above (% of total population). Available online at: https://data.worldbank.org/indicator/SP.POP.65UP.TO.ZS (Accessed April 30, 2025).
Yamasaki, Y. (2024). The Japanese government’s promotion of automated driving driven by shared positive expectations. Futures 155:103282. doi: 10.1016/j.futures.2023.103282
Keywords: smart mobility, evaluation, regional transport, innovation, regional governance, autonomous vehicles, MaaS
Citation: Trencher G, Hamano T, Shimono K, Campfens J and Duygan M (2025) Smart mobility innovations in regional transport services: a systemic view of triggers, approaches and outcomes in Japan. Front. Sustain. Cities. 7:1574300. doi: 10.3389/frsc.2025.1574300
Edited by:
Federico Cugurullo, Trinity College Dublin, IrelandReviewed by:
Chiara Garau, University of Cagliari, ItalyAraz Taeihagh, National University of Singapore, Singapore
Copyright © 2025 Trencher, Hamano, Shimono, Campfens and Duygan. This is an open-access article distributed under the terms of the Creative Commons Attribution License (CC BY). The use, distribution or reproduction in other forums is permitted, provided the original author(s) and the copyright owner(s) are credited and that the original publication in this journal is cited, in accordance with accepted academic practice. No use, distribution or reproduction is permitted which does not comply with these terms.
*Correspondence: Gregory Trencher, dHJlbmNoZXIuZ3JlZ29yeS4yc0BreW90by11LmFjLmpw