 Weibin Peng
 Manman Wu
 Jiaxin Xu3
- 1School of Economics, Hangzhou Normal University. Hangzhou, Zhejiang, China
- 2Institute of Population Development and Health Governance, Hangzhou Normal University, Hangzhou, Zhejiang, China
- 3School of Management, Hangzhou Dianzi University, Hangzhou, Zhejiang, China
China's industrialization process, transitioning from a heavy industry-oriented strategy to ecological civilization construction in the new era, has shaped the intrinsic connection between environmental regulation and the real estate market. Based on panel data from the government work reports and economic development of 280 prefecture-level cities in China from 2003 to 2023, this study constructs an environmental regulation index using an improved TF-IDF algorithm to examine the impact of environmental regulation on housing prices and its underlying mechanisms. It innovatively employs historical railway inauguration data in China as an instrumental variable. Fixed-effects model results reveal that the impact of environmental regulation on housing prices exhibits a U-shaped pattern, with a predominantly inhibitory effect at the current stage. The mediating effect model further reveals that environmental regulation indirectly affects housing prices through promoting industrial structure upgrading and green technological innovation. The industrial green transformation transmission mechanism in the impact of China's environmental regulation on housing prices may become one of the micro-implementation pathways for the global sustainable development goals.
1 Introduction
With the acceleration of urbanization and the enhancement of environmental awareness, environmental regulation policies have gradually become an important tool for governments around the world to balance economic development and ecological protection. The Chinese government is firmly advancing the green transformation of its economy, abandoning the traditional industrialization model of “grow first, clean up later.” At the Third Plenary Session of the 20th CPC Central Committee, the Communist Party of China explicitly incorporated “Chinese modernization is the modernization of harmony between humanity and nature” into the communique, emphasizing the promotion of synergistic development between the socio-economy and the ecological environment through improving the ecological governance system and refining green development mechanisms. Simultaneously, in the real estate sector, the Chinese government has delegated regulatory autonomy to cities, allowing local governments to implement city-specific policies. This includes lifting or reducing home purchase restrictions to unleash demand for improved housing and revitalize the existing property market. The 2025 National Two Sessions further solidified the policy tone of “halting declines and stabilizing the real estate market.” Centered on a heavy-industry-first strategy during the planned-economy era, China built foundational steel and machinery systems in Northeast and North China, giving rise to the mixed-use “work-unit compound” spatial model that would later shape industrial-pollution control and urban renewal. After the reform and opening up, the rapid development of township enterprises and export-oriented processing industries propelled China to gradually become the “world's factory,” a process that accelerated after China joined the World Trade Organization (WTO) in 2001. In 1998, China terminated the physical welfare housing allocation and fully implemented the monetization of housing allocation, which severed the housing ties between employees and their work units (Li and Zhong, 2022), gave rise to the new type of commercial housing communities, and marked the comprehensive launch of the urban housing market in China. However, environmental pollution stemming from the extensive economic growth model became increasingly evident. Entering the new era, ecological civilization construction emerged as a core agenda, driving industrial green transformation. Strategies like coordinated ecological governance in the Beijing-Tianjin-Hebei region and ecological restoration of the Yangtze River Economic Belt were implemented, with strict controls imposed on highly polluting industries. This historical trajectory of industrialization has not only shaped a regional development paradigm shifting from “production-oriented” to “ecological priority” but has also endowed environmental regulation with profound implications for the real estate market. Against the backdrop of decentralized real estate regulation and the rigid constraints of green development, researching the relationship between environmental regulation and housing prices can not only reveal the specific mechanisms through which environmental governance affects the real estate market but also provide vital policy references for achieving the modernization goal of “harmonious coexistence between humanity and nature.” Some scholars posit that environmental regulation may boost housing prices by improving environmental quality, while potentially suppressing them by increasing corporate costs and altering labor markets (Agarwal et al., 2019). This seemingly contradictory impact mechanism unveils a new academic question: Does the impact of environmental regulation on housing prices follow a nonlinear pattern?
The nonlinear impact of environmental regulation on housing prices may essentially be the result of a sustainable development goal game: on the one hand, the contraction of pollution-intensive industries forces production factors to shift to high-value-added industries, laying the foundation for the improvement of ecological livability; on the other hand, the innovation and application of clean production technologies can reshape the housing market value system through “ecological premiums.” This “breaking the old and establishing the new” dual mechanism reflects the unity of environmental governance and economic growth under the concept that “green mountains and clear waters are as valuable as mountains of gold and silver.” The nonlinear relationship between environmental regulations and housing prices can be understood from different theoretical perspectives: the cost compliance theory emphasizes that environmental regulations increase the compliance costs of enterprises, forcing the contraction of the secondary industry (Gray and Shadbegian, 1998), which may affect the real estate market through promoting industrial structure transformation; the innovation compensation theory holds that the pressure of environmental regulations stimulates green technological innovation (Porter and Linde, 1995), which may influence the real estate market by enhancing ecological value and green production efficiency. Currently, there is no systematic analysis of these two types of intermediary mechanisms. In China's low-carbon transformation process, the contraction of pollution-intensive industries and the development of clean technology industries have formed phased differences. The transmission mechanism of this industrial structure change in the connection between environmental regulations and the real estate market is worth further exploration. Sustainable development not only requires balancing economic costs and ecological benefits but also needs to reconstruct regional development momentum through industrial structure optimization and green technology leapfrogging. Clean air is an environmental amenity for all residents, including home buyers and renters (Wang and Lee, 2022). Studying the path and mechanism of environmental regulations affecting housing prices is not only a test of the driving force of China's sustainable development and the verification of the “Porter Hypothesis,” but also provides theoretical support for building a modern governance system of “reducing pollution, increasing greenery, and improving quality,” and helps achieve the high-quality development goal of harmonious coexistence between humans and nature. Specifically, the marginal contributions of this paper are mainly reflected in the following three aspects: First, in terms of indicator construction and research methods, this paper is the first to optimize the frequency of environmental regulation terms using the TF-IDF (term frequency-inverse document frequency) algorithm and construct an exogenous environmental regulation indicator. Second, in terms of the research level, this paper is the first to clarify the U-shaped impact of environmental regulation on housing prices at the city level. Third, in terms of the path mechanism, this paper is the first to incorporate the mediating path of industrial green transformation into the research on the impact of environmental regulation on housing prices. The structure of the subsequent parts of this paper is arranged as follows: Part II is the literature review and theoretical analysis; Part III is the model specification, variable selection, and data description; Part IV reports and discusses the empirical results; Part V is the conclusion and policy implications.
2 Theoretical analysis and literature review
2.1 Theoretical analysis
Suppose the total regional utility U is determined by the following factors (Kline, 2010):
Among them, w represents the wage level; v represents the level of urban infrastructure; C is the price level of consumer goods; h is the local housing prices; y(L, K) is the regional output utility function (dependent on labor force L and capital K); μ is the effect preference perturbation term.
Derive the housing price function from the condition of utility maximization (Agarwal et al., 2019):
Among them, X represents the indirect effect influencing housing prices, including comprehensive factors such as wages, infrastructure, and output utility.
Suppose there are polluting industries and clean industries in the region. The output function of the polluting industry (when not regulated) and the clean industry is (Cobb and Douglas, 1928):
When environmental regulations have an impact, polluting industries need to invest costs θ to cope with the regulations (Fowlie, 2010), and the output function becomes:
The pollution emission function is:
Wages and capital prices are derived from the condition of profit maximization, where ρ1 is the product price of the polluting industry:
Marginal cost and price equilibrium:
Under low-intensity environmental regulations, enterprises transfer costs by laying off workers and reducing salaries, leading to a shrinking real estate market; the polluting industries contract, but the clean industries have not yet reached a significant scale. Under high-intensity regulations, the green and clean industries expand in scale, attracting high-skilled labor to gather, and the real estate market prospers. At the same time, the improvement of environmental quality enhances the livability of the region and raises housing prices. There is a U-shaped relationship between the intensity of environmental regulations (θ) and housing prices (h). On the left side of the U-shaped curve, with low regulation intensity, cost increases are dominant, leading to a shrinking real estate market and a decline in housing prices. On the right side, with high regulation intensity, the scale effect of clean industries becomes apparent, the real estate market prospers, and housing prices rise.
2.2 Literature review
Environmental regulations generally include formal and informal environmental regulations (Yuan and Xie, 2014). Formal environmental regulations refer to government-controlled environmental regulations, mainly including command-and-control environmental regulations and market incentive environmental regulations. Command-and-control environmental regulations are environmental policies formulated and promulgated by the government. Cheng and Liao (2010) counted the number of documents related to environmental policies issued by various levels of government units in China and scored the policies according to a subjectively set evaluation standard to obtain an indicator related to environmental policies. However, due to the numerous issues involved in environmental policy documents, each document has its specific background and focus, making it difficult to control the randomness and subjectivity in the scoring process. Market incentive environmental regulations refer to systems designed by the government using market mechanisms to guide and encourage enterprises to reduce pollution emissions, such as pollution discharge permits, pollution discharge rights trading, and pollution discharge taxes (fees). Pollution discharge fees have advantages in constructing the intensity of environmental regulations, but the literature generally believes that the time period with relatively high data authenticity in the industrial enterprise database is before 2008 (Quan and Li, 2020). China lacks data on pollution control costs for various industries (Yin and Wu, 2021), and the National Bureau of Statistics of China has not released data such as “total investment in environmental pollution control” at the prefecture-level city level since 2007. Furthermore, these indicators are largely endogenous to the stage of economic development and are prone to causing endogeneity problems themselves (Deng and Yang, 2019; Zhang and Chen, 2021; Shao et al., 2024). Informal environmental regulations include public participation-based environmental regulations and voluntary environmental regulations. Public participation-based environmental regulations refer to the demands on the environment made by society, which are invisible and determined by individuals' environmental awareness, attitudes, and cognition. Voluntary environmental regulations refer to the provision of environmental public goods by enterprises based on “environmental protection cognition” or “corporate social responsibility.” However, voluntary environmental regulations are insufficiently practiced in China and lack standardized quantification methods (Pan et al., 2020).
Some scholars believe that environmental regulations have a positive impact on housing prices, and the increase in the intensity of environmental regulations drives up housing prices (Zhang, 2023). Empirical studies show that every 10 % increase in PM2.5 concentration in Chinese cities is associated with a 2.4 % decline in local housing prices, a finding that conversely highlights the positive impact of environmental quality improvements on property values (Chen and Jin, 2019). The fuel conversion from coal to gas in the United States has a significant positive impact on housing prices, and this impact may vary by region (Rivera and Loveridge, 2022). The carbon trading pilot policy in China has achieved remarkable success in promoting economic stability and high-quality economic development, providing strong support for the realization of the “dual carbon” goals (Zeng et al., 2024). Other scholars believe that environmental regulations have a negative impact on housing prices. Environmental regulations, to some extent, negatively affect the production efficiency of manufacturing factories, requiring factories to invest more resources to meet environmental requirements, thereby reducing production efficiency (Greenstone et al., 2012). Facing stricter wastewater discharge standards, textile and dyeing enterprises around Taihu Lake in Jiangsu Province, China, have reduced their labor demand by ~7%, and such industry-level adjustments may lead to a decline in housing prices in related areas (Liu et al., 2017). Environmental regulations lead to the reallocation of labor, with a reduction in job positions in regulated industries, which may have a negative effect on housing prices (Walker, 2011). Environmental regulations have a negative impact on manufacturing employment, especially in labor-intensive industries, while overall employment in technology-intensive industries is significantly supported (Kuai et al., 2021). High-level human capital has a positive impact on the efficiency of the green economy (Peng et al., 2023), and such changes in the labor demand structure may lead to changes in housing purchase demand, thereby affecting housing prices.
There is a clear U-shaped relationship between environmental regulation and housing prices: as the stringency of environmental regulation increases, housing prices first decline and then rise (Qiao and Shen, 2021). The significant inter-industry employment shifts induced by environmental policies exert an indirect effect on housing prices; these structural employment adjustments may negatively impact prices in the short term, yet in the long run, they can generate positive changes in housing prices through industrial optimization (Hafstead and Williams, 2018). In recent years, studies have found a U-shaped relationship between environmental regulations and economic and social development, providing many insights for the research on the relationship between environmental regulations and the real estate market. There is a U-shaped relationship between environmental regulations and regional economic growth. To some extent, China's environmental regulations have inhibited the economic growth of various regions, but as the intensity of environmental regulations continues to increase, their positive effects gradually become apparent (Ji et al., 2023). There is a U-shaped curve relationship between environmental regulations and industrial green competitiveness. As the intensity of environmental regulations increases, industrial green competitiveness will first decline and then improve (Du et al., 2019). The “Environmental Kuznets Curve” indicates that in the early stage of industrialization, the impact of the social economic system on the environment is relatively limited; as the national income level continues to rise, ecological pressure increases; but when the economy crosses a specific development stage threshold, continuous economic growth will instead promote the gradual improvement of the environmental situation. Analogously to housing prices, the increase in the intensity of environmental regulations makes the improvement of environmental quality a new driving force for housing price growth (Selden and Song, 1994).
Research on the U-shaped relationship between environmental regulation and economic development has been quite abundant, but there are relatively few studies on the mechanisms involved, especially the mediating effect between environmental regulation and the real estate market. Currently, the secondary industry, due to its production activities often accompanied by large amounts of resource consumption and pollutant emissions, has become a key area of environmental regulations. According to the “compliance cost hypothesis,” high-pollution secondary industries may face greater environmental regulatory pressure and may attempt to reduce production costs by laying off employees, leading to a decrease in the number of employees and employment rate of enterprises (Dissou and Sun, 2013; Kahn and Mansur, 2013), and the transfer of labor from the secondary industry to the tertiary industry, and the evolution of the industrial structure to a more advanced form (Gao et al., 2012). According to “innovation compensation hypothesis,” strict environmental regulations can stimulate the innovation behavior of enterprises and prompt them to adopt more advanced green production technologies, thereby improving production efficiency (Porter and Linde, 1995). Carbon pricing mechanisms such as the Emissions Trading System (ETS) can enhance the environmental responsibility of enterprises and foster a sustainable innovation culture in the real estate industry (Lee and Liang, 2024). Environmental regulations can promote green technological innovation from both positive incentives and negative pressure perspectives (Hu and Yang, 2024), and local governments' environmental attention can boost enterprises' green technological innovation (Ruan et al., 2023). Moderate environmental regulations enhance productivity by incentivizing innovation (Chen et al., 2025), and higher environmental protection taxes have been found to boost green total-factor productivity (Zhang et al., 2024). The upgrading of green production technology and industrial transformation has a significant positive impact on housing prices (Zhou et al., 2020). Previous studies have mostly focused on the direct economic effects of environmental governance, or simply attributed the fluctuations in housing prices to financial attributes, ignoring the transmission mechanism of green technological innovation and industrial structure changes as mediating effects in the connection between environmental regulations and the real estate market.
There are three limitations in the existing research on the impact of environmental regulations on housing prices. First, the market incentive-based environmental regulations constructed in previous studies are prone to endogeneity problems, and there is room for further optimization in the construction of government-regulated environmental regulation indicators. Second, existing studies have mainly focused on the positive, negative, and U-shaped impacts of environmental regulations on housing prices, and most of the research results are based on provincial panel data, with few studies focusing on the impact of environmental regulations on housing prices at the city level. Third, the research on the mechanism of the impact of environmental regulations on housing prices is insufficient, and there is no clear and detailed study on how environmental regulations affect housing prices by reshaping the industrial structure. Based on the existing literature, this paper attempts to innovate in the following three aspects. First, in the context of China's lack of effective statistical data on environmental research-related indicators at the prefecture-level city, and the authenticity of relevant database data being questioned by the domestic academic community, this paper innovatively constructs an exogenous environmental regulation word-frequency index using the TF-IDF algorithm. Second, this paper innovatively clarifies the U-shaped impact of environmental regulation on housing prices at the city level, providing empirical references for the stable development of urban real estate economies. Third, this paper explores the path mechanism of the impact of environmental regulation on housing prices using a mediating effect model, and for the first time investigates the mediating effects of industrial transformation and green technological innovation. In summary, this paper studies the causal relationship and path mechanism between environmental regulations and housing prices at the city level by establishing an improved environmental regulation intensity index, providing empirical evidence for understanding “green mountains and clear waters are mountains of gold and silver” under the new development pattern and offering a Chinese city case for global sustainable development goals.
3 Research design
3.1 Model construction and variable description
3.1.1 The explanatory variable and the explained variable
We measure the environmental regulation intensity (ER) of a city in a specific year by the inverse document frequency term frequency (TF-IDF) of the environmental keywords in the government work report. The term frequency (TF) is constructed as follows (Chen and Chen, 2018): Use Python software to collect the government work reports at the city level for each year from 2003 to 2023; Perform word segmentation processing and feature extraction on the text of the government work report; Count the frequency of occurrence of environmental keywords and calculate their proportion of the total word frequency in the full text of the government report. Based on the existing research on the five terms of environment, energy consumption, pollution, emission reduction, and environmental protection (Chen et al., 2016), the environmental keywords are further expanded and summarized as environmental protection, EP (An abbreviation for environmental protection), pollution, energy consumption, emission reduction, pollutant discharge, ecology, green, low carbon, air, chemical oxygen demand, sulfur dioxide, carbon dioxide, PM10, and PM2.51. Compared with the measurement method based on the frequency of single characters in traditional research, the word frequency statistics technology is adopted to retain the complete semantic features of words and improve the validity and accuracy of index representation through multi-dimensional vocabulary coverage. Scholars argue that because economic activity unfolds throughout the entire year and prefecture-level government work reports are typically released early in the year, the forward-looking nature of policy design better satisfies the exogeneity assumption: economic performance in the same year cannot retroactively affect a report whose wording has already been fixed. Using the share of environment-related terms in the total word count of the government work report to gauge the stringency of environmental regulation helps mitigate endogeneity concerns (Deng and Yang, 2019; Zhang and Chen, 2021; Shao et al., 2024).
The inverse document frequency (TF-IDF) is computed as follows (Bao et al., 2023): the importance of a term in a specific document rises with its within-document frequency but falls with the number of times it appears across the corpus. In other words, if a term appears frequently in one document (TF) but rarely in others (IDF), it possesses stronger discriminatory power. In Equation 10, TFdit denotes the raw frequency of term d in the government work report of city i in year t, IDFdt is the inverse document frequency of term d across the entire set of government work reports in year t (defined as the reciprocal of the proportion of documents containing the term), and the term d belongs to the predefined dictionary D.
The explained variable in this paper is housing prices (HP). Since environmental regulations can affect the prices of residential and commercial properties (Qiao and Shen, 2021), it is more objective to represent the overall real estate prices using the prices of both residential and commercial properties (Agarwal et al., 2019). This article selects the average sales price of commercial housing, including residential and commercial properties, to represent the regional housing price. Its value is the sales amount of commercial housing divided by the sales area of commercial housing, and uses the consumer price index to eliminate inflation in housing prices (Sun, 2020). The sparse distribution of extreme values on the far tails of the data can lead to instability and bias in estimation (Hou et al., 2024). This study conducts 1% bilateral winsorizing on housing prices to mitigate the possible impact of extreme values and outliers on the study of nonlinear relationships (Li and Zhang, 2024). Considering the “Porter Hypothesis” of environmental regulation and referring to relevant empirical practices (Ji et al., 2023), the quadratic term of environmental regulation was added to the quantitative model, and the specific model setting is as follows.
Among them, the explained variable HP is the average sales price of commercial housing, the explained variable ER is the environmental regulation, X is the set of all control variables, i and t represent cities and years, respectively, ρi is the effect of prefecture-level cities, δt is the time effect, and εit represents the error term.
3.1.2 Control variables
This paper selects the following six control variables to a certain extent control the possible influencing factors of the real estate fundamentals. The basic information of the control variables is shown in Table 1.
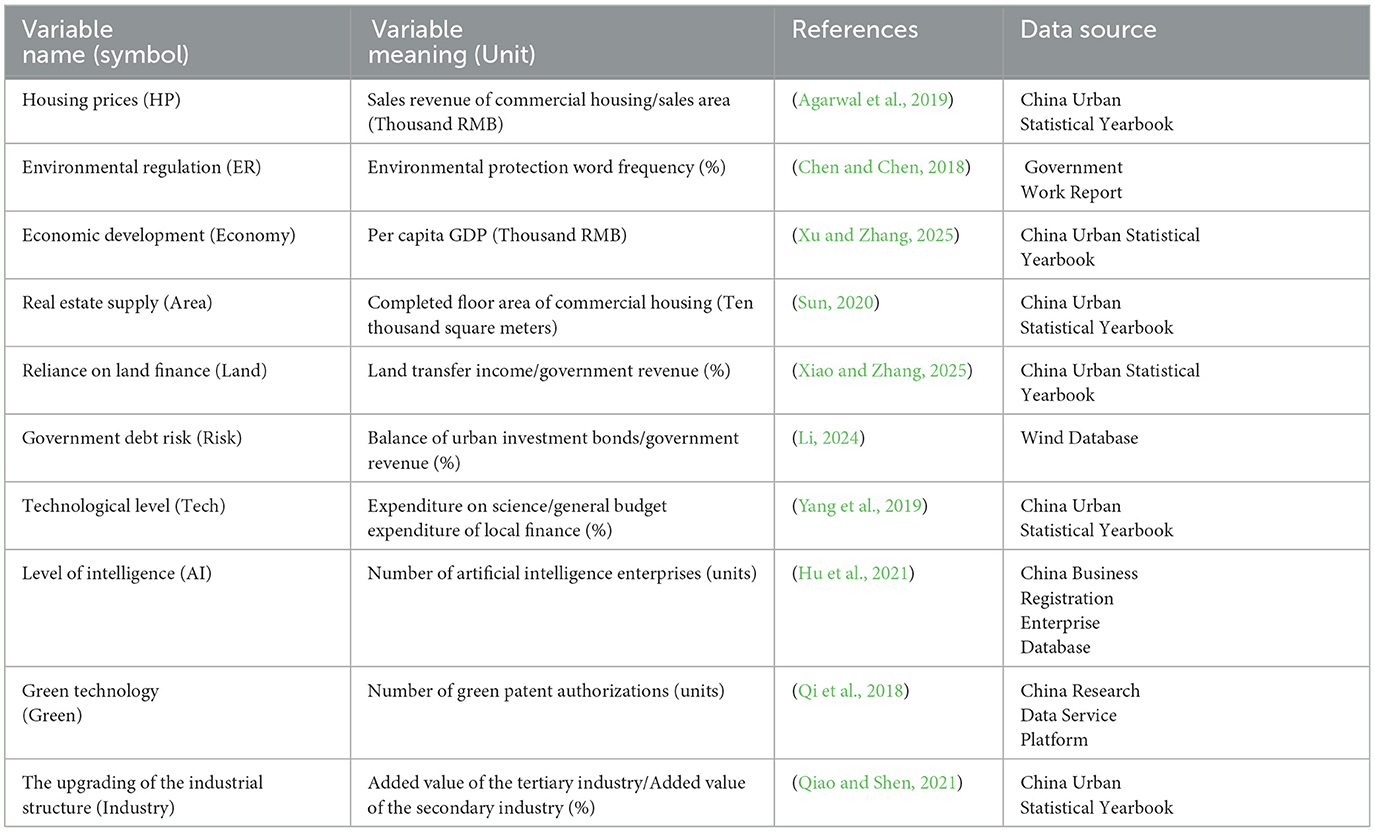
Table 1. Basic information of variables.
(1) Economic development (Economy): Add per capita GDP as a control variable on the demand side and take the logarithm. This indicator directly reflects the regional economic development level and the overall purchasing power base of residents, and is a core supporting factor for effective housing demand (Xu and Zhang, 2025). An increase in per capita GDP means an increase in disposable resources for residents, which not only enhances the ability to purchase for self-occupation through the income effect but also stimulates improvement and investment demands through the wealth effect.
(2) Housing supply (Area): Add the completed area of commercial housing as a supply-side control variable and take the logarithm. This indicator reflects the actual delivery scale of real estate and is the most intuitive measure of the physical supply in the real estate market (Sun, 2020). An increase in the completed floor area means an increase in the available housing supply in the real estate market. Under unchanged demand, an increase in supply will exert downward pressure on housing prices; conversely, it may lead to a shortage of supply and push up housing prices.
(3) Land finance dependence (Land): Local governments have the motivation to raise land prices by controlling the pace of land supply to maintain fiscal revenue. This directly increases the cost of real estate development and is passed on to housing prices. Regions with high dependence are more likely to introduce demand-stimulating policies such as housing subsidies and relaxation of purchase restrictions, which can boost housing prices in the short term (Xiao and Zhang, 2025). Land assets are important collateral for local government financing tools, and local fiscal conditions are closely related to the real estate market situation. Local governments use land transfer proceeds as collateral for financing and infrastructure construction. Fluctuations in housing prices affect land prices, causing fluctuations in government investment and total output. Fluctuations in total output, in turn, influence land prices, forming an acceleration mechanism (Li, 2019a). Land finance dependence is measured by the proportion of land finance revenue in government fiscal revenue.
(4) Government debt risk (Risk): There is a positive correlation between the scale of local government debt in China and the amplitude of economic fluctuations. Due to the rising local government debt and the lack of transparency in information, the fiscal risks brought about by debt problems may directly transform into financial risks (Li, 2019b). Strict regulation of the real estate market has significantly reduced housing transaction volumes in major cities, leading to a marked decline in local government land transfer income and causing severe fiscal pressure (Li, 2024). Debt pressure affects government intervention in the real estate market, thereby altering the supply and demand balance in the real estate market. Due to the opacity of government debt balance data for prefecture-level cities, the balance of local government investment company debt is used as a proxy variable for government debt balance (Wang and Song, 2025). Government debt risk is measured by the proportion of local government investment company debt balance in government fiscal revenue.
(5) Technological level (Tech): Technological level is measured by the proportion of science expenditure in local fiscal general budget expenditure. In the current process of transforming China's macroeconomic growth model to an innovation-driven one, the imbalance of technological resources has become an important reason for the significant differentiation in the real estate market. Research has found that both the improvement of technological innovation capabilities and the optimization of industrial structure have positive effects on housing prices (Song, 2019; Yang et al., 2019). Controlling this variable helps to distinguish the industrial upgrading effect caused by technological development from the impact of environmental regulations to a certain extent.
(6) Intelligence level (AI): As artificial intelligence technology continues to integrate with traditional manufacturing, it will promote the agglomeration of enterprises and form a new economic geography pattern. Intelligence level is measured by the logarithm of the number of artificial intelligence enterprises (Hu et al., 2021). The development of general technologies such as artificial intelligence represents the overall innovation environment and industrial competitiveness of a city. The development of artificial intelligence affects housing demand and housing prices by attracting high-skilled talent, improving labor productivity, and increasing labor income (Zhang et al., 2025; Wang et al., 2020; Sun et al., 2022). The layout of emerging industries represented by information technology and network technology has a significant positive impact on urban economic development and housing price levels (Han et al., 2019). Controlling such variables helps to avoid attributing the housing price effect brought about by general technological progress to environmental regulations.
3.1.3 Mediating variables
Based on the “innovation compensation hypothesis” and the “cost compliance hypothesis,” this paper selects green technological innovation and the upgrading of industrial structure as mediating variables. The number of green patent authorizations reflects the quality, practical value, and market recognition of green technological innovation (Qi et al., 2018). The upgrading of industrial structure (Industry) refers to the evolution of the dominant proportion of the first industry in the entire industrial structure step by step to that of the second and third industries, that is, the industrial focus shifts successively (Qiao and Shen, 2021). It has evolved step by step from labor-intensive industries having a dominant proportion to capital-intensive and technology and knowledge-intensive industries having a dominant proportion, that is, to the successive transfer of various factor intensities. The upgrading of industrial structure is expressed by the proportion of the added value of the tertiary industry to that of the secondary industry. The mediating effect model is as follows:
Among them, Xit and Mit are two mediating variables, including industrial structure and green technology development. Referring to the research of (Baron and Kenny 1986), when the coefficients θ1, β1, and γ2 are all significant, if the coefficient of γ1 is smaller or significantly lower than that of θ1, it indicates that the mediating variable Mit has a mediating effect.
3.2 Descriptive statistics of main variables
The median of the explained variable, housing prices, is 4.23, the average is 4.956, and the standard deviation is 3.605. The selected sample is close to the normal distribution. The maximum values are 0.876 and 23.313, respectively, indicating that there are significant differences in housing prices among various prefecture-level cities across the country in each year. The minimum value of the core explanatory variable, environmental regulation is 0.000, the maximum value is 3.279, and the standard deviation is 0.389. It can be seen that the environmental regulation situations of each prefecture-level city vary greatly from year to year. By the same token, it can be seen that there are significant differences in the data characteristics of each control variable among the 280 prefecture-level cities in different years, indicating that the selected sample is representative. The descriptive statistical results involving sample variables used in this study are shown in Table 2.
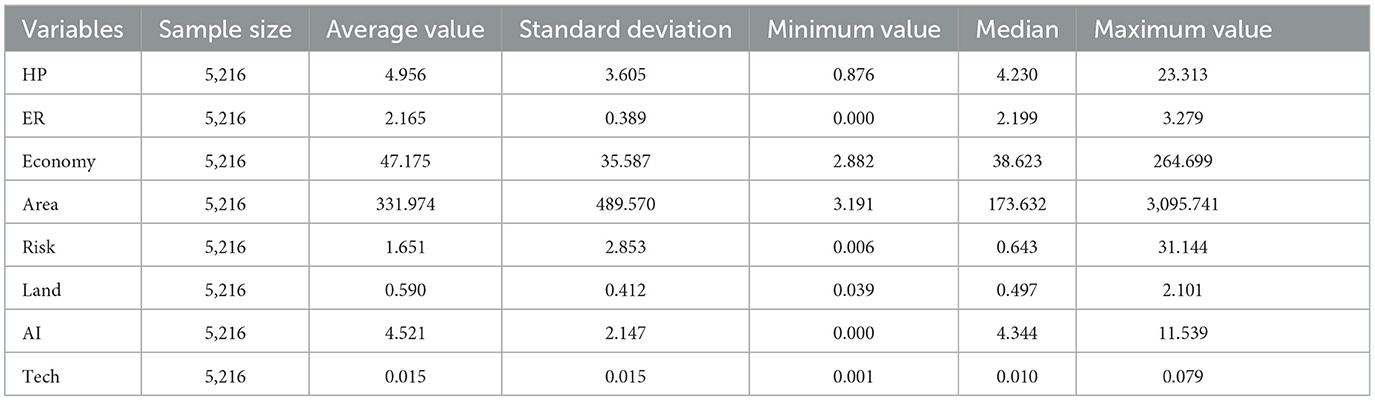
Table 2. Descriptive statistics of variables.
4 Results
4.1 Analysis of the impact of environmental regulations on housing prices
The results of the multicollinearity test show that the VIF values of all variables are no greater than 10, and the average VIF value of 1.89 is also <10. Therefore, there is no obvious collinearity problem. To avoid heteroscedasticity and autocorrelation issues, the robust standard errors are used for the regression results in this study. The regression results of environmental regulations on housing prices are shown in Table 3. The results reveal that the first-order term of environmental regulations is significantly negative, while the second-order term is significantly positive, indicating a significant U-shaped relationship between environmental regulations and housing prices. The empirical results show that the inflection point value is 2.9724813. At present, only 32 prefecture-level cities have crossed the inflection point, suggesting that the effect of environmental regulations on reducing housing prices is greater than that of increasing them. China's environmental regulations are generally in the stage of reducing housing prices, that is, on the left side of the U-shaped curve. The earliest appearance of the U-shaped inflection point was in 2010, which is deeply related to the “Four Trillion” economic stimulus plan. In November 2008, in response to the global financial crisis, China quickly launched a package of plans centered on expanding domestic demand, which was expected to stimulate about 4 trillion yuan of domestic demand by the end of 2010, known as the “Four Trillion Plan.” This plan coordinated ecological governance and infrastructure investment through supply-side measures and used stimulus tools such as interest rate cuts and tax reductions on the demand side, along with the expectation guidance of “national market support,” to systematically reverse the downward trend of the market. The cumulative effect of key policies emerged in 2010, coinciding with the end of the “Eleventh Five-Year Plan” (2006–2010). The “Eleventh Five-Year Plan” first included “energy conservation and emission reduction” as a binding target in the national strategy, marking the transition of environmental policies from passive governance to active regulation. The ecological investment of the “Four Trillion” and the emission reduction pressure of the “Eleventh Five-Year Plan” resonated at this time, causing the intensity of environmental regulations to exceed the threshold and ultimately achieving a historic breakthrough at the U-shaped inflection point.
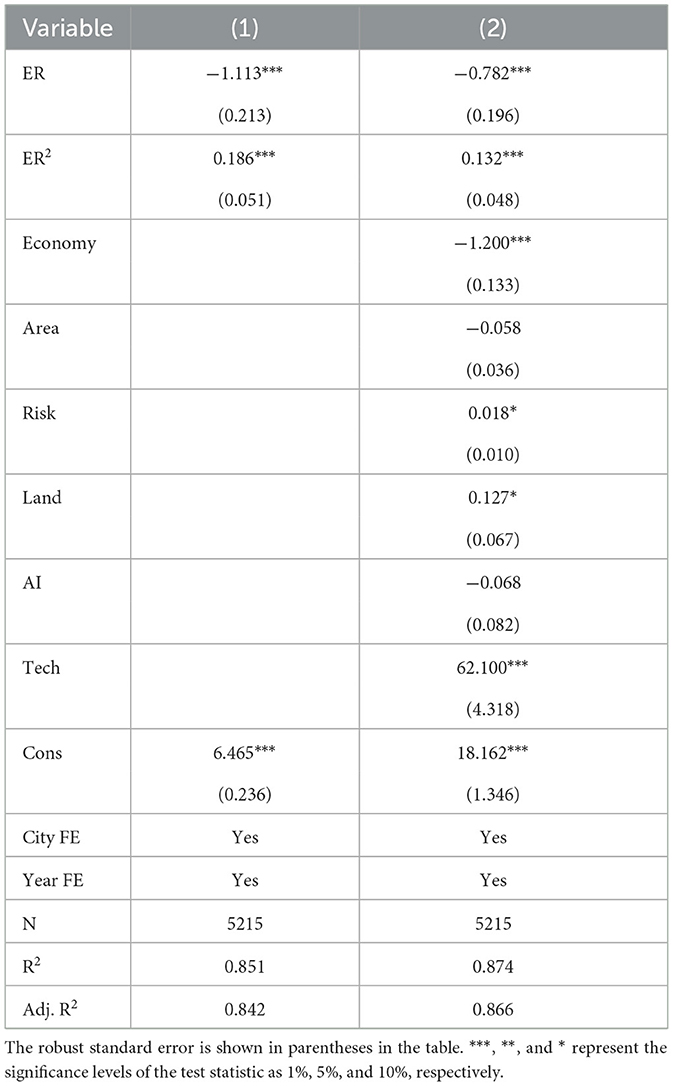
Table 3. Benchmark regression of the impact of environmental regulations on housing prices.
There is a U-shaped relationship between environmental regulation intensity and housing prices: when the regulation intensity is in a lower range, enterprises transfer the cost of environmental regulation through layoffs or salary cuts, leading to a decline in residents' income and a contraction in the real estate market. At the same time, traditional polluting industries contract while the clean industry has not yet formed a scale economy, and the regional industry is in a period of transition between old and new growth drivers, further intensifying the downward pressure on housing prices. At this time, the cost constraint effect of environmental regulation dominates, and housing prices decline along the left side of the U-shaped curve. When the regulation intensity exceeds the critical threshold, the clean industry enters a stage of scale expansion and forms an industrial chain agglomeration effect. This not only creates high-value-added jobs and attracts high-skilled labor inflows but also significantly improves regional livability through environmental quality improvement. Driven by environmental improvement and industrial upgrading, housing prices turn to an upward trend along the right side of the U-shaped curve. The appearance of the inflection point is influenced by the intensity of policies and the speed of industrial transformation. Only when the intensity of environmental regulation is sufficient to force the complete transformation of traditional industries, promote the development of green industries, and form local competitive advantages will it promote the prosperity of the real estate market.
4.2 Robustness test and endogeneity test
The robustness test results are shown in Table 4. The robustness test uses the methods of adding control variables and replacing independent variables. Column (1) of Table 4 shows the results of adding control variables, and column (2) shows the results of replacing independent variables. The added control variable is population density, and the data is sourced from the China City Statistical Yearbook. The measurement method for replacing environmental regulations is the sum of environmental protection word frequencies. The results of adding control variables and replacing independent variables show that the primary term of environmental regulation is negatively significant and the secondary term is positively significant, which is consistent with the previous results. The robustness test is passed. Even though the quadratic coefficient remains statistically significant after replacing the explanatory variable, its small magnitude indicates limited economic or practical significance.
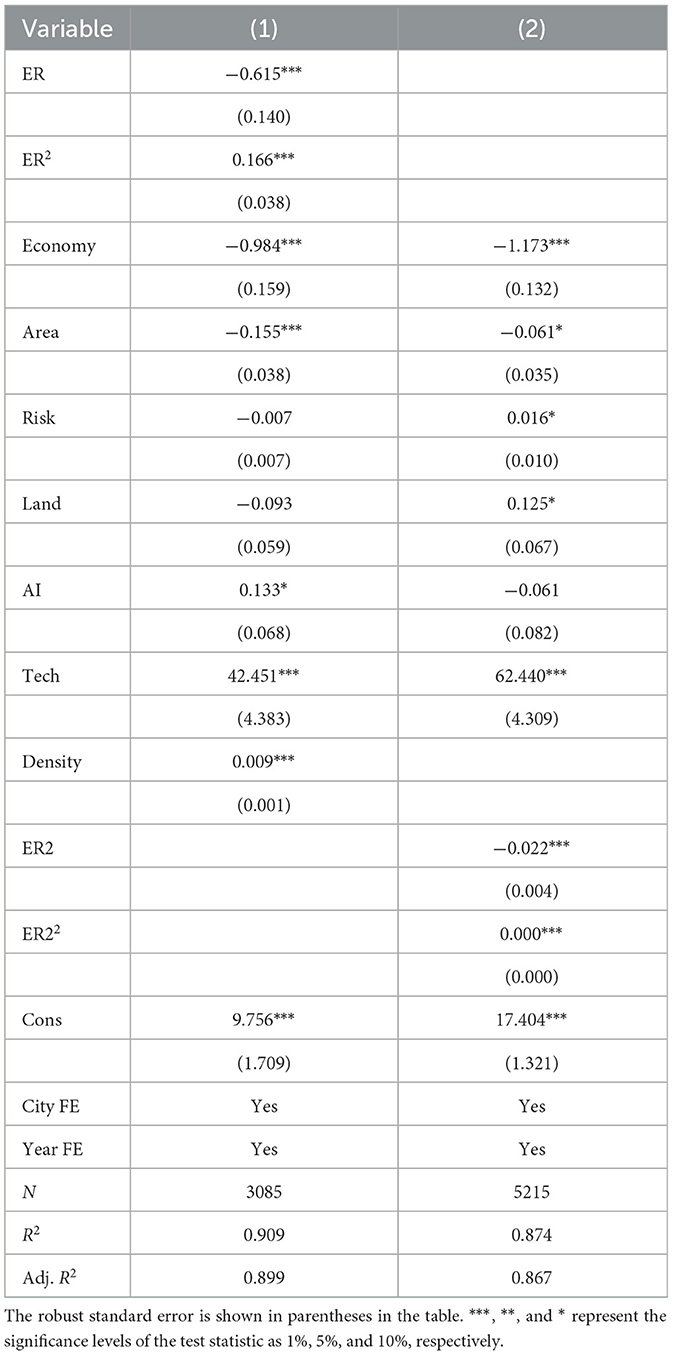
Table 4. Results of robustness tests.
This paper uses river density and the opening of railways in 1933 as instrumental variables for environmental regulations. Generally, cities with higher river density may have more convenient transportation. Enterprises, considering transportation costs, are more likely to invest and build factories in areas with higher river density. As a result, cities with higher river density may have more severe environmental pollution. This may lead local governments to set up more environmental monitoring stations in these cities (Ghanem and Zhang, 2014; Yu et al., 2020; Shi, 2022), and the degree of environmental regulations is relatively stronger, meeting the requirements of correlation. At the same time, river density as a natural geographical condition does not have a direct impact on housing prices, meeting the requirement of exogeneity of instrumental variables. The river density data is obtained from the National Basic Geographic Information Center. By calculating the vector information of river vectors and urban administrative boundary vectors, the total length of rivers in each city is obtained, and the river density is calculated based on the administrative area of the city.
The opening of railways in 1933 as an exogenous historical event promoted the early industrialization process of cities. During this period, a lack of modern environmental awareness led to severe pollution accumulation. Contemporary local governments in cities with more serious historical industrial pollution problems have to implement stricter environmental regulations. The main channel through which the opening of railways in 1933 affects contemporary housing prices is by shaping the industrial foundation and pollution history of cities, thereby triggering stricter contemporary environmental regulations, meeting the requirements of correlation and exogeneity of instrumental variables. The data on the opening of railways in 1933 is obtained from “China Railway Handbook” and “History of Chinese Transportation” (Ministry of Railways of the Republic of China, 1934; Bai, 1937). By determining whether a city had railway access in 1933, cities are marked as 1 or 0. If the railway line passed through the current city at that time, it is marked as 1; otherwise, it is marked as 0 (Tian et al., 2023; Zhang and Liu, 2008). To endow the instrumental variables with both temporal and city-level dimensions, this paper follows the two-dimensional instrumental variable approach of Nunn and Qian (2014) and Huang et al. (2019), interacting each city's sulfur dioxide emissions over the sample period with the instruments to capture their time-varying characteristics. This paper employs the interaction term of historical railway opening conditions and sulfur dioxide emissions as the instrumental variable, with the results shown in Table 5; it uses the interaction term of river density and sulfur dioxide emissions as the instrumental variable, with the results shown in Table 6; and it uses the interaction term of river density and the lagged environmental regulation as the instrumental variable (Bai and Rui, 2023), with the results shown in Table 7. Columns (1) and (2) of Tables 5–7 present the first-stage results of the instrumental variables, with the first-stage F-test values all far exceeding the critical value of 16.38, indicating no weak instrumental variable problem. Column (3) of Tables 5–7 presents the second-stage results of the instrumental variables, showing that environmental regulation still significantly affects regional housing prices.
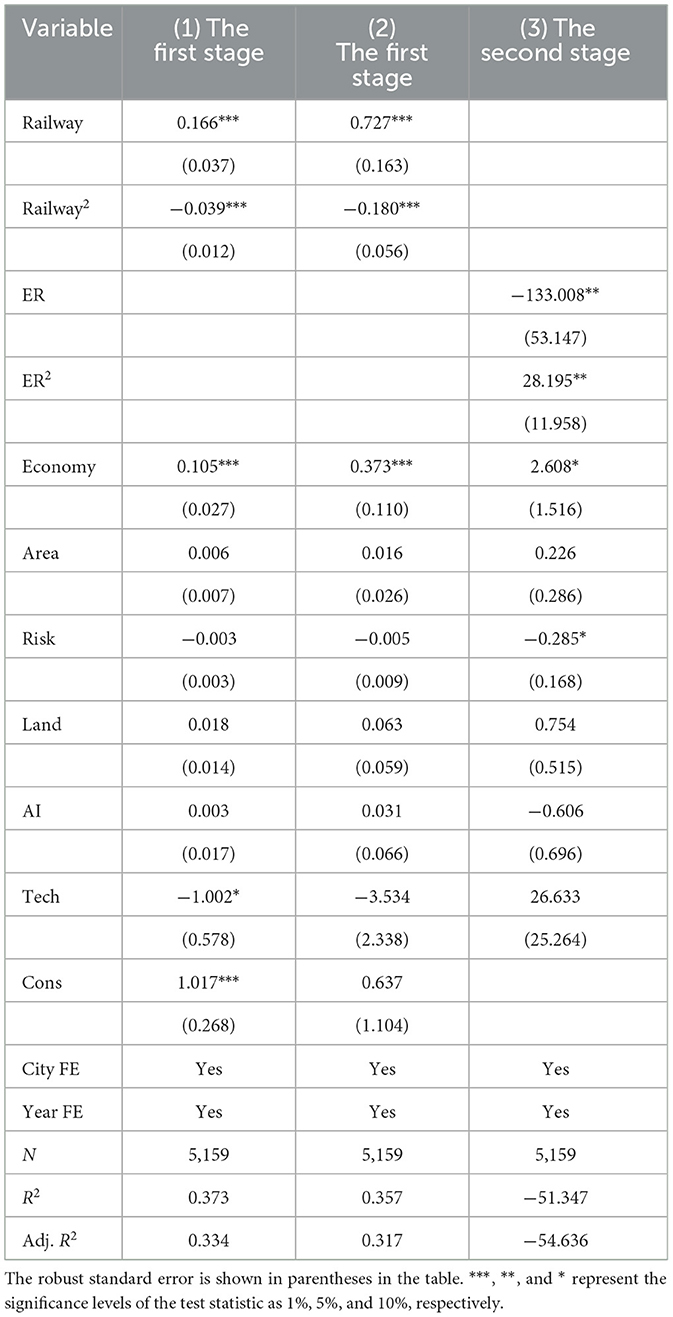
Table 5. The endogeneity test results of the instrumental variable constructed based on the historical railway opening conditions.
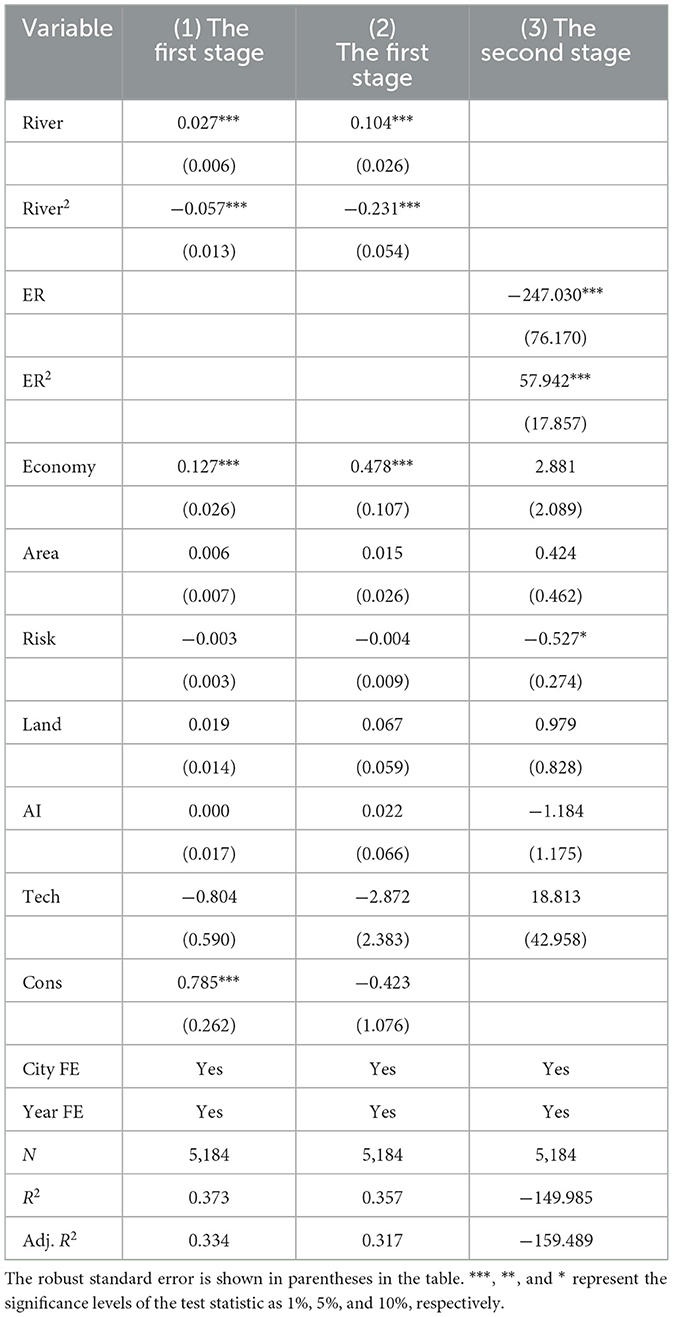
Table 6. The endogeneity test results of the instrumental variable constructed based on river density.
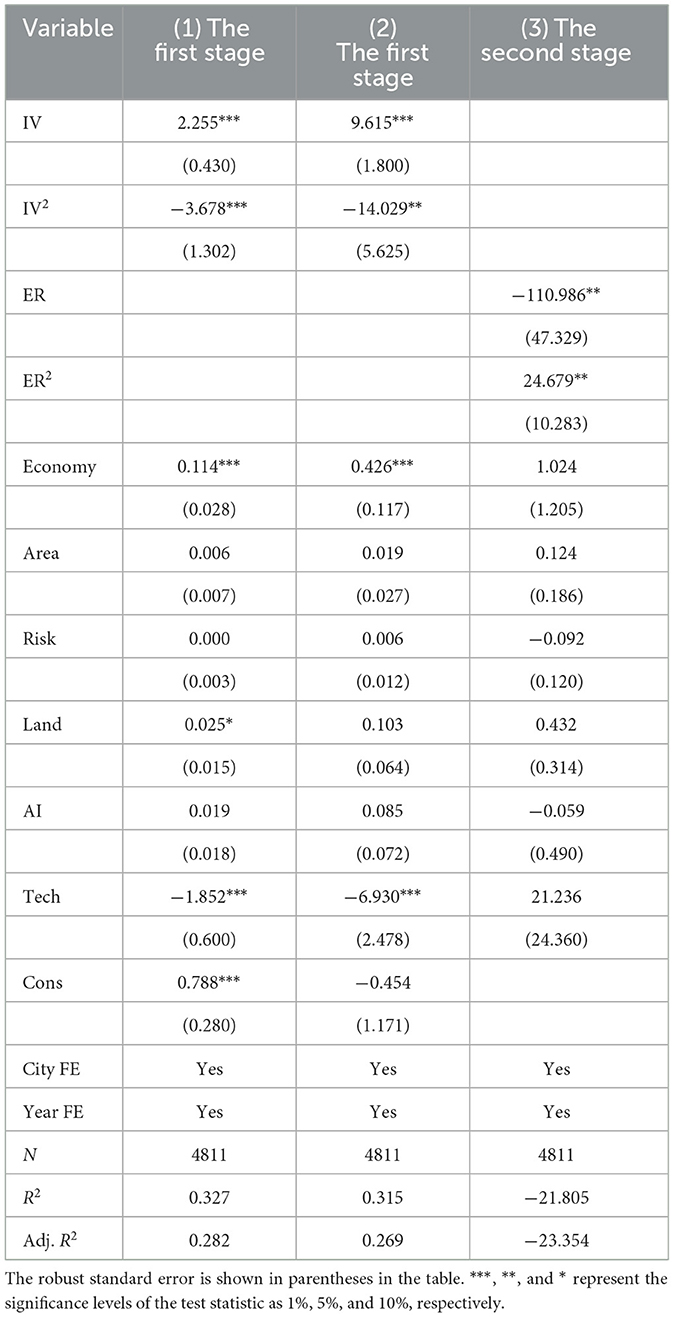
Table 7. The endogeneity test results of the instrumental variables constructed with a one-period lag environmental regulation.
4.3 Heterogeneity analysis
The heterogeneity analysis of this paper is divided into regional heterogeneity and temporal heterogeneity, as shown in Table 8. Considering the global financial crisis in 2008 and the impact of the epidemic in 2020, the temporal heterogeneity is divided into 2003–2009, 2010–2015, 2016–2020, and 2021–2023. The U-shaped results in the 2003–2009 and 2010–2015 periods are the benchmark periods for understanding the relationship between environmental regulations and housing prices. During this period, the global financial crisis (GFC) occurred in 2008, and China implemented a large-scale economic stimulus plan (“Four Trillion”) in 2009, with a large amount of funds invested in infrastructure and public welfare projects, which had a strong supporting effect on the real estate market, and the U-shaped effect of environmental regulations on housing prices became apparent. In 2012, under the strong catalysis and value reshaping of the “ecological civilization construction” and “Beautiful China” concepts at the 18th National Congress of the Communist Party of China, the positive effect of environmental regulations on housing prices began to emerge in the later stage of this period. Overall, both periods were in the context of rapid urbanization, continuous growth in residents' income, and a growing desire for a better life in China, which provided long-term impetus for the transformation of environmental regulations into housing price premiums. The period from 2016 to 2020 was the “13th Five-Year Plan” period. During this period, the impact of environmental regulations on housing prices was no longer significant. This was mainly due to the high-intensity parallel implementation of “environmental protection pressure” and the policy of “houses are for living in, not for speculation.” On the one hand, the strict environmental regulations under the supply-side reform have significantly increased costs. On the other hand, the “houses are for living in, not for speculation” policy has strongly suppressed market demand and expectations of rising housing prices. Coupled with the increased financing pressure faced by real estate developers under the deleveraging process, the impact of environmental regulations is no longer statistically significant. Moreover, the initial shock of the COVID-19 pandemic further blurred the influence of various factors. The period from 2021 to 2023, as the fourth research stage, the most revealing finding of this study is that environmental regulations have a significant inverted U-shaped impact on housing prices. This finding highlights the influence of extreme financial and economic fluctuations during this stage. This unique pattern is the result of multiple extreme pressures, including the continuous impact of the COVID-19 pandemic, the liquidity crisis triggered by the “three red lines” for real estate developers, the start of a global high-interest-rate cycle, and the continuous deepening of the “houses are for living in, not for speculation” policy. Since the second half of 2021, the liquidity crisis of real estate developers has fully erupted, coupled with global interest rate hikes and economic downturn pressure, the real estate industry has fallen into a deep adjustment. Under this extreme environment, the “cost effect” of environmental regulations has been greatly magnified and dominated, which profoundly reveals that in a market environment dominated by systemic risks and confidence crises, the traditional transmission mechanism between environmental regulations and housing prices has been severely distorted, and the cost burden pressure on the survival of micro-entities has been highlighted. Future research needs to further explore whether the relationship between environmental regulations and housing prices will return to the traditional U-shaped path as the market gradually stabilizes after the crisis.
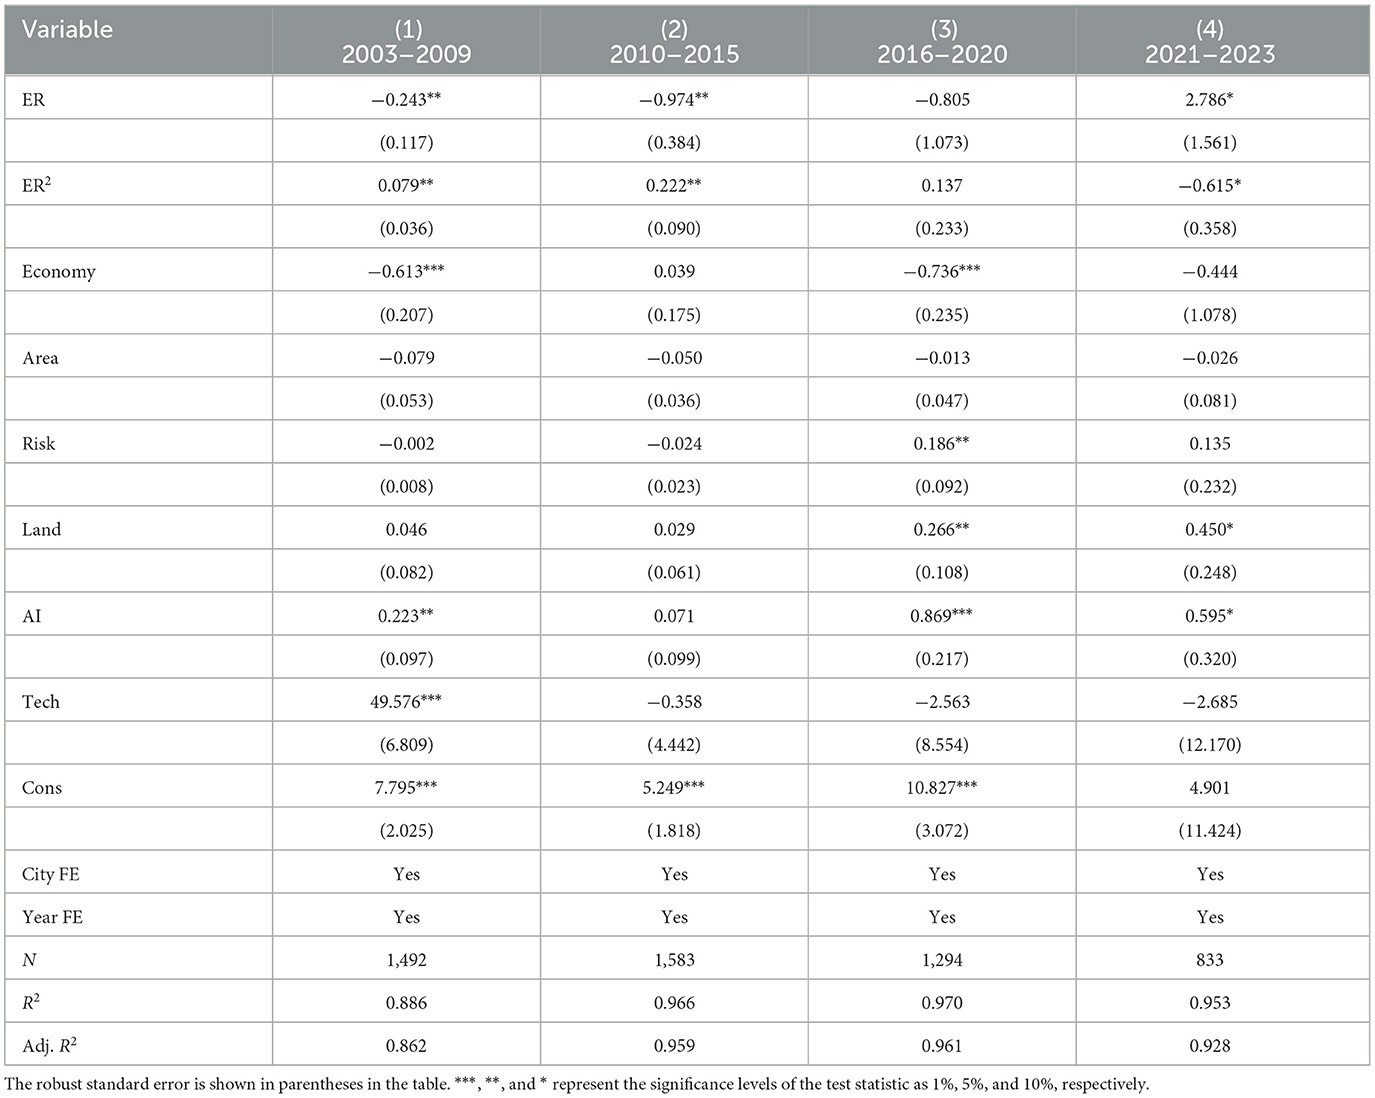
Table 8. Analysis of temporal heterogeneity.
The regional heterogeneity research in this paper is divided into cities along the Yellow River and cities along the Yangtze River, as shown in Table 9. The ecological protection and high-quality development of the Yangtze River Basin and the Yellow River Basin, as national strategies targeting basin economies in China, are key areas for the coordinated advancement of building a modern socialist power. According to the definitions of the Yangtze River Basin and the Yellow River Basin in the “Comprehensive Plan for the Yangtze River Basin (2012–2030)” and the “Comprehensive Plan for the Yellow River Basin (2012–2030),” regional heterogeneity is classified into cities along the Yellow River and non-Yellow River Basin cities, and cities along the Yangtze River and non-Yangtze River Basin cities. The Yellow River Basin starts from Dongying City in Shandong Province (~119°30′ east longitude) in the east and ends at Yushu Prefecture in Qinghai Province (~95°53′ east longitude) in the west. It extends from Bayannur City in Inner Mongolia Autonomous Region (~41°50′ north latitude) in the north to Shangluo City in Shaanxi Province (~32°12′ north latitude) in the south. The Yangtze River Basin starts from Shanghai (~122°25′ east longitude) in the east and ends at Yushu Prefecture in Qinghai Province (~90°33′ east longitude) in the west. It extends from Guoluo Prefecture in Qinghai Province (~35°45′ north latitude) in the north to Pu'er City in Yunnan Province (~24°30′ north latitude) in the south. Since the Yellow River flows through only two autonomous prefectures within Sichuan Province, the cities of Sichuan Province are not included in the Yellow River Basin area (Sun and Zhou, 2024). The cities along the Yellow River Basin cover eight provinces (autonomous regions), namely Qinghai, Gansu, Ningxia, Inner Mongolia, Shaanxi, Henan, and Shandong. Cities along the Yangtze River Basin cover 11 provinces (municipalities), namely Sichuan, Yunnan, Guizhou, Chongqing, Hubei, Hunan, Jiangxi, Anhui, Jiangsu, Zhejiang, and Shanghai. Cities along the Yangtze River are generally located south of the Qinling-Huaihe Line, that is, in the southern part of China; while cities along the Yellow River are generally located north of the Qinling-Huaihe Line, that is, in the northern part of China. The results show that the impact of environmental regulations on housing prices in cities along the Yangtze River is significantly U-shaped, while it is not significant in cities along the Yellow River. The impact is not significant in cities beyond the Yangtze River Basin, but it is significant in cities beyond the Yellow River Basin. The significant differences in economic development results between the Yangtze River and Yellow River basins can be attributed to the government's intervention and control over the allocation of key factor resources in the market, which has led to a lag in the marketization reform of the factor market compared to the product market, that is, the “distortion of the factor market under government intervention and heterogeneous incentive effects on enterprise innovation” (Zhang and Zheng, 2023). After the “Four Trillion” economic stimulus plan in 2008, there were significant policy differences in the implementation of policies between the north and south of China, especially the northern local governments implemented stronger intervention and control over key factor markets (land, capital, and labor), resulting in the lag of factor marketization reform in the north compared to the product market, and the degree of factor market distortion was much higher than that in the south. This intervention distorted the allocation direction and efficiency of factor resources, causing a large amount of capital to flow to less efficient northern state-owned enterprises rather than more innovative potential private enterprises or market-oriented fields. Although there is also government intervention in the south, its market mechanism is relatively more flexible, resulting in a relatively lower degree of factor resource distortion.
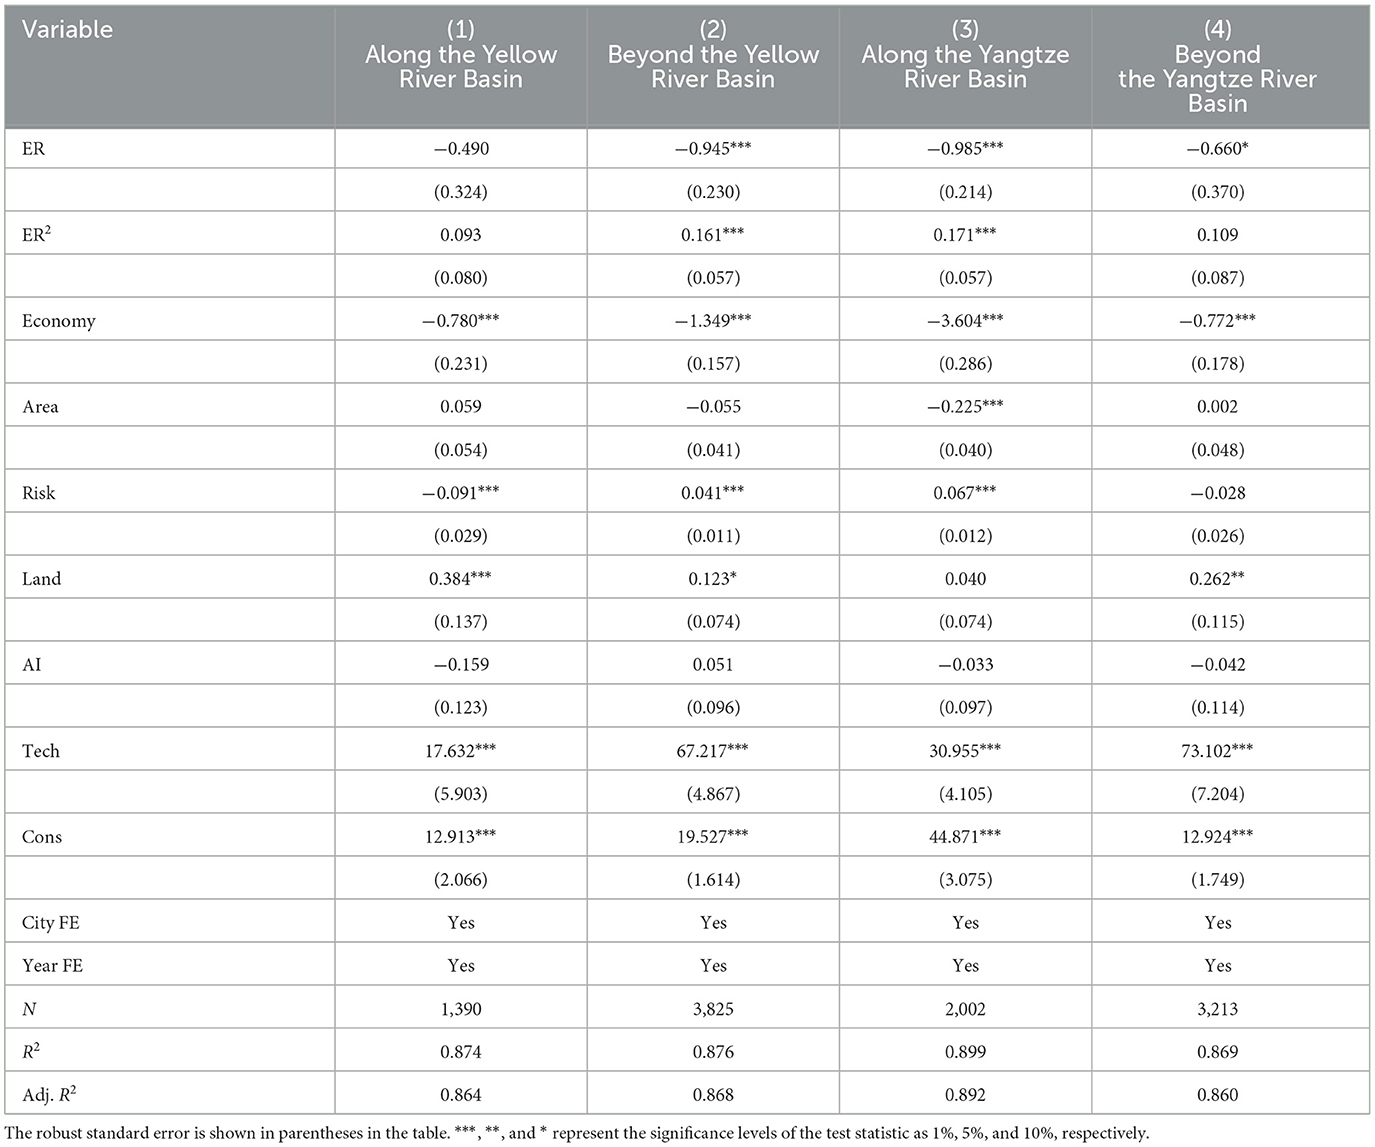
Table 9. Analysis of regional heterogeneity.
Since factor market distortion has been proven to have a significant inhibitory effect on regional innovation capacity, industrial innovation capacity, and micro-enterprise innovation capacity, it ultimately led to a significant differentiation in the innovative development of enterprises in the north and south (Luo et al., 2012). Many scholars have analyzed the economic differences between the North and South from historical, geographical, economic structure, and business environment factors. The differences in geographical environment, resource endowment, and industrial structure between the north and south have a long history (Ji et al., 2023). Cities along the Yangtze River have a high level of economic development. Although environmental regulations increase the cost of enterprises, the maturity of the green industry and the completion of industrial transformation driven by environmental regulations have led to a prosperous real estate market and a U-shaped trajectory of rising housing prices. In cities along the Yellow River Basin, where traditional heavy industry still accounts for a large share of output, the capacity cuts triggered by environmental regulations cannot be adequately offset by industrial transformation. Sluggish economic recovery dampens real estate market vitality, while the implementation of environmental policies is constrained by growth-stabilization pressures and the difficulty of seasonal pollution control, preventing housing prices from exhibiting a pronounced U-shaped rebound. The development level of new quality productivity in the Yangtze River Basin is generally higher than that in the Yellow River Basin. In the future, industrial and green development will be the strongest driving force for the differences between the Yangtze River Basin and the Yellow River Basin (Cheng, 2025).
This paper further categorizes the total frequency of environmental regulation terms into three categories: pollution control, ecological protection, and carbon reduction, as shown in Table 10. The pollution control category includes pollution, pollutant discharge, Sulfur dioxide, PM2.5, PM10, and chemical oxygen demand. The ecological protection category includes ecology, green, environmental protection, EP, and air. The carbon reduction category includes energy consumption, emission reduction, low carbon, and carbon dioxide. The results indicate that the impact of ecological protection and carbon reduction regulations on housing prices is not significant, while pollution control regulations exhibit a pronounced inverted U-shaped pattern. This paper believes that a single-dimensional sub-index may not be able to comprehensively and accurately capture the overall intensity of environmental regulations and their complex mechanism of action on housing prices. The pollution control indicators, due to the changes in the intensity of regulations, are more likely to affect housing prices through the cost effect on enterprises, ultimately forming an observable inverted U-shaped trajectory in housing prices.
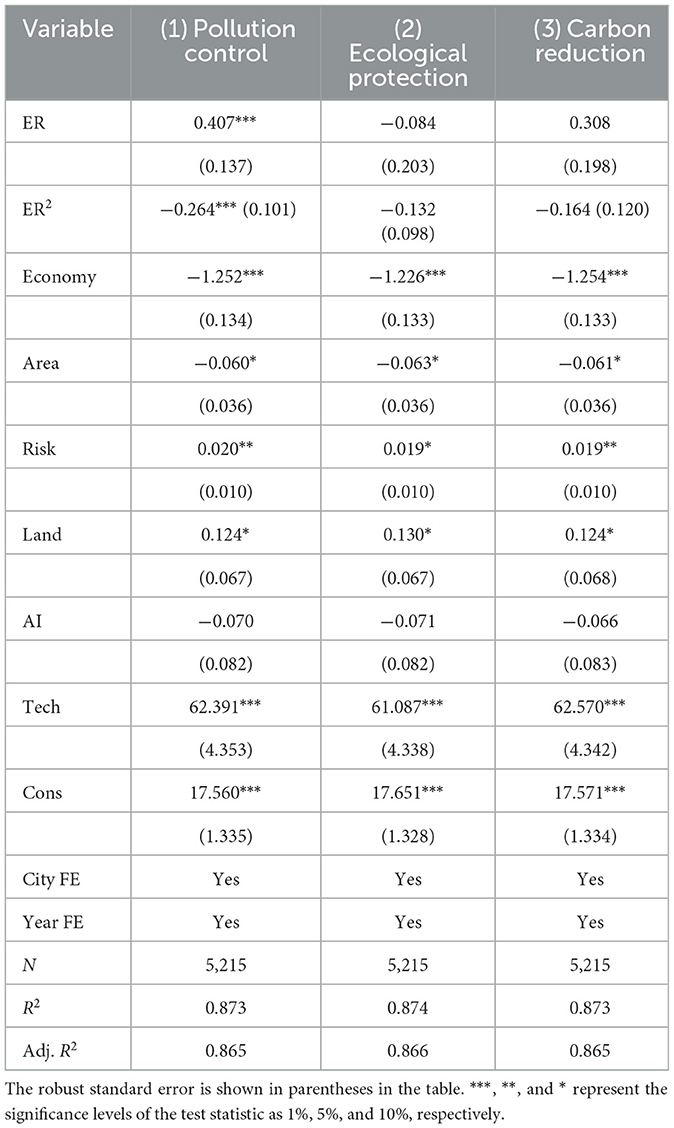
Table 10. The heterogeneity of environmental regulations.
4.4 Mediation effect analysis
According to the “cost compliance hypothesis,” environmental regulations increase the pollution control costs of high-pollution and high-energy-consuming secondary industry enterprises. To meet increasingly strict environmental standards, these enterprises must invest a large amount of funds in pollution control and technological upgrading, which raises their production costs. Facing continuous cost pressure, high-pollution enterprises are often forced to reduce production scale or shut down part of their capacity, leading to a contraction in the overall relative scale of the secondary industry and the evolution of the industrial structure toward a more advanced form. The mediating effect of industrial structure upgrading is shown in Table 11. The coefficient of environmental regulation in column (3) is lower than that in column (1), which meets the criteria for a mediating variable, and the mediating effect of industrial structure upgrading is a promoting effect. According to “innovation compensation hypothesis,” environmental regulations can stimulate technological innovation in enterprises by enhancing production efficiency or product competitiveness (Porter and Linde, 1995). Green technological innovation aims to protect the ecological environment while also considering sustainable economic development. It uses advanced scientific and technological research and development or improvement of current processes as means, and takes improving resource utilization efficiency or reducing pollutant emissions as the path to achieve the coordinated development of energy conservation, emission reduction, and high-quality economic growth (Braun and Wield, 1994). The mediating effect of green technological innovation is shown in Table 12. The coefficient of environmental regulation in column (3) is lower than that in column (1), which meets the criteria for a mediating variable, and the mediating effect of green technological innovation is a promoting effect. Industrial structure upgrading and green technological innovation promote the large-scale development of clean industries. Clean industries usually have higher added value and broader market prospects, which can attract more investment and resources, thereby driving the expansion of related industrial chains and improving green production efficiency. The development of clean industries requires a large number of high-skilled talent with green skills, such as those in the field of new energy technology research and development. The demand for high-skilled talent increases employment opportunities and income levels, thereby increasing housing demand. At the same time, the development of clean industries and the improvement of environmental quality enhance the attractiveness of cities, further promoting the prosperity of the real estate market and the rise in housing prices.

Table 11. Analysis of the mediating effect of industrial structure upgrading.
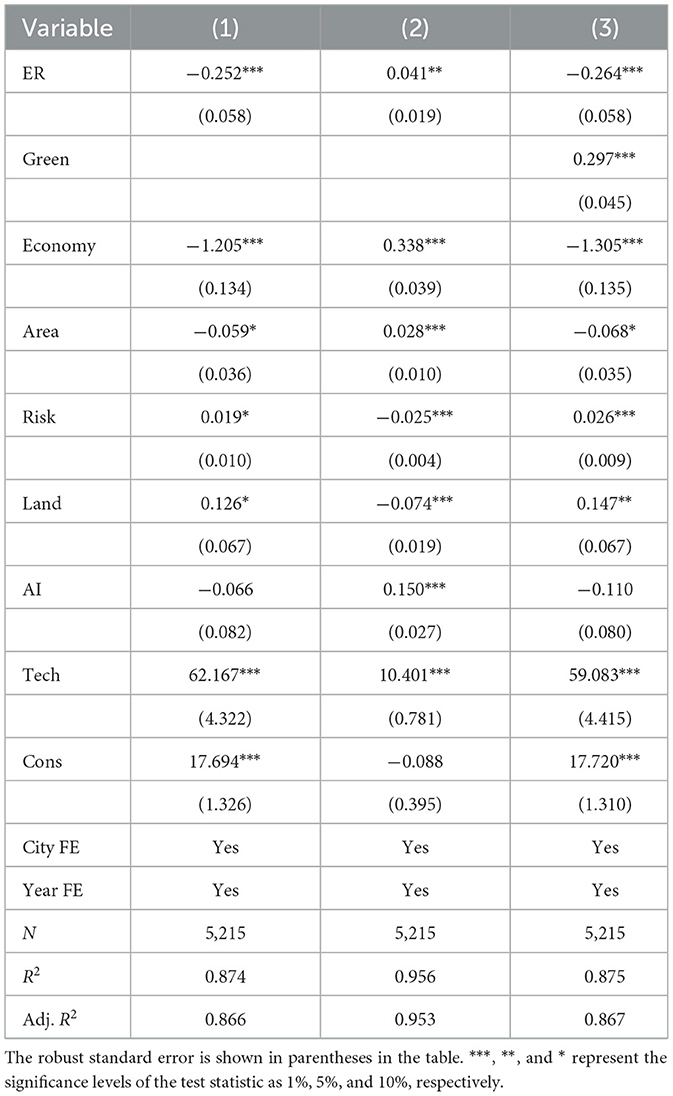
Table 12. Analysis of the mediating effect of green technology innovation.
5 Conclusions and suggestions
5.1 Research conclusions
Based on the empirical research results of panel data from prefecture-level cities from 2003 to 2023, this paper finds that the impact of environmental regulations on housing prices shows a U-shaped characteristic, with only 32 prefecture-level cities having crossed the inflection point, indicating that China's environmental regulations are generally in the stage of regulating housing prices. The results of time heterogeneity show that environmental regulations have a significant U-shaped impact on housing prices during the periods of 2003-2009 and 2010-2015, but no significant impact during 2016-2020, and a significant inverted U-shaped impact during 2021-2023. The results of regional heterogeneity show that environmental regulations in cities along the Yangtze River have a significant U-shaped impact on housing prices, while those in cities along the Yellow River do not have a significant U-shaped impact. The results of the mediation effect study show that environmental regulations affect housing prices through influencing industrial structure and green technological innovation. The transformation practice of China's industrialization process from “pollute first, clean up later” to “green mountains and clear waters are as valuable as gold and silver” indicates that the transmission mechanisms of industrial structure change and green technological innovation in the impact of environmental regulations on housing prices in the Chinese case constitute the micro-implementation path of global sustainable development goals. The governance inspiration beyond national boundaries under the concept of a community with a shared future for mankind is to transfer China's U-shaped experience of environmental regulations through the “Belt and Road” green technology transfer mechanism, making it a case for global reference.
This paper also has two limitations. First, due to the constraints of the availability and completeness of transaction price data for different types of real estate at the prefecture-level city level, a detailed study on the types of real estate has not been conducted. (Lin et al. 2022) evaluated whether changes in short-term and long-term interest rates and their volatility had different impacts on the excess returns of real estate investment trusts (REITs) in specific industries in the Pacific Rim region during 2006-2018. The results showed that in specific industry REITs, retail and residential REITs were more susceptible to interest rate fluctuations throughout the study period, while office and specialized REITs were generally less sensitive to the levels and volatilities of short-term and long-term interest rate series in all Pacific Rim markets. The housing-price indicators used in this paper refer to the average transaction prices of residential and commercial properties, without further disaggregating sub-markets such as office or retail units. Classifying different types of real estate industries is of great significance (Hoesli and Oikarinen, 2012). Due to the possible significant differences in the sensitivity and transmission mechanisms of different types of real estate to environmental regulations, the current U-shaped relationship at the aggregated level may mask the heterogeneity of different real estate types, limiting the refined application of conclusions. Secondly, due to the structural limitations of unbalanced panel data, the model cannot incorporate spatial econometric methods. As the sample of this study is an unbalanced panel, standard spatial econometric models require a complete spatio-temporal matrix. If a spatial weight matrix is constructed, some samples will be excluded due to the lack of adjacent city data, and non-random missing data may cause sample selection bias. In the future research outlook, when data conditions permit, transaction data of segmented real estate types should be collected to precisely quantify the U-shaped impact of environmental regulations on heterogeneous housing prices, providing a reference basis for the design of differentiated real estate policies. Moreover, balanced panel data should be used to construct spatial models, taking into account more spatial spillover effects.
5.2 Policy recommendations
Based on the concept of sustainable development, the following policy recommendations are proposed in this article:
First, promote the coordinated development of environmental governance and economic growth in different regions and at different development stages. Affected by the economic environment in the post-pandemic period of 2021-2023, the impact of environmental regulations on housing prices shows a significant inverted U-shaped feature. Under the current downward trend of housing prices, the real estate policy framework should focus on the three logics of “preventing risks, adjusting structures, and stabilizing demand.” In the short term, ensuring the completion of unfinished buildings, resolving debts, and stabilizing financing are the keys to maintaining the risk bottom line. The government can inject funds, take over projects, and restructure debts to resume the construction and delivery of unfinished buildings, effectively safeguarding the rights and interests of homebuyers. For the high debt problem of real estate enterprises, measures such as providing liquidity support, extending debts, and selling assets can be adopted to dismantle debt risks, restore the financing channels of real estate enterprises, and avoid the chain reaction caused by the breakage of the capital chain. In the medium and long term, the supply structure should be continuously optimized through “land acquisition and urban village renovation” to meet diverse housing demands and accelerate the transformation and upgrading of the real estate industry. Specifically, the government can purchase unsold commercial housing from developers and convert it into public housing, such as affordable housing and talent apartments. At the same time, urban villages within the built-up area can be demolished and rebuilt or micro-renovated to upgrade the living environment and increase land value. According to the regional heterogeneity of environmental regulations, measures should be planned reasonably based on local conditions to achieve the goal of stabilizing housing prices. From a national perspective, for cities still on the left side of the U-shaped turning point, environmental regulations can be moderately strengthened through measures such as raising pollution control standards, providing green innovation subsidies, and promoting low-carbon technologies to reduce the pressure on enterprises' green transformation. For cities that have crossed the U-shaped turning point, attention should be paid to the potential problems caused by rapid housing price increases. Strengthen the coordination of central and local policies, balance environmental regulations and the goal of stabilizing housing prices, summarize experiences through policy pilots and promote them nationwide, ultimately achieving a multi-objective balance between environmental protection and economic growth.
Second, strengthen support for green transformation to accelerate the conversion of environmental regulations from cost constraints to value creation. “Cost constraints” mainly refer to the direct economic burden brought by environmental regulations, which suppresses enterprise activities and housing prices. “value creation” mainly refers to significantly enhancing enterprise value through promoting green technological innovation (Zhang and Song, 2025), thereby promoting the formation of scale effects in the green industry and driving the prosperity of the real estate market and housing price increases. The main approaches to supporting green transformation include: First, increase investment in green technology research and application. Establish a special fund for green technology research and development, focusing on key technology breakthroughs in energy-saving materials and renewable energy integration to reduce the cost of enterprises' green transformation. Second, build a green supply chain and circular economy system. Establish mandatory certification standards for green building materials, provide value-added tax exemptions or production subsidies to manufacturers that meet low-carbon requirements, and encourage enterprises to prioritize the purchase of locally produced green building materials to reduce carbon emissions during transportation. Build a resource utilization industrial chain for production waste, set up new waste recycling facilities, and award carbon quotas to enterprises that meet recycling targets. Additionally, prioritize the layout of low-carbon industries such as new energy and digital economy in cities with high-intensity environmental regulations. By promoting industrial green transformation and upgrading the employment structure, the resilience of local finances and the real estate market can be enhanced. Thirdly, promote innovation in green financial tools and establish a green capital support system covering the entire industrial chain. Use fiscal subsidies and tax incentives to alleviate the cost pressure on enterprises caused by environmental regulations. Through multi-dimensional innovations such as technological research and development, green supply chain systems, and financial tools, the cost of green transformation can be systematically reduced, accelerating the transformation of environmental regulations from “cost constraints” to “value creation.”
Third, establish a coordinated mechanism between industrial structure changes and real estate market stability. Based on the mechanism by which environmental regulations affect housing prices through industrial structure adjustment and green technological innovation, a dynamic policy framework should be constructed to promote industrial structure optimization, strengthen technological innovation support, and maintain real estate market stability. In response to the impact of environmental regulations on the industrial employment structure, a green transformation employment security fund for manufacturing can be established to provide targeted housing subsidies and retraining for workers who lose their jobs due to environmental upgrades. In key industries, accelerate the cultivation of new occupations such as “environmental equipment operation and maintenance” and “carbon asset management” to promote the transformation of vocational skills and the upgrading of the employment structure. At the same time, establish a housing price adjustment buffer mechanism for green technological innovation, and allocate a portion of the market returns from green patents as a regional housing stability fund, specifically used for subsidies on first-home loan interest rates, so that the benefits of technological innovation can reach the rigid housing demand group. To support urban green development, it is necessary to pay attention to the heterogeneity of the demand for high-end labor in industrial development, actively attract and reserve high-quality talents, and build projects such as talent apartments to meet their housing needs. Integrating digital technology with urban governance not only optimizes urban management methods but also promotes sustainable urban development (Peng et al., 2022). Against the backdrop of advanced industrial restructuring, when the growth rate of unemployment in the secondary industry exceeds the preset threshold, the early warning mechanism will automatically trigger the expansion plan for affordable housing supply to ensure the stability and resilience of the real estate market. In addition, by constructing a database linking environmental regulation and housing prices, it is possible to monitor the effects of environmental regulation policies in real time and achieve dynamic adjustments to housing policies.
Data availability statement
The datasets presented in this study can be found in online repositories. The names of the repository/repositories and accession number(s) can be found below: https://www.stats.gov.cn/english/.
Author contributions
WP: Writing – original draft, Writing – review & editing, Visualization, Resources, Validation, Funding acquisition. MW: Conceptualization, Data curation, Investigation, Writing – review & editing, Software, Writing – original draft. JX: Formal analysis, Project administration, Supervision, Writing – review & editing, Writing – original draft, Methodology.
Funding
The author(s) declare that financial support was received for the research and/or publication of this article. This work was supported by the Research on the Current Situation and Promotion Path of High-Quality Development in Counties with Medium Economic Development Level in Zhejiang Province (24NDJCO08YB).
Conflict of interest
The authors declare that the research was conducted in the absence of any commercial or financial relationships that could be construed as a potential conflict of interest.
Generative AI statement
The author(s) declare that no Gen AI was used in the creation of this manuscript.
Publisher's note
All claims expressed in this article are solely those of the authors and do not necessarily represent those of their affiliated organizations, or those of the publisher, the editors and the reviewers. Any product that may be evaluated in this article, or claim that may be made by its manufacturer, is not guaranteed or endorsed by the publisher.
Supplementary material
The Supplementary Material for this article can be found online at: https://www.frontiersin.org/articles/10.3389/frsc.2025.1621967/full#supplementary-material
Footnotes
1. ^The Chinese expressions of the environmental keywords are as follows in sequence: 环境保护, 环保, 污染, 能耗, 减排, 排污, 生态, 绿色, 低碳, 空气, 化学需氧量, 二氧化硫, 二氧化碳, PM10, PM2.5.
References
Agarwal, S., Deng, Y., and Li, T. (2019). Environmental regulation as a double-edged sword for housing markets: evidence from the NOx budget trading program. J. Environ. Econ. Manag. 96, 286–309. doi: 10.1016/j.jeem.2019.06.006
Bai, J. H., and Rui, J. (2023). Environmental regulation, economic growth target management and high-quality development of China's economy. J. Macro-quality Res. 11, 32–47. doi: 10.13948/j.cnki.hgzlyj.2023.03.003
Bai, S. Y. (1937). History of transportation in China. The Commercial Press. Reprinted by Shanghai Bookstore Publishing House.
Bao, Q., Dan, J. L., and Wang, Y. T. (2023). Domestic trade networks, geographical distance and supplier localization. Econ. Res. J. 58, 102–118.
Baron, R. M., and Kenny, D. A. (1986). The moderator-mediator variable distinction in social psychological research: conceptual, strategic, and statistical considerations. J. Pers. Soc. Psychol. 51, 1173–1182. doi: 10.1037/0022-3514.51.6.1173
Braun, E., and Wield, D. (1994). Regulation as a means for the social control of technology. Tech. Anal. Strateg. Manag. 6, 259–272. doi: 10.1080/09537329408524171
Chen, Q., Su, H., Gao, W., and Lv, J. (2025). Does environmental regulation drive or hinder the development of new quality productive forces? Evidence from Chinese listed firms. Front. Environ. Sci. 18, 456–478. doi: 10.3389/fenvs.2025.1582399
Chen, S., and Jin, H. (2019). Pricing for the clean air: evidence from Chinese housing market. J. Clean. Prod. 206, 297–306. doi: 10.1016/j.jclepro.2018.08.220
Chen, S. Y., and Chen, D. K. (2018). Haze pollution, government governance, and high-quality economic development. Econ. Res. J. 53, 20–34.
Chen, Z., Kahn, Y., Liu, Y., and Wang, Z. (2016). The consequences of spatially differentiated water pollution regulation in China (NBER Working Paper No. 16-01). Cambridge, MA: National Bureau of Economic Research. doi: 10.3386/w22507
Cheng, H., and Liao, Z. J. (2010). An empirical study on the evolution of China's environmental policy and its impact on corporate environmental innovation performance. J. Tech. Econ. 29, 8–13.
Cheng, W. L. (2025). Regional differences and influencing factors of new quality productive forces development in the Yellow River and Yangtze River basins. Yellow River 47, 1–9.
Deng, H. H., and Yang, L. X. (2019). Haze control, local competition and industrial green transformation. China Industr. Econ. 118–136. doi: 10.19581/j.cnki.ciejournal.2019.10.007
Dissou, Y., and Sun, Q. (2013). GHG mitigation policies and employment: A CGE analysis with wage rigidity and application to Canada. Canad. Public Policy 39, S53–S65. doi: 10.3138/CPP.39.Supplement2.S53
Du, L. Z., Zhao, Y. H., and Tao, K. T. (2019). The compound effect of environmental regulation and governance transformation on enhancing green competitiveness: Empirical evidence from China's industry. Econ. Res. J. 54, 106–120.
Fowlie, M. (2010). Emissions trading, electricity restructuring, and investment in pollution abatement. Am. Econ. Rev. 100, 837–869. doi: 10.1257/aer.100.3.837
Gao, B., Chen, J. Z., and Zou, L. H. (2012). Regional housing price differences, labor mobility and industrial upgrading. Econ. Res. J. 47, 66–79.
Ghanem, D., and Zhang, J. (2014). Effortless perfection: do Chinese cities manipulate air pollution data? J. Environ. Econ. Manag. 68, 203–225. doi: 10.1016/j.jeem.2014.05.003
Gray, W. B., and Shadbegian, R. J. (1998). Environmental regulation, investment timing, and technology choice. J. Industr. Econ. 46, 235–256. doi: 10.1111/1467-6451.00070
Greenstone, M., List, J. A., and Syverson, C. (2012). The effects of environmental regulation on the competitiveness of US manufacturing (NBER Working Paper No. 12-01). Cambridge, MA: National Bureau of Economic Research. doi: 10.3386/w18392
Hafstead, M. A. C., and Williams, R. C. (2018). Unemployment and environmental regulation in general equilibrium. J. Public Econ. 160, 50–65. doi: 10.1016/j.jpubeco.2018.01.013
Han, H. Y., Chen, Y., and Zhang, X. D. (2019). Research on the impact of emerging industries on urban economy: a case study of the impact of internet economy on housing prices in Hangzhou. Price: Theory Pract. 138–141. doi: 10.19851/j.cnki.cn11-1010/f.2019.11.033
Hoesli, M., and Oikarinen, E. (2012). Are REITs real estate? Evidence from international sector level data. J. Int. Money Finan. 31, 1823–1850. doi: 10.1016/j.jimonfin.2012.05.017
Hou, Y. X., Leng, X., Peng, L., and Zhou, Y. G. (2024). Panel quantile regression for extreme risk. J. Economet. 240:105674. doi: 10.1016/j.jeconom.2024.105674
Hu, H. Y., and Yang, L. Q. (2024). Incentive or constraint: dual environmental regulations and regional green economic development — an analysis of the mediating effects based on green technological innovation. Ecol. Econ. 40, 165–200.
Hu, S. M., Wang, L. H., and Zhao, H. (2021). Artificial intelligence application, human-machine collaboration and labor productivity. Chinese J. Popul. Sci. 48–127.
Huang, Q. H., Yu, Y. Z., and Zhang, S. L. (2019). Internet development and manufacturing productivity growth: intrinsic mechanisms and the Chinese experience. China Industr. Econ. 5–23. doi: 10.19581/j.cnki.ciejournal.2019.08.001
Ji, X. L., Xue, Q. H., and Wei, J. (2023). Environmental regulation and digital economy: Inducement and expansion factors of economic disparities between North and South China. China Population, Res. Environ. 33, 94–108.
Kahn, M. E., and Mansur, E. T. (2013). Do local energy prices and regulation affect the geographic concentration of employment? J. Public Econ. 101, 105–114. doi: 10.1016/j.jpubeco.2013.03.002
Kline, P. (2010). Place-based policies, heterogeneity, and agglomeration. Am. Econ. Rev. 100, 383–387. doi: 10.1257/aer.100.2.383
Kuai, P., Shi, Y. Q., Tao, A. P., and Wu, L. (2021). Employment effects of environmental regulation based on manufacturing and labor heterogeneity. China Environ. Sci. 41, 3934–3943.
Lee, C. L., and Liang, J. (2024). The effect of carbon regulation initiatives on corporate ESG performance in real estate sector: international evidence. J. Clean. Prod. 453:142188. doi: 10.1016/j.jclepro.2024.142188
Li, D. K., and Zhang, H. (2024). Research on the scale of local government debt in China. Res. Finan. Trade 12, 5–21. doi: 10.19795/j.cnki.cn11-1166/f.20241212.010
Li, G. Q., and Zhong, T. J. (2022). The historical evolution and social effects of China's housing system. Soc. Res. 4, 1–21.
Li, Y. L. (2019a). Does land finance inhibit corporate innovation? An analysis based on credit misallocation. Theory Pract. Finan. Econ. 40, 111–117. doi: 10.16339/j.cnki.hdxbcjb.2019.01.016
Li, Y. L. (2019b). Local government bonds, land finance and systemic financial risk. J. Finan. Econ. 45, 100–113. doi: 10.16538/j.cnki.jfe.2019.09.008
Li, Y. L. (2024). The nexus between local government debt risk, real estate sector, and financial stability. Finan. Res. Lett. 69:106075. doi: 10.1016/j.frl.2024.106075
Lin, Y. C., Lee, C. L., and Newell, G. (2022). Varying interest rate sensitivity of different property sectors: cross-country evidence from REITs. J. Proper. Invest. Finan. 40, 68–98. doi: 10.1108/JPIF-09-2020-0099
Liu, M., Shadbegian, R., and Zhang, B. (2017). Does environmental regulation affect labor demand in China? Evidence from the textile printing and dyeing industry. J. Environ. Econ. Manag. 86, 277–294. doi: 10.1016/j.jeem.2017.05.008
Luo, D. M., Li, Y., and Shi, J. C. (2012). Factor market distortion, resource misallocation and productivity. Econ. Res. J. 47, 4–14.
Ministry of Railways of the Republic of China (1934). Handbook of Chinese Railways. Hong Kong: The Commercial Press.
Nunn, N., and Qian, N. (2014). US food aid and civil conflict. Am. Econ. Rev. 104, 1630–1666. doi: 10.1257/aer.104.6.1630
Pan, F. F., Xu, J. H., and Xue, L. (2020). Voluntary environmental regulation: Research progress and future prospects. China Popul. Res. Environ. 30, 74–82. doi: 10.12062/cpre.20190822
Peng, W. B., Fan, L. Q., and Li, X. J. (2022). “Digital governance for smart city and future community building: from concept to application,” in Smart Cities for Sustainable Development. Singapore: Springer Nature Singapore 41–67. doi: 10.1007/978-981-16-7410-5_4
Peng, W. B., Xu, J. X., and He, Z. X. (2023). The impact of human capital on green economic efficiency: evidence from 280 prefectural cities in China. Environ. Sci. Pollut. Res. 30, 72415–72429. doi: 10.1007/s11356-023-27014-0
Porter, M. E., and Linde, C. (1995). Toward a new conception of the environment-competitiveness relationship. J. Econ. Perspect. 9, 97–118. doi: 10.1257/jep.9.4.97
Qi, S. Z., Lin, S., and Cui, J. B. (2018). Can environmental rights trading markets induce green innovation? Evidence from green patent data of Chinese listed companies. Econ. Res. J. 53, 129–143.
Qiao, B., and Shen, S. H. (2021). Pathways and mechanisms of environmental regulation in housing price control. East China Economic Manag. 35, 97–105. doi: 10.19629/j.cnki.34-1014/f.200412003
Quan, Y. C., and Li, Z. Q. (2020). Searching for appropriate indicators of environmental regulation intensity: from the perspective of China's pollutant discharge fee policy. Res. Environ. Econ. 56–77. doi: 10.19511/j.cnki.jee.2020.01.004
Rivera, N. M., and Loveridge, S. (2022). Coal-to-gas fuel switching and its effects on housing prices. Energy Econ. 106, 105733–105743. doi: 10.1016/j.eneco.2021.105733
Ruan, Q. S., Xie, Y. X., and Lv, D. Y. (2023). Does local government environmental attention promote corporate green innovation? Evidence from A-share listed companies. J. Environ. Econ. 3, 1–26. doi: 10.19511/j.cnki.jee.2023.03.001
Selden, T. M., and Song, D. (1994). Environmental quality and development: Is there a Kuznets curve for air pollution emissions? J. Environ. Econ. Manag. 27, 147–162. doi: 10.1006/jeem.1994.1031
Shao, S., Ge, L. M., and Zhu, J. L. (2024). How can man and nature coexist in harmony: Environmental regulation and environmental welfare performance from the perspective of geographical factors. Manag. World 40, 119–146. doi: 10.19744/j.cnki.11-1235/f.2024.0088
Shi, L. (2022). Dual objectives management of local governments and environmental pollution: an empirical study based on Chinese city data. Theory Pract. Finan. Econ. 43, 104–113. doi: 10.16339/j.cnki.hdxbcjb.2022.01.014
Song, J. (2019). Regional technological innovation, industrial structure and housing prices: An empirical test based on panel data from 30 provinces. Theory Pract. Finan. Econ. 40, 114–121. doi: 10.16339/j.cnki.hdxbcjb.2019.06.060
Sun, J. W., and Zhou, X. L. (2024). Comparison of growth driver conversion and strategic priorities for high-quality development between the Yellow River Basin and the Yangtze River Economic Belt. Res. Sci. 46, 435–449. doi: 10.18402/resci.2024.03.01
Sun, W. K. (2020). Changes in household numbers and housing demand in China. Popul. Res. 44, 160–166.
Sun, X., Song, Y., and Zhao, P. Y. (2022). How artificial intelligence affects labor income: Micro-analysis and empirical test based on individual ability. J. Shanxi Univ. Finan. Econ. 44, 17–29. doi: 10.13781/j.cnki.1007-9556.2022.08.002
Tian, K., Xing, W. B., and Huang, K. (2023). Transportation infrastructure upgrading and high-quality development of tourism economy: an empirical study based on high-speed rail opening. China J. Econ. 10, 1–25. doi: 10.26599/CJE.2023.9300408
Walker, W. (2011). Environmental regulation and labor reallocation: Evidence from the Clean Air Act. Am. Econ. Rev. 101, 442–447. doi: 10.1257/aer.101.3.442
Wang, H., and Song, L. R. (2025). Research on the impact of digital governance on local government debt: evidence from a quasi-natural experiment. Manag. Modern. 45, 77–86. doi: 10.19634/j.cnki.11-1403/c.2025.03.008
Wang, J., and Lee, C. L. (2022). The value of air quality in housing markets: a comparative study of housing sale and rental markets in China. Energy Policy 160:112601. doi: 10.1016/j.enpol.2021.112601
Wang, L. H., Hu, S. M., and Dong, Z. Q. (2020). Will artificial intelligence applications lead to labor income inequality? — Model deduction and classification evaluation. China's Indus. Econ. 97–115. doi: 10.19581/j.cnki.ciejournal.2020.04.005
Xiao, Z. L., and Zhang, H. L. (2025). Real estate market regulation and local government debt risk. Finan. Res. Lett. 80:107362. doi: 10.1016/j.frl.2025.107362
Xu, L. Y., and Zhang, C. Y. (2025). From pollution to cleanliness: on the role of environmental regulation in industrial structure upgrading. J. Nanjing Audit Univ. 22, 100–110.
Yang, M. W., Sun, B. Y., and Zhao, Z. L. (2019). Technological innovation capability, regional heterogeneity, and housing prices in China: Empirical evidence from 31 provinces. J. Chongqing Univ. 27, 102–110. doi: 10.11835/j.issn.1008-5831.jg.2019.06.006
Yin, L. H., and Wu, C. Q. (2021). Environmental regulation and ecological efficiency of pollution-intensive industries in the Yangtze River Economic Belt. China Soft Sci. 181–192.
Yu, Y. Z., Sun, P. B., and Xuan, Y. (2020). Does local government environmental target constraint affect industrial transformation and upgrading? Econ. Res. J. 55, 58–72.
Yuan, Y. J., and Xie, R. H. (2014). Research on the industrial structure adjustment effect of environmental regulation: an empirical test based on China's provincial panel data. China Industr. Econ. 57–69. doi: 10.19581/j.cnki.ciejournal.2014.08.005
Zeng, S. L., Fu, Q. Y., Haleem, F., Shen, Y., Peng, W. B., Ji, M., et al. (2024). China's carbon trading pilot policy, economic stability, and high-quality economic development. Human. Soc. Sci. Commun. 11, 1–15. doi: 10.1057/s41599-024-03646-6
Zhang, J., Hua, H., Yang, L., and Nie, Z. (2024). Impact of China's environmental protection tax on green total factor productivity: based on the perspective of digital transformation. Front. Environ. Sci. 12:1484910. doi: 10.3389/fenvs.2024.1484910
Zhang, J., and Zheng, J. J. (2023). North-south differentiation in China's development: Heterogeneous innovation incentive effects from the perspective of government intervention. Soc. Sci. Front. 45–63.
Zhang, J. P., and Chen, S. Y. (2021). Financial development, environmental regulation and economic green transformation. Econ. Res. J. 47, 78–93.
Zhang, L., and Song, Z. (2025). Digital transformation, green technology innovation and corporate value. Front. Environ. Sci. 13:1485881. doi: 10.3389/fenvs.2025.1485881
Zhang, R. Y. (2023). Environmental regulation, agglomeration of producer services, and urban housing prices: evidence from 287 Chinese cities. J. Finan. Manag. Res. 45–58.
Zhang, Y., and Liu, X. Y. (2008). Agglomeration economy and economic growth: evidence from China. J. World Econ. 60–70.
Zhang, Y. Z., Zhu, J. N., and Zhang, Y. L. (2025). Artificial intelligence development and labor mobility. Econ. Perspect. 128–145.
Keywords: environmental regulation, housing prices, property market, panel data, mediating effect
Citation: Peng W, Wu M and Xu J (2025) Does environmental regulation decline or boost housing prices? Empirical evidence from panel data of Chinese cities. Front. Sustain. Cities 7:1621967. doi: 10.3389/frsc.2025.1621967
Received: 08 May 2025; Accepted: 11 August 2025;
Published: 10 September 2025.
Edited by:
Chyi Lin Lee, University of New South Wales, AustraliaReviewed by:
Jinyu Chen, Capital University of Economics and Business, ChinaYu-Cheng Lin, University of New South Wales, Australia
Copyright © 2025 Peng, Wu and Xu. This is an open-access article distributed under the terms of the Creative Commons Attribution License (CC BY). The use, distribution or reproduction in other forums is permitted, provided the original author(s) and the copyright owner(s) are credited and that the original publication in this journal is cited, in accordance with accepted academic practice. No use, distribution or reproduction is permitted which does not comply with these terms.
*Correspondence: Manman Wu, d3VtYW5tYW5Ac3R1Lmh6bnUuZWR1LmNu