 Jonathan M. Berlingeri
 Joseph R. Lawrence2†
 Quirine M. Ketterings
- 1Nutrient Management Spear Program, Department of Animal Science, Cornell University, Ithaca, NY, United States
- 2PRO-DAIRY, Department of Animal Science, Cornell University, Ithaca, NY, United States
A field nutrient balance (supplied minus harvested) can be an effective, end-of-season management evaluation tool. However, development of guidance for balance-based management requires knowledge of variability in balance inputs. To contribute to development of such guidelines, we evaluated the impact of corn silage hybrid selection, nutrient management, and growing conditions on field nitrogen (N) balances and documented variability in N and phosphorus (P) balances at the whole-farm, field, within-field levels. Variability in N removal among hybrids was evaluated using hybrid trials (5 locations, 4 years each). Variability in farm and field balances (4 farms, 2 years each) and within-field balances (2 farms, 2 years each) was assessed as well. Nitrogen supply comprised soil N (soil type-specific book values), rotation N, past manure N, and current year N (fertilizer and/or manure). Total N balances included all current year manure N while available N balances considered only plant-available N from manure. Phosphorus balances were derived as total P applied minus P harvested. Yield explained 81% of the variability in N uptake across hybrids. Nitrogen uptake intensity (NUI; N uptake per unit of yield) varied across locations and years, averaging 4.3 ± 0.1 kg N/Mg for short-season hybrids [≤95 days-to-maturity (DTM)] vs. 4.1 ± 0.1 kg N Mg−1 for longer-season hybrids. Whole-farm N balances ranged from 139 to 251 kg N ha−1 for total N and 43 to 106 kg N ha−1 for available N. Phosphorus balances ranged from 28 to 154 kg P ha−1. Balances per field ranged from −8 to 453, −66 to 250 kg N ha−1, and −30 to 315 kg P ha−1 for total N, available N, and total P, respectively, while within-field balances showed even larger ranges. We conclude that (1) variability in corn silage N and P balances at field and within-field scales and across year is large, emphasizing the need for field and within-field (where feasible) evaluation tools and management options, and (2) feasible limits for N balances should include both total and available N.
Introduction
Nitrogen (N) and phosphorus (P) are essential nutrients for plant growth and crop production, but if applied in excess of crop needs both nutrients can result in negative environment consequences. According to Sobota et al. (2015), annual environmental damages from N pollution exceed $289 billion in the U.S., of which about half is attributable to the manufacture and use of N-based fertilizers. Annual eutrophication damages from anthropogenic N and P have been conservatively estimated to exceed $4.3 billion in the U.S. alone (Dodds et al., 2009). Increased occurrence of nutrient hotspots in sensitive watersheds have led to a shifting perspective of the value vs. cost of manure, resulting in governmental intervention and stricter regulation nationwide (Kleinman et al., 2015). At the same time, mineral phosphate rock reserves are on course to be completely depleted by 2050 with continued mining at current extraction rates (Walan et al., 2014). These statistics point to the importance and urgency of efficiently managing both N and P, to meet but not exceed crop nutrient needs.
Corn (Zea mays, L.) is a major crop in New York (NY), with about 425,000 ha planted annually (USDA, 2020). Much of the fertilizer and manure applied to cropland in NY, is applied to corn fields. While P fertilizer use for agricultural production in NY has decreased drastically over the past decades (Ketterings et al., 2011, 2017; Ketterings, 2014; Cela et al., 2017), and manure has increasingly replaced the need for fertilizer N in corn (Ketterings et al., 2013c), the humid and often unpredictable climate in the northeastern U.S. continues to create challenges for the management of both nutrients.
Concentrated animal feeding operations (CAFOs) that are regulated by the state are required to have a comprehensive nutrient management plan (CNMP) in which for each field on the farm, the anticipated nutrient application rates are listed (manure and/or fertilizer), according to land-grant university (i.e., Cornell University) guidelines for fertility management of field crops (NYSDEC, 2017). At Cornell University, the Nutrient Management Spear Program (NMSP) is responsible for the development of fertility guidelines. For P management, soil test results are the basis for management guidance (Ketterings et al., 2003a), with higher application rates governed by the NY Phosphorus Index (Czymmek et al., 2020). For N, guidelines for corn crops are derived from estimates of yield potential, soil N mineralization, and fertilizer uptake efficiency (all soil type specific), as well as crop rotation and past manure credits (Ketterings et al., 2003b). Book values for these inputs are available for each of the almost 600 soil types in the state and are often used in part to derive N fertility prescriptions. However, if three years of corn yield data are collected for a specific field, regulated farms can override the yield potential book value for that specific soil type and use their own data instead (NMSP, 2018).
Although useful in situations where baselines are unknown, the use of book values can lead to under- or over-estimation of yield in any given year and any location, reflecting that yields can vary greatly from year to year, farm to farm, field to field and within-field (Kharel et al., 2019). To allow for experimentation with N management on farms and to better understand and improve upon N management over time, a multi-agency partnership in NY consisting of Cornell University faculty and staff and staff from National Resources Conservation Service (NRCS), New York State Department of Environmental Conservation (NYSDEC) and NYS Department of Agriculture and Markets (NYSAGM) introduced an adaptive management policy for regulated farms in 2013 (Ketterings et al., 2013a,b) with an expansion of evaluation options in 2018 (NMSP, 2018). This approach was modeled after the federal adaptive management guidelines first released by NRCS in 2011 (NRCS, 2011) and updated in 2013 (NRCS, 2013). The 2018 adaptive management policy for NY allows farmers to apply N (manure and/or fertilizer) above Cornell University NMSP guidelines, even without any past yield records. However, if this field-specific option is used the farmer is responsible for measuring yield annually moving forward and for conducting an evaluation to determine if the higher N rate resulted in a benefit (NMSP, 2018). The evaluation tools include the corn stalk nitrate test (CSNT), implementation of a control strip followed by evaluation of yield difference, and for crops other than corn, determination of a field N balance (NMSP, 2018). Adaptive management seeks to address the diverse needs of farms throughout the state with flexibility in management options and combines productivity and environmental goals in the requirement to evaluate if the change in management (typically a higher N rate) improved yield and/or nutrient use efficiency.
Research efforts investigating the ability of field balances to monitor efficiency and predict field nutrient requirements have added credence to balance-based nutrient management methodologies. Blicher-Mathiesen et al. (2014) showed that N field balances are an effective tool for monitoring N loses; up to 60% of variation in N leaching was explained with field N balance. Nitrogen and P field balances have also shown promise in evaluating efficiency of input distributions in a within-farm context and facilitating better management decisions at the field level (Buresh et al., 2010; McDonald et al., 2019; Van Leeuwen et al., 2019). Currently, field balance assessment for corn is not a tool included in the adaptive nitrogen management policy outlined in NMSP (2018). Yet, once feasible/acceptable balances are established for corn, such an option could be added as an end-of-season evaluation tool.
Nitrogen balances can be defined in various ways. In its simplest form, an N balance is determined as the difference between N added with fertilizer and N removed with harvest (N supply–N uptake at harvest). This difference (if positive) is subject to loss to the environment and, once known, can be used as a rationale to adjust management to lower the N balance of a field or area within a field. The Environmental Defense Funds (EDF) has promoted use of the N balance concept as it requires little field-level data, allows farmers to define management alternatives that include not just a rate adjustment but also changes in method, timing, and source, and allows for comparison of fields and for tracking of improvements over time (McLellan et al., 2018).
The N balance concept is an effective way to rank fields within a farm and therefore a means to identify fields where N management could be evaluated in more detail, as options for improvement may exist. This applies to fields with negative balances where more N is removed with harvest than supplied and yield and/or quality could be impacted, as well as to fields where N balances are excessive, and rate adjustments may be feasible without impacting yield or quality. However, simply comparing N applied as fertilizer and N removed with harvest ignores other potentially substantial contributions from prior crops (rotation credits), soil organic matter mineralization, past manure applications as well as current year applications. In addition, when corn crops are harvested for grain, this approach ignores that additional N is indeed needed for the entire corn plant, even if only a portion of the N is removed with harvest.
Before N balance guidelines can be developed to extend the adaptive management option to corn grown for silage on animal operations where manure is a common nutrient source, research is needed to (1) determine degree of variability in N uptake by corn as impacted by hybrid selection, (2) evaluate total N vs. available N from manure when deriving N balances, and (3) determine variability in both N and P balances from farm to farm, year to year, field to field, and at the within-field level.
Materials and Methods
Study 1: Corn Silage Hybrid-Induced Variability in N Uptake
Locations and Experimental Design
Corn silage hybrid evaluation trials were conducted at the Musgrave Research Farm, Aurora, NY (central NY), farms in Albion (western NY), Madrid and Willsboro NY (northern NY), and at the Borderview Research Farm, Alburgh, VT each year from 2017 through 2020.
For all but 8 site years (Table 1; data missing for Madrid, Willsboro, and Albion in 2017 and 2018), soil samples were collected (0–20 cm depth) prior to fertilizer and/or manure application at a sampling density of 15 soil cores per plot. These cores were analyzed for pH and soil fertility parameters at the Analytical Laboratory and Maine Soil Testing Service, Orono, Maine or the Cornell Nutrient Analytical Laboratory, Ithaca, NY. At both laboratories, soil pH was measured using a 1:1 (w/v) water extract. Soil organic matter (SOM) was determined through loss-on-ignition analysis, exposure at 500°C for 2 h (Storer, 1984). The Cornell Morgan soil test was used to extract P, K, Mn, and Zn by shaking dried samples in a 1:5 (v/v) ratio for 15 min in Morgan solution (1 M sodium acetate buffered at pH 4.8; Morgan, 1941). Extracts were filtered with Whatman No. 2 equivalent filter paper according to procedures outlined in NEC-1312 (2011). Filtered extracts were analyzed for K, Mn and Zn using inductively coupled plasma atomic emission spectrometry (ICP-AES, JY70 Type II, Jobin Yvon, Edison, NJ). Phosphorus was determined colorimetrically using the ammonium molybdate-ascorbic acid method (Knudsen and Beegle, 1988) with a Lachat QuikChem® 8000 flow injection analyzer (Lachat Instruments, Milwaukee, WI). Results of these analyses (Table 1) showed that pH ranged from 5.7 to 7.8 across trial locations with organic matter levels ranging from 2.0 to 6.6 %. To address low P and K levels at some of the sites, per standard protocol for variety trial research, trials with below optimum levels were planted with a starter fertilizer to ensure sufficient P and K. Thus, soil fertility was not anticipated to be yield limiting at any of the five trial locations.
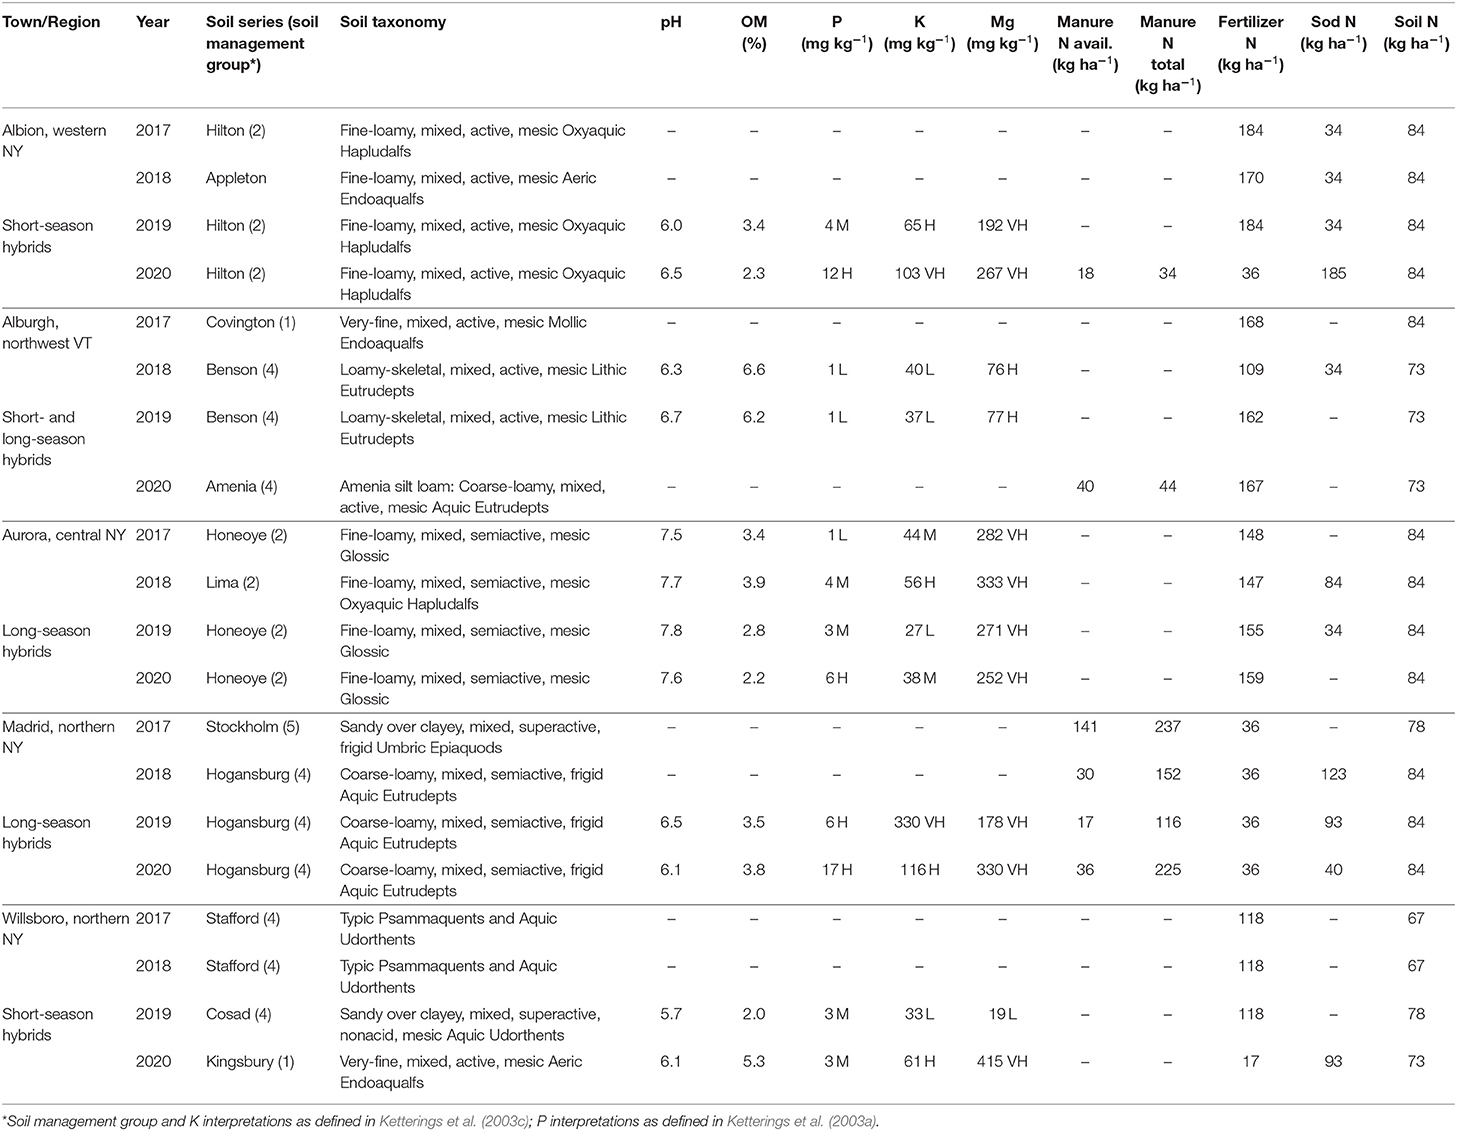
Table 1. Description of each trial location region, soil type, nitrogen fertility management, soil fertility testing, and relative maturity panels present at each trial location.
In most trials corn silage followed other crops in the rotation. The exceptions were the 2017 and 2020 trials in Alburgh, VT, and the trial in Madrid in 2020, which were second year corn silage trials, and the trial in Madrid in 2018 which had been in corn for more than 3 years. Management varied at each site, representing a range in nutrient management approaches (Table 1) as fertility management was at the discretion of the farm managers.
Hybrids entered (open invitation) were organized into two relative maturity (RM) panels: short-season hybrids (≤95 days-to-maturity [DTM]) and long-season hybrids (≥96 DTM). The total number hybrid entries and the size of each panel varied from year to year with total entries ranging from 69 to 90 each year of which 20–38 were short-season hybrids and 47–57 were long-season hybrids. Each RM panel was planted at three trial locations in thrice-replicated (9 plots per hybrid entry) randomized complete block designs. Madrid and Aurora were planted with long-season panels, Albion and Willsboro were planted with short-season panels, and the Alburgh location included both panels. All plots were 4 rows wide (0.75 m row spacing) planted at a target population density of 84,000 plants ha−1.
Harvest and Silage Composition Analysis
Harvest was initiated once whole plant dry matter reached 35 ± 3 g kg−1 using a target cutting height of 15–20 cm. Yield was determined for the inner two rows of each 4-row plot using two-row harvesters. Trials at Albion, Aurora, and Madrid were harvested with a John Deere forage chopper equipped with a Kemper rotary head and Wintersteiger Weighmaster system with sample mixing capabilities. The Willsboro site was harvested with a John Deere 3975 pull-type forage harvester outfitted with a custom built 20A Plot Harvest Sampler (RCI Engineering, Mayville, WI) and plot yields were determined on platform scales using an on-board RCI software computer interface. The trials at Alburgh were harvested with a John-Deere 2-row chopper which fed directly into a wagon equipped with an Avery Weigh-Tronix weighing system. For each plot, a ~0.5 kg forage sample was collected and submitted to Cumberland Valley Analytical Laboratory for determination of N content, using a Leco FP-528 Nitrogen Combustion Analyzer (LECO Corporation, St. Joseph, MI).
Statistical Analysis
Statistical analyses were completed using R studio (R version 3.6.2). Nitrogen uptake was calculated using plot-level yield and N content data while nitrogen uptake intensity (NUI) was defined as the N uptake per unit of yield:
The “lme4” package was used to fit five linear mixed-effects models (M1–M5) to evaluate the influence of relative maturity (RM), location, year, hybrid, and replicate on NUI:
The “lsmeans” package was used to calculate the least squared or marginal means and confidence intervals of both RM panels within each model framework. Model 5 incorporated all sources of variability to determine confidence intervals for each RM panel.
Study 2: Whole-Farm, Field-Level, and Within-Field N and P Balances
Locations, Fertility Management and Agronomic Data
Harvest, soil, and crop management data were collected for all corn fields of four dairy farms in northern New York. For three of the farms, the 2019 and 2020 growing seasons were included while for one farm, data from 2018 and 2019 had to be used because of equipment failure during harvest in 2020. In total 175 fields were included. Soil type and field management data for each of the fields on the farms were obtained from CropwareNET (Farm Information Technologies, Peru, NY), a cloud-based version of Cropware, a nutrient management planning software that incorporates NMSP fertility guidelines (Ketterings et al., 2006). For each field, N supply from soil organic matter, prior year crops (crop rotation credits) and past manure applications was derived according to Ketterings et al. (2003b). Fertilizer N equated total fertilizer N applied for the growing season. Current year manure N supply was determined assuming (1) no N loss (total N); and (2) N credits as impacted by method and timing of application (available N; Ketterings et al., 2003b). Thus, two N balances were determined, a total N balance and an available N balance.
Yield Monitor Data and Post-Harvest Processing
Corn silage yield monitor data were collected for all 175 fields. Recognizing that yield monitor data contain inherent systemic and random errors (Dobermann and Ping, 2004; Vega et al., 2019), data were cleaned using a standardized, semi-automated, post-harvest yield monitor data cleaning protocol (Kharel et al., 2018). Raw data were transferred into Ag Leader's Spatial Management Systems software and exported as Advanced format text files as outlined in Griffin et al. (2007). Data cleaning was completed using Yield Editor 2.07 (Sudduth and Drummond, 2007).
Field-Based Nutrient Balances
Field N and P balances were derived as the difference between nutrient supply and uptake. For P balances, an average P content of 2.3 g kg−1 P was used based on averages reported in the Dairy One interactive feed composition library (Dairy One, 2021). Results of study 1, marginal means of RM classes, were applied to determine N uptake for each of the fields.
where the total N balance includes the total N applied with manure. The available N balance takes into account only the portion of the current year manure application that will be crop available according to Ketterings et al. (2003b). The soil N and sod N supply estimates were derived from Ketterings et al. (2003b) as well. Phosphorus balances include P removed with harvest and P supplied with fertilizer and/or manure only.
Within-Field Nutrient Balances
Cleaned yield monitor data points were kriged using the matern-isotropic covariance function to generate smooth raster yield maps at a 2 × 2 m resolution (Cho et al., 2021). Nitrogen balance maps were developed by subtracting N uptake, derived from yield and N content as determined in Study 1, from N supply values derived from CropwareNET field reports for each raster cell.
Results and Discussion
Study 1: Corn Silage Hybrid-Induced Variability in N Uptake
Yield alone explained 81% of the variability in N uptake across years and locations (Figure 1). Nitrogen uptake varied greatly from trial to trial and year to year. The Willsboro trial consistently yielded well below the average yield for all locations while the Madrid location was higher yielding than the average. Nitrogen uptake intensity at the Aurora location was notably different from other locations with similar or greater yields but lower NUI. Excessive rainfall during the first half of the 2017 growing season at this location may have encouraged N leaching resulting in visual symptoms of chlorosis in lower leaves. As yields increased, variation in N uptake also increased across locations and years, most likely reflecting variation in total N supply across sites and years.
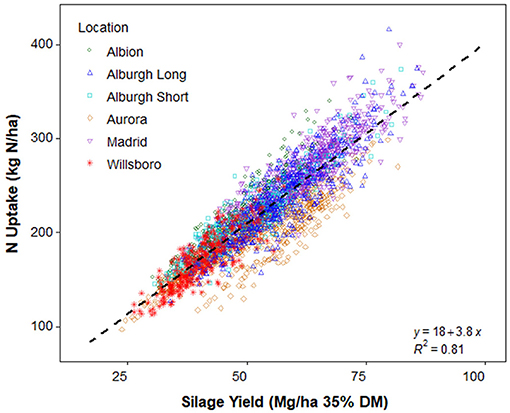
Figure 1. Relationship between silage corn yield and nitrogen (N) uptake analyzed in 2017-2020 at five field trial locations. Each point represents measurements from an individual plot (one replicate of a specific hybrid). Long refers to relative maturity class (≤95 days to maturity = short; >96 days to maturity = long).
The mixed effect model comparisons showed that variation in NUI was predominantly due to location and year differences (Figure 2). The influence of hybrid genetics (individual hybrid selection) was minimal. However, significant differences were determined when hybrids were evaluated by RM; long-season hybrids had a mean NUI of 4.1 ± 0.3 kg N Mg−1 yield at 35% DM vs. short-season hybrids with a mean NUI of 4.3 ± 0.3 kg N Mg−1 suggesting that RM selection impacted NUI. These findings suggest that ~5% less N may be required to achieve the same yields for a long-season hybrid as opposed to a short-season hybrid. These findings also indicate that knowledge of the RM of a hybrid may be used to increase prediction accuracy of N uptake from yield, where yield is the only parameter measured. Nitrogen uptake estimates will be more accurate when actual crop N content is determined at the field level. Currently this is not feasible for most farms due to the cost and time involved in sampling truck loads from specific fields, although it may become more feasible with improvements in and implementation of constituent sensing on yield monitors. While the deriving of field N balances and setting of feasible field balances should recognize the variability induced by RM during hybrid selection, results here show that knowledge of the hybrid beyond RM class is not needed when using N balance assessment as an end-of-season evaluation tool nor when setting feasible balances.
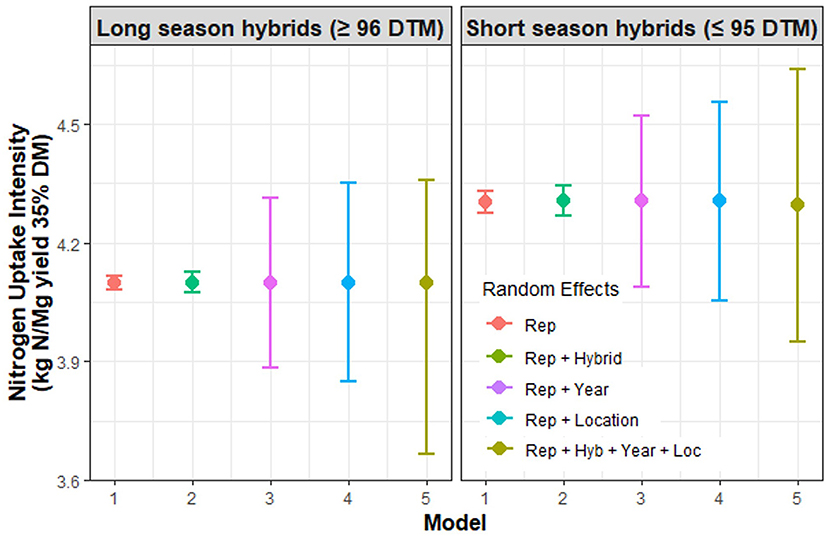
Figure 2. Four linear mixed effect models were fitted to compare the influences of silage hybrid selection (“hybrid”), farm management strategies (“location”), and growing season (“year”) on nitrogen uptake intensity (N uptake per unit of yield). Models were evaluated on data clustered by relative maturity classification (short- vs. long-season hybrids).
Study 2: Whole-Farm, Field-Level, and Within-Field N and P Balances
Whole-Farm Variability
Whole-farm N and P uptake ranged from 109 to 225 kg N ha−1 and from 20 to 45 kg P ha−1 with area weighted means of 177 ± 38 kg N ha−1 and 37 ± 10 kg P ha−1, respectively (Table 2). Whole-farm available and total N supply ranged from 215 to 249 and from 305 to 422 kg N ha−1 with a mean of 232 ± 27 and 355 ± 62 kg N ha−1, respectively. Whole-farm total P supply ranged from 65-174 kg P ha−1 with an area weighted mean of 92 ± 48 kg P ha−1. Combining uptake and supply, corn cropland N balances (whole-farm level) ranged from 19 to 106 kg N ha−1 for available N and from 139 to 251 kg N ha−1 for total N, with means of 54 ± 50 and 178 ± 71 kg N ha−1, respectively. Whole-farm total P balances ranged from 28 to 153 kg P ha−1 with area weighted mean 59 ± 50 kg P ha−1.
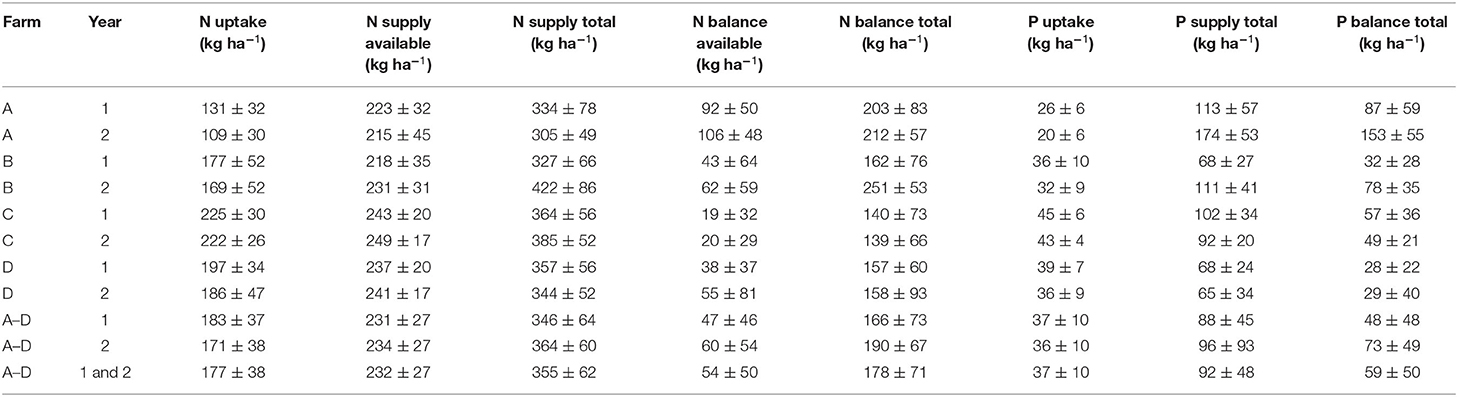
Table 2. Area weighted whole-farm mean and standard deviation of nitrogen (N) and phosphorus (P) supply and uptake and nitrogen and phosphorus balances for corn.
The great variability in available N balances when compared to total N and P balances across locations and year was largely affected by fertilizer management and decisions about manure management, particularly application method and timing. When manure is surface applied without incorporation to capture inorganic N or if applied in the fall, available N from manure is considerably lower than if manure is incorporated closer in time to crop uptake of nutrients (Ketterings et al., 2003b).
Variability in N and P balances among locations reflected the impact of farm-specific field management decisions in any given year. Farm A had the lowest yields and, for all but one year, the highest N and P balances (Table 2). For Farm C, high yields (and hence N and P uptake) were coupled with slightly above average total N and P supply resulting in the lowest N balances of the four study farms combined with slightly below average P balances. This also implies that opportunities for improvement of field balances is farm specific.
Yield limiting factors outside of N and P fertility, such as drought and pest pressures, can greatly impact yield. Reduced yield can lead to high balances even if N and P supply were targeted correctly. Thus, information gained from whole-farm N and P balances is only actionable within the framework of the farm itself. While whole-farm cropland balances can help evaluate overall farm field fertility management, field and within-field balances will be more useful in determining where changes in field management should be considered.
Field Variability
Individual field N uptake ranged from 48 to 257 kg N ha−1 with a mean of 169 ± 48 kg N ha−1 (Figure 3), showing large field-to-field differences, consistent with yield variability typically observed for New York corn fields (Kharel et al., 2019). Available and total N supply per field ranged from 124 to 359 and from 150 to 512 kg N ha−1, averaging 211 ± 34 and 317 ± 64 kg N ha−1, respectively. Field P uptake and supply ranged from 9 to 49 and 13 to 298 kg P ha−1 with means of 33 ± 9 and 82 ± 43 kg P ha−1, respectively. Variation in field level total N supply within a farm exceeded variation in available N supply reflecting that some manure management strategies such as surface application without incorporation of manure result in greater N losses than other manure management approaches (Ketterings et al., 2003b).
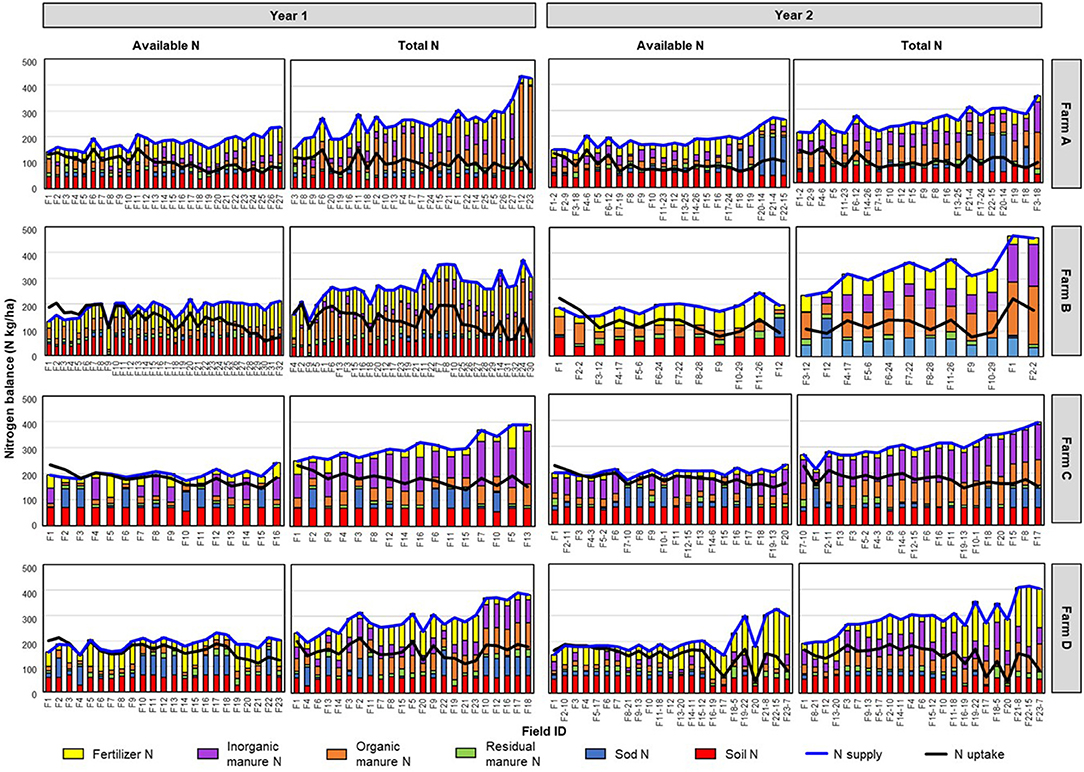
Figure 3. Total and available nitrogen (N) balance are shown as a difference between nitrogen (N) demand and N supply with details of supply contributors for all corn silage fields of four farms in northern New York (A-D) for 2 years.
Reflecting variability in N and P uptake and supply, variability in field balances for both total and available N and for P was large, with each site year showing large ranges as well (Figure 3). Across farms and years, field available and total N balances ranged from −59 to 234 kg N ha−1 and from −7 to 404 kg N ha−1 with means of 148 ± 74 and 42 ± 55 kg N ha−1, respectively. Variation in available N field balance was predominately controlled by uptake while variability in total N balance was better explained by N supply. Total P balances ranged from −27 to 281 kg P ha−1 with a mean of 53 ± 45 (results not shown), mostly explained by differences in P supply per field. While total and available N balances varied almost completely independently due to variability in manure management decisions, total and N and P balances were directly correlated across site years (Figure 4). Available and total N balances diverged when ranked by P balance reflecting that inefficient use of N from manure typically is accompanied by excess P (Figure 5).
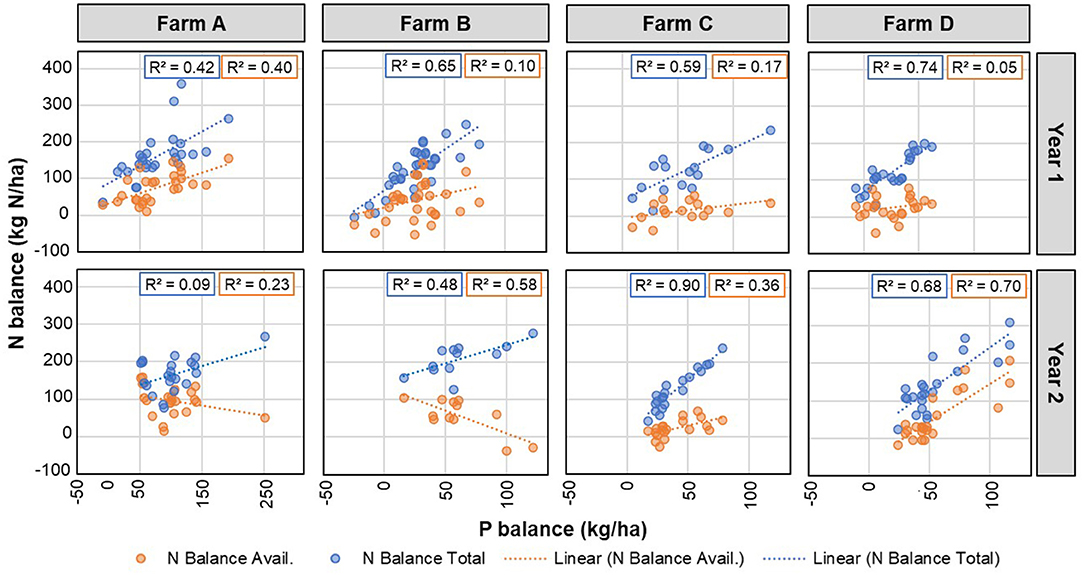
Figure 4. Nitrogen (N) vs. phosphorus (P) balances for corn fields of four farms in northern New York (A-D) for 2 years.
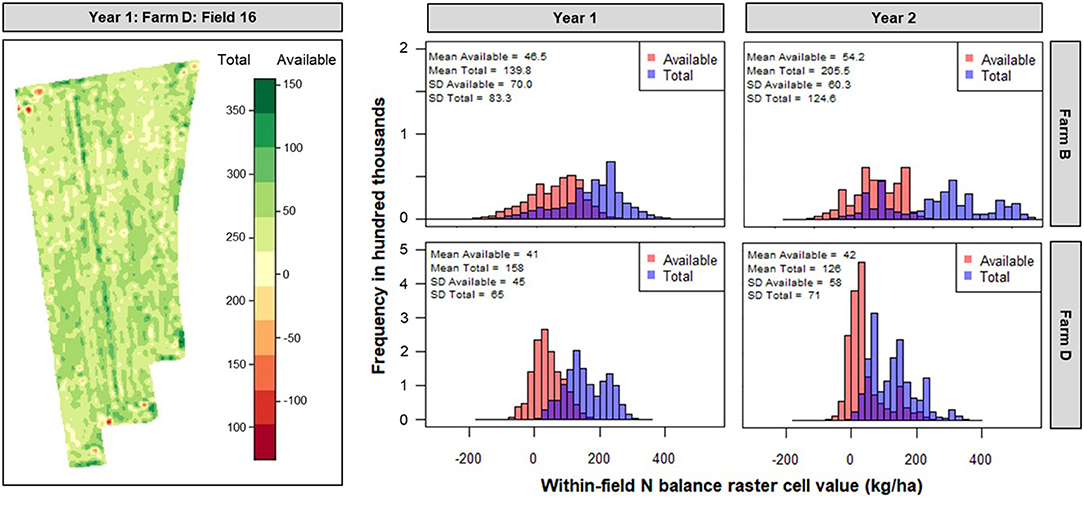
Figure 5. Within-field nitrogen (N) balance map (single field example) and histograms for all within-field available and total N balances for study farms B and D for 2 years.
Field balance findings suggest that in addition to a P balance, both available N and total N balances should be derived for most appropriate decision making about field allocation of nutrient sources. When field balances are derived, a ranking of balances per farm and by year from negative to greatly positive allows of identification of (1) fields that may show a crop yield benefit from N and/or P addition vs. those where N and P fertilizer and/or manure use can be reduced without impacting crop yield, (2) identification of fields where manure is used inefficiently (large differences between total and available N balance), and (3) setting of feasibility ranges for farms and across farms as part of an improved adaptive management process (NMSP, 2018).
It should be recognized that extreme field balances can reflect anomalies caused by pest pressures or generally poor growing conditions in a given field or year. Thus, field balances should ideally be evaluated on a yearly basis for all corn fields on a farm (field-to-field comparisons) with consideration of unfavorable environmental factors to better understand drivers for yield and adjust management accordingly.
Fields differed greatly within each farm, illustrating that identical management of all the fields on a farm is not appropriate and field-specific management will lead to better nutrient use efficiency. The rise of new technologies, such as yield monitor systems with constituent sensors and variability rate application technology, allows for targeted field and even within-field management. These technologies support field-based nutrient management assessment approaches currently employed in adaptive management nationwide (NRCS, 2013). They also enable the inclusion of N balance to determine and track environmental performance of food production (McLellan et al., 2018). Findings here indicate the value of ranking fields based on balances for identification of areas (fields) for improved management with possible further improvements when within-field balances are derived.
Within-Field Variability
Evaluation of within-field N and P balances showed large ranges as well (Figure 5). As an example, in year 1, the within-field available and total N balances for Farm B ranged from −580 to 199 and −519 to 383 kg N ha−1, averaging 47 ± 70 and 140 ± 83 kg N ha−1, respectively. In year 2, the within-field available and total N balance ranged from −175 to 237 and −113 to 480 kg N ha−1 averaging 54 ± 60 and 206 ± 125 kg N ha−1, respectively. Similarly, in year 1 farm D within-field available and total N balance ranged from −146 to 179 and −90 to 321 kg N ha−1 with means 36 ± 40 and 141 ± 58 kg N ha−1, respectively while in year 2, the balances ranged from −157 to 252 and −101 to 387 kg N ha−1 with an average of 37 ± 52 and 113 ± 63 kg N ha−1, respectively.
The within-field ranges were as large or greater than field-to-field ranges, implying opportunities for variable rate application technologies and zone-based management to further enhance nutrient management on dairy farms. Development of balance maps (Figure 5) that show regions or zones within fields with higher balances vs. areas with lower or even negative balances can help with targeted soil sampling to identify barriers for yield, and zone-specific assessment of management changes for fertilizer and manure use but also for seed density and pest management evaluations. McLellan et al. (2018) stated a simple field- and farm-level indicator of N loss, responsive to changes in farm management practices, was anticipated to be more credible and more useful to an individual farmer than use of models or environmental monitoring. The results of the within-field assessments show that this concept could be expanded to within-field assessment, in recognition of the oftentimes large variability in yield (Kharel et al., 2019).
Limitations and Future Work
In the study here, our focus was on evaluation of balance approaches for N and P for corn harvested for silage. Accuracy of yield data is essential for development of field balances, while yield monitor systems are needed to determine within-field balances. Currently, such technology is not available to all farms, typically limiting yield assessment to those who own yield monitor systems or work with custom operators who have implemented this technology.
The results of our assessments clearly illustrate the need to derive both total N and available N balances for fields that receive manure. Results also show that for N balances inclusion of just fertilizer and manure N (i.e., without recognition of N pools already in the soil) is insufficient and can lead to overapplication of either or both N sources. In our study, estimates for soil N mineralization and crop rotation N credits, as well as estimated of N available from manure are derived from book values documented in Ketterings et al. (2003b). It should be recognized that not all land-grant universities have developed book values for soil N supply and that actual soil N supply and manure N credits can vary depending on growing conditions.
While the approach featured here recognizes the reduced N supply with manure when applied to the surface without incorporation or when applied in the fall (available N balance), research is needed to improve upon such estimates for individual farms and fields. Work is currently ongoing to expand the number of farms with whole-farm, field specific and within-field N and P balances so that feasible limits can be determined and included in the adaptive management policy of NY.
Conclusions
Yield explained 81% of the variability in N uptake across hybrids, However, knowledge of relative maturity group of a hybrid can be used for more accurate estimation of crop N uptake and removal with corn silage harvest where hybrid specific crop N content data are not available. Nitrogen uptake intensity averaged 4.3 ± 0.1 kg N Mg−1 for short-season hybrids (≤95 DTM) vs. 4.1 ± 0.1 kg N Mg−1 for longer-season hybrids. For most accurate balance assessment, N supply should include estimates of soil N supply, crop rotation credits, and past manure applications. For P, balances could include fertilizer and P applied with manure. For N, two balances should be derived, one assuming no N loss from manure, and one where N loss is included. A comparison of balances at the whole farm level, the field level, and within-field level can reveal where (1) yield was compromised; (2) reduction in fertilizer use and possibly manure use can be considered for improved balances without impacting yield; and (3) where manure use is inefficient (large difference between total N and available N balances). We conclude that variability in corn silage N and P balances at field and within-field scales is large, showing the need for field and within-field evaluation tools and management options. We also conclude that establishment of feasible balance limits for adaptive management should include both total and available N and P. Future work will focus on evaluating field and within-field balances in combination with rate studies to identify and set feasible balances for N and P.
Data Availability Statement
The original contributions presented in the study are included in the article/supplementary material, further inquiries can be directed to the corresponding author/s.
Author Contributions
JB managed the statistical analysis and visualization, literature review, and drafting and editing. SS contributed to visualization and editing. JL was responsible for field operations and collection of variety trial data. KC contributed to editing. QK facilitated and organized the project team and contributed directly to writing, editing, and overall structuring of the research and paper. All authors contributed to the article and approved the submitted version.
Funding
This research was supported with grants from the Northern New York Agricultural Development Program (NNYADP) and the New York Corn Growers Association (NYCGA), administered through the New York Farm Viability Institute (NYFVI). This work was also supported by the National Institute of Food and Agriculture, U.S. Department of Agriculture Hatch and McIntire Stennis grants.
Conflict of Interest
The authors declare that the research was conducted in the absence of any commercial or financial relationships that could be construed as a potential conflict of interest.
Publisher's Note
All claims expressed in this article are solely those of the authors and do not necessarily represent those of their affiliated organizations, or those of the publisher, the editors and the reviewers. Any product that may be evaluated in this article, or claim that may be made by its manufacturer, is not guaranteed or endorsed by the publisher.
Acknowledgments
We are thankful to Francoise Vermeylen and Erica Mudrak of Cornell Statistical Consulting Unit (CSCU) for their assistance with statistical analyses for this research, and to Benjamin Lehman, Stephen Robertshaw, and Aminah Taariq-Sidibe for data preparation.
References
Blicher-Mathiesen, G., Andersen, H. E., and Larsen, S. E. (2014). Nitrogen field balances and suction cup-measured N leaching in Danish catchments. Agric. Ecosyst. Environ. 198, 36–43. doi: 10.1016/j.agee.2014.06.033
Buresh, R. J., Pampolino, M. F., and Witt, C. (2010). Field-specific potassium and phosphorus balances and fertilizer requirements for irrigated rice-based cropping systems. Plant Soil 335, 35–64. doi: 10.1007/s11104-010-0441-z
Cela, S., Ketterings, Q. M., Soberon, M., Rasmussen, C., and Czymmek, K. J. (2017). Upper Susquehanna watershed and New York State improvements in nitrogen and phosphorus mass balances of dairy farms. J. Soil Water Conserv. 27, 1–11. doi: 10.2489/jswc.72.1.1
Cho, J. B., Guinness, J., Kharel, T. P., Sunoj, S., Kharel, D., Oware, E. K., et al. (2021). Spatial estimation methods for mapping corn silage and grain yield monitor data. Precis. Agric. 2021, 1–20. doi: 10.1007/s11119-021-09793-z
Czymmek, K. J., Ketterings, Q. M., Ros, M., Battaglia, M., Cela, S., Crittenden, S., et al. (2020). The New York Phosphorus Index 2.0. Available online at: https://blogs.cornell.edu/whatscroppingup/2020/01/03/new-york-phosphorus-index-2-0/ (accessed July 17, 2021).
Dairy One (2021). Interactive Feed Composition Libraries. Dairy One Cooperative, Inc. Available online at: https://dairyone.com/services/forage-laboratory-services/feed-composition-library/interactive-feed-composition-libraries/ (accessed July 17, 2021).
Dobermann, A., and Ping, J. (2004). Geostatistical integration of yield monitor data and remote sensing improves yield maps. Agron. J. 96, 285–297. doi: 10.2134/agronj2004.0285
Dodds, W. K., Bouska, W. W., Eitzmann, J. L., Pilger, T. J., Pitts, K. L., Riley, A. J., et al. (2009). Eutrophication of U.S. freshwaters: analysis of potential economic damages. Environ. Sci. Technol. 43:1. doi: 10.1021/es801217q
Griffin, T. W., Brown, J. P., and Lowenberg-DeBoer, J. (2007). Yield monitor data analysis protocol: a primer in the management and analysis of precision agriculture data. Available online at: https://www.agriculture.purdue.edu/SSMC/publications/YieldDataAnalysis2007.pdf (accessed July 23, 2021).
Ketterings, Q. M. (2014). Extension and knowledge transfer; adaptive management approaches for timely impact. J. Agric. Sci. 152, 57–64. doi: 10.1017/S002185961300066X
Ketterings, Q. M., Albrecht, G. L., Rasmussen, C. N., and Czymmek, K. J. (2006). Cornell Cropware: decision support tool for fertilizer and manure nutrient management planning. J. Nat. Resourc. Life Sci. Educ. 35, 140–151. doi: 10.2134/jnrlse2006.0140
Ketterings, Q. M., Cela, S., Collick, A. S., Crittenden, S. J., and Czymmek, K. J. (2017). Restructuring the P Index to better address P management in New York. J. Environ. Qual. 46, 1372–1379. doi: 10.2134/jeq2016.05.0185
Ketterings, Q. M., Czymmek, K. J., Albrecht, G. L., Gates, D., and Lendrum, J. (2013a). Nitrogen for Corn; Management Options. Agronomy Fact Sheet #77. Available online at: http://nmsp.cals.cornell.edu/publications/factsheets/factsheet77.pdf (accessed May 13, 2021).
Ketterings, Q. M., Czymmek, K. J., Albrecht, G. L., Gates, D., and Lendrum, J. (2013b). Adaptive Management for Nitrogen for Corn. Agronomy Fact Sheet #78. Available online at: http://nmsp.cals.cornell.edu/publications/factsheets/factsheet78.pdf (accessed May 13, 2021).
Ketterings, Q. M., Czymmek, K. J., and Klausner, S. D. (2003a). Phosphorus Guidelines for Field Crops in New York. CSS Extension Series E03-15. Ithaca, NY: Cornell University, Department of Crop and Soil Sciences. Available online at: http://nmsp.cals.cornell.edu/publications/extension/Pdoc2003.pdf [Accessed May 13, 2021].
Ketterings, Q. M., Czymmek, K. J., and Swink, S. N. (2011). Evaluation methods for a combined research and extension program used to address starter phosphorus fertilizer use for corn in New York. Can. J. Soil Sci. 91, 467–477. doi: 10.4141/cjss10001
Ketterings, Q. M., Godwin, G. S., Swink, S. N., and Czymmek, K. J. (2013c). Can manure replace the need for starter nitrogen fertilizer? Agron. J. 105, 1597–1605. doi: 10.2134/agronj2013.0203
Ketterings, Q. M., Klausner, S. D., and Czymmek, K. J. (2003b). Nitrogen Guidelines for Field Crops in New York. CSS Extension Series E03-16. Ithaca NY: Cornell University, Department of Crop and Soil Sciences. Available online at: http://nmsp.cals.cornell.edu/publications/extension/Ndoc2003.pdf (accessed May 13, 2021).
Ketterings, Q. M., Klausner, S. D., and Czymmek, K. J. (2003c). Potassium Guidelines for Field Crops in New York. CSS Extension Series E03-14. Cornell University, Department of Crop and Soil Sciences, Ithaca NY. Available online at: http://nmsp.cals.cornell.edu/publications/extension/Kdoc2003.pdf (accessed May 13, 2021).
Kharel, T. P., Maresma, A., Czymmek, K. J., Oware, E. K., and Ketterings, Q. M. (2019). Combining spatial and temporal corn silage yield variability for management zone development. Agron. J. 111, 2793–2711. doi: 10.2134/agronj2019.02.0079
Kharel, T. P., Swink, S. N., Youngerman, C., Maresma, A., Czymmek, K. J., and Ketterings, Q. M. (2018). Processing/Cleaning Corn Silage and Grain Yield Monitor Data for Standardized Yield Maps Across Farms, Fields, and Years. Available online at: http://nmsp.cals.cornell.edu/publications/extension/ProtocolYieldMonitorDataProcessing1_15_2020.pdf (accessed March 15, 2021).
Kleinman, P. J., Sharpley, A. N., Withers, P. J., Bergström, L., Johnson, L. T., and Doody, D. G. (2015). Implementing agricultural phosphorus science and management to combat eutrophication. Ambio 44, 297–310. doi: 10.1007/s13280-015-0631-2
Knudsen, D., and Beegle, D. (1988). “Recommended phosphorus tests,” in Recommended Chemical Soil Tests Procedures for the North Central Region, ed. W.C. Dahnke (Fargo, ND: North Dakota Agricultural Experiment Station), 12–15.
McDonald, N. T., Wall, D. P., Mellander, P. E., Buckley, C., Shore, M., Shortle, G., et al. (2019). Field scale phosphorus balances and legacy soil pressures in mixed-land use catchments. Agric. Ecosyst. Environ. 274, 14–23. doi: 10.1016/j.agee.2018.12.014
McLellan, E. L., Cassman, K. G., Eagle, A. J., Woodbury, P. B., Sela, S., Tonitto, C., et al. (2018). The nitrogen balancing act: tracking the environmental performance of food production. BioScience. 68:194–203. doi: 10.1093/biosci/bix164
Morgan, M. F. (1941). Chemical soil diagnosis by the universal soil testing system. Connecticut Agric. Ext. Stn. Bull. 450, New Haven: Univ. of Connecticut.
NEC-1312 (2011). Recommended Soil Testing Procedures for the Northeastern United States. Northeastern Regional Pub. No. 493 (3rd edition). Agricultural Experiment Station University of Delaware, Newark, DE. Available online at: https://www.udel.edu/academics/colleges/canr/cooperative-extension/fact-sheets/soil-testing-procedures-northeastern-US/ (accessed May 13, 2021).
NMSP (2018). Adaptive Management and In-season N Application Update—Expanded End-of-Season Evaluation Options for Corn. Available online at: http://nmsp.cals.cornell.edu/publications/files/AdaptiveManagementGuidelines.pdf (accessed May 13, 2021).
NRCS (2011). Adaptive Nutrient Management Process. Agronomy Technical Note N. 6. Available online at: https://efotg.sc.egov.usda.gov/references/public/SC/AG_TechNote_6_Adaptive_Nutrient_Management_2011.pdf (accessed May 13, 2021).
NRCS (2013). Adaptive Nutrient Management Process. Agronomy Technical Note N. 7. Available online at: https://directives.sc.egov.usda.gov/OpenNonWebContent.aspx?content=33791.wba (accessed May 13, 2021).
NYSDEC (2017). New York State Department of Environmental Conservation ECL SPEDES General Permit for Concentrated Animal Feeding Operations (CAFOs). NYSDEC Division of Environmental Permits, Albany, NY. Available online at: https://www.dec.ny.gov/docs/water_pdf/eclcafopermit(1).pdf (accessed May 13, 2021).
Sobota, D. J., Compton, J. E., McCrackin, M. L., and Singh, S. (2015). Cost of reactive nitrogen release from human activities to the environment in the United States. Environ. Res. Lett. 10:025006. doi: 10.1088/1748-9326/10/2/025006
Storer, D. A. (1984). A simple high sample volume ashing procedure for determination of soil organic matter. Commun. Soil Sci. Plant Anal. 15, 759–772. doi: 10.1080/00103628409367515
Sudduth, K. A., and Drummond, S. T. (2007). Yield editor: software for removing errors from crop yield maps. Agron. J. 99, 1471–1482. doi: 10.2134/agronj2006.0326
USDA (2020). United States Department of Agriculture—New York State Agriculture Overview. Available online at: https://www.nass.usda.gov/Quick_Stats/Ag_Overview/stateOverview.php?state=NEW%20YORK (accessed July 26, 2021).
Van Leeuwen, M. M. W., Van Middelaar, C. E., Oenema, J., Van Dam, J. C., Stoorvogel, J. J., Stoof, C. R., et al. (2019). The relevance of spatial scales in nutrient balances on dairy farms. Agric. Ecosyst. Environ. 269, 125–139. doi: 10.1016/j.agee.2018.09.026
Vega, A., Córdoba, M., Castro-Franco, M., and Balzarini, M. (2019). Protocol for automating error removal from yield maps. Precis. Agric. 20, 1030–1044. doi: 10.1007/s11119-018-09632-8
Keywords: adaptive management, corn silage, nitrogen, nutrient balance, nutrient management, phosphorus, precision agriculture, spatial scales
Citation: Berlingeri JM, Lawrence JR, Sunoj S, Czymmek KJ and Ketterings QM (2021) Nitrogen and Phosphorus Balances Vary at the Whole-Farm, Field, and Within-Field Scales. Front. Sustain. 2:747883. doi: 10.3389/frsus.2021.747883
Received: 27 July 2021; Accepted: 14 September 2021;
Published: 12 October 2021.
Edited by:
John J. Classen, North Carolina State University, United StatesReviewed by:
Hossein Rashmanlou, University of Mazandaran, IranRupkumar Mahapatra, Vidyasagar University, India
Copyright © 2021 Berlingeri, Lawrence, Sunoj, Czymmek and Ketterings. This is an open-access article distributed under the terms of the Creative Commons Attribution License (CC BY). The use, distribution or reproduction in other forums is permitted, provided the original author(s) and the copyright owner(s) are credited and that the original publication in this journal is cited, in accordance with accepted academic practice. No use, distribution or reproduction is permitted which does not comply with these terms.
*Correspondence: Quirine M. Ketterings, cW1rMkBjb3JuZWxsLmVkdQ==
†These authors have contributed equally to this work