 Mabvuto Yesaya
 Wrixon Mpanang'ombe
 Elizabeth Tilley
- 1Centre for Water, Sanitation, Health and Appropriate Technology Development (WASHTED), Malawi University of Business and Applied Science Sciences, Blantyre, Malawi
- 2Global Health Engineering, Department of Mechanical and Process Engineering, ETH Zurich, Zurich, Switzerland
In urban Blantyre, there is ample green-waste and widespread interest in compost, but the feedstock is often contaminated with plastics. If composting is going to become more widely implemented, it must be profitable and ideally, competitive with chemical nutrients, however the time and cost associated with plastics removal is currently a bottleneck to profitability. In this study we investigated the financial sustainability of compost production using a Time-Driven Activity-Based Costing method over 16-weeks to identify the types and duration of each activity required. Combining these data with capital and operating costs, we then modeled the profitability of the facility to identify cost-bottlenecks and to determine scenarios that would lead to improved profitability. The results show that it took 1 h 50 min of labor to produce 165-L (0.065 m3) bag of compost. A total of 12.3% of the active labor time was spent sorting out plastics from the organic waste before composting, during composting and from the finished product before packaging. Until similar work is published on the topic, these values cannot be evaluated as being either optimal or wasteful, but rather, serve as a baseline against which future interventions—e.g., source separation, especially at markets can be evaluated. Though based in Malawi, the documented and modeled costs can be converted and scaled by other entrepreneurs/agencies who are interested in estimating the financial feasibility of composting in their own context.
Introduction
Malawi, like many other developing nations in the Global South, is dependent on expensive, imported chemical fertilizers to support its subsistence agricultural sector [For instance, in 2019 alone, Malawi imported US $214.88 million worth of chemical fertilizers. Some years, such as 2013, saw imports reach as high as US $350 million (United Nations, 2021). Since the 2005 maize growing season, the government, through the (Ministry of Agriculture, and Food Security of Malawi, n.d.) (AIWD), has implemented a Farm Input Subsidy Programme (FISP), which provides fertilizer to qualified farmers each season. Although the program has been successful at reducing food insecurity within the country, it has been fraught with accusations of administrative oversight and nepotism, as well as an illegal market for the coupons, which limits overall efficiency (Holden and Lunduka, 2010a).
Yet, since the start of FISP, fertilizer has become a political commodity. Prior to the presidential election on 21st May 2020, Saulos Chilima, the then vice president of Malawi, and a member of the incumbent challenging “Tonse” alliance, promised cheap chemical fertilizer once the alliance was voted into power (Chiuta, 2020). Chilima and the United Transformation Movement (UTM) won the election, and now Vice-President Chilima (along with President Chakwera) is set to deliver on his campaign promises. The proposed fertilizer subsidy program will allegedly benefit 4.2 million people, broadening the current program, and providing fertilizer at prices drastically below market prices.
Information on the long-term effects of the household subsidy program remain quite limited as results show that farmers' income rises for 4 or 5 months during the subsidy (due to sales of harvested crops) but decrease to the pre-subsidy levels within 1 or 2 years after the subsidy program when they no longer have access to coupons (Ricker-Gilbert and Jayne, 2017). Though undeniably popular, the FISP program is financially and environmentally unsustainable. Malawi is one of the poorest nations in the world, and the agricultural inputs like fertilizer are purchased almost entirely through credit or with donor support. Moreover, although the FISP program is broad-based, concerns about beneficiary selection, and corruption has meant that many vulnerable households slip through the cracks, being denied benefits, and forced to purchase fertilizers and unaffordable market prices (Holden and Lunduka, 2010b; Lunduka et al., 2014). The current trajectory is unsustainable, necessitating the urgent development of alternative solutions for sustainable agriculture. Composting could be that solution.
Malawi, like most low-income countries, produces ample organic waste to support large-scale compost production. However, the lack of an efficient solid waste management system means that there is little formal collection, and almost no separation of waste fractions. For instance, Malawi's four largest cities, Lilongwe, Blantyre, Mzuzu and Zomba together generate over 1,000 tons in solid waste per day and only 4% of the waste is recycled, while the Blantyre City Council manages to collect only 59,130 tons of the 259,570 tons produced (Yaron, 2012; Maganga, 2013; Barré, 2014). Furthermore, about 280,000 tons of solid waste remains uncollected in urban areas of Malawi each year and since plastics constitute about 10% of the total solid waste produced, about 28,000 tons of plastic waste enters the environment. Finally, although there is a recyclables market for plastics, it is seasonal and generally unattractive, especially if the plastics must be separated from a mixed waste stream (Kasinja and Tilley, 2018). As a result, most organic waste is heavily contaminated with other, inorganic, waste fractions, predominantly plastics, rendering the production of compost time consuming and costly.
Compost Production and Use in Malawi
Composting, the controlled, aerobic process of transforming organic material such as garden cuttings, market waste, and/or food scraps into a nutrient-rich soil amendment, holds many advantages (Liu et al., 2018). The use of compost has been associated with improved texture and porosity of sandy soils (Naohiro et al., 2016) reduced soil acidity (that is associated with the extensive use of chemical fertilizer) (Kabambe et al., 2012), improved water retention capabilities, increased soil biodiversity and improved resistance to soil erosion (European Commission, 2003; Carter, 2007). Soil organic matter is particularly important in low-income countries where the soils are heavily weathered and chemical fertilizer is often expensive and difficult to source (Snapp et al., 2014).
Within Malawi, the application of compost has been associated with increased soil carbon and increased soil fertility (Paulin and O'Malley, 2008). Positive impacts of compost application were also observed on soil's water retention capabilities (from 5 to 20%) and Cation Exchange Capacity (CEC) (Naohiro et al., 2016). Despite the apparent advantages, neither compost use nor its production is common in Malawi where most Malawians depend on, and prefer chemical fertilizer (Cameron et al., 2004; Hasan et al., 2007). This is not to say that Malawian farmers are necessarily opposed to compost use. One survey in rural Balaka found that up to 32% of farmers use compost in their fields to some extent (Mustafa-Msukwa et al., 2011). Similarly, districts in the Northern Region reported that about 30% of the respondents applied compost to half of their land (Mustafa-Msukwa et al., 2011; Matsui and Cornelius, 2017) has partly attributed this low usage to limited awareness of composting processes, as well as the limited ability for current compost production to meet local demand1, while Naohiro et al. (2016) and Ayilara et al. (2020) have pointed to the larger volume of compost needed per hectare, compared to chemical fertilizers, as well as its slower absorption time by the fertilized crops. However, the current policy of fertilizer subsidization has meant that farmers prefer to buy chemical inputs as long as they remain cheap and available, stifling the growth of a domestic composting industry.
Time-Driven Activity-Based Costing
Though desirable from a sustainability, soil health, and waste management perspective, the promotion of compost has been largely targeted toward individuals; however, small-scale production is labor-intensive, prone to failure, and limited by feedstock type and quantity. If compost is to make genuine inroads and gain acceptance among Malawian farmers, especially in the face of attractive fertilizer subsidies, it must be produced on such a scale that it is more widely affordable and available.
Time-Driven Activity-Based Costing (TBABC) is a tool used to disaggregate and identify the labor activities required for a process to better understand the economic viability of a business (Reynolds et al., 2018). Rather than estimating productivity with known payments, self-reported values or standard costs, the method is based on a detailed account of the time that each activity takes, and the human resources allocated. Additionally, this method helps in the identification of “idle” time which would otherwise go undetected (Gervais et al., 2010). In understanding which activities take the most time and are therefore most expensive, targeted modifications can be implemented and tested to reduce overall costs and increase output efficiency. Though common in the field of business management, we found only one application of the tool used for assessing a composting practice (Askarany and Franklin-Smith, 2014), though the data were not disaggregated down to the level of each activity. Furthermore, we know of no work that has quantified the capital and operating costs of composting production on the African continent, operating at full scale, disaggregated by activity.
The purpose of this paper therefore was to investigate the technical and financial feasibility of centralized composting in Malawi. Working with a small, compost-producing NGO (Waste Advisors or WASTE), based in Blantyre, Malawi, we used a TDABC method to quantify all sources and types of labor that are required to produce 1 m3 of compost. The labor data were then supplemented with available and estimated operating and labor costs to compile a model that was then used to test the profitability of the operation over a range of values for key parameters. In addition, since WASTE produces compost from market waste that is contaminated with plastics that require manual removal, we also sought to model profitability as a function of plastic contamination. Based on our observations and model, we propose optimization strategies for scaling up compost production within Malawi. However, as the usefulness of, and interest in composting grows globally, the implications for source separation and profitability are broadly relevant.
Materials and Methods
Study Setting
Blantyre, Malawi's second largest city, and considered the country's business and financial capital, is in the southern part of Malawi ~300 km southeast of the capital, Lilongwe. The city's solid waste is managed by the Blantyre City Council (BCC), which collects trash from households in rich suburbs and community skips in poorer ones (skips are large, metal bins that hold about 7 m3 of waste and are also known as “dumpsters” in other countries). Additionally, BCC is also responsible for removing the waste, which is largely organic, from the numerous vegetable markets across the city. Regardless of the origin, all waste is transported to Mzedi Dumpsite, a non-engineered landfill, just outside the Blantyre city, for disposal. Mzedi itself, has been utilized long past its originally intended lifespan, and has begun to degenerate rapidly, negatively impacting the surrounding communities (Kalina et al., 2019; Kalina and Tilley, 2020).
WASTE is a local NGO that has a focus on sustainable business-based projects to improve water, sanitation, and solid waste in the country. Their passively aerated windrow composting facility is located on the outskirts of Blantyre. The NGO uses organic waste (OW) from two Blantyre markets in the production of compost, which is later sold to farmers. By working with the BCC, and paying MWK 1,500 per 7 m3 skip full of mixed waste, BCC's transportation costs to Mzedi dumpsite are reduced (the WASTE facility is closer to both markets than Mzedi), landfill airspace at Mzedi is conserved, and greenhouse gas (GHG) production is mitigated (MWK 1,000 is ~1 British Pound (£); for ease of conversion, simply remove the last three digits of the value in Kwacha). WASTE sources OW from two vegetable markets in the greater Blantyre area: the Blantyre Market and the Limbe Market. Both markets are managed by the BCC but are self-governed by informally elected chairpersons not appointed/paid by the city council. In each market the BCC employs cleaners who sweep and throw trash into the skips that are provided by the city council. There is no separation of waste by either the vendors or cleaners, and as a result, the waste that is disposed of into the skips is mixed, and the OW that is delivered to WASTE is heavily contaminated with plastics and other trash. Figure 1 shows the types of waste that arrive and the plastic types that are removed.
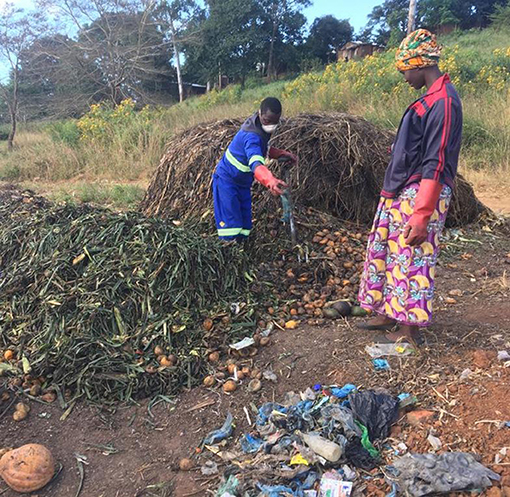
Figure 1. Raw organic waste arrives on site and is sorted before being transferred to the composting piles.
Once the OW arrives on site, the compost production generally involves a linear sequence of fourteen (14) activities:
• Plastic sorting: Removing plastic, usually plastic bags, and other garbage such as metal cans and plastic bottles from the OW that is delivered by the city's waste collection truck.
• Piling: Sorted OW, green material and chicken manure are piled into a 2 × 2 × 3 m (12 m3) heap. Water is also added to the pile to wet the feedstock. Piling is done using forks and rakes.
• Plastic removal (from piles): After the sorted OW has been made into a pile, plastics that were embedded and were missed during the sorting process become visible and they are removed after the piling process.
• Turning: Workers use forks to move the OW in one direction along a path that is already demarcated with logs. Water is added in the process of turning. A pile is turned when a rise in temperature (i.e., >63°C) is observed. Turning is done to aerate the pile and ensure even decomposition. Turning frequency is on average once per week. After the 7th turning, the pile is left to mature. This maturation process totals 8 weeks, including the turning.
• Plastic removal (from finished compost): When the OW has fully turned into compost, more plastics and glass become visible; they are picked out and removed.
• Drying: When the compost is mature, it has water in it, which adds unnecessarily to the weight. Drying the compost on the ground in thin layers makes it easier to screen and bag.
• Piling compost (before screening): After the compost is spread out to dry, shovels and buckets are used to re-pile the compost in a single heap.
• Screen installation: Fetching and setting up wooden posts to support the flat metal screens which are used for sieving the compost.
• Screening: The process of sieving the compost into one of two grades (coarse and fine). Bigger particles that remain on top of the sieve are thrown away and/or put back into a different pile.
• Packing: Putting the screened ready-to-use compost in 65 L bags.
• Transport: Onsite transportation of filled bags of compost from the place of packing to the point of storage usually by carrying on the head and/or wheelbarrows.
• Sewing: Sealing a bag that has been filled with compost making it ready for sale. Sewing is usually done with a hand-held sewing machine connected to a generator as the power source. Sewing is done adjacent to the storage point.
• Stacking: Arranging sewn bags to create space for other compost bags yet to be sewn and to enable easy bag counting.
• Site Cleaning: Tidying the site by sweeping the compost production area, removing residues generated during storage and handpicking visible garbage.
Labor
For the TDABC part of the study, data were collected between August-December 2019, over a 16-week period. The length of time was chosen to ensure that all phases of the composting process were covered, i.e., building the piles, turning the piles, packaging the finished compost. Each pile requires about 4–6 weeks to mature (depending on environmental conditions) so the 16 week data collection phase ensured that we captured the labor requirements of multiple piles at multiple stages of maturation. During the investigation the enumerator visited the compost production site daily, between opening and closing (8:00 a.m.−4:30 p.m.), and recorded: the time an activity started and stopped, the number of workers performing the activity, the feedstock used, the volume of pile made, the water volume used, and the number of screened bags produced. Data were collected by the enumerator from a raised platform to oversee the various activities and were collected for all activities that went into the production of the compost (i.e., the multiple piles that were at different stages of maturity) to determine the average labor allocation over this 16-week period.
In addition, to compare average values (collected and averaged over 16 weeks), to those values determined for a single pile, in the 6th week of data collection additional data were recorded for a single pile that was made using a 12 m3 pile of OW.
Cost Model
To determine the unit cost of compost production (per bag of finished compost and m3 OW treated), and to provide disaggregated costs based on the breakdown of various types of costs such as labor, a cost model was produced in Excel. The model considered both capital (land, infrastructure and building, utility connections, consulting/advisory fees, etc.) and operating costs (labor, equipment, personal protective equipment (PPE), etc.). Whenever possible, capital and operational expenditure data were provided by WASTE, however, where costs were not provided, local market values were used. The model included some capital and operating expenditures that do not yet, but should exist at the facility, such as the inclusion of a weighbridge for measuring waste quantities.
In designing this model, it was necessary to make several assumptions. Specifically, we did not include any operational downtime for the composting facility (i.e., every day was equally productive); and every piece of equipment reached an idealized useful life (in years). We built the model based on the total number of each piece of equipment type required for production at the current maximum OW treatment capacity (the pieces of equipment varied relative to production capacity; when we modeled OW capacity less than the current 100% capacity, the pieces of equipment would decrease while at a capacity more than 100% resulted in an increased number of pieces of equipment). The maximum OW treatment capacity was defined as the maximum amount of OW that the study facility could process on the existing area, i.e., the maximum number of piles that could fit on site. The area of the site was 12,000 m2. When the model was used to determine costs or other output variables, the values for the input variables, e.g., land, labor, equipment, etc. would be rounded up/down proportionately to the nearest whole number, i.e., the model would not permit fractional pieces of equipment. Similarly, the number of workers would increase when more OW intake was modeled therefore the value of PPE would increase (i.e., round up to the nearest whole number of workers needed).
We were able to model up to a 100% increase in treatment capacity. Labor values in the form of compost production time (i.e., work-hours spent on each activity, total hours spent on producing a bag of compost, and the time spent treating 1 m3 OW) and output values (i.e., the number of bags produced) were obtained from the time-motion study. The data on water consumption during compost production cycle as well as the pieces of equipment used were also observed during the time-motion study.
There were piles already in progress when the monitoring began, and these were not excluded from the study. However, at the end of the study, there were piles that had still not matured to completion, and these were excluded, i.e., partially finished piles from the beginning of the study were included and offset by excluding the partially finished piles from the end of the study. This assumption is not perfect but was the most practical solution for our purposes. Finally, an assumption was made that the initial capital investment was based on a bank loan. Therefore, annuity calculations on the loan repayment were considered in the model. The interest rate was set at 13.5% (Reserve Bank of Malawi, 2019), and the payback period on capital was assumed to be 10 years.
Data Analysis
Time Motion Activities
Within the TDABC, we estimated the time spent producing one bag of compost by dividing the total hours of labor recorded by the number of bags produced (either over 16 weeks or for the single pile of compost that was monitored in isolation). In the calculations, the total hours were rounded off to exclude seconds because no time was recorded in seconds. There was a maximum of 14 workers at any given time and each worker was expected to work 7.5 h (8:00 a.m.−4:30 p.m.) on Mondays–Friday and 4 h (8:00 a.m.−12:00 noon) on Saturdays. We estimated the expected hours of labor per day by multiplying the number of workers and their expected hours each day.
However, the total hours recorded were not the same as the expected number of hours and the difference was termed unaccounted time:
The amount of Unaccounted Time was significant and was the result of inaccurate data collection (i.e., missing activities), time rounding, data entry errors, wasted time (phone calls, unscheduled breaks, etc.) or a combination thereof.
To produce a range of estimates for each labor allocation, we calculated the percentage of time spent on a given activity both in terms of the total hours and the expected hours. First, to find the percentage of time spent on, for example, screening, we divided the hours spent on screening (0:24) by the total hours (1:50); 22% of the total time was actually spent on the activity:
Second, we performed the same calculation again, but instead, the denominator was the expected hours the 16-week study of multiple piles. We divided the hours of screening (0:24) by the total hours (1:16); 31.5% of the total time was spent on screening:
For the single pile made and monitored for 8-weeks, we only calculated the labor allocation using the Total Hours because when workers were not attending to the pile of interest, they were working on other activities, so, according to our observations, the single pile, had no unaccounted time.
Profitability as a Function of Plastics Contamination
With our cost model, we were able to predict the level of profitability for a specific volume (m3) of OW that contained a given percentages of plastic contamination. We assumed OW intake per week from 10 to 120 m3, and at each OW volume we modeled varying contamination levels from 0% trash to 50% trash. Profitability was recorded and tabulated during each of the OW volume and trash percentage variations.
Results and Discussion
Labor Costs
16-Week Study
Results from the TDABC study showed that the production of compost is a labor-and time-intensive process, and that the necessity of removing plastic from the OW contributes measurably to both metrics. With the number of workers present, we actually accounted for a total of 3,384 h of labor during the 16 weeks of the study (Table 1). The workers produced an average of 34 bags of compost per day: 2,645 65-L bags of both fine compost (diameter 3/8”) and coarse compost (diameter 1/2”) over the entire period (we did not disaggregate the number of bags produced based on the particle size). The actual time to produce one bag of compost was 1 h 16 min. Using the expected time, a bag of compost took 1 h 50 min to produce. For labor-intensive activities such as plastic sorting and screening, there were a maximum of seven workers on an activity at a time and a maximum of 14 workers on site at any given time. Workers were not assigned to a single fixed task (i.e., screening) so would move between tasks randomly (and not necessarily in an optimized way).
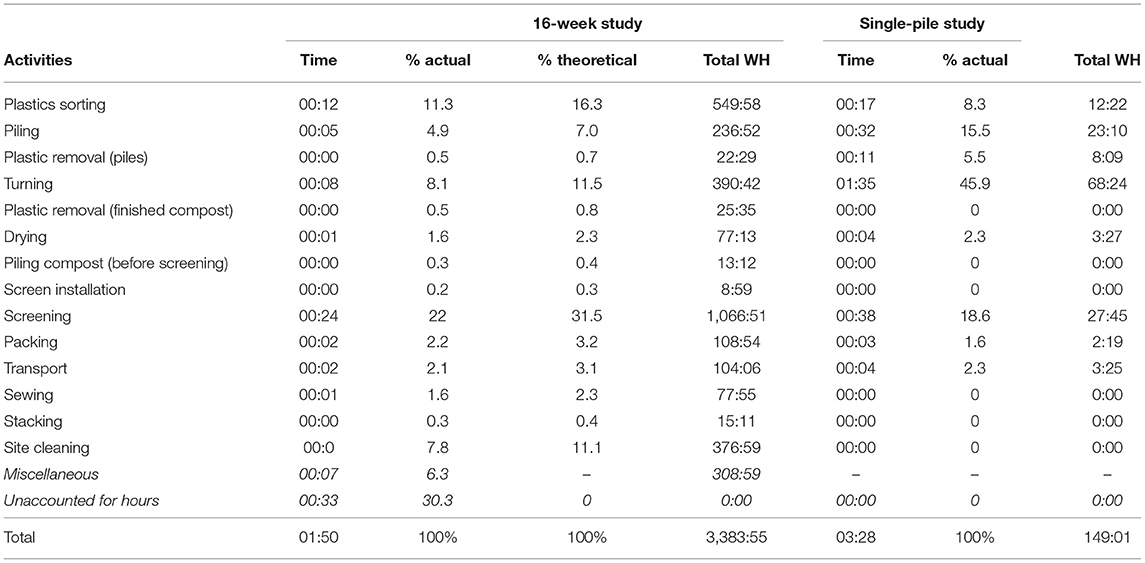
Table 1. Time (h:m), work-hours (WH) and percentages in producing 1 bag of compost (time = time per bag).
Based on the calculations using the total time for the production process, about 11% of the time was spent on plastic sorting (when the waste arrived). Additionally, another 0.5% of time was spent on plastic removal during piling, 0.5% of time was spent on plastic removal in the finished compost, and 0.3% of the time was spent on plastic removal before the screening.
WASTE workers used about 30.3% of their time doing things other than compost-related activities (unaccounted time). The site was consistently supplied with OW waste, receiving daily skips from the markets, so this unaccounted-for time cannot be explained by a lack of materials.
From this unaccounted-for time, for every compost bag produced, the workers could have saved over 30 min and used it to maximize the production of more compost bags. Overall, the 1,468 h could have been used to either produce more compost or improve the quality of the compost produced (i.e., spent more time on plastic removal) (Table 1).
One-Pile Study
For the single pile experiment, a maximum of 11 different workers worked on the pile for the 8 weeks covered by the investigation, and workers would work on the pile for about 2 h per day. After screening, the single pile produced 43 bags of compost and 2.6 m3 of water was used from start to maturation. A total of 152:32 h were used consequently, 3:28 h were used to produce one bag of compost which is 255% higher than time used to produce one bag of compost during the 16-weeks study.
Turning was the activity that took most of the time; screening, plastic sorting, and piling accounted for minor fractions of the actual time. Results showed that 46% of the workers' time was spent on turning, while it occupied 8–13% for the 16-week study (actual and theoretical, respectively). Plastic sorting consumed about 8% of the total time while screening consumed about 19%. Plastics that were missed during sorting may have contributed to the increase in the amount time spent on screening, though we did not repeat the single pile study. The pile was made in the rainy season and screening moist compost required more time as the larger components were more difficult to dislodge, which probably increased the screening time.
Capital Costs
The baseline model revealed that the land purchase (MWK 120,000,000) and site preparation (MWK 24,000,000) constituted 80.98% of the total capital costs. Consulting costs (MWK 13,050,000) (e.g., to conduct an environmental impact assessment of the project), were only 5% points less than building and infrastructure costs (MWK 20,431,783). The building and infrastructure costs included in the model included the construction of a small administrative office (MWK 5,000,000) onsite with basic furniture and storage facilities, a weigh bridge (MWK 8,000,000), sanitation facilities (MWK 450,000) for workers as well as a water reservoir (MWK 800,000). For the total capital expenditure, building and infrastructure costs constituted 11.49%, setup consulting/advisory costs were 7.34%, and utilities connection costs (MWK 350,000) were 0.20%.
Operational Costs
Baseline operational costs of the compost facility showed that costs relating to workers, i.e., labor payments (38.49%) and PPE costs (25.54%), constituted the majority of operational costs incurred. Costs related to utilities bills were the smallest proportion (1.00%) of the operating costs. The utilities accounted for in the model were only the diesel costs spent on powering the generator used to provide power for the sewing machine used when sewing (to seal) compost bags. Although water is consumed throughout the compost making cycle to provide moisture for the compost piles, there were no water costs; the compost facility depends on a groundwater well. The rest of the operational costs were packaging costs (19.99%) i.e., cost of empty bags, site equipment and materials used during compost production (8.93%), and payment to BCC for OW transport to the compost facility (6.05%).
Considering that the capital costs were covered by a bank loan (MWK 181,637,916 was initially borrowed, and total repayment of MWK 331,905,415 over 10 years), the loan repayments made up 75.03% (MWK 33,190,542) of all expenditure per year of operations. Interest rates are unusually high in Malawi (though similar rates are common across Africa), but anyone venturing into compost making at the same scale should thoroughly scrutinize loan repayments on capital to ensure that the expenses on repayment do not negatively affect production costs.
The next most significant annual expenditure category in the model were the costs relating to maintenance of workers including their wages (9.61%; MWK 4,250,496 per year) and PPE (6.38%; MWK 2,820,000 per year). The rest of the annual expenditures were packaging costs (4.99%; MWK 2,208,050 per year), purchase of equipment and materials (2.23%; MWK 986,133 per year), payment for OW transport (1.51%; MWK 668,571 per year), and utilities bills (0.25%; MWK 110,403 per year) i.e., payment for diesel used to power the generator during sewing activities.
Cost Modeling
We changed model parameters related to the capital costs, operational costs, and OW characteristics to determine the changes in profit per m3 of organics treated at the facility (Table 2). The extremes of the input parameter variations included doubling or completely removing a parameter in the model to determine the effect on profitability, i.e., each parameter was tested across a range from −100 to +100% of its baseline value in order to identify cost bottlenecks in the composting operation.
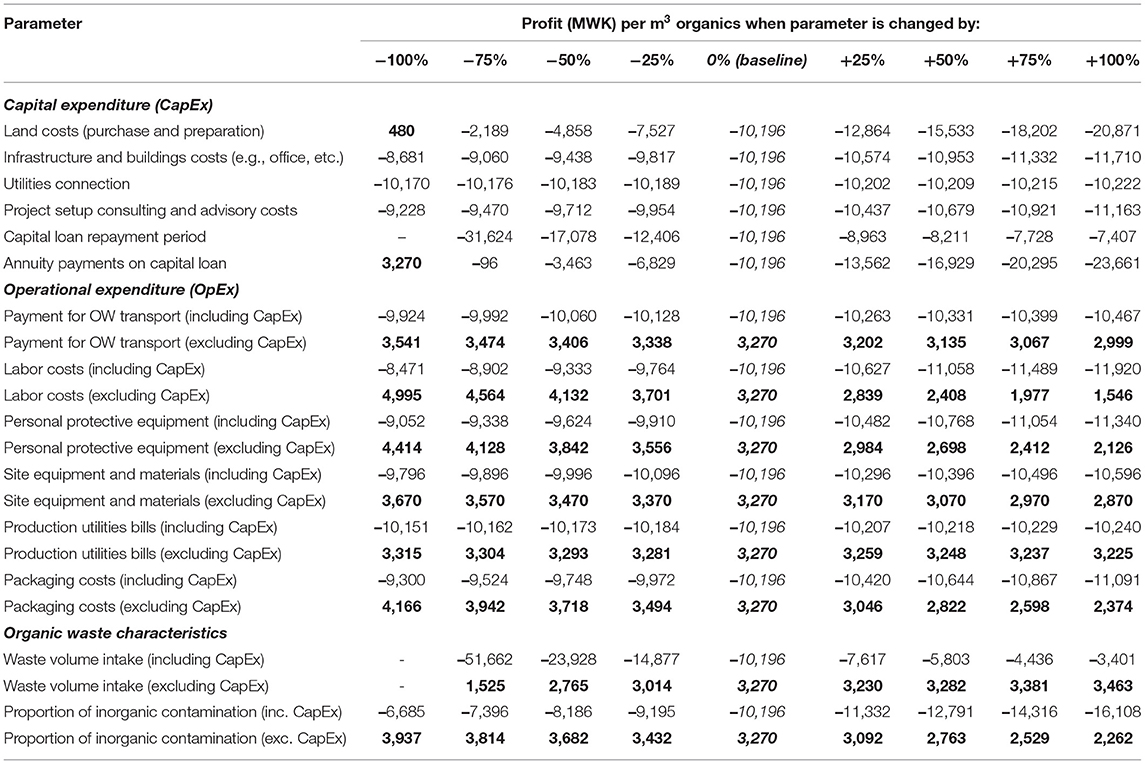
Table 2. Effect of changing model parameters on profitability (bold indicates changes that result in profit).
Capital Costs
At the baseline, the profit per m3 organics was MWK −10,196, which is obviously unsustainable (0% Top section, center column, Table 2). Varying parameters directly or indirectly related to capital expenditure did not achieve any profitability except for when land costs were completely removed (i.e., −100% variation). Even when the loan repayment period was doubled to 20 years, profit was not possible. When annuity payments on the loan were removed from the model, i.e., assuming no capital expenditure, a profit of MWK 3,270 per m3 organics was achieved (Table 2). In fact, WASTE did not have to purchase land and did not take out a market-rate loan; the BCC allocated unused space at a wastewater treatment plant, and start-up capital was provided through a grant. WASTE is therefore able to operate the facility above or near the break-even point, though for our purposes, it would not have been realistic to ignore capital costs.
Operational Costs
Because of the findings above, operational parameters were varied in the presence of capital expenditures set to the baseline values, and again, without any capital expenditures. The latter scenario turned a profit with every parameter variation made. In the scenario excluding capital expenditure, the total costs in the model excluded initial capital costs and loan repayments, i.e., with the scenarios excluding capital expenditure the assumption was that the compost operation did not incur any start-up expenditure such as the purchase of land or the construction of infrastructure. The scenario without capital expenditure was modeled to determine if there were other cost bottlenecks that prevented the profitability of the baseline model apart from the land costs and other capital expenditure. In particular, the scenarios excluding capital expenditure illustrated the changes in profitability that would be possible if the compost facility did not have any debt, a situation that resembled that of the WASTE study facility.
Waste Characteristics
Variations to OW characteristics were also made to determine the effect on profitability. As with operational costs, profit was only achieved when capital costs were excluded from the model (Table 2) even when the volume of OW intake at the plant was doubled or when there was no trash contamination of the organics (removing the need for sorting). The impact of trash contamination was one that we hypothesized could be most easily addressed through behavior change and technical intervention. However, the results showed that no profits could be realized in this particular model (profitability vs. trash contamination, at a baseline situation) at any contamination level.
Figure 2 shows the results from Table 2 in further detail by illustrating the profitability for every combination of OW volume and contamination rate, holding the other variables constant at baseline values (i.e., including capital costs). At lower OW intake volumes, the impact of contamination on profit is more pronounced, i.e., the gap in profitability between two levels of contamination reduces as the volume of OW processed increases, especially when the intake surpassed current 100% treatment capacity (i.e., the OW intake of more than 60 m3 OW per week).
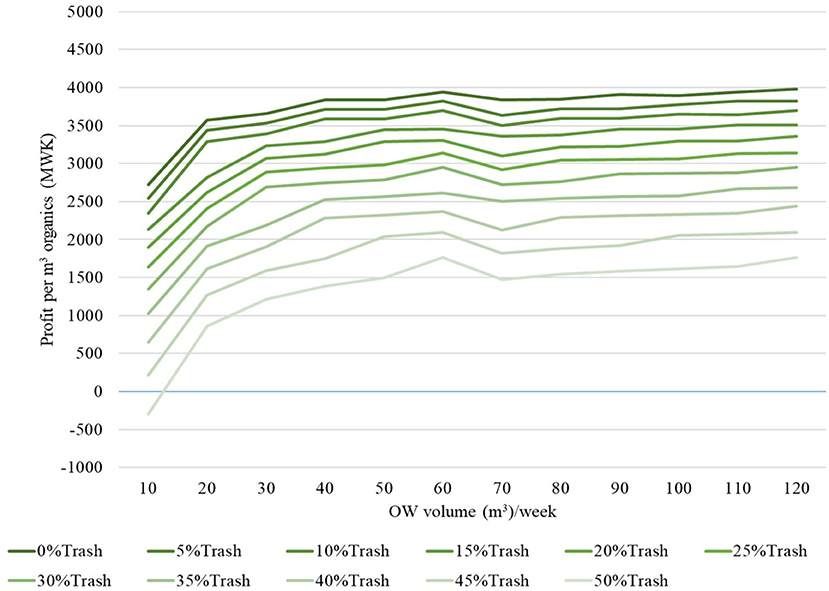
Figure 2. Profitability as a function of plastic contamination at baseline model situation (capital expenditure included).
When capital expenditures were excluded from the model of profitability as a function of trash contamination (at baseline), the model indicated a profit with an OW intake of at least 10 m3 at 45% contamination (Figure 3); a loss was observed at an OW intake of 10 m3 at 50% contamination. While excluding capital expenditure shows that the gap between 0 and 50% contamination is narrower than when capital expenditure is included (Figure 3), the trend of increasing profitability with reducing contamination and increasing OW intake is maintained. However, there are drops in profitability when 100% treatment capacity (i.e., current treatment capacity of 60 m3 OW per week) is exceeded but then profitability steadily increases afterwards. The inflection points are a result of the model either rounding up the quantity of certain materials and services to satisfy the condition of whole-unit items and workers, or certain scales of the economy being realized when greater efficiencies were achieved using existing resources.
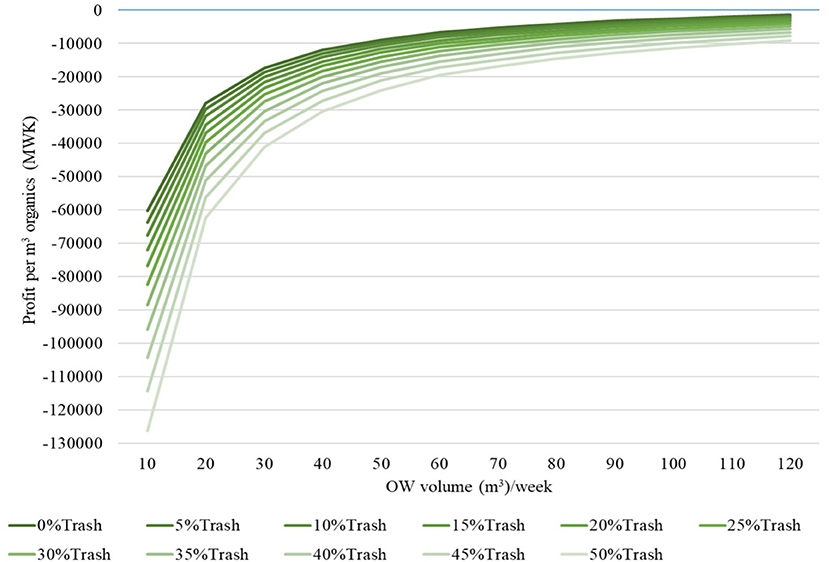
Figure 3. Profitability as a function of plastic contamination at baseline model situation (capital expenditure excluded).
In general, both Figures 2 and 3 show that profitability increases as trash contamination decreases because less sorting is required which in turn, lowers the labor costs as well as associated costs such as PPE as there are fewer workers required; at the same time, the proportion of organics in the skip increases, leading to greater compost production. If treated OW per week reaches 60 m3, the profitability drops for OW intakes, but profitability decreases more when the proportion of trash increases (i.e., >25% trash). The decrease in profitability described is due to the increase in the labor and PPE required to remove trash from the organics.
Conclusions and Recommendations
Our model showed that capital expenditure is the primary barrier to full-scale compost production profitability. Costs associated with land acquisition prevented profitability for any scenario modeled. Potential facility operators and/or local governments should investigate the potential of public-private partnerships to provide free land or to significantly reduce the cost of land. Future research should address the magnitude of impact such interventions could have on the profitability of composting operations. This work was limited by the fact that the cost of capital (i.e., interest rates) in Malawi is especially high; we encourage other researchers to adapt this model to other similar facilities to develop comparative results. Similarly, these results were based only on a windrow-style process that required very little energy: forced aeration or mechanically-turned processes would yield different results and should be investigated.
The TDABC results illustrated that plastics are removed at multiple points in the composting process, and that the time allocated to removing plastics is non-trivial: plastics (and other types of trash) still remain in the finished compost and must be sieved out before it can be sold. Separating out plastics from the predominantly organic market waste means that the entire volume of waste is not disposed of in the landfill. However, regardless of how well the OW or compost is cleaned, microplastics will end up in the screened compost and will enter the food chain through bioaccumulation (Weithmann et al., 2018). The modeling also indicated that reducing contamination with inorganics increases profitability, though the results have not been validated. Theoretically, the OW used by composting facilities should be as pure as possible to reduce the labor costs associated with sorting; work to validate this assumption is currently underway. We are testing the use of incentives to increase the production of uncontaminated market waste at the source, and will be able to test the modeled findings from this work with empirical data soon. It remains to be seen whether the increased cost for separation incentives will be offset by the decreased quantity of plastic, and in turn labor requirements: this remains a priority research gap.
From a methods perspective, we were unable to perfectly identify how and where each laborer spent his or her time, resulting in a substantial amount of “unaccounted” time. Similarly, the two different methods employed (16-week average and single pile), produced different productivity values and it is a limitation of this work that we cannot fully explain why. We recommend that future work attempt to document more individual piles, so that the variance and accuracy can be determined and better compared to the average-based method.
Given that important role that composting can have on reducing solid waste, improving soil health, relieving the reliance on foreign-made chemical fertilizers, and generating local employment, these first results indicate that full-scale composting can be profitable, given various process modifications, but more research into the impact and sensitivities of process modifications are needed.
Data Availability Statement
The raw data supporting the conclusions of this article will be made available by the authors, without undue reservation.
Author Contributions
MY collected, cleaned, and analyzed the time-motion data. WM developed, populated, and ran the model. ET supervised the project. All authors wrote the manuscript.
Funding
This work was supported by the Royal Society of UK (Grant No. CHL\R1\180402).
Conflict of Interest
The authors declare that the research was conducted in the absence of any commercial or financial relationships that could be construed as a potential conflict of interest.
Publisher's Note
All claims expressed in this article are solely those of the authors and do not necessarily represent those of their affiliated organizations, or those of the publisher, the editors and the reviewers. Any product that may be evaluated in this article, or claim that may be made by its manufacturer, is not guaranteed or endorsed by the publisher.
Acknowledgments
The authors acknowledge Blantyre City Council and Waste Advisors for their cooperation during the data collection exercise. The authors would like to thank Dr. Marc Kalina for his helpful comments and feedback on the draft manuscript.
Footnotes
1. ^In their study, the compost produced only covered 17% of a single garden (the average garden size for the 150 sampled households in the study area was 0.9 hectares) (Mustafa-Msukwa et al., 2011).
References
Askarany, D., and Franklin-Smith, A. W. (2014). Cost benefit analyses of organic waste composting systems through the lens of time driven activity-based costing. JAMAR 12, 59-73.
Ayilara, M., Oluwaseyi, O., Olubukola, B., and Olu, O. (2020). Waste management through composting: challenges and potentials. Sustainability 12:4456. doi: 10.3390/su12114456
Barré, J. (2014). Waste Market in Urban Malawi—A Way out of Poverty? Swedish University of Agricultural Sciences.
Cameron, E., How, N., Saggar, S., and Ross, C. (2004). The Cost-Benefits of Applying Biosolid Composts for Vegetable, Fruit and Maize/Sweetcorn Production Systems in New Zealand. Lincoln: Manaaki Whenua Press.
Carter, M. R. (2007). Long-term influence of compost on available water capacity of a fine sandy loam in a potato rotation. Can. J. Soil Sci. 87, 535–539. doi: 10.4141/CJSS06042
Chiuta, W. (2020). Chilima's Challenge on Cheap Fertiliser Excites People: Drums up Support for Tonse Alliance. Available online at: https://www.nyasatimes.com/chilimas-challenge-on-cheap-fertiliser-excites-people-drums-up-support-for-tonse-alliance/ (acessed November 17, 2020).
European Commission (Eds.). (2003). “Directorate-general for the environment Autriche, Umwelt und Wasserwirtschaft Bundesministerium für Land-und Forstwirtschaft, and applying compost: benefits and needs,” in Proceedings of the Applying Compost: Benefits and Needs (Vienna).
Gervais, M., Levant, Y., and Ducrocq, C. (2010). Time-driven activity-based costing (TDABC): an initial appraisal through a longitudinal case study. JAMAR 8:21.
Hasan, M. R., Hetcht, T., De Silva, S. S., and Tacon, A. G. (2007). Study and Analysis of Feeds and Fertilizers for Sustainable Aquaculture Development. FAO Fisheries Technical Paper No. 497. FAO.
Holden, S., and Lunduka, R. (2010a). Impacts of the Fertilizer Subsidy Programme in Malawi: Targeting Household Perceptions and Preferences. Norwegian University of Life Sciences.
Holden, S., and Lunduka, R. (2010b). Yara and the Fertilizer Industry in Malawi. Understanding the Issues 1/2010. Norwegian Church Aid.
Kabambe, V. H., Chilimba, A. D. C., Ngwira, A., Mbawe, M., Kambauwa, G., and Mapfumo, P. (2012). Using innovation platforms to scale out soil acidity-ameliorating technologies in Dedza district in central Malawi. Afr. J. Biotechnol. 11, 561–569.
Kalina, M., and Tilley, E. (2020). “Bad” trash: problematising waste in Blantyre, Malawi. Detritus 12, 187–200. doi: 10.31025/2611-4135/2020.13994
Kalina, M., Tilley, E., Ali, F., Woodenberg, W., Reimers, B., and Trois, C. (2019). “Blurred lines: agricultural production on the margins of a dumpsite in Blantyre, Malawi,” in Proceedings of the 17th International Waste Management and Landfill Symposium (Sardinia).
Kasinja, C., and Tilley, E. (2018). Formalization of informal waste pickers' cooperatives in Blantyre, Malawi: a feasibility assessment. Sustainability 10:1149. doi: 10.3390/su10041149
Liu, L., Shuqi, W., Xiaoping, Zhao, T., and Bolin, Z. (2018). Succession and diversity of microorganisms and their association with physicochemical properties during green waste thermophilic composting. Waste Manag. 73, 101–112. doi: 10.1016/j.wasman.2017.12.026
Lunduka, R., Ricker-Gilbert, J., Shively, J., and Jayne, T. (2014). Understanding and Improving FISP Targeting. Food Security Collabourative Policy Briefs 234943. Michigan State University.
Maganga, A. (2013). Emerging solid waste market in Lilongwe Urban, Malawi: application of dichotomous choice contingent valuation method. J. Sustain. Dev.15, 56–65.
Matsui, N., and Cornelius, C. (2017). Household survey on the compost use and its constraints in smallholder farming of Malawi northern region. J. Plant. Nutr. Soil Sci. 19, 1–9. doi: 10.9734/IJPSS/2017/36570
Ministry of Agriculture Food Security of Malawi (n.d.). Farm Imput Subsidy Programme (FISP) in Malawi. Available online at: https://www.agriculture.gov.mw/index.php/projects/fisp (accessed October 19 2021).
Mustafa-Msukwa, A. K., Mutimba, J. K., Masangano, C., and Edriss, A. K. (2011). An assessment of the adoption of compost manure by smallholder farmers in Balaka District, Malawi. S. Afri. J. Agric. Ext. 39, 17–25.
Naohiro, M., Koji, N., Chisambi, C., and Moyo, M. (2016). Improvement of maize yield and soil fertility by 2-years compost application in Malawi's northern districts. Afr. J. Agric. Res. 11, 2708–2719. doi: 10.5897/AJAR2016.10884
Paulin, B., and O'Malley, P. (2008). Compost Production and Use in Horticulture. Bulletin 4746. Perth, WA: Department of Primary Industries and Regional Development.
Reserve Bank of Malawi (2019). Reserve Bank of Malawi Cuts Rates to 13.5%. Central Banking. Available online at: https://www.centralbanking.com/node/4206116 (accessed February 5, 2021).
Reynolds, A., Fourie, H., and Erasmus, L. (2018). A framework for time-driven activity-based costing implementation at small and medium enterprises. South. Afr. J. Entrep. Small bus. Manag. 10:a194. doi: 10.4102/sajesbm.v10i1.194
Ricker-Gilbert, J., and Jayne, T. S. (2017). Estimating the enduring effects of fertiliser subsidies on commercial fertiliser demand and maize production: panel data evidence from Malawi. J. Agric. Econ. 68, 70–97. doi: 10.1111/1477-9552.12161
Snapp, S. S., Jayne, T. S., Mhangao, W., Benson, T., and Ricker-Gilbert, J. (2014). Maize Yield Response to Nitrogen in Malawi's Smallholder Production Systems. International Food Policy Research Institute.
United Nations (2021). UN Comtrade Database. United Nations Statistics Division. Available online at: https://comtrade.un.org. (acsessedJune 5, 2021).
Keywords: circular economy, Malawi, time-motion analysis, plastic, cost-model, compost
Citation: Yesaya M, Mpanang'ombe W and Tilley E (2021) The Cost of Plastics in Compost. Front. Sustain. 2:753413. doi: 10.3389/frsus.2021.753413
Received: 04 August 2021; Accepted: 12 October 2021;
Published: 02 November 2021.
Edited by:
Atiq Zaman, Curtin University, AustraliaReviewed by:
Md Maruf Mortula, American University of Sharjah, United Arab EmiratesRoberto Minunno, Curtin University, Australia
Copyright © 2021 Yesaya, Mpanang'ombe and Tilley. This is an open-access article distributed under the terms of the Creative Commons Attribution License (CC BY). The use, distribution or reproduction in other forums is permitted, provided the original author(s) and the copyright owner(s) are credited and that the original publication in this journal is cited, in accordance with accepted academic practice. No use, distribution or reproduction is permitted which does not comply with these terms.
*Correspondence: Elizabeth Tilley, dGlsbGV5ZUBldGh6LmNo