 Aisha Al-Rumaihi1
 Mohammad Alherbawi1
 Gordon Mckay1
 Hamish Mackey2
 Prakash Parthasarathy1
 Tareq Al-Ansari1*
- 1College of Science and Engineering, Hamad Bin Khalifa University, Qatar Foundation, Doha, Qatar
- 2Department of Civil and Natural Resources Engineering, University of Canterbury, Christchurch, New Zealand
Biochar from waste has emerged as a vital solution for multiple contemporary issues. While the organic content and porous structure of biochar have granted it multiple benefits. Where the use of biochar is proven to be beneficial for enhancing the soil structure and water and nutrients retention ability, therefore, saving water and boosting yields in arid regions. Moreover, biochar is capable to sequester carbon from the atmosphere and permanently store it within the soil. As such, this study evaluates the potential for carbon sequestration through biochar obtained from the pyrolysis of feedstock mixtures including camel manure, date pits, high-density polyethylene (HDPE) and low-density polyethylene (LDPE), and how it can enhance water and food security. Multiple energy and water supplying sources have been considered for different project scenarios to provide a broader understanding of biochar potentials. The lifecycle analysis (LCA) approach is utilized for the assessment of net emissions, while an economic study is conducted in Aspen Process Economic Analyser (APEA) to evaluate the feasibility of the different scenarios. Finally, single-objective optimization and multi-objective optimizations were carried out using excel and MATLAB genetic algorithm respectively to select optimal biomass blending and utilities options to fulfill the low cost and negative emissions targets. The assessment conducted for a Qatar case study indicates that the best waste blending scenario for maximum carbon sequestration potential was obtained at a mixing ratio of 20.4% Camel manure: 27% date pits: 26.3% LDPE: 26.4% HDPE. Furthermore, the optimum char blend for maximum carbon sequestration corresponding to the minimum cost of char mix was computed. The optimal biochar mixing percentage for highest net emission was obtained at a feedstock mixing ratio of 96.8% of date pits, 1.5% of LDPE, and 1.7% of HDPE with 0% of camel manure with an optimal cost of 313.55 $/kg biochar. Solar PV was selected as the best energy source in this pyrolysis study due to its reduced carbon emissions in comparison to other sources studied such as natural gas, coal and diesel. However, natural gas is selected to fulfill the economic objective. Moreover, the optimal water source was investigated including wastewater treatment, multi-stage flash and reverse osmosis desalination, where treated wastewater is selected as the optimal supply to fulfill both, economic and environmental objectives.
1. Introduction
The global average temperature is expected to increase by the end of the twenty-first century by 1.3–5.8oC. Moreover, the availability of freshwater resources is also expected to decrease, which will impact agriculture yields (Misra, 2014). As a result, food and water security are expected to be impacted due to climate change. The removal of CO2 from the atmosphere is necessary, which is a phenomenon known as negative emissions. Hence, the production of bioenergy from renewable resources integrated models are favorable to contribute toward reducing the global temperature rise (Fuss et al., 2014). Additionally, the environmental issues related to wastes, especially plastic waste, are a serious global concern. The quantities of plastic waste around the globe have been increasing, especially those derived from polystyrene (PS) and high- and low-density polyethylene (HDPE and LDPE, respectively). In Qatar, the usage of plastics has been increasing for several reasons, including population and economy growth, which has led to an increase in the demand for the packaging of goods. While there are some alternatives for the use of plastics such as papers and other biodegradable materials, but those materials are relatively new and not yet available in the market. Moreover, plastics are considered as a symbol of modernity and progress which is associated with the convenience and efficiency of modern life. As a result, there may be a reluctance to abandon the use of plastics and use other sustainable alternatives (Ayeleru et al., 2020). Some of the aforementioned characteristics are the reason for the difficulty in the disposal of plastic waste. Plastic's resistant nature results in an extraordinarily long decomposition time when compared to its actual use time. Additionally, about 8.3 billion tons of plastics have been produced since 1950, of which 6.3 billion tons have ended in waste dumps (Impact Hub, 2019). With the current annual global production exceeding 300 million tons, of which half can be categorized as single use plastic, plastic waste is expected to increase 400 times by 2050, because the current world recycling capacity equals only a third of the total solid waste produced (Impact Hub, 2019). This indicates a lack of infrastructure to ensure adequate and appropriate disposal of plastic waste. Additionally, Lopez-Aguilar et al. (2022) indicated the importance of increasing plastic recycling by using material flow analysis (MFA), where plastics wastes produced from packaging can be reused for other purposes. It has been witnessed that the reduction of plastic use is challenging, especially during the recent COVID-19 pandemic; however, opportunities for single plastic use for food production can be implemented (Molloy et al., 2022). Furthermore, new plastic waste reuse policies have been developed, such as those implemented in China, accelerating the reduction in plastic waste (Shi et al., 2021).
The Planning and Statistics Authority of Qatar (PSA) estimates that there are roughly 126,000 camels in Qatar (Economic Statistics, 2018). The majority of camels are found in the provinces of Al-Rayyan and Al-Shahaniya in the country's southwest (Barker et al., 2002). Every year, these camels create around 120,000 tons of manure which are responsible for nearly 5 kilotons of CO2 equivalent (Alherbawi et al., 2021a). Furthermore, Qatar is the world's sixteenth largest producer of dates. As of 2010, there were 581,336 date palm trees growing on an area of 2,469 ha, with a total date production of 21,491 mt. It is the most important fruit tree in the country, accounting for 7.2% of total agricultural production (Muhammed et al., 2015).
Considering the above, this study explores the potential of biochar as a waste remediation strategy for both plastic and biomass waste in combination and evaluates its potential within an energy, water, and environment nexus methodology considering a Qatar case study. The associated emissions of biochar production from cradle to grave were evaluated using different local biomass feedstocks such as date pits and manure mixed with plastic wastes (LDPE and HDPE). In addition, the potential of biochar's carbon sequestration was evaluated, as well as its potential for water saving when applied to soil. Two optimization models were developed to select the optimal biomass blends that could lead to the lowest biochar production cost and lowest emissions, as well as to identify the optimal energy and water sources to run the process at lowest cost and emissions. Economic analysis was conducted to identify the maximum maximizing carbon sequestration in correspondence to the lowest possible cost. The following section highlights the background of the study and related literature prior to conducting the necessary analysis to complete the objectives.
2. Co-pyrolysis of biomass and plastic
Global efforts to reduce carbon emissions have recently shifted the focus on carbon sequestration via biochar as an effective strategy that can be used to mitigate climate change. Minx et al. conducted an extensive review of the literature on negative emission technologies (NETs), analyzing a total of 2,900 publications. Of these, biochar was the most researched topic (8.7%), while forest carbon sequestration (6.6%) and soil enhancement (4.3%) were the other notable mentions in the top 19 keywords (Minx et al., 2017). Additionally, most of these topics were interrelated. Understandably, biochar tops the list of research when it comes to negative emission technologies (NETs) as biochar-based carbon management networks (BCMNs) serve the dual purpose of sequestering carbon in a stable biochar form by transferring potential carbon emissions from the atmosphere into the ground, while also providing additional benefits to the soil through various complex interactions between the biochar and the soil. Thus, BCMNs can achieve negative emissions through carbon sequestration via biochar and reduce the usage of fuel sources derived from fossil fuels (Belmonte et al., 2019). Furthermore, the use of biomass in the production of bioenergy with CO2 capture and storage/utilization (BECCS/U) through its CO2 negative emission capacity is well thought-out as a principal component of global mitigation strategies as per what was decided in the Paris climate change agreement (Babel, 2018; Shahbaz et al., 2021).
Biomass gasification and pyrolysis are advanced and frequently used methods for producing syngas, charcoal, and liquid fuels. However, due to a lack of study on the optimal composition of biochar material, industrial applications of biochar as a soil amendment agent are limited (Ahmad et al., 2021). Recent research has focused on blending biomass with plastic material to make biochar that is effective for a variety of uses through the co-pyrolysis process (Iftikhar et al., 2019). Co-pyrolysis of various types of plastic and biomass feedstocks reduces the economic cost of production, enhances the process's convenience, improves its efficacy and efficiency in creating valuable products, and reduces waste creation (Liew et al., 2021). Critically, co-pyrolysis may be a viable means of waste management, resulting in overall waste volume reductions, sparing land from being used as landfills, lowering waste management and treatment costs, and thus solving subsequent environmental problems caused by waste dumping in landfills, all while providing an efficient and alternative source of energy (Garforth et al., 2004; Abnisa et al., 2011). The co-pyrolysis of biomass and plastics is extremely advantageous to the environment since it does not only reduce the amount of plastic waste while converting it into reusable energy, but it also allows for the replenishment and replacement of chemicals and fossil fuels (Aboulkas et al., 2008; Zanella et al., 2013). The major point of the study is the synergistic effect of the interaction between the interacting elements in the mixed feedstock. Co-pyrolysis is a method of combining two processes. Many factors influence it, including feedstock type, blend ratio, contact between the two components, heating and temperature rates, the nature of the catalyst, process duration, and the stabilization or removal of volatile substances that form during the process (Johannes et al., 2013). As a result of its efficient performance and cost-effectiveness, co-pyrolysis of biomass and plastic feedstock is an important area of research for the energy industry (Al-Rumaihi et al., 2022a).
Carbon sequestration using co-pyrolysis technology has been studied for different biomasses and plastic types in different regions depending on their availability. Dinesh et al. studied carbon sequestration by pyrolyzing biomass waste including rice husk and corn stover. When the biochar produced was applied to the soil, it increased soil fertility while also increasing eggplant crop growth. Furthermore, carbon mitigation was accomplished because the biochar stayed stable in the soil, resulting in longer-term carbon sequestration. Both chars can be utilized to sequester carbon and as soil additives (Mohan et al., 2018). Qiushuang et al. conducted a life cycle assessment study to investigate the carbon sequestered and the environmental benefits of biochar. The results demonstrated that converting 1 t of crop residues into biochar could sequester around 920 kg CO2 equivalent (Yang et al., 2021). A meta-analysis model was used to determine carbon reduction by increasing rice product when applied to paddy soil (Bu et al., 2022). However, the full reduction potential of biochar application is still not clear as long-term field studies are required to validate the forecasts. Although that there are several studies that has investigated carbon sequestration potential for several feedstocks, none of them were as accurate in terms of the results as there was always limitations and uncertainties. Moreover, the unique blend of proposed feedstock in this study was not considered which needs further investigation considering waste availability in Qatar. However, it is considered as one of the limitations due to the need of further lab testing to be done to understand the synergies between the proposed mixture.
2.1. Energy-Water-Carbon-Waste nexus
The Energy-Water-Carbon-Waste (EWCW) nexus integrates the representative subsystems to achieve productivity and the sustainability of resources. However, optimizing this nexus requires the identification of the synergies and trade-offs within the system, which can be achieved by research, decision-making tools, and modeling to ensure the robust governance of systems, motivated from the Energy-Water-Food (EWF) nexus that can support the EWCW nexus (Mannan et al., 2018; Govindan and Al-Ansari, 2019; Namany et al., 2019). The EWF nexus is a decision-making concept, mainly used to ensure effective management of the three resources, while harnessing the intrinsic linkages between them (Namany et al., 2021). Therefore, the current study suggests a novel methodology that applies an EWCW nexus approach to influence decision-making within the waste and energy sectors to ensure sustainable resource use.
A study conducted by Feng et al. (2020) the issues raised when modeling EWFN systems via different platforms and refers to different case studies conducted across countries or regions (Feng et al., 2020). Wang et al. (2018) performed a study to identify the potential of Energy-Water-Food (EWF) nexus through the pyrolysis, incineration, and gasification of different categories of wastes including agricultural waste, wastewater, and municipal solid waste (Stoyle, 2011). The study concluded that co-pyrolysis is efficient for the generation of sustainable energy from waste. AlNouss et al. (2021) presented a framework that maximized the generation of biochar from the co-pyrolysis of biomass in an EWF resource system (AlNouss et al., 2021). Similarly, Belmonte et al. (2017) investigated biochar's potential for carbon sequestration when applied to the soil, linking it to an Energy-Water-Agroecosystems nexus. Another study was carried out to review and address the strategies to be implemented for carbon management, while identifying the areas to implement a large-scale biochar system (Belmonte et al., 2017). Nair et al. (2017) argued that although there are benefits when applying biochar to the soil, further research needs to investigate the large-scale application of biochar considering that its composition can vary depending on the type of feedstock used, parameters considered, and type of energy used (Nair et al., 2017).
The gaps in the current research indicate a need to develop a method to determine the carbon sequestration of biochar and the potential for biochar generation from different feedstocks, especially when the biochar is applied to arid regions such as Qatar, considering its poor soil conditions. Hence, this study aims to calculate the carbon sequestration and negative emissions when pyrolyzing a mixture of plastic feedstock (LDPE and HDPE) and a mixture of biomass (date pits and camel manure). Furthermore, this study elaborates on the EWCW nexus, and does so for a case study in the State of Qatar as described below.
2.2. Biochar and negative emissions
Many studies have evaluated the effectiveness of carbon sequestration via biochar as a potential scalable method to achieve negative emissions. Smith evaluated the effectiveness of multiple NETs such as enhanced weathering, direct air capture, and carbon capture and storage via afforestation. These NETs were evaluated regarding the factors of cost, water requirements, land requirements, and energy requirements. This study has proven that carbon sequestration through the addition of biochar to soil can reduce carbon emissions equivalent to 0.7 Gigatons of carbon equivalent per year. Additionally, BCMNs display more advantages in terms of cost, water, land, and energy requirements when combined with other methods of carbon capture and storage, such as afforestation, with a few limitations including reversibility and sink saturation (Smith, 2016). Abdelaal et al. (2021) evaluated the carbon sequestration and soil amendment potential of biochar produced from orange peels, concluding that biochar could improve sustainable cultivation in areas with sandy soils. Additionally, the study found that profitability increased with an increase in plant size (Abdelaal et al., 2021). Agegnehu et al. (2016) evaluated the effect of biochar on reducing carbon emissions and improving soil fertility as well as the yield of maize crop. The study revealed that the application of biochar enhanced the content of C, N, and P in the soil, improved water retention, and other indicators of crop health, such as leaf chlorophyll, which in turn had a positive effect on the yield of maize crop. Also, while biochar-amended soil displayed greater levels of CO2 and N2O emissions compared with soils treated with other amendments, the overall levels of CO2 and N2O emissions reduced with time, with biochar-amended soil displaying the least number of emissions. The study concluded that biochar had a positive impact on soil fertility, soil nutrients, and crop yield, while also reducing overall carbon emissions, as exhibited by other amendments (Agegnehu et al., 2016).
Other studies have evaluated the scale of negative emissions that can be achieved via BCMNs. Stoyle evaluated the potential of mitigating carbon emissions by converting 2,674 tons of agricultural waste into biochar (Stoyle, 2011). The biomass consisted of rice, cob, peanuts, manure, and husks. The study revealed that carbon sequestration via biochar can reduce CO2 emissions by 1.2 billion tons, while the overall level of CO2 emissions in 2009 was 34.06 billion tons, thus indicating that biochar sequestration can play a small but significant role in reducing carbon emissions. Shahbaz et al. stated that pyrolysis is a mature technology that could lead to carbon savings up to 2.2 Gt CO2/year by 2020-2050. Similarly, Timmons conducted a study to evaluate the potential of carbon sequestration via biochar in the state of Massachusetts, USA. Accordingly, an annual estimated sustainable supply of 267,253 tons of biochar could mitigate 0.91% of the total annual emissions of Massachusetts, while improving the yield of crops and thus revenue for the farmers. Belmonte et al. stated that to maximize the system-wide benefits of biochar application, biochar must be customized to take advantage of the differences in soil quality.
2.3. Energy-Water-Carbon-Waste nexus: a Qatar case study
At a local level in Qatar, government reports have indicated that about 7.6 million tons of municipal solid waste (MSW) was produced in 2019 (Environmental Statistics, 2019). These insights correspond to a daily generation of 2.5 kg per capita per day or almost 900 kg per capita per year. Around 60% of the total solid waste generated, which is about 300 kg of MSW, is organic material. Some of this is composted in the Municipal Solid Waste Treatment Center (MSWTC), however, above 80% is landfilled in the Um-AlAfai landfill (Al-Maaded et al., 2012). Furthermore, it has been estimated that approximately 140 Gt of biomass waste is produced worldwide, which has the potential to produce 18,000 MWs of energy (Liew et al., 2021). The State of Qatar, which produced 8 million tons of dates in 2019, produced 800,000 tons of waste in the form of date pits (Al-Rumaihi et al., 2022b). Furthermore, camels are also of a high importance to Qatar economically and socially. In Qatar, there are 127,000 camels; a well-grown camel excretes 0.95 tons of manure every year, resulting in 126,000 tons of camel manure annually (Al-Rumaihi et al., 2021; Parthasarathy et al., 2021).
The rapid increase in the volumes and varieties of MSW produced in Qatar is due to factors such as the increasing migrant population, improved public life quality, and ongoing construction activities. Additionally, Qatar's arid climate results in a greater production of animal waste compared to plant residue (Al-Rumaihi et al., 2021). Currently, most solid waste, namely, HDPE and LDPE plastics, date pits, and manure are dumped into landfills (Al-Maaded et al., 2012). As such, this study is unique in terms of its major goal, which is to improve water and food security by utilizing the value-add obtained from recycled materials in the form of biochar. The State of Qatar is also challenged by severe water shortages due to its arid climate and infertile lands, with the predominant soil types in Qatar being coarse sand, sandy loam, and sandy clay loam, and most of the cultivation occurring on clay loam soil. There are a multitude of problems associated with this soil type as it relates to agriculture, including low levels of nutrition, high levels of salinity, and a poor water infiltration rate (Hassan, 1978). The application of biochar can improve soil quality, reduce soil acidity and the emissions of greenhouse gases (GHG), prevent nutrient leaching, improve soil fertility, and increase the soil's water retention capacity to reduce irrigation demand by 37%, which is crucial for Qatar's sandy loamy soil type. The capture and utilization of carbon is an important strategy to mitigate carbon emissions and promote carbon sequestrations. This can be achieved in five ways: by converting carbon to useful by-products, oil recovery, the direct utilization of carbon, biological conversion, and mineral carbonization (Ghiat and Al-Ansari, 2021). The current study suggests a novel optimization framework that adopts an EWCW nexus approach to influence decision-making within the food and energy sectors in Qatar to ensure sustainable resource use. The data used in this study is drawn from several past pieces of literature. The biochar will be produced from several types of solid waste unique to Qatar and many countries in the middle eastern region having similar climatic conditions, including date pits and waste animal manure, in addition to HDPE and LDPE plastics.
3. Methodology
Figure 1 shows the system boundaries of the whole pyrolysis process starting from the production or the collection of waste including plastic (LDPE and HDPE) and biomass waste (date pits and camel manure) to the use of biochar in the soil (cradle to grave). After collection, the waste mixture is transported to the pyrolysis plant where it is further treated. The distance from collection point to the plant is assumed to be 100 km. The feedstock undergoes a pre-processing stage in which it is dried and shredded. The pyrolysis of feedstock occurs in the next stage in the absence of oxygen. The final products of the pyrolysis are bio-oil, syngas, and biochar, as illustrated in Figure 1. Biochar can then be transported to be sold or to the final user with an estimated 100 km distance. Currently, most of these solid wastes are dumped into landfills, which includes about 700,000 tons of plastic (Kabli et al., 2022), 3,000 tons of date pits (Johnson et al., 2015), and 126,000 tons of camel manure per year (Al-Rumaihi et al., 2021; Parthasarathy et al., 2021).
Figure 1. Co-pyrolysis process flow diagram.
The scope of this study is to calculate the carbon and water footprint to calculate carbon sequestration and net emissions. The energy requirements considered are for the production of plastic and the energy used to desalinate water used in the manufacturing of plastic. For the biomass feedstock, the water requirements for irrigation and camel consumption (drinking) were considered as well as the energy used to desalinate the seawater using multi-stage flash (MSF) technology. The energy used to transport feedstock and for the pre-treatment and pyrolysis processes were also counted. Carbon emissions for pyrolysis by-products were also allocated. This research optimizes the biochar production based on different feedstock, water, and energy sources, considering the minimal net associated emissions and levelized costs. Economic analysis was carried out as a last step in this study to determine the lowest cost of energy and water sources used. The scope of emissions analysis includes the process' direct emissions and all emissions associated with the energy and water provisions for the process from cradle to grave, as well as the carbon sequestration and water-saving potential of produced biochar. Data pertaining to waste generation in Qatar were collected from statistics published by the government of Qatar (Economic Statistics, 2018).
The ultimate and proximate analysis of the proposed feedstock was collected from the literature as detailed in Table 1 below. The models could accommodate different compositions. Average values were used in this case study.
Table 1. Elemental analysis of proposed feedstock.
3.1. Carbon footprint estimation
3.1.1. Water-associated emissions
At the biomass processing level, the embodied water footprint of the biomass was calculated using mass allocation for date pits and camel manure and using economic allocation for LDPE and HDPE.
Both date pits and manure are types of waste generated within the same process; therefore, a mass-allocation was considered as the most representative allocation to distribute the environmental burdens amongst the process products and wastes. However, for waste plastics (LDPE/HDPE), economic allocation was considered, where they are collected after the end-use of the product and not during the manufacturing stage. The below equation was used to determine the water-associated emissions using economic allocation:
Data were collected from the literature. Table 2 shows the data used and the allocation factor for each feedstock.
Table 2. Mass and economic allocation for proposed feedstock.
Subsequently, the energy required for the provision of water for different water-supplying sources was calculated. For the baseline scenario for the state of Qatar, the multi-stage flash (MSF) desalination technique as the source of water and natural gas (NG) as the source of energy were considered. To desalinate 1 m3 of water using a NG-based power plant, 11.4 MJ is required, which emits around 1.81 kg CO2-e/m3 (Kamal et al., 2019). However, when reverse osmosis (RO) and wastewater treatment (WWT) are considered as the source of water for the other scenarios, the associated energy footprint drops to 10.8 and 3.36 MJ/m3, respectively (Alherbawi et al., 2021b).
3.1.2. Energy-associated emissions
The energy requirement for the production and application of biochar covers the pre-processing stage (fuel for biomass transportation to the biorefinery), processing stage (power and heat supply for drying, grinding, and pyrolysis), and post-processing stage (fuel for biochar transportation to the field). At the pre-processing and post-processing stages, both the raw biomass/plastics and produced biochar are assumed to be transported over a distance of 100 km using diesel lorries. The fuel consumed over each trip was adapted from the literature as a function of weight loaded and distance traveled, while the transportation-associated emissions were calculated using the emission factor for diesel and the amount consumed (Kristensson et al., 2004). Transportation was assumed to be 100 km from the waste collection area to the pyrolysis plant. Additionally, the transportation of the final biochar product from the plant to the end user or agricultural farms was also assumed to be 100 km.
At the biomass processing stage, the carbon footprint was determined based on the energy required to dry, grind, and pyrolyze each feedstock, as well as the direct CO2 emitted during the process. Below, Equations 4 and 5 were used to determine the total amount of energy (power and heat) required (Cheng et al., 2020):
Required heat for drying:
Cp−water: specific heat capacity of water = 4.2 kJ/kg°C.
Cp−biomass: specific heat capacity of biomass = 1.25 kJ/kg°C.
ΔHvap: specific heat of water evaporation = 2.26 MJ/kg.
Required heat for pyrolysis:
Whereas the average power requirement for a rotary dryer is 0.483 MJ/kg (Hong et al., 2009) and the average power requirement to run grinding equipment is 0.256 MJ/kg (Onarheim et al., 2014). Different sources of energy were tested in this study including natural gas (NG), coal, diesel-based power plants, and solar energy photovoltaic plants (PV). The emission factors for these energy sources were 0.159 (Gurriaran et al., 2023), 0.285 (Karmaker et al., 2020), 0.260 (Al-Thani et al., 2020), and 0.011 kgCO2-e/MJ (Nawaz and Tiwari, 2006), respectively.
3.1.3. Process direct emissions
The direct emissions released through the pyrolysis process as part of the pyrogas was calculated based on existing product distribution prediction model (Neves et al., 2011; Pachauri et al., 2014). Carbon dioxide and methane are the key greenhouse gases released in the process. The global warming potential of methane is considered to be 25 times that of CO2 for a time scale of 100 years (Pachauri et al., 2014). Equations 6–9 were used to determine the pyrolysis products distribution and pyrogas composition (Neves et al., 2011).
Char yield:
where: “Y”ch, F is char yield with respect to biomass and “T” is the operating temperature (°C).
Pyrogas composition:
Whereas the CO2 composition in pyrogas was calculated through the following mass balance Equations 10–12:
Carbon balance:
Hydrogen balance:
Oxygen balance :
Finally, the total carbon footprint was calculated using Equation 13:
3.2. Carbon sequestration and saving
The carbon content of camel manure (CM) and date pits (DP) is 49%, and 51.6% respectively, while the carbon content of both, HDPE and LDPE are 60%. The higher the carbon content, the greater the carbon sequestration capacity (Al-Wabel et al., 2019; de la Cruz-Lovera et al., 2019; Erdogdu et al., 2019; Atienza-Martínez et al., 2020); this is because carbon can enhance the soil by increasing its water retention due to the nature of carbon being porous which will reduce water consumed for irrigation by increasing the soil service area, hence improving its carbon sequestration capacity. According to Timmons, the carbon sequestration capacity is 77% of the carbon content in the biochar yield, while according to Stoyle, carbon sequestration capacity is 100% of the carbon content in the biochar yield. The second method was used to take the best possible results for carbon sequestration (Timmons et al., 2017). Thus, the carbon sequestration rate was estimated as shown in Equation 14:
By multiplying the amount of CO2 sequestered by the biomass feed, the carbon sequestration (ton CO2/ ton biomass) can be obtained.
Furthermore, water is saved because of biochar application to soil due to the high water retention capability of char. Considering the water-associated emissions estimated in Section 3.1, saving water leads to the mitigation of associated emissions. Table 3 summarizes the calculations made to estimate the amount of water saved per ton of biochar used during the cultivation of date pits (Youssef et al., 2014). Biochar was assumed to be applied to soil covering a field of 2 × 2 meters for each individual tree. While the saved emissions are calculated using the same approach used in Sections 3.1 and 3.2.
Table 3. Water savings per biochar mass.
Net CO2 emissions were calculated using Equation 15:
3.3. Economic analysis
The economic analysis was conducted using Aspen Process Economic Analyser (APEA). Furthermore, the economic parameters assumptions inputs in APEA for the pyrolysis plant in Qatar are summarized in Table 4.
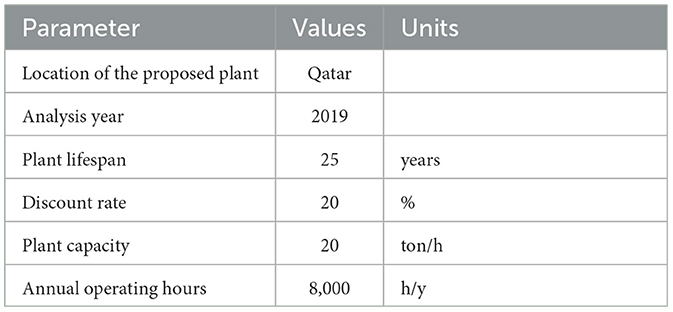
Table 4. Economic parameters.
For the capital expenses (CAPEX) presented in Equation 16, the key equipment cost was adapted from Humbird et al. (2011), scaled and inflated to the base year of analysis using the Chemical Engineering Plants Cost Index (CEPCI) through Equations 17 and 18, respectively (Alherbawi et al., 2021c). The remaining CAPEX components were expressed as percentages of the purchased equipment according to the guide of plant design and economics for chemical engineering. As for the operating expenses (OPEX) presented in Equation 19, the plant's labor requirements and costs were adapted from Wright et al. (2010). Nevertheless, the minimum selling price (MSP) of biochar was calculated using the standard levelized cost formula shown in Equation 20, which considers the yield of biochar, plant lifespan, operational cost, other by-products sales, and discount rate. The annual sales of by-products were subtracted from annual operational expenses within the equation of the levelized cost. A discount rate on 20% was considered in this study, which is considered high; however, this is necessary to manage all the uncertainties related to biofuels and petroleum industries (Alherbawi et al., 2021c).
As for the different energy and water supply scenarios, the utilities prices used for the economic evaluation are listed in Table 5.
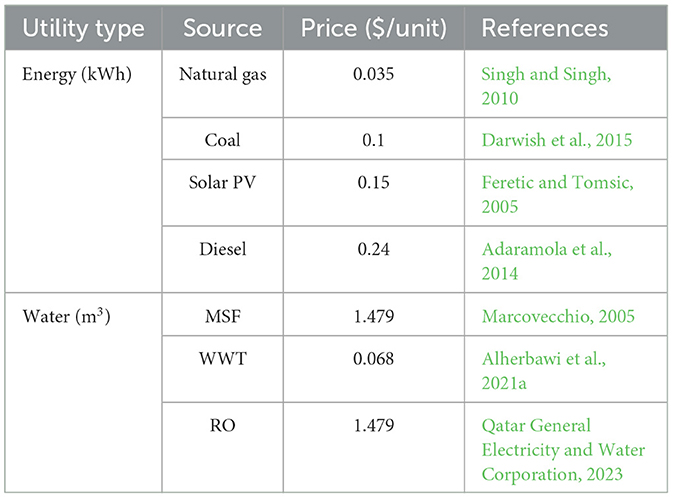
Table 5. Utilities prices for different energy and water sources.
It is important to note that solar PV was considered as a renewable source of energy because Qatar has a dessert and arid climate with a sunny whether most time of the week. It is the only source of renewable energy available in Qatar at the moment.
3.4. Optimization of biochar production
The optimization models were aimed at minimizing the net emissions associated with biochar production and minimizing its levelized production cost. The data obtained throughout Sections 3.1–3.3 were inserted into the optimization models. Two optimization scenarios were developed; the first was a multi-objective optimization, in which the two objective functions were solved simultaneously to select optimal biomass blend, considering single water and energy sources. The second optimization scenario solved each objective function independently; however, multi-biomass, water, and energy sources were considered. The following sub-sections further elaborate on the two models.
3.4.1. Multi-objective optimization model
In this model, multiple biomass sources were considered to produce biochar, including date pits, camel manure, HDPE, and LDPE. Natural gas was considered the source of energy supply, while MSF desalinated water was the water supply source. The model aimed to solve the following two objective functions shown in Equations 21 and 22:
(1) Minimizing net emissions:
(2) Minimizing biochar cost:
Constraints:
(Sum of blending ratios must be equal to 100%)
Xi ≥ 0
Decision variable:
Xi: blending ratio of biochar (i) (%).
Parameters:
Si: net carbon footprint of biochar (i) (t CO2/t biochar).
Ci: cost of biochar (i) ($/t biochar).
MATLAB software version R2018A was used to solve the model and define the optimal blending ratios that achieved the two objectives together, in which a multi-objective genetic algorithm tool (GA) was utilized to obtain an optimal solution. The methodology in which MATLAB tools work is based on selection operations that mimic genetic evolution. The system has a built-in algorithm that adjusts a set of solutions repetitively to identify the optimal solution. In every repeated stage, the GA selects randomly a narrow set of answer to be used as parents to produce set of solutions. After several sequential repetitions, the solutions are evolved to an optimal solution to meet the minimum requirements of all the objectives selected (Alherbawi et al., 2021b).
3.4.2. Single-objective optimization model
Considering the use of multiple feedstocks in this study, different sources of water were selected including wastewater treatment (WWT), the multi-stage flash (MSF) desalination technique, and reverse osmosis (RO). In addition, the usage of different energy sources was also considered in this optimization model including natural gas, coal, diesel, and solar PV.
Different energy and water supplies are associated with different associated emissions and costs; therefore, it is important to explore the different existing utility options to balance the environmental impact with the economic benefit. As such, the non-linear integer programming approach was used to determine the optimal biomass, energy, and water resources for the production of biochar, so that the environmental impact and costs are minimized, as presented in the following mathematical model. The two objective functions were solved independently using Excel:
(1) Minimizing net emissions:
Min
(2) Minimizing biochar cost-:
Min
Notations:
“i”, “j”, and “k” represent the types of biomasses, energy, and water sources, respectively, as follows:
Decision variables:
Bi: Selection of biomass type “i”.
EWj, k: Selection of energy (j) and water (k) supply combination.
Parameters:
PEi: Processing emissions released into atmosphere for biomass “i” (t CO2-e/t biochar).
TEi: Transportation emissions for biomass “i” delivery (t CO2-e/t biochar).
SCi: Sequestered carbon by biochar produced from biomass “i” (t CO2-e/t biochar).
ERi: Energy requirement for biomass “i” processing (GJ/t biochar).
WRi: Water requirement for biomass “i” processing (m3/t biochar).
ERk: Energy requirement for provisioning of water “k” (GJ/m3).
Efj: Emission factor for energy source “j” (t CO2-e/GJ).
LCj: Levelized cost of biochar produced from biomass “i”, excluding utilities cost ($/t biochar).
ECj: Cost of energy “j” ($/GJ).
WCj, k: Cost of water “k”, provisioned using energy “j” ($/m3).
4. Results and discussion
4.1. Carbon footprint
At the pre-processing stage, water-associated emissions and transportation emissions were the two key emissions sources considered. Water footprint was highest for date pits feedstocks due to irrigation requirements. In addition, the emissions from each feedstock were approximately identical but the main reason behind the different values was the amount of feedstock transported, which was based on the amount of each waste type generated per year. Figure 2 represents the total carbon emissions from water use and transportation for each feedstock studied.
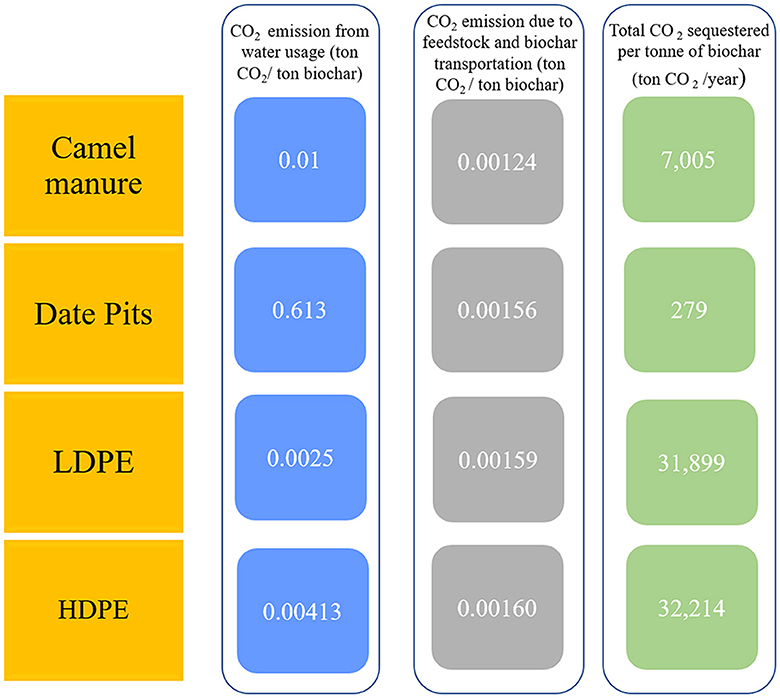
Figure 2. Biomass embodied emissions due to water use and transportation.
At the processing stage, camel manure feedstock undergoes a process of drying, unlike the date pits, LDPE, and HDPE, where the moisture content is almost close to zero. Camel manure feedstock contains a high percentage of moisture, which is why it needs to be dried first before it enters the grinder. Once the feedstock is dried then it is ground and pyrolyzed, where electricity is required to run the equipment and heat is supplied in the pyrolysis stage for the breakdown of the biomass. Considering the amount of feedstock generated per year and using Equations 1 and 2, the total amount of energy required for biomass processing was calculated as shown in Figure 3. It is evident that the highest amount of energy was due to the heat supply required during the pyrolysis process, followed by the electricity requirement in the pyrolyzer to mix the feedstock. The total amount of energy was highest for camel manure feedstock, which is utilized in the drying process. Figure 4 shows the total tons of CO2-e emissions due to the electricity usage for each feedstock per ton of biochar produced. The highest emissions were associated with camel manure feedstock and the lowest was for date pits due to a slight decrease in the amount of electricity and heat required during the pyrolysis process. The total CO2-e produced for the whole process was determined, which includes the feedstock embodied emissions, transportation, production requirements, processing, and emissions from water usage and desalination.
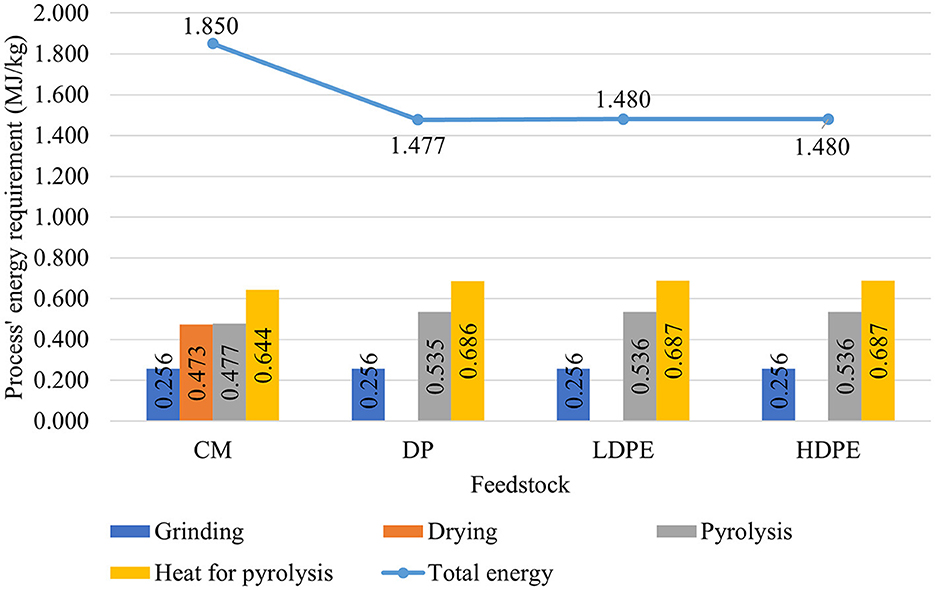
Figure 3. Energy requirements during the pyrolysis process.
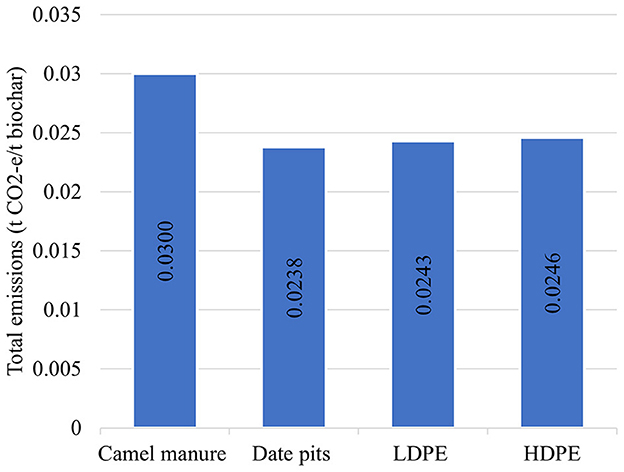
Figure 4. Total carbon emission from feedstock processing and pyrolyzing.
4.2. Carbon sequestration and saving
Figure 5 emphasizes the total carbon emissions, carbon sequestration, savings, and the net emissions. The total emissions were highest for the date pits feedstock, due to the energy required to desalinate the water used during irrigation to produce dates. Moreover, CO2 sequestration was highest for plastic feedstocks due its high carbon content, resulting in carbon-rich biochar which exhibits high water retention, and therefore reduces water and energy requirements. The net emissions were negative for plastic feedstocks which is also a good indication that the biochar produced from plastic saves more carbon than the total emissions from the whole process. The net carbon footprint of the biochar from camel manure approached zero, which represents a carbon-neutral biochar. However, date pit biochar was still far from achieving carbon neutrality due to the high-water requirements at the biomass provisioning stage.
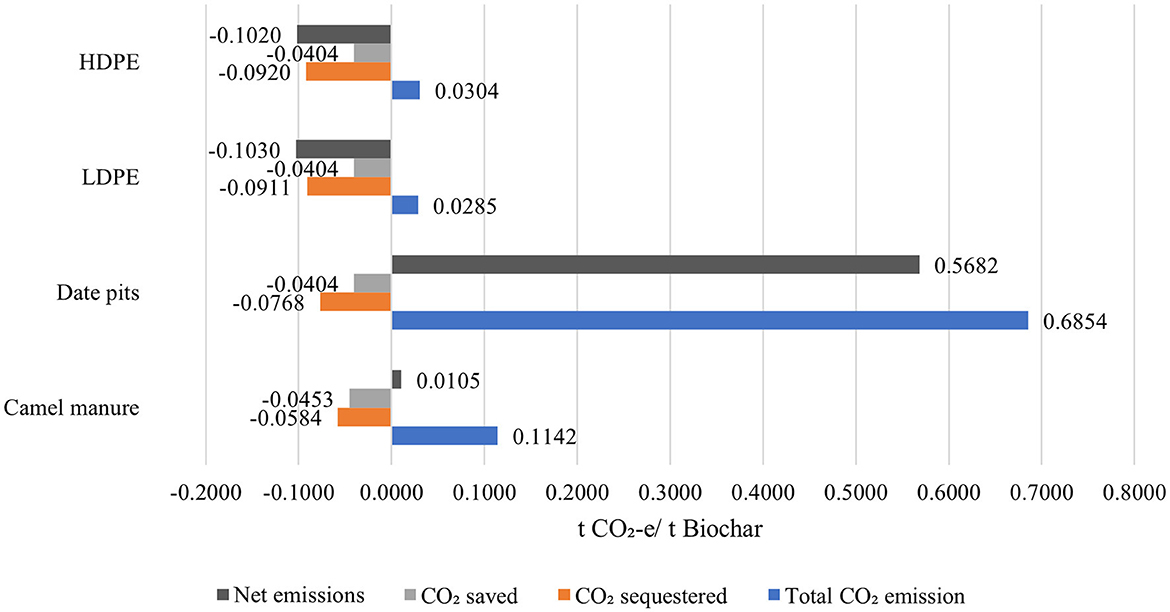
Figure 5. Carbon emission, sequestration, savings, and total net emissions for each feedstock.
4.3. Optimal biomass blend
In the first optimization model, the MATLAB solver proposed 16 blending ratios of biochar from different feedstocks to satisfy the two adopted objectives: lowest net emissions and lowest biochar cost, as shown in Table 6 and Figure 6. In terms of the net carbon emissions, Solution no. 1 revealed the lowest overall emissions (0.167 t CO2-e/t biochar), which is achieved with a blending ratio of 11.1% camel manure, 44.4% of LDPE and 44.4% HDPE. While date pits have been excluded.
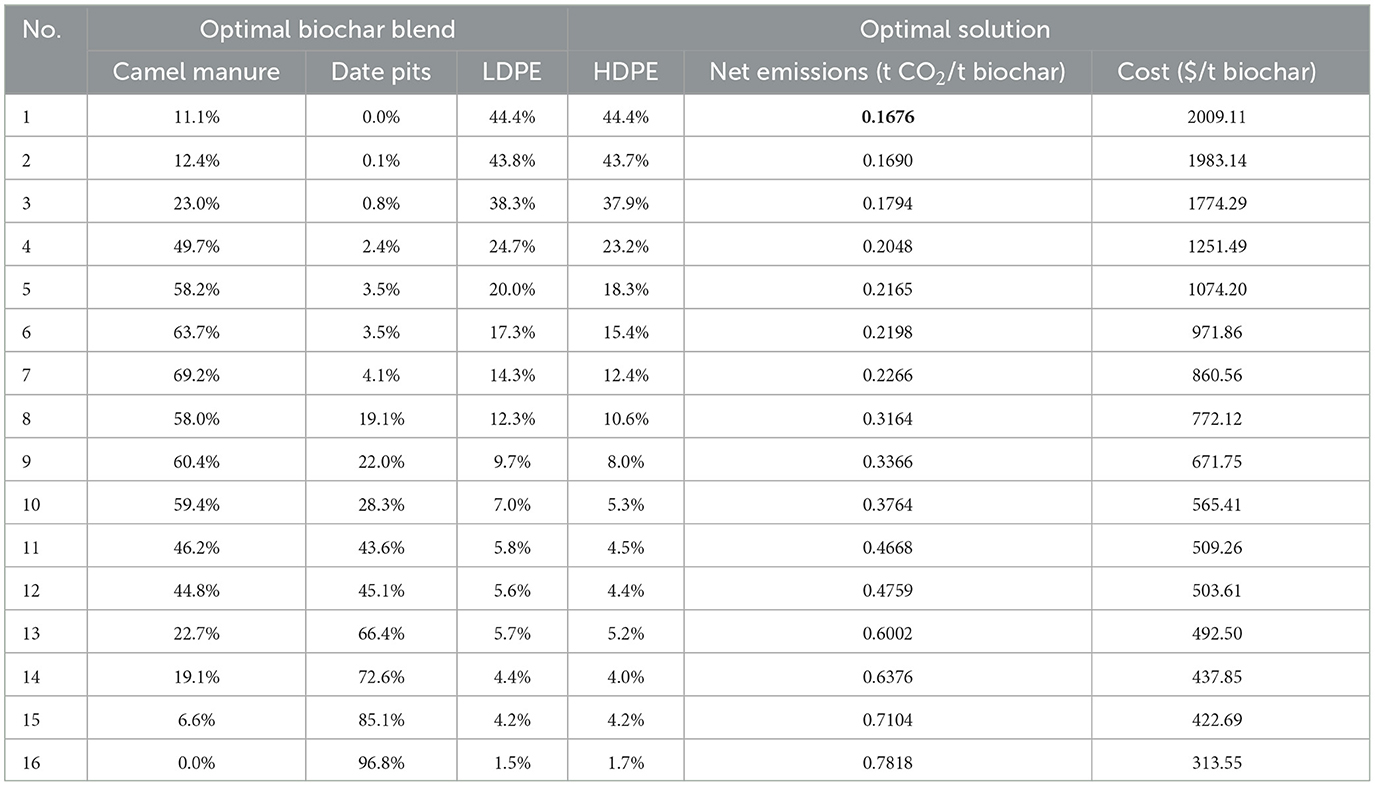
Table 6. Optimal biochar blends and their corresponding optimal solutions.
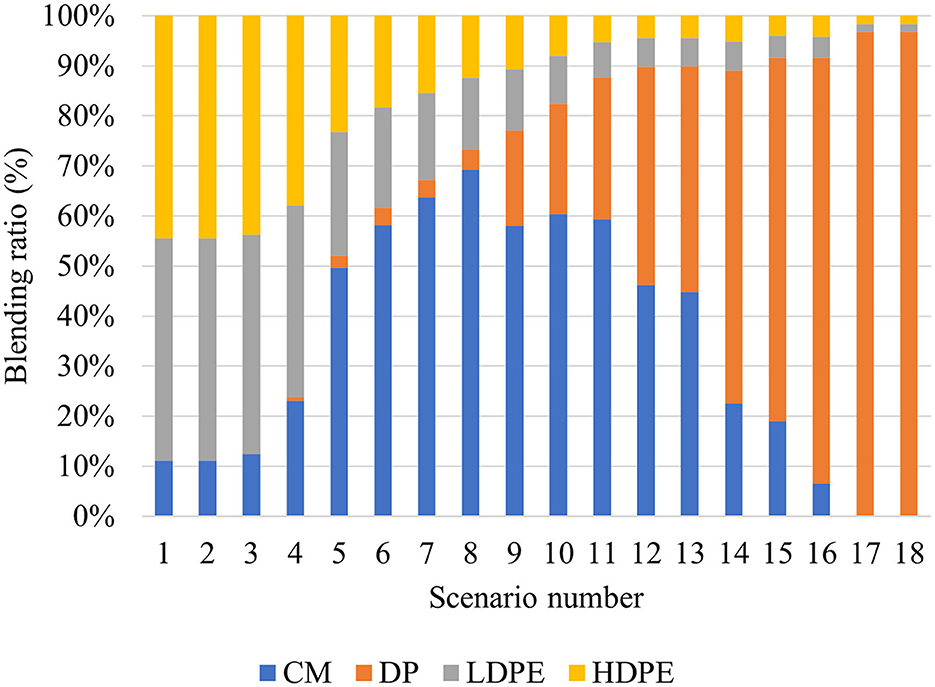
Figure 6. Optimal blends (%) for plastic and biomass feedstock biochar.
The higher the carbon content in the feedstock, the highest the carbon sequestration when the biochar is applied to soil, which explains of the high carbon sequestration in solution 1. However, solution 16 represents the best solution to achieve lowest biochar costs (313.5 $/t), which is achieved at a biomass blending ratio of: 96.8% date pits, 1.5% of LDPE and 1.7% HDPE. The solutions with high percentages of date pits in the mixing ratios were the most cost feasible ones especially solution no. 15 as far as economic factor is concerned.
Through the solving process' iterations, the solver performs a trade-off between the two objectives, both objectives are partially met with a different extent in each run, as it can be noticed in the pareto front presented in Figure 7. As an average solution, 0.39 t CO2-e of net emissions and 940.8 $/t of biochar were achieved with a blending ratio of 34.2% camel manure, 32.8% date pits, 16.9% LDPE, and 16.1% HDPE.
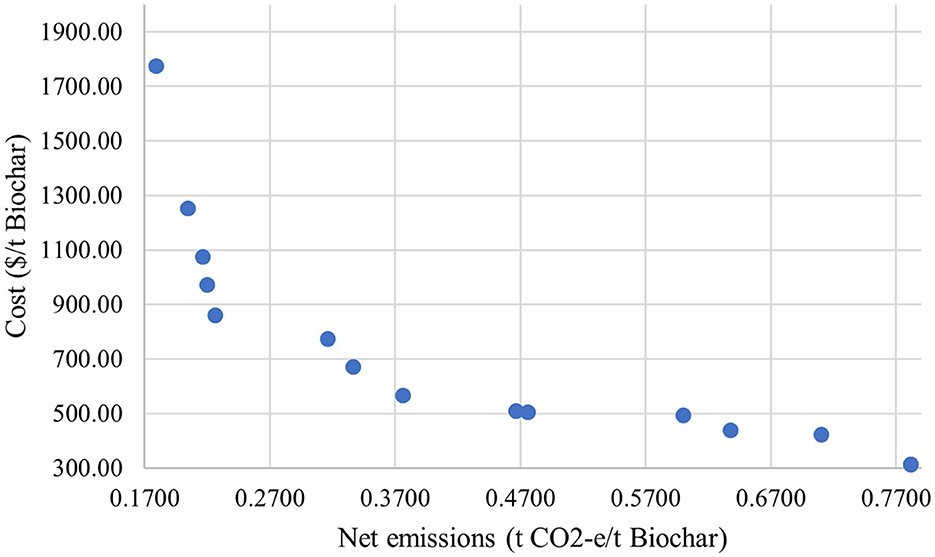
Figure 7. Pareto front of the two-objective optimization model.
4.4. Optimal biomass, energy, and water resources
In the second optimization model, the optimal combination of biomass, water, and energy resources for biochar production was determined, based on the same two objectives (minimum net emissions and minimum costs). However, in this model, the functions are solved separately using the non-linear integer programming method in Excel. For objective 1, several biomass-water-energy supply scenarios were evaluated in terms of their associated net carbon footprint, as presented in Figure 8.
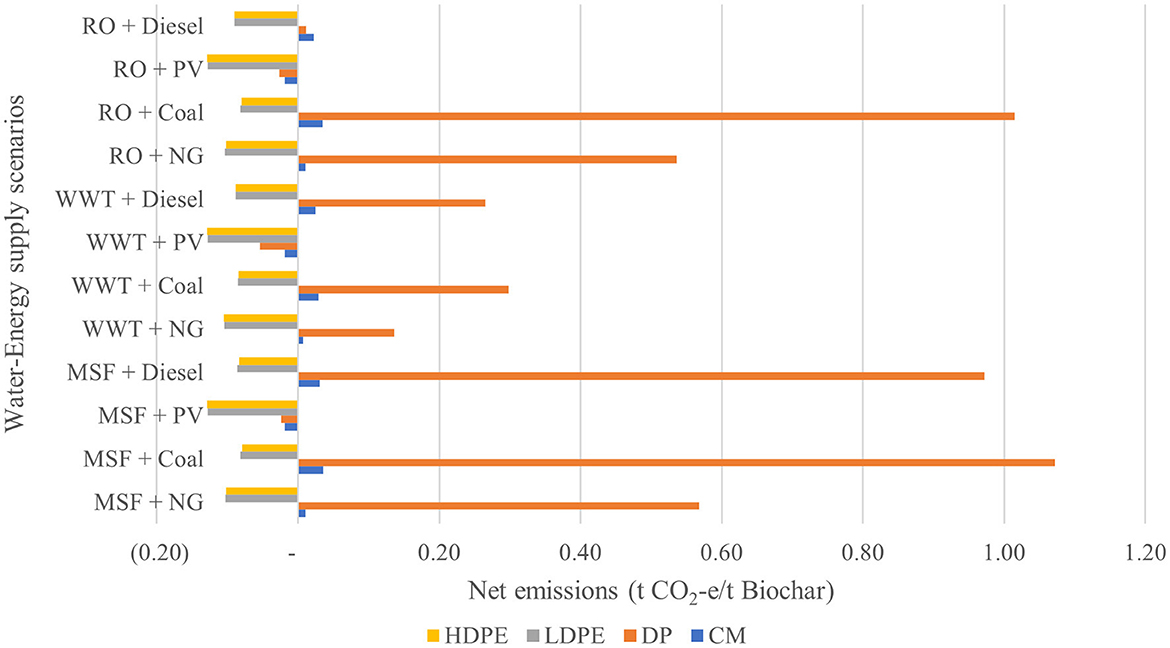
Figure 8. Associated net carbon emissions from several biomass–water–energy scenarios.
The optimal combination that achieves minimum net emissions was found to be the HDPE as feedstock, PV as the energy source, and WWT as the water source. This combination achieved negative emissions of - 0.1289 t CO2-e/t biochar. Net emissions in date pits scenarios were the highest for all energy-water supplying scenarios due to their high water consumption. However, coal and MSF techniques was the combination that generated the highest overall net emissions. Moreover, solar PV was the best source of energy where the least amount of emission were generated, while WWT was the best source of water in terms of its associated emissions for all biomass feedstocks. HDPE and LDPE achieved negative net emissions in all scenarios of energy-water sources combination, whereas camel manure and date pits secured a negative emission status only when PV was used as the source of energy. Nevertheless, the second objective of this model optimized the biomass-energy-water sources combination based on economic performance (levelized cost of biochar). Economic analysis was conducted to determine the optimal biochar cost in correspondence to the different energy and water techniques used. Figure 9 represents the cost for different scenarios. Evidently, the optimal combination was found to be date pits as feedstock, natural gas as the source of energy, and WWT as the source of water. This combination achieved the lowest biochar cost of 245 $/t. The cost of solar PV was the highest although it was the best energy source in terms of carbon emissions. Diesel was the second highest source of energy in terms of cost followed by coal and natural gas.
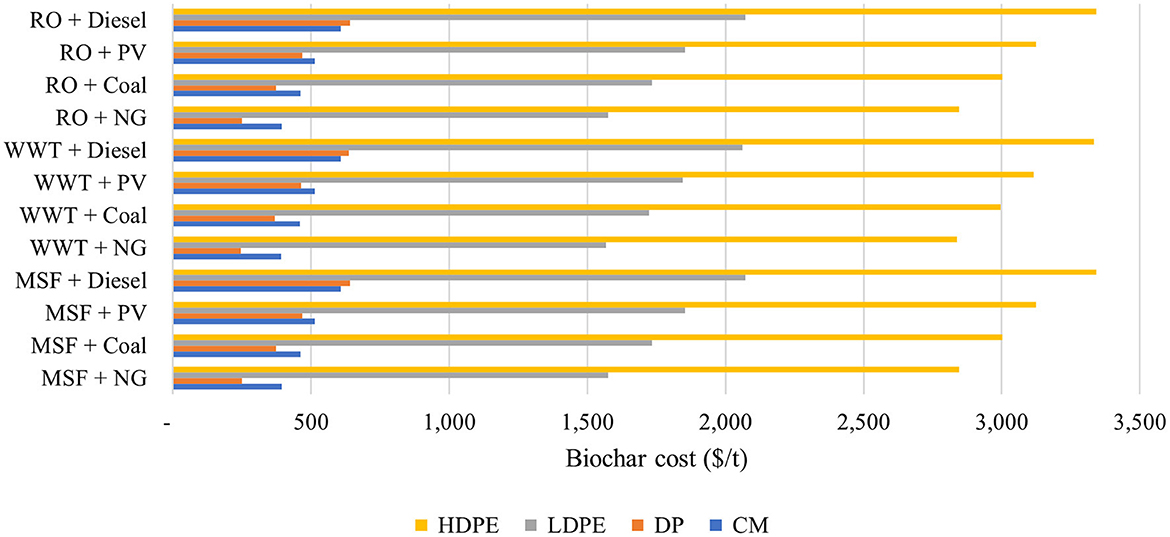
Figure 9. Biochar cost from different water–energy supply scenarios.
4.5. Biochar as a potential solution for negative emissions
The above results indicated that despite a reduction in the amount of energy created, the pyrolysis process could be optimized for maximum biochar production that will help to increase carbon sequestration potential by 2 to 5 times greater when biochar was applied to agricultural land (0.04 ton of CO2/ton of biochar). The carbon sequestration value was between 279 to 32,214 tons CO2/year. Most of these reductions in emissions (41–64%) were due to the carbon that is retained in the biochar, while the remaining savings accounted for offsets in the usage of fossil fuel, savings in fertilizer usage, and reduction in soil emissions.
Moreover, the carbon emissions associated with the production of energy from slow-pyrolyzed biochar lie in the range of 10% to 40% of the carbon emissions associated with the production of the same amount of energy from fossil fuels. Thus, this study concludes that slow pyrolysis conducted at a low temperature presents an energy-efficient method to produce bioenergy and biochar which, when the latter is applied to agricultural land, leads to greater reductions in overall emissions compared with the production of biochar to only offset the emissions from fossil fuels (Gaunt and Lehmann, 2008). Similarly, another study evaluated the carbon savings potential of an energy–water–food (EWF) nexus system that combined a system of solar cells and integrated carbon capture systems that were linked with pyrolysis infrastructure in an integrated NET system. The system resulted in a natural gas reduction, presenting maximum possible carbon savings of up to 7.8 × 10⁷ kg/year (Al-Ansari et al., 2017).
For Qatar, its total carbon dioxide emissions amounted to 109.34 million tons in 2019. Assuming, that the entire waste from date pits, camel manure, LDPE, and HDPE (assumed as 30% of the total plastic waste) can be converted into biochar, then about 117 tons of carbon emissions or 0.0001% of the total carbon emissions of Qatar in 2019 can be mitigated. Even though this seems like a very small number, biochar production by pyrolysis has multiple benefits that indirectly reduce emissions due to the reduction in landfills, recycling of plastic waste, creation of additional energy in the form of bio-oils that will reduce dependence on fossil fuel, and, most importantly, a reduction in fertilizer and water usage.
5. Conclusion
This study assessed the possibility for carbon sequestration using pyrolysis technology for plastic and biomass feedstock by applying an energy, water, and environment nexus approach. The objective of this study was to identify an efficient treatment method to dispose of plastic waste in an environmentally friendly way using a case study in Qatar. The study analyzed the carbon emissions and possible carbon savings from the pyrolysis of 1 kg feedstock of date pits, camel manure, high-density polyethylene (HDPE), and low-density polyethylene (LDPE).
The results showed that the total CO2 emissions for the whole waste management process including transportation of waste and biochar for each feedstock were 0.114, 0.685, 0.028, and 0.030 tons of CO2-e/t of biochar for camel manure, date pits, LDPE, and HDPE feedstock, respectively. When biochar was applied to the soil, the amount of carbon saved was 0.1036, 0.1172, 0.133135, and 0.1324 t CO2-e/ t biochar for each feedstock, respectively. When calculating the total net emissions, the results showed a 91 and 17% emission reduction for camel manure and date pits, respectively. Notably, the date pits feedstock percentage was almost carbon neutral. Moreover, negative emissions were obtained for LDPE and HDPE feedstocks, resulting in a net emission of 0.103 and 0.102 tons of CO2-e/ton of biochar.
Economic analysis was performed considering the best water desalination technology (MSF, WWT, or RO) and source of energy to use (coal, natural gas, solar PV, or diesel). The lowest cost was obtained when using WWT as a source of water and natural gas for energy and specifically for date pits feedstock because of the high water footprint utilized during irrigation.
In addition, two optimization studies were determined. On the one hand, a multi-objective optimization model was conducted using MATLAB software to serve two objectives of the best feedstock blend for maximum net emissions and lowest cost. Solution 1 revealed the best solution in terms of the lowest overall emissions (0.167 t CO2-e/t biochar), which were achieved with a blending ratio of 11.1% date pits, 44.4% of LDPE, and 44.4% HDPE. On the other hand, the second optimization model was a single objective model to verify the optimal combination of the biomass, water, and energy resources for biochar production. The optimal combination was found to be date pits as feedstock, natural gas as the source of energy, and WWT as the source of water. This combination achieved the lowest biochar cost of 245 $/t. Solar PV was the most expensive energy source used, although it was the best in terms of least carbon emissions. Diesel was the second highest source of energy in terms of cost followed by coal and natural gas.
One of the study limitations is that there are unseen synergetic effects and complex relationships between plastic and different types of biomasses when mixed; as a matter of fact, those synergies will impact the biochar final product, so it is not always a linear relationship. Moreover, in future studies, other renewable energy technologies can be studied regarding supplying the power and energy needed for treating the feedstock.
The quantities of feedstock used in this study is subject to change, hence the mixing ratio can change based on the availability of each feedstock. Future research can be conducted to investigate other biomass and plastic feedstock blends available in Qatar. Some of the challenges associated with carbon sequestration through biochar include the limited research on the effect of application rates and biochar types on different soil types and crops, the costs involved with the application of biochar, and uncertainties pertaining to the economics and agronomics of biochar. These bottlenecks are deterring the large scale uptake of biochar as a means of carbon sequestration. Economic incentives, additional research, and government initiatives should provide greater confidence to landowners and farmers to incorporate biochar production techniques to optimize energy production as well as enhance soil fertility, thereby leading to greater carbon sequestration and reductions in overall emissions.
Data availability statement
The raw data supporting the conclusions of this article will be made available by the authors, without undue reservation.
Author contributions
AA-R: conceptualization, methodology, formal analysis, and writing—original draft preparation. MA: conceptualization, methodology, formal analysis, and writing—review and editing. PP, GM, and HM: conceptualization, methodology, and writing—review editing. TA-A: conceptualization, methodology, project administration, supervision, writing—review and editing. All authors contributed to the article and approved the submitted version.
Funding
This publication was made possible by GSRA grant no. GSRA7-1-0407-20016 from the Qatar National Research Fund (a member of the Qatar Foundation).
Conflict of interest
The authors declare that the research was conducted in the absence of any commercial or financial relationships that could be construed as a potential conflict of interest.
Publisher's note
All claims expressed in this article are solely those of the authors and do not necessarily represent those of their affiliated organizations, or those of the publisher, the editors and the reviewers. Any product that may be evaluated in this article, or claim that may be made by its manufacturer, is not guaranteed or endorsed by the publisher.
Author disclaimer
The contents herein are solely the responsibility of the authors.
References
Abdelaal, A., Pradhan, S., AlNouss, A, and Tong, Y. (2021). The impact of pyrolysis conditions on orange peel biochar physicochemical properties for sandy soil. Waste. Manag. Res. 39, 995–1004. doi: 10.1177/0734242X20978456
Abdel-Rahman, M. A., Hassan, S. E. D., El-Din, M. N., Azab, M. S., El-Belely, E. F., Alrefaey, H. M. A., et al. (2020). One-factor-at-a-time and response surface statistical designs for improved lactic acid production from beet molasses by Enterococcus hirae ds10. SN. Appl. Sci. 2, 1–14. doi: 10.1007/s42452-020-2351-x
Abnisa, F., Wan Daud, W. M. A., and Sahu, J. N. (2011). Optimization and characterization studies on bio-oil production from palm shell by pyrolysis using response surface methodology. Biomass. Bioenerg. 35, 3604–3616. doi: 10.1016/j.biombioe.2011.05.011
Aboulkas, A., El Harfi, K., and El Bouadili, A. (2008). Non-isothermal kinetic studies on co-processing of olive residue and polypropylene. Energy Convers. Manag. 49, 3666–3671. doi: 10.1016/j.enconman.2008.06.029
Adaramola, M. S., Paul, S. S., and Oyewola, O. M. (2014). Assessment of decentralized hybrid PV solar-diesel power system for applications in Northern part of Nigeria. Energy Sustain. Dev. 19, 72–82. doi: 10.1016/j.esd.2013.12.007
Agegnehu, G., Bass, A. M., Nelson, P. N., and Bird, M. I. (2016). Benefits of biochar, compost and biochar–compost for soil quality, maize yield and greenhouse gas emissions in a tropical agricultural soil. Sci. Total. Environ. 543, 295–306. doi: 10.1016/j.scitotenv.2015.11.054
Ahmad, J., Patuzzi, F., Rashid, U., Shahabz, M., Ngamcharussrivichai, C., Baratieri, M., et al. (2021). Exploring untapped effect of process conditions on biochar characteristics and applications. Environ. Technol. Innov. 21, 101310. doi: 10.1016/j.eti.2020.101310
Akgün, H., Yapici, E., Günkaya, Z., Özkan, A., and & Banar, M. (2021). Utilization of liquid product through pyrolysis of LDPE and C/LDPE as commercial wax. Environ. Sci. Pollut. Res. 28, 45971–45984. doi: 10.1007/s11356-021-13999-z
Al-Ansari, T., AlNouss, A., Al-Thani, N., Parthasarathy, P., ElKhalifa, S., and Mckay, G. (2020). Optimising multi biomass feedstock utilisation considering a multi technology approach. Comput. Aided. Chem. Eng. 48, 1633–1638. doi: 10.1016/B978-0-12-823377-1.50273-1
Al-Ansari, T., Korre, A., Nie, Z., and Shah, N. (2017). Integration of greenhouse gas control technologies within the energy, water and food nexus to enhance the environmental performance of food production systems. J. Clean. Prod. 162, 1592–1606. doi: 10.1016/j.jclepro.2017.06.097
Alherbawi, M., McKay, G., Mackey, H. R., and Al-Ansari, T. (2021c). A. novel integrated pathway for Jet Biofuel production from whole energy crops: A Jatropha curcas case study. Energy Convers. Manag. 229, 113662. doi: 10.1016/j.enconman.2020.113662
Alherbawi, M., Parthasarathy, P., Al-Ansari, T., Mackey, H. R., and McKay, G. (2021a). Potential of drop-in biofuel production from camel manure by hydrothermal liquefaction and biocrude upgrading: a Qatar case study. Energy 232, 121027. doi: 10.1016/j.energy.2021.121027
Alherbawi, M., Parthasarathy, P., Al-Ansari, T., Mackey, H. R., and McKay, G. (2021b). Optimum sustainable utilisation of the whole fruit of Jatropha curcas: an energy, water and food nexus approach. Renew. Sustain. Energy. Rev. 137, 110605. doi: 10.1016/j.rser.2020.110605
Al-Maaded, M., Madi, N. K., Kahraman, R., Hodzic, A., and Ozerkan, N. G. (2012). An overview of solid waste management and plastic recycling in Qatar. J. Polym. Environ. 20, 186–194. doi: 10.1007/s10924-011-0332-2
AlNouss, A., Namany, S., McKay, G., and Al-Ansari, T. (2021). Applying a sustainability metric in energy, water and food nexus applications: a biomass utilization case study to improve investment decisions. Comput Aided Chem Eng. 46, 205–10. doi: 10.1016/B978-0-12-818634-3.50035-7
Al-Rumaihi, A., Alherbawi, M., Parthasarathy, P., Mackey, H. R., and McKay, G. (2022a). A techno-economic assessment of biochar production from date pits in the MENA region. 51, 805–810. doi: 10.1016/B978-0-323-95879-0.50135-1
Al-Rumaihi, A., Parthasarathy, P., Fernandez, A., Al-Ansari, T., Mackey, H. R., Rodriguez, R., et al. (2021). Thermal degradation characteristics and kinetic study of camel manure pyrolysis. J. Environ. Chem. Eng. 9, 106071. doi: 10.1016/j.jece.2021.106071
Al-Rumaihi, A., Shahbaz, M., Mckay, G., Mackey, H., and Al-Ansari, T. (2022b). A review of pyrolysis technologies and feedstock: a blending approach for plastic and biomass towards optimum biochar yield. Renew. Sustain. Energy Rev. 167, 112715. doi: 10.1016/j.rser.2022.112715
Al-Thani, H., Koç, M., Fountoukis, C., and Isaifan, R. J. (2020). Evaluation of particulate matter emissions from non-passenger diesel vehicles in Qatar. J. Air. Waste. Manag. Assoc. 70, 228–242. doi: 10.1080/10962247.2019.1704939
Al-Wabel, M. I., Usman, A. R. A., Al-Farraj, A. S., Ok, Y. S., Abduljabbar, A., Al-Faraj, A. I., et al. (2019). Date palm waste biochars alter a soil respiration, microbial biomass carbon, and heavy metal mobility in contaminated mined soil. Environ. Geochem. Health. 41, 1705–1722. doi: 10.1007/s10653-017-9955-0
Atienza-Martínez, M., Ábrego, J., Gea, G., and Marías, F. (2020). Pyrolysis of dairy cattle manure: evolution of char characteristics. J. Anal. Appl. Pyrolysis. 145, 104724. doi: 10.1016/j.jaap.2019.104724
Ayeleru, O. O., Dlova, S., Akinribide, O. J., Ntuli, F., Kupolati, W. K., Marina, P. F., et al. (2020). Challenges of plastic waste generation and management in sub-saharan Africa: a review. Waste. Manag. 110, 24–42. doi: 10.1016/j.wasman.2020.04.017
Babel, C. (2018). Technical Summary of Bioenergy Carbon Capture and Storage (BECCS). Available online at: https://www.cslforum.org/cslf/sites/default/files/documents/Publications/BECCS_Task_Force_Report_2018-04-04.pdf (accessed January 22, 2023).
Barker, J. C., Hodges, S. C., and Walls, F. R. (2002). Livestock Manure Production Rates and Nutrient Content. North Carolina: North Carolina Agricultural Chemical Manual.
Belmonte, B. A., Benjamin, M. F. D., and Tan, R. R. (2017). Biochar systems in the water-energy-food nexus: the emerging role of process systems engineering. Curr. Opin. Chem. Eng. 18, 32–37. doi: 10.1016/j.coche.2017.08.005
Belmonte, B. A., Benjamin, M. F. D., and Tan, R. R. (2019). Optimization-based decision support methodology for the synthesis of negative-emissions biochar systems. Sustain. Prod. Consum. 19, 105–116. doi: 10.1016/j.spc.2019.03.008
Boustead, I. (2005). Eco-Profiles of the European Plastics Industry. A Report Prepared for PlasticsEurope. Bruxelle: European Plastics Industry.
Bu, F., Nan, Q., Li, W., Bolan, N., Sarkar, B., Meng, J., et al. (2022). Meta-analysis for quantifying carbon sequestration and greenhouse gas emission in paddy soils one year after biochar application. Agronomy. 12, 3065. doi: 10.3390/agronomy12123065
Cheng, F., Luo, H., and Colosi, L. M. (2020). Slow pyrolysis as a platform for negative emissions technology: an integration of machine learning models, life cycle assessment, and economic analysis. Energy. Convers. Manag. 223, 113258. doi: 10.1016/j.enconman.2020.113258
Darwish, M. A., Abdulrahim, H. K., and Hassan, A. S. (2015). Realistic power and desalted water production costs in Qatar. New. Pub. Balaban. 57, 4296–4302. doi: 10.1080/19443994.2014.992977
de la Cruz-Lovera, C., Manzano-Agugliaro, F., Salmerón-Manzano, E., de la Cruz-Fernández, J. L., and Perea-Moreno, A. J. (2019). Date seeds (Phoenix dactylifera L.) valorization for boilers in the mediterranean climate. Sustain 11, 711. doi: 10.3390/su11030711
Dubdub, I., and Al-Yaari, M. (2020). Pyrolysis of mixed plastic waste: I kinetic. study. Materials 13, 1–15. doi: 10.3390/ma13214912
Erdogdu, A. E., Polat, R., and Ozbay, G. (2019). Pyrolysis of goat manure to produce bio-oil. Eng. Sci. Technol. an. Int. J. 22, 452–457. doi: 10.1016/j.jestch.2018.11.002
Feng, B., van Dam, K. H., Guo, M., Shah, N., Passmore, S., Wang, X., et al. (2020). Planning of food-energy-water-waste (FEW2) nexus for sustainable development. BMC Chem. Eng 2, 1–19. doi: 10.1186/s42480-020-0027-3
Feretic, D., and Tomsic, Z. (2005). Probabilistic analysis of electrical energy costs comparing: production costs for gas, coal and nuclear power plants. Energy Policy 33, 5–13. doi: 10.1016/S0301-4215(03)00184-8
Fuss, S., Canadell, J. G., Peters, G. P., Tavoni, M., Andrew, R. M., Ciais, P., et al. (2014). Betting on negative emissions. Nat. Clim. Change 4, 850–53. doi: 10.1038/nclimate2392
Garforth, A. A., Ali, S., Hernández-Martínez, J., and Akah, A. (2004). Feedstock recycling of polymer wastes. Curr. Opin. Solid. State. Mater. Sci. 8, 419–425. doi: 10.1016/j.cossms.2005.04.003
Gaunt, J. L., and Lehmann, J. (2008). Energy balance and emissions associated with biochar sequestration and pyrolysis bioenergy production. Environ. Sci. Technol. 42, 4152–4158. doi: 10.1021/es071361i
Ghiat, I., and Al-Ansari, T. (2021). A. review of carbon capture and utilisation as a CO2 abatement opportunity within the EWF nexus. J. Util. 45, 101432. doi: 10.1016/j.jcou.2020.101432
Govindan, R., and Al-Ansari, T. (2019). Computational decision framework for enhancing resilience of the energy, water and food nexus in risky environments. Renew. Sustain. Energy Rev. 112, 653–668. doi: 10.1016/j.rser.2019.06.015
Gurriaran, L., Tanaka, K., Bayram, I. S., Proestos, Y., Lelieveld, J., Ciais, P., et al. (2023). Warming-induced increase in power demand and CO2 emissions in Qatar and the Middle East. J. Clean. Prod. 382, 135359. doi: 10.1016/j.jclepro.2022.135359
Hassan, M. F. (1978). Agricultural development in a petroleum-based economy. Qatar. 27, 145–167. doi: 10.1086/451078
Hdpe-Hdpe Manufacturers (2022). Suppliers and Exporters on Alibaba.comHDPE. Available online at: https://www.alibaba.com/trade/search?fsb=yandIndexArea=product_enandCatId=andtab=andSearchText=HDPEandviewtype= (accessed December 11, 2022).
Hong, J., Hong, J., Otaki, M., and Jolliet, O. (2009). Environmental and economic life cycle assessment for sewage sludge treatment processes in Japan. Waste Manag. 29, 696–703. doi: 10.1016/j.wasman.2008.03.026
Humbird, D., Davis, R., Tao, L., Kinchin, C., Hsu, D., Aden, A., et al. (2011). Process Design and Economics for Biochemical Conversion of Lignocellulosic Biomass to Ethanol: Dilute-Acid Pretreatment and Enzymatic Hydrolysis of Corn Stover. doi: 10.2172/1013269
Iftikhar, H., Zeeshan, M., Iqbal, S., Muneer, B., and Razzaq, M. (2019). Co-pyrolysis of sugarcane bagasse and polystyrene with ex-situ catalytic bed of metal oxides/HZSM-5 with focus on liquid yield. Bioresour. Technol. 289, 121647. doi: 10.1016/j.biortech.2019.121647
Impact Hub (2019). Plastic: The Problem and Its Impact – Impact Hub. (2019). Available online at: https://impacthub.net/plastic-the-problem-and-its-impact/ (accessed March 7, 2022).
Johannes, I., Tiikma, L., and Luik, H. (2013). Synergy in co-pyrolysis of oil shale and pine sawdust in autoclaves. J. Anal. Appl. Pyrolysis. 104, 341–352. doi: 10.1016/j.jaap.2013.06.015
Johnson, D. V., Al-Khayri, J. M., and Jain, S. M. (2015). Introduction: date production status and prospects in Africa and the Americas. Date. Palm. Genet. Resour. Util 1, 3–18. doi: 10.1007/978-94-017-9694-1_1
Kabli, M. R., Ali, A. M., Inayat, M., Zahrani, A. A., Shahzad, K., Shahbaz, M., et al. (2022). H2-rich syngas production from air gasification of date palm waste: an experimental and modeling investigation. Biomass. Convers. Biorefinery. 1, 1–13. doi: 10.1007/s13399-022-02375-7
Kamal, A., Al-Ghamdi, S. G., and Koç, M. (2019). Role of energy efficiency policies on energy consumption and CO2 emissions for building stock in Qatar. J. Clean. Prod. 235, 1409–1424. doi: 10.1016/j.jclepro.2019.06.296
Karmaker, A. K., Rahman, M. M., Hossain, M. A., and Ahmed, M. R. (2020). Exploration and corrective measures of greenhouse gas emission from fossil fuel power stations for Bangladesh. J. Clean. Prod. 244, 118645. doi: 10.1016/j.jclepro.2019.118645
Kristensson, A., Johansson, C., Westerholm, R., Swietlicki, E., Gidhagen, L., Wideqvist, U., et al. (2004). Real-world traffic emission factors of gases and particles measured in a road tunnel in Stockholm, Sweden. Atmos. Environ. 38, 657–673. doi: 10.1016/J.ATMOSENV.2003.10.030
Ldpe-Ldpe Manufacturers (2022). Suppliers and Exporters on Alibaba.comLDPE. Available online at: https://www.alibaba.com/trade/search?fsb=yandIndexArea=product_enandCatId=andSearchText=LDPE (accessed December 11, 2022).
Liew, J. X., Loy, A. C. M., and Chin, B. L. F. (2021). Synergistic effects of catalytic co-pyrolysis of corn cob and HDPE waste mixtures using weight average global process model. Renew. Energy 170, 948–963. doi: 10.1016/j.renene.2021.02.053
Lopez-Aguilar, J. F., Sevigné-Itoiz, E., Maspoch, M. L., and Peña, J. (2022). A. realistic material flow analysis for end-of-life plastic packaging management in Spain: data gaps and suggestions for improvements towards effective recyclability. Sustain. Prod. Consum. 31, 209–219. doi: 10.1016/j.spc.2022.02.011
Mannan, M., Al-Ansari, T., Mackey, H. R., and Al-Ghamdi, S. G. (2018). Quantifying the energy, water and food nexus: a review of the latest developments based on life-cycle assessment. J. Clean. Prod. 193, 300–314. doi: 10.1016/j.jclepro.2018.05.050
Marcovecchio, M. G. (2005). Optimization of hybrid desalination processes including multi stage flash and reverse osmosis systems. Desalination. 182, 111–122. doi: 10.1016/j.desal.2005.03.011
Mekonnen, A. Y. H. (2011). The green, blue and grey water footprint of crops and derived crops products — University of Twente Research Information. Hydrol. Earth. Syst. Sci. 15, 1577–1600. doi: 10.5194/hess-15-1577-2011
Minx, J. C., Lamb, W. F., Callaghan, M. W., Bornmann, L., and Fuss, S. (2017). Fast growing research on negative emissions. Environ. Res. Lett. 12, e5. doi: 10.1088/1748-9326/aa5ee5
Misra, A. K. (2014). Climate change and challenges of water and food security. Int. J. Sustain. Built. Environ. 3, 153–165. doi: 10.1016/j.ijsbe.2014.04.006
Mohan, D., Abhishek, K., Sarswat, A., Patel, M., Singh, P., Pittman, C. U., et al. (2018). Biochar production and applications in soil fertility and carbon sequestration – a sustainable solution to crop-residue burning in India. RSC. Adv. 8, 508–520. doi: 10.1039/C7RA10353K
Molloy, S., Varkey, P., and Walker, T. R. (2022). Opportunities for single-use plastic reduction in the food service sector during COVID-19. Sustain. Prod. Consum. 30, 1082–1094. doi: 10.1016/j.spc.2022.01.023
Muhammed, N. H., Ahmed, O. E., Ahmed, T. A., and Al-Yafai, M. S. (2015). Date palm status and perspective in qatar. Date. Palm. Genet. Resour. Util. Asia Eur. 2, 323–351. doi: 10.1007/978-94-017-9707-8_10
Nair, V. D., Nair, P. K. R., Dari, B., Freitas, A. M., Chatterjee, N., Pinheiro, F. M., et al. (2017). Biochar in the agroecosystem-climate-change-sustainability nexus. Front. Plant. Sci. 8, 2051. doi: 10.3389/fpls.2017.02051
Namany, S., Al-Ansari, T., and Govindan, R. (2019). Optimisation of the energy, water, and food nexus for food security scenarios. Comput. Chem. Eng. 129, 106513. doi: 10.1016/j.compchemeng.2019.106513
Namany, S., Govindan, R., Martino, M. D. i., Pistikopoulos, E. N., Linke, P., Avraamidou, S., et al. (2021). An energy-water-food nexus-based decision-making framework to guide national priorities in Qatar. Sustain. Cities. Soc. 75, 103342. doi: 10.1016/j.scs.2021.103342
Nawaz, I., and Tiwari, G. N. (2006). Embodied energy analysis of photovoltaic (PV) system based on macro- and micro-level. Energy Policy. 34, 3144–3152. doi: 10.1016/j.enpol.2005.06.018
Neves, D., Thunman, H., Matos, A., Tarelho, L., and Gómez-Barea, A. (2011). Characterization and prediction of biomass pyrolysis products. Prog. Energy Combust. Sci. 37, 611–630. doi: 10.1016/j.pecs.2011.01.001
Onarheim, K., Solantausta, Y., and Lehto, J. (2014). Process simulation development of fast pyrolysis of wood using aspen plus. Energy Fuels. 29, 205–217. doi: 10.1021/ef502023y
Pachauri, R. K., Allen, M. R., Barros, V. R., Broome, J., Cramer, W., Christ, R., et al. (2014). Climate Change 2014: Synthesis Report. Contribution of Working Groups I, II and III to the Fifth Assessment Report of the Intergovernmental Panel on Climate Change. Geneva: IPCC.
Parthasarathy, P., Al-Ansari, T., Mackey, H. R., and McKay, G. (2021). Effect of heating rate on the pyrolysis of camel manure. Biomass. Convers. Biorefinery 45, 1–13. doi: 10.1007/s13399-021-01531-9
Plastic Scrap Buy and Sell (2022). PET, LDPE, HDPE, PVC, PP, PS, ABS, Nylon, PC. Available online at: https://scrapo.com/?gclid=Cj0KCQiAnNacBhDvARIsABnDa6_nQealVdcGTUj9BLANY4-YabzBMp5Yw6H5Rnmnr8xk2JLPQMR2P0caAhv3EALw_wcB (accessed December 11, 2022).
Qatar General Electricity and Water Corporation. (2023). Available online at: https://www.km.com.qa/CustomerService/Pages/Tariff.aspx (accessed January 19, 2023).
Scrap HDPE. (2022). High Density Polyethylene Scrap Latest Price, Manufacturers and Suppliers. Available online at: https://dir.indiamart.com/impcat/hdpe-scrap.html (accessed December 11, 2022).
Shahbaz, M., AlNouss, A., Ghiat, I., Mckay, G., Mackey, H., Elkhalifa, S., and Al-Ansari, T. (2021). A comprehensive review of biomass based thermochemical conversion technologies integrated with CO2 capture and utilisation within BECCS networks. Resour. Conserv. Recycl. 173, 105734. doi: 10.1016/j.resconrec.2021.105734
Sharma, C., and Singh, C. (2014). Therapeutic value of camel milk–a review. J. Pharm. Life. Sci. Res. 3, 7–13.
Shi, J., Zhang, C., and Chen, W. Q. (2021). The expansion and shrinkage of the international trade network of plastic wastes affected by China's waste management policies. Sustain. Prod. Consum. 25, 187–197. doi: 10.1016/j.spc.2020.08.005
Singh, P. P., and Singh, S. (2010). Realistic generation cost of solar photovoltaic electricity. Renew. Energy 35, 563–569. doi: 10.1016/j.renene.2009.07.020
Smith, P. (2016). Soil carbon sequestration and biochar as negative emission technologies. Glob. Chang. Biol. 22, 1315–1324. doi: 10.1111/gcb.13178
Timmons, D., Lema-Driscoll, A., and Uddin, G. (2017). The Economics of Biochar Carbon Sequestration in Massachusetts. Available online at: https://ag.umass.edu/sites/ag.umass.edu/files/reports/timmons_-_biochar_report_10-16-17.pdf (accessed March 10, 2022).
Wang, X., Guo, M., Koppelaar, R. H. E. M., Van Dam, K. H., Triantafyllidis, C. P., Shah, N., et al. (2018). Nexus approach for sustainable urban energy-water-waste systems planning and operation. Environ. Sci. Technol. 52, 3257–3266. doi: 10.1021/acs.est.7b04659
Wright, M. M., Daugaard, D. E., Satrio, J. A., and Brown, R. C. (2010). Techno-economic analysis of biomass fast pyrolysis to transportation fuels. Fuel. 89, S2–10. doi: 10.1016/j.fuel.2010.07.029
Yang, Q., Mašek, O., Zhao, L., Nan, H., Yu, S., Yin, J., et al. (2021). Country-level potential of carbon sequestration and environmental benefits by utilizing crop residues for biochar implementation. Appl. Energy. 282, 116275. doi: 10.1016/j.apenergy.2020.116275
Youssef, P. G., Al-Dadah, R. K., and Mahmoud, S. M. (2014). Comparative analysis of desalination technologies. Energy Procedia. 61, 2604–2607. doi: 10.1016/j.egypro.2014.12.258
Keywords: waste, biochar, nexus, food security, water security
Citation: Al-Rumaihi A, Alherbawi M, Mckay G, Mackey H, Parthasarathy P and Al-Ansari T (2023) Assessing plastic and biomass-based biochar's potential for carbon sequestration: an energy-water-environment approach. Front. Sustain. 4:1200094. doi: 10.3389/frsus.2023.1200094
Received: 04 April 2023; Accepted: 15 June 2023;
Published: 05 July 2023.
Edited by:
Oludunsin Arodudu, Irish Manufacturing Research, IrelandReviewed by:
Anna Liza Bais-Moleman, Leiden University College the Hague (LUC), NetherlandsBing Shen How, Swinburne University of Technology Sarawak Campus, Malaysia
Copyright © 2023 Al-Rumaihi, Alherbawi, Mckay, Mackey, Parthasarathy and Al-Ansari. This is an open-access article distributed under the terms of the Creative Commons Attribution License (CC BY). The use, distribution or reproduction in other forums is permitted, provided the original author(s) and the copyright owner(s) are credited and that the original publication in this journal is cited, in accordance with accepted academic practice. No use, distribution or reproduction is permitted which does not comply with these terms.
*Correspondence: Tareq Al-Ansari, dGFsYW5zYXJpQGhia3UuZWR1LnFh