 Khaled Abdallah1*†
 Svenja C. Stock2,3,4†
 Felix Heeger1Moritz Koester2,5
 Francisco Nájera6
 Francisco Matus6,7
 Carolina Merino6,7,8
 Sandra Spielvogel5,9
 Anna A. Gorbushina1,10,11
 Yakov Kuzyakov3,12,13
 Michaela A. Dippold2,14
- 1Department 4, Materials and the Environment, Federal Institute for Material Research and Testing, Berlin, Germany
- 2Department of Biogeochemistry of Agroecosystems, University of Goettingen, Goettingen, Germany
- 3Soil Science of Temperate Ecosystems, University of Goettingen, Goettingen, Germany
- 4Institute of Geography und Geoecology, Karlsruhe Institute of Technology, Karlsruhe, Germany
- 5Instiute of Geography, University of Bern, Bern, Switzerland
- 6Laboratory of Conservation and Dynamics of Volcanic Soils, Department of Chemical Sciences and Natural Resources, Universidad de La Frontera, Temuco, Chile
- 7Network for Extreme Environmental Research, Universidad de la Frontera, Temuco, Chile
- 8Center of Plant, Soil Interaction and Natural Resources Biotechnology Scientific and Technological Bioresource Nucleus (BIOREN), Temuco, Chile
- 9Institute for Plant Nutrition and Soil Science, Christian-Albrechts University Kiel, Kiel, Germany
- 10Department of Earth Science, Freie Universität Berlin, Berlin, Germany
- 11Department of Biology, Chemistry Pharmacy, Freie Universität Berlin, Berlin, Germany
- 12Institute of Environmental Sciences, Kazan Federal University, Kazan, Russia
- 13Agro-Technology Institute, Peoples Friendship University of Russia (RUDN University), Moscow, Russia
- 14Geo-Biosphere Interactions, Department of Geosciences, University of Tübingen, Tübingen, Germany
Plants and microorganisms, besides the climate, drive nitrogen (N) cycling in ecosystems. Our objective was to investigate N losses and N acquisition strategies along a unique ecosystem-sequence (ecosequence) ranging from arid shrubland through Mediterranean woodland to temperate rainforest. These ecosystems differ in mean annual precipitation, mean annual temperate, and vegetation cover, but developed on similar granitoid soil parent material, were addressed using a combination of molecular biology and soil biogeochemical tools. Soil N and carbon (C) contents, δ15N signatures, activities of N acquiring extracellular enzymes as well as the abundance of soil bacteria and fungi, and diazotrophs in bulk topsoil and rhizosphere were determined. Relative fungal abundance in the rhizosphere was higher under woodland and forest than under shrubland. This indicates toward plants' higher C investment into fungi in the Mediterranean and temperate rainforest sites than in the arid site. Fungi are likely to decompose lignified forest litter for efficient recycling of litter-derived N and further nutrients. Rhizosphere—a hotspot for the N fixation—was enriched in diazotrophs (factor 8 to 16 in comparison to bulk topsoil) emphasizing the general importance of root/microbe association in N cycle. These results show that the temperate rainforest is an N acquiring ecosystem, whereas N in the arid shrubland is strongly recycled. Simultaneously, the strongest 15N enrichment with decreasing N content with depth was detected in the Mediterranean woodland, indicating that N mineralization and loss is highest (and likely the fastest) in the woodland across the continental transect. Higher relative aminopeptidase activities in the woodland than in the forest enabled a fast N mineralization. Relative aminopeptidase activities were highest in the arid shrubland. The highest absolute chitinase activities were observed in the forest. This likely demonstrates that (a) plants and microorganisms in the arid shrubland invest largely into mobilization and reutilization of organically bound N by exoenzymes, and (b) that the ecosystem N nutrition shifts from a peptide-based N in the arid shrubland to a peptide- and chitin-based N nutrition in the temperate rainforest, where the high N demand is complemented by intensive N fixation in the rhizosphere.
Introduction
In terrestrial ecosystems, precipitation affects nitrogen (N) cycling through its effect on leaching, soil erosion, and microbial activity (1). Increased precipitation can result in significant leaching and run-off events, decreasing N retention and increasing N losses (2). Since more than 90% of soil N is bound in soil organic matter (SOM), the availability of N in most terrestrial ecosystems is controlled by microbial mineralization, which is strongly dependent on soil moisture and temperature (3). Optimal soil moisture and temperature conditions for N transformation in arid ecosystems, for example, are only present after rainfall pulses (4). Under these conditions, soil microorganisms can mineralize N, but low plant activity and, consequently, low N absorption by roots can result in the accumulation of easily available N in soils that is potentially prone to be leached in case of strong rainfall events (5–7). With increasing precipitation and soil moisture, microbial activity increases, accelerating N mineralization, on the one hand, but increasing N immobilization within the growing microbial biomass, on the other hand (8, 9), both affecting the N distribution along soil profiles—from microbial-active topsoils toward subsoils with low microbial abundances and activities.
The balance of N inputs and outputs of an ecosystem can be assessed by vertical soil δ15N signatures (10, 11). The relationship of soil δ15N and N content [mathematically expressed as -ln(%N)] with depth represents an integration of the soil 15N enrichment with increasing soil age. Thereby, an intensive N transformation of soil organic matter is indicated by a strong 15N enrichment of the remaining soil N (12, 13).
Simultaneous increase in plant productivity and plant N uptake under higher water availability intensify the competition for N between plants and microorganisms (5, 14, 15). Thus, depending on the climatic conditions, plants have to adapt their N acquisition strategies. Under dry conditions, leaching losses are generally low and soil N can be recycled by means of extracellular enzymes. However, soil N losses by leaching under high precipitation calls for mechanisms to replenish depleted N pools and optimization of recycling processes to decrease leaching losses.
Biological N fixation, by symbiotic diazotrophic microorganisms and free-living microorganisms that can fix N independent of root presence, is the major natural source of N in most terrestrial ecosystems (16, 17). Free-living and symbiotic diazotrophs possess the nifH gene (Hirsch and Mauchline, 2015), a key structural gene encoding the reductase subunit of the nitrogenase enzyme, which catalyzes N2 reduction to biological available forms (18, 19). The nifH gene has commonly been used as a genetic marker in studies of diazotroph diversity and abundance (20, 21) and could be a potential indirect approach to the assessment of levels of biological N fixation in soils (22). Biological N fixation provides diazotrophs with an ecological advantage in N limited environments (23). However, the growth efficiency of diazotrophs is negatively affected due to the high energy costs of N2 fixation (24) and the costs for providing an oxygen-free environment as a prerequisite for the nitrogenase activity (25). Thus, C vs. N demand define the abundance of diazotrophs in ecosystems.
Studies along continental transects of ecosystems (i.e., ecosequence) distinct in mean annual precipitation, mean annual temperate, vegetation cover, and composition, but with common soil parent material, can be valuable study objects to evaluate acquisition strategies depending on climate conditions. In previous work (26), specific mutualism of arbuscular mycorrhizal fungi across biomes of a climate gradient was identified as an efficient strategy to compensate for low nutrient uptake capacities from arid to temperate rainforest ecosystems. The objective of the present study was to investigate N-specific acquisition strategies across the same climatic gradient from arid to temperate rainforest soils, developed on a similar granitoid parent material using a combination of molecular biology and soil biogeochemical tools.
To reveal the N acquisition strategies, extracellular enzyme activities and N2-fixing potential in topsoil to saprolite, together with the bacterial and fungal abundance, were investigated. To assess N availability and turnover, C and N contents and soil signatures of stable N isotopes, were determined. We hypothesized that [1] the N transformation increases with increasing precipitation, reflected by a stronger 15N enrichment with decreasing N content with depth, [2] the activity of recycling agents (extracellular enzymes) per unit soil organic carbon (SOC) decreases with increasing precipitation, and [3] the importance of diazotroph bacteria (to newly acquire N) increases with increasing precipitation, as higher primary productivity allows: (a) the investment in C expensive process and (b) greater N leaching losses decrease the reutilization of N and increase the need for new input.
Materials and Methods
Study Sites
The study areas are located in the Coastal Cordillera of Chile (from 29° to 38° southern latitude). They cover a gradient across biomes (ecosequence) ranging from arid [Santa Gracia Natural Reserve and Quebrada de Talca (arid shrublands)] to Mediterranean [La Campana National Park (Mediterranean woodland)] and humid-temperate [Nahuelbuta National Park (temperate rainforest)]. The mean annual precipitation (Supplementary Table 1), (27) and temperature changed from 80 mm and 18.8°C in the arid site, to about 400 mm and 13.1°C in the Mediterranean site, and to >1,500 mm and 7.4°C in the temperate rainforest site (28). From similar granitoid parent material developed Cambisols under arid (pH 5.5–7.0) and Mediterranean (pH 4.5–6.1) conditions, and Umbrisols (pH 3.7–5.1) under humid conditions (29). Vegetation in arid sites covered 45% of the Cambisols and is dominated by cacti and drought-deciduous shrubs (30). In the Mediterranean woodland, vegetation is dominated by a dense herb layer, deciduous shrubs, and evergreen-sclerophyllous trees which covered 100% of the Cambisols (29). In the temperate rainforest, vegetation is dominated by dense coniferous forest which covered 100% of the Umbrisols and Podzols (29). The study areas are located outside the northern limit of the Last Glacial Maximum (31). Rivers and catchments that drained areas with Alpine glaciers at the latitudes of the study areas were excluded from the site selection (www.earthshape.net). The selected catchments are located in national parks or nature preserves and cover the typical vegetation for the respective climate zone with low anthropogenic influence. More details regarding the geological conditions, denudation rates, soils, and vegetation of the study areas can be found in the studies by Bernhard et al. (29), Canessa et al. (30), Oeser et al. (32), and Schaller et al. (33).
Soil Sampling
Three soil sample sets were analyzed in this study. Two sample sets were collected in the later austral summer 2016 (i.e., in March) from the sites Santa Gracia, La Campana and Nahuelbuta. The third sample set was collected in the austral spring 2016 (i.e., November) at the sites Quebrada de Talca, La Campana, and Nahuelbuta. Both arid shrubland sites lie in similar distance to the Pacific Ocean and similar soil and vegetation compositions can be found. The vegetation cover in Quebrada de Talca, however, is denser than in Santa Gracia due to the exclusion of grazing.
The first sample set (rhizosphere set) served to determine the belowground C input via rhizodeposits and the importance of N fixation by root associated diazotrophs. At each site, samples were taking from four soil pits: one soil pit on a north-facing slope at mid-slope position and three on a south-facing slope, arranged as a catena (top-, mid-, and toe-slope) (i.e., four field replicates). From each pit, the rhizosphere soil (0–6 mm distance from root) was collected in 3 depth increments. Therefore, the soil profile from the surface to the saprolite was defined as 100%, and samples were collected from 0–50% and 50–100% solum depth, and >100% which comprised the saprolite. For absolute depths, please refer to Koester et al. (34). The results of the rhizosphere samples are presented as means of all soil profiles as slope exposure did not have a notable effect.
With the second sample set (bulk soil set) the long-term N cycling was evaluated, i.e., whether the N cycling within an ecosystem is open or closed. Bulk samples were collected with a soil auger to a maximal depth of 60 cm (arid shrubland), 120 cm (Mediterranean woodland), and 200 cm (temperate rainforest) from two slopes at mid-slope position (i.e., 8 field replicates). The samples were divided into 10 cm (shrubland, woodland) and 25 cm (forest) depth increments, respectively. The different sampling depths derive from the difference in maximal soil depths [see Bernhard et al. (29)].
The third sample set (bulk topsoil set) was taken to evaluate the effect of litter C input on N cycling and specifically on N fixation by free living diazotrophs. Therefore, bulk topsoil samples were collected from 0–10 cm, 10–20 cm, and 20–30 cm depth, in four field replicates.
Stable Nitrogen Isotope Ratios, N and C Contents
Stable isotope ratios of nitrogen (δ15N) were simultaneously determined with total N and organic C contents of dried and grounded soil from the second sample set, using an elemental analyzer (Flash Elemental Analyzer, Thermo Fisher Scientific, Bremen, Germany) coupled to an isotope ratio mass spectrometer (Delta Plus with Confo III, Thermo Fisher Scientific, Bremen, Germany). The discrimination factor (β) was calculated from the relationship between soil δ15N and -ln(%N) (12, 13). This represents an integration of the soil 15N enrichment with depth (i.e., with soil age) and provides indications about the N transformation and loss from soil. To calculate the discrimination factor, the δ15N values and the total N contents of the bulk samples down to a maximum of 100 cm were used. δ15N values and N contents below 100 cm were excluded as N (and C) contents were exceptionally high in 100–125 cm soil depth under the temperate rainforest (see Figure 1).
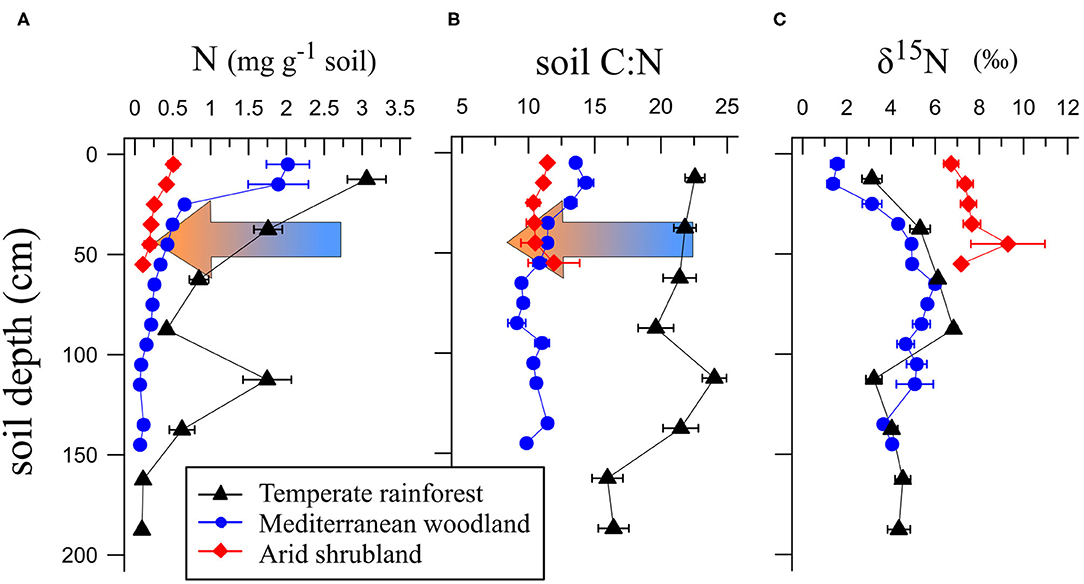
Figure 1. Total nitrogen content (A), soil C:N ratio (B), and δ15N values (C) in soil profiles in the temperate rainforest, Mediterranean woodland, and arid shrubland. Data are presented as means (n = 8) with standard errors. Arrows indicate direction of increasing aridity. Nitrogen contents and C:N ratios decrease markedly with increasing aridity. δ15N values were lowest in soil under Mediterranean woodland.
Extracellular Chitinases and Aminopeptidases Activities
Extracellular activities of chitinases (β-1,4-N-acetylglucosaminidase) and aminopeptidases were determined in the rhizosphere soil (first sample set) in a previous study (35) focusing on environmental controls of extracellular enzyme production, and hence on enzyme activities involved in C, N, and P cycling along the ecosequence. The data on enzyme activities in the rhizosphere involved in N cycling were reevaluated in this study to include the plant N acquisition from organic matter decomposition via enzymes in comparison to the plant N acquisition via associated diazotrophs (i.e., recycling N vs. new N input). Therefore, the enzyme activities were normalized to the SOC content in the rhizosphere samples (nmol substrate mg−1 SOC h−1) The normalization of the activities to SOC (a relative proxy for the total available substrate) served to reduce the factor of available substrate amount when comparing enzyme activities between study sites. Briefly, activities were determined using synthetic fluorogenic substrates at the extinction of 355 nm and emission of 460 nm. The maximal rate of activity (Vmax; nmol substrate g−1 soil h−1) was determined by fitting the activities with the Michaelis-Menten Equation. Aminopeptidase activity was calculated as the sum of individually determined tyrosine-aminopeptidase and leucine-aminopeptidase activities.
Soil DNA Extraction
Total genomic DNA was extracted from 0.5 g of soil (first and third sample set) using the FastDNA SPIN Kit for Soil (MP Biomedicals, Solon, OH, USA), following the manufacturer's protocol with modifications including an initial three homogenization cycles with 2 min ice incubations in between. Final DNA extracts were eluted in 80 μL sterile ultrapure water. DNA concentration and quality were measured with a NanoDrop 2000C (Nanodrop 2000, Thermo Fisher Scientific, Waltham, MA, USA). DNA extracts were stored at −20°C for further analyses.
Quantification of Microbial Abundance and nifH Gene by qPCR
The abundance of bacterial and fungal DNA as well as diazotrophs was determined by qPCR. The primers used for the qPCR are listed in Supplementary Table 2. Bacterial abundance of 16S rRNA gene was quantified using the primer pair Bac27F (36, 37) and Bac338R (38) targeted on 16S rRNA marker. Fungal abundance was quantified using the primer pair NL1F (39) and LS2r (40) targeted on 28S rDNA. In addition, the gene copy number of the nifH gene, which as a molecular marker for diazotrophs (41), was determined using the primer pair PolF (42) and PolR (42).
qPCR reactions were performed in a total reaction volume of 10 μL using the iTaq Universal SYBR Green Supermix (BioRad, Hercules, CA, USA) following the manufacturer's instructions. Quantification reactions were carried out in the CFX96 Real-Time PCR Detection System (BioRad) with the following cycling parameters for all primer sets: initial denaturation at 95°C for 5 min, followed by 40 cycles of denaturation at 95°C for 5 s and annealing-extension at 60°C for 1 min. For real-time data collections during the annealing-extension step, fluorescence at 520 nm was monitored. The melting curve was constructed by increasing temperature by 0.5°C (from 65 to 95°C) and measuring fluorescence at 520 nm after each step. Every qPCR run included negative controls and calibration standards previously used to construct standard curves. At least one dilution of each soil sample was included to avoid the inhibitory effects of co-extracted substrates. Each sample had four biological replicates, with three technical replicates for every biological replicate. Data analysis was carried out using the BioRad CFX ManagerTM 3.1 (BioRad).
qPCR for microbial abundance was performed against standard curves generated by plotting logarithm values of serial dilutions of target genomic DNA in triplicate, ranging from 10 ng to 10 pg, vs. the quantification cycle (Cq) values generated from qPCR analysis (43). Equal concentrations of DNA extracts from four bacterial (or fungal) strains (Supplementary Table 3), isolated from Chilean soil samples, were used as standard templates for bacterial (or fungal) quantification. A Standard curve to estimate nifH gene abundance was generated using a 10-fold serial dilutions of a purified PCR product containing the nifH gene fragment (361 bp) and amplified using primers PolF and PolR. DNA extract from Vibrio ruber Gal42 (44) was used as a standard template for primers PolF/PolR.
Statistics
Statistical analyses were conducted with R 3.6.3 (45). Differences between regression slopes of soil δ15N against -ln(%N) were evaluated with z-Tests according to Paternoster et al. (46). Principal component analyses (PCA) were performed after variables were scaled and centered. The variables included: N and C contents, δ15N, abundance of bacterial and fungal DNA, and gene copy number of nifH and 16S rRNA genes. A biplot (scaled for correlation) of the PCA was generated using the package “ggbiplot” (47).
Results
Nitrogen Contents and δ15N Signatures
Total soil nitrogen contents were up to 2.7-fold and 6.8-fold higher under temperate rainforest than under Mediterranean woodland and arid shrubland, respectively (Figure 1A). Soil C:N ratios were highest in the temperate rainforest. In the Mediterranean woodland and arid shrubland, soil C:N ratios decreased in the upper 30 cm but were similar below 30 cm (Figure 1B). Soil δ15N in the temperate rainforest and Mediterranean woodland increased with increasing depth, while no change was observed in the arid shrubland (Figure 1C). In the first 20 cm, δ15N values were lowest in the Mediterranean woodland—between 1 and 2‰—compared to the other two sites, where δ15N ranged between 3 and 10‰. The 15N discrimination factor (β) was 1.7-fold and 5.9-folds higher in the Mediterranean woodland than in the temperate rainforest and arid shrubland, respectively (Figure 2).
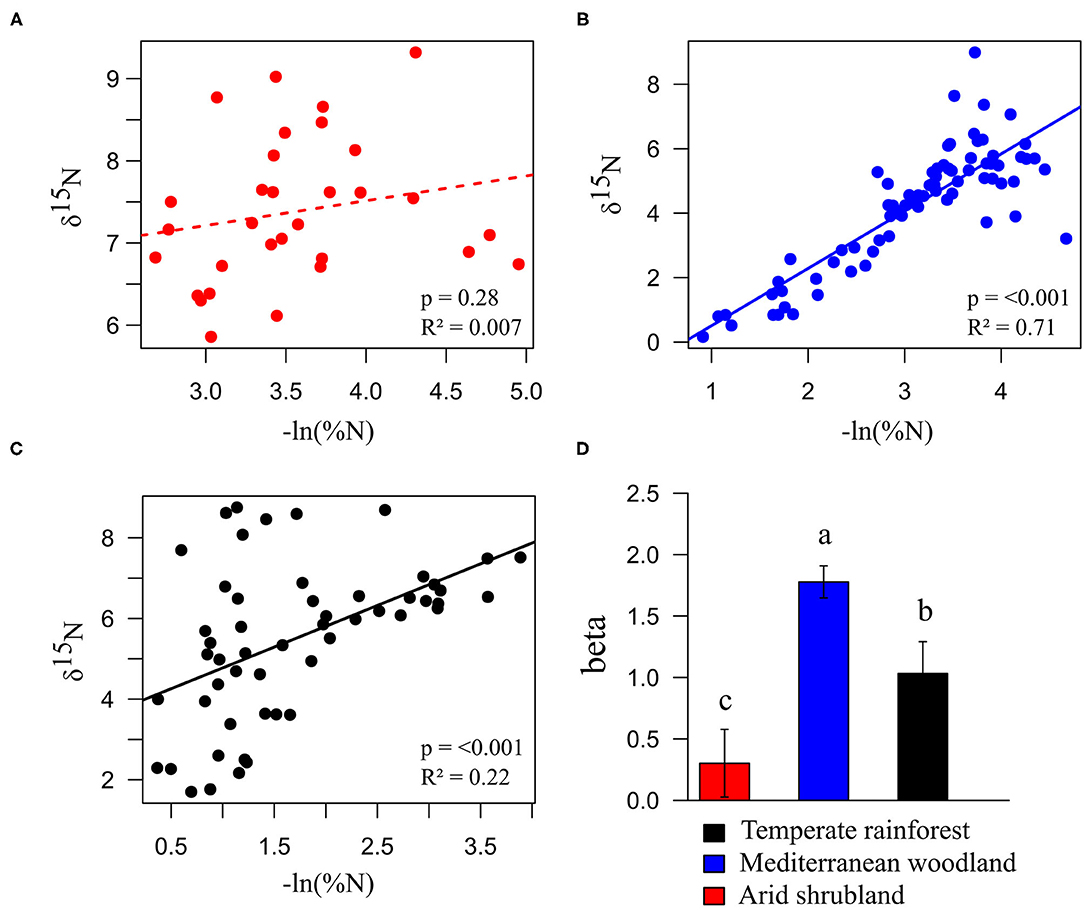
Figure 2. Estimation of N turnover in soil based on the regressions of δ15N vs. -ln(%N) for the arid shrubland (A), Mediterranean woodland (B), and temperate rainforest (C) as well as the regression slopes (beta) presented with the regression standard errors (D). The dashed line represents non-significant regression. Lower case letters indicate significant differences between regression slopes.
Activities of Aminopeptidases and Chitinases
Activities of aminopeptidases and chitinases decreased with increasing soil depths at all sites, except for chitinase activities under arid shrubland (Figures 3A,B). Chitinase activities in the topsoil decreased with increasing aridity and were 6.5-times higher under temperate rainforest than under arid shrubland. Aminopeptidase activities were also lowest under arid shrubland (1.8-times lower than under temperate rainforest) but were similar between temperate rainforest and Mediterranean woodland (Figure 3B). In the subsoil, chitinases and aminopeptidase activities were similar between all sites. Chitinase activities per unit SOC, on the contrary, were similar across biomes, while aminopeptidase activities per unit SOC were highest in soil under arid shrubland (Figures 3C,D).
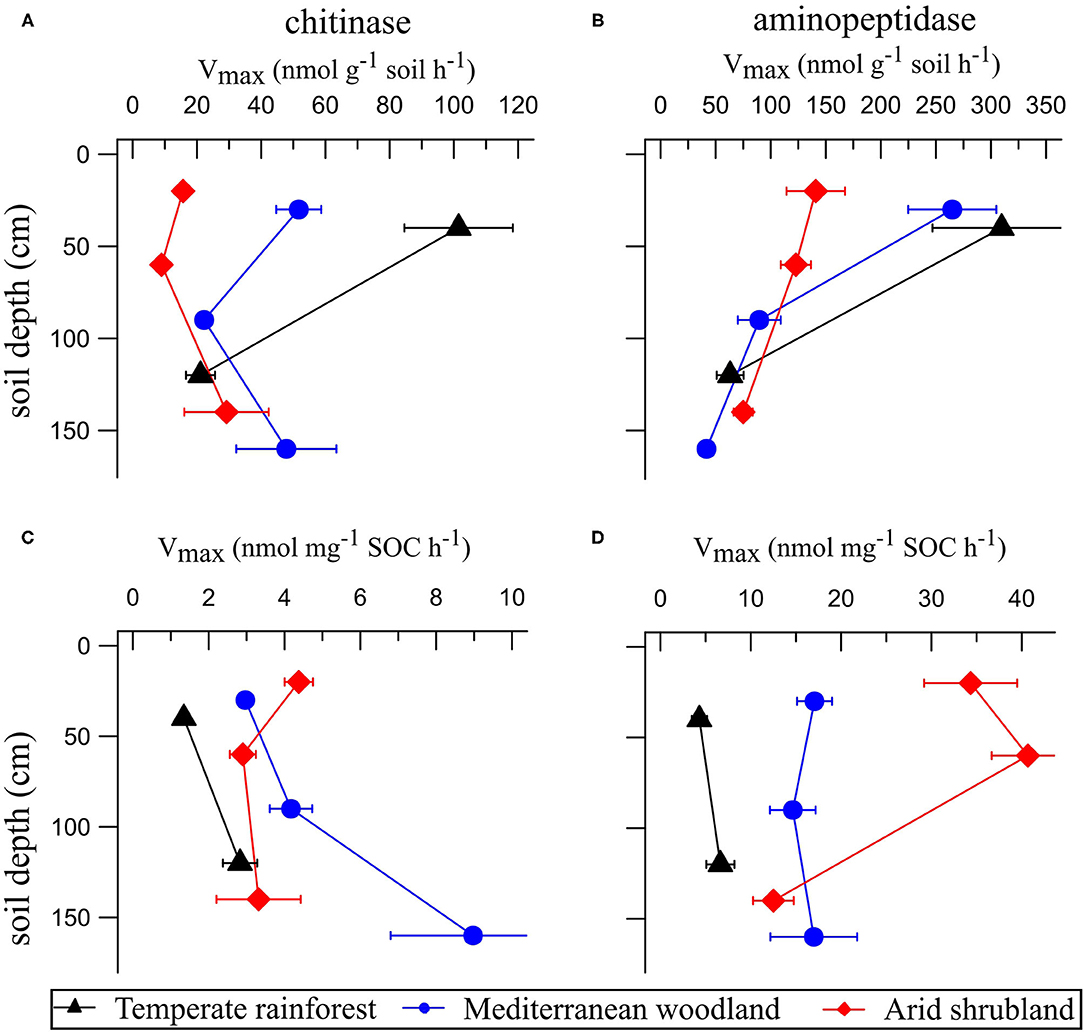
Figure 3. Extracellular enzyme activities (Vmax) of chitinase and aminopeptidase per g of soil (A,B) and standardized per unit of SOC (C,D). Data are presented as means (n = 4) with standard errors.
Bacterial and Fungal Abundance Along the Soil Depths
DNA quantification by qPCR showed a decrease in the abundance of bacterial and fungal DNA in soil with increasing aridity (Figures 4A,B). In bulk topsoils, samples from the temperate rainforest had the highest abundance in bacterial and fungal DNA with a maximum amount of 4.6 x 10⁵ and 9.0 x 10³ ng of DNA g−1 soil at depth 20–30 cm, respectively. Amounts are considerably lower with decreasing ecosystem precipitation and reach a minimum at the arid shrublands with 1.1 x 10⁵ and 2.0 x 10² ng of DNA g−1 soil at depth 20–30 cm, respectively (Figure 4A). Differences of bulk topsoil between sites were always lowest in the top 10 cm of the profile and significantly increased with increasing depth.
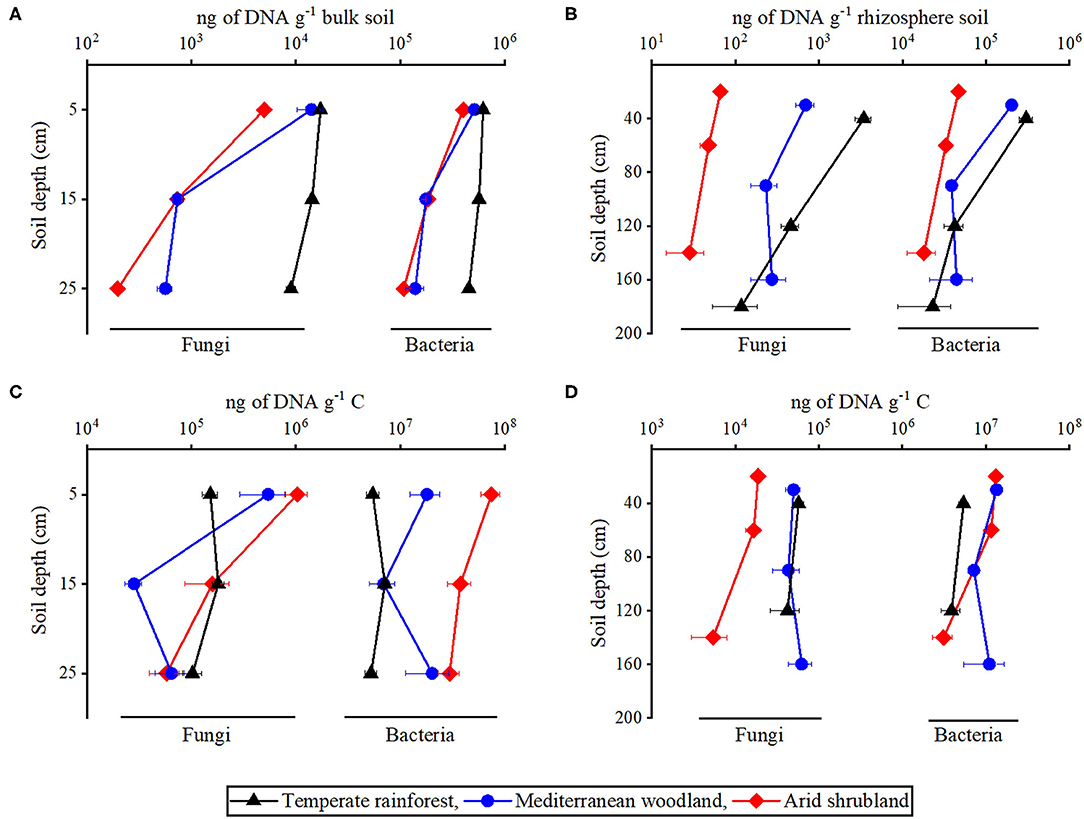
Figure 4. Quantification of microbial abundance along the depth in (A,C) bulk topsoil and (B,D) rhizosphere by qPCR using bacterial (Bac27f/338r) and fungal (NL1f/LS2R) primers in temperate rainforest, Mediterranean woodland, and arid shrubland. Data in A and C are expressed as ng of DNA per g soil, while in (B,D) they are expressed as ng of DNA per g organic carbon as sampled from the soil profile wall. Data represent means of four biological replicates, with three technical replicates for every biological replicate. Error bars represent standard errors of the mean.
Pronounced site-specific differences in the DNA content of the rhizosphere soil were observed along its two-meter-deep profile. The abundance of bacteria and fungi in the rhizosphere was highest in soil under temperate rainforest in comparison to the Mediterranean woodland and arid shrubland. At a depth of 0–50 cm, forest rhizosphere soil had a maximum abundance of bacterial and fungal DNA of 3.0 x 10⁵ and 3.5 x 10³ ng g−1 soil, respectively. Then they decreased at the arid shrubland to a minimum of 4.7 x 10⁴ and 6.6 x 101 ng of DNA g−1 soil, respectively (Figure 4B).
In bulk topsoil, the abundance of bacteria and fungi relative to SOC was highest at a depth of 0–10 cm under arid shrubland and Mediterranean woodland compared to the temperate rainforest (Figure 4C). A similar observation was found for bacterial abundance per SOC in the rhizosphere. Interestingly, abundance of fungi relative to SOC in the rhizosphere was highest in the temperate rainforest and Mediterranean woodland at all depths (Figure 4D). Whereas the depth effect was present in nearly all datasets when considering absolute amounts of DNA, it largely disappeared when normalizing the DNA amounts per g soil C (Figures 4C,D). This suggests that litter and rhizodeposition inputs, as microbial growth resource, largely determine microbial distribution along soil profiles, with exception of the most arid site where microbial DNA per SOC strongly decreases in the rhizosphere and bulk topsoil suggesting further growth limitations to play a role in subsoils. Regardless of the sampling site or soil depth, bacterial DNA was ~30 to ~700 folds more abundant in comparison to fungal DNA.
Abundance of the Diazotrophic Community in Soil
In bulk topsoil, nifH gene copy number ranged from 5.8 x 10⁸ to 5.6 x 10⁷ copies g−1 soil (Figure 5A). While in the rhizosphere, it ranged from 2.9 x 10⁹ to 7.0 x 10⁷ copies g−1 soil (Figure 5B). In bulk topsoil and rhizosphere soil, the nifH gene copy numbers decreased along the ecosequence with decreasing precipitation. At depth 0–10 cm, bulk soil from the temperate rainforest had a maximum amount of 5.7 x 10⁸ nifH copy numbers g−1 soil, whereas soil from Mediterranean and arid sites contained 2.8 x 10⁸ and 2.1 x 10⁸ gene copy numbers g−1 soil, respectively (Figure 5A). Similarly, rhizosphere soil of temperate rainforest at depth 0–40 cm had maximum nifH gene copy number g−1 soil of 2.9 x 10⁹ and decreased to a minimum of 1.4 x 10⁸ in arid shrubland (Figure 5B). The site effect in bulk topsoils was weakest in the top 10 cm and increased—at least for the comparison of temperate rainforests to the more arid sites—in the deeper depth increment. However, when comparing rhizosphere soil along the complete profile down to the saprolite, the nifH gene copy number at all sites was not significantly different at the lowest depth (i.e., in the saprolite) but pronounced site effects in the nifH abundance could be found in the topsoil rhizosphere.
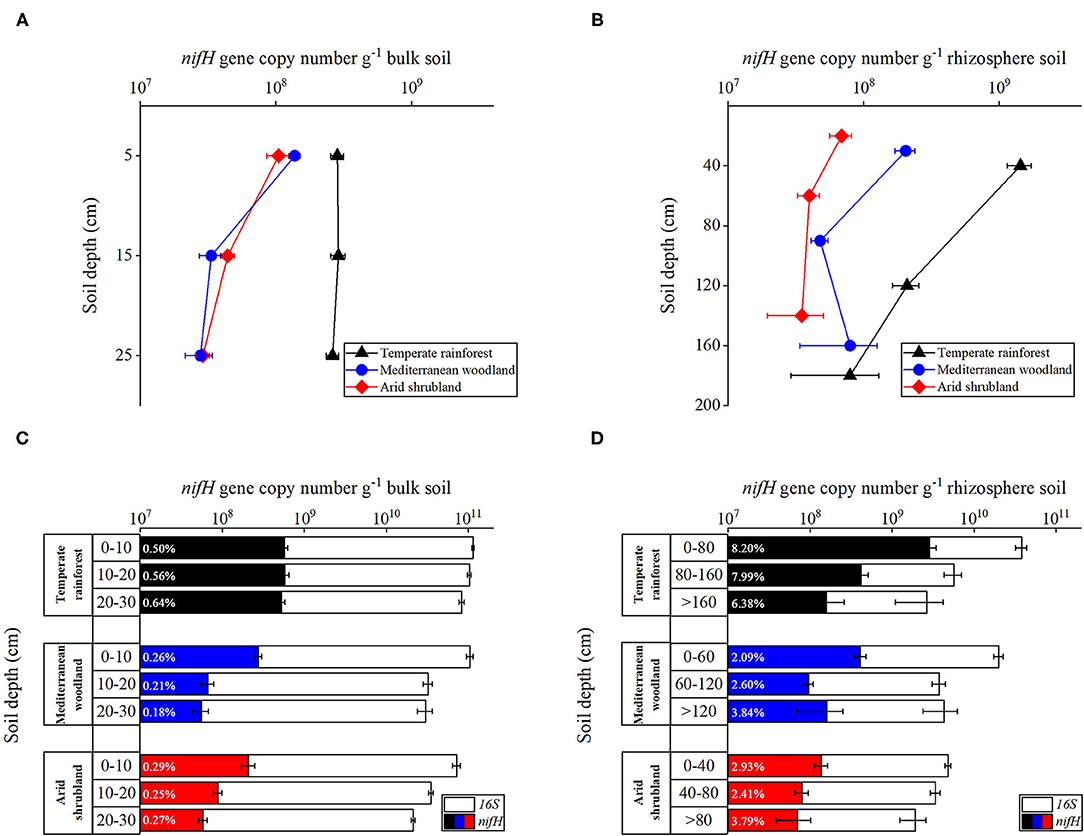
Figure 5. Abundance of nitrogenase reductase (nifH) gene (qPCR) depending on depths in temperate rainforest, Mediterranean, and arid soils. (A,C) nifH gene in bulk topsoil, (B,D) nifH gene in the rhizosphere of the complete profile down to the saprolite. Abundance of nifH gene is expressed in gene copy number (A,B) and percentage of diazotrophy in prokaryotic parts of community (C,D). Data are expressed as gene copy number per gram soil and represent means of four biological replicates, with three technical replicates for every biological replicate. Error bars represent standard errors of the mean.
The percentage of diazotrophs in the prokaryotic community was determined by comparing the total copy number of the nifH gene to that of 16S rRNA. Quantification of nifH genes indicates cells that can fix nitrogen, while 16S rRNA genes reflect total bacterial abundance. The percentage of diazotrophs in bulk topsoil, decreased with depth at all sites except the temperate rainforest, where the percentage of diazotrophs did not differ significantly (Figure 5C). Only at the temperate rainforest site the percentage of diazotrophs with depth in the rhizosphere decreased, whereas it increased in arid shrubland and Mediterranean woodland (Figure 5D). Rhizosphere had a frequently more than factor 10 higher percentage of diazotrophs compared to bulk topsoil at all sites. The percentage of diazotrophs in the rhizosphere ranged between 2.09 and 8.20%, while those from bulk topsoil varied between 0.18 and 0.64%. Soil under temperate rainforest had the highest percentage of diazotrophs regardless of depth (Figures 5B,D).
Effects of Soil Biochemical Properties on Microbial Abundance
PCA of microbial and other soil properties showed separation of sites to a different degree for bulk soil and rhizosphere soil, but not between north and south-facing slopes. For bulk topsoil, all sites were separated (Figure 6A). The temperate rainforest was separated from the arid shrubland and the Mediterranean woodland by all variables (except δ15N) along with principal component 1 (PC1, 72.4% of variance). δ15N, on the other hand, separated the Mediterranean woodland from the two other sites and was correlated with principal component 2 (PC2, 13.9% of variance). In the rhizosphere, the temperate rainforest was also largely separated from the other two sites by all variables except δ15N along PC1 (80.9% of variance) but showed some overlap with the arid shrubland (Figure 6B). δ15N, which was correlated with PC2 (12.4% of variance) separated the forest from the Mediterranean woodland, while the arid shrubland overlapped with both sites along this axis.
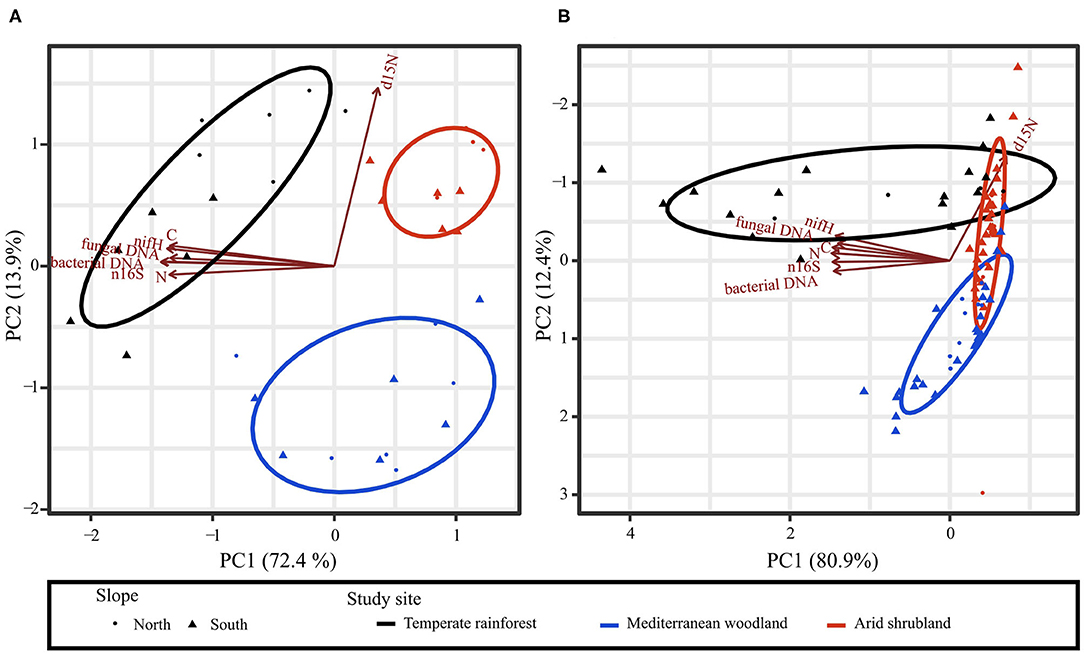
Figure 6. Principal component analyses (PCA) generated from N and C contents, δ15N, abundance of bacterial and fungal DNA, and gene copy number of nifH and 16S rRNA genes in (A) bulk topsoil and (B) rhizosphere soil. Name of the respective variable is indicated at each arrowhead. Colors indicate study sites and symbol shapes indicate north- or south-facing slopes. Ellipses show two standard deviations of an assumed two-dimensional normal distribution for each study site.
Discussion
Nitrogen Availability and Transformation
The quality of the organic matter input influences the mineralization and recycling of organically bound N (48). One important factor for the decomposability of organic matter is the initial N content and C:N ratio of the material (49, 50). Material with high C:N ratios (i.e., low quality substrate) is unfavorable to be decomposed as it provides less N for the decomposer community. Under restricted N accessibility, microorganisms incorporate the gained N in their biomass and recycle only within the cell (microbial N immobilization) rather than releasing it for plant uptake (51, 52). During the decomposition of high-quality substrate (i.e., with low C:N ratios), on the contrary, the accessible N can exceed the microbial N demand and mineralized N is available for plant uptake (51, 52). Low soil C:N ratios under arid shrubland and Mediterranean woodland (Figure 1B) indicated that the N mineralization is higher than the microbial N immobilization, providing mineralized N accessible for plants. High soil C:N ratios in the temperate rainforest (Figure 1B), on the contrary, indicated that microbial organic matter decomposition is likely N limited and that N is rather immobilized in the microbial biomass than mineralized and available for plant uptake (51–53). Two times higher C:N ratios in the forest than in the shrubland and woodland indicated an overall low litter quality implying that microorganisms can mineralize only a smaller proportion of the organic matter and subsequently the N in the forest than in the shrubland or woodland. Not only the overall N content but also the chemical composition of the organic matter affects its decomposability (54). The recalcitrant nature of the forest litter likely hampers its decomposition and mineralization of N in the early stages of decomposition, additionally (30), reducing the N availability for plants and microorganisms in this ecosystem.
Due to the high precipitation, the mineralized N in the temperate rainforest is easily lost by leaching. The vertical profile of the soil 15N enrichment can provide information on the extent of N transformation with soil age and the N loss from the soil. During N transforming processes, such as mineralization, nitrification, or denitrification, N pools will be isotopically fractionated by discrimination against the heavier N isotope 15N (55, 56). Subsequently, characteristic vertical profiles of increasing 15N enrichment with increasing soil depth can develop when the isotopically lighter pools are lost from soil via leaching ( loss), volatilization ( loss), denitrification, or plant N uptake of 15N depleted mineral pools (55–57). Such characteristic profiles were observed in the temperate rainforest and Mediterranean woodland, but not the arid shrubland (Figure 1C). This indicated that N is transformed (with discrimination against 15N) and subsequently lost from the soil in the rainforest and the woodland.
The extent of discrimination depends on the N demand and N availability for microorganisms and plants (13, 58). The absence of 15N enrichment with soil depth in the arid shrubland thus indicated that the discrimination against 15N is either minimal (i.e., microorganisms need to use all N present to cover their demand) and/or that the translocation of mineral N pools via leaching or denitrification is low (13, 58). The low N content in the arid shrubland (Figure 1A) likely drives microorganisms to reutilize N intensively minimizing each type of loss. This was supported by about 2- and 8-times higher aminopeptidase activities per unit SOC in the arid shrubland than in the Mediterranean woodland and temperate rainforest, respectively, while the bacterial abundance per unit SOC was similar in all sites (Figures 3D, 4D). This supported the interpretation that plants and microorganisms in the arid shrubland invest largely into the mobilization and reutilization of organically bound N (i.e., exoenzyme production) as typical for a strongly N recycling system.
In the Mediterranean woodland, the vertical increase of 15N enrichment with depth—which was even more pronounced than in the rainforest soil (Figure 1C)—indicated a stronger discrimination against 15N and/or the translocation and loss of 15N-depleted inorganic N than in the arid shrubland (55, 56). The soil C:N ratios in the Mediterranean woodland were as low as in the arid shrubland (indicating good decomposability of the organic matter), while the N content in the Mediterranean woodland soil was almost 4-times higher (Figure 1A). This pointed to a high potential of N mineralization, as the microbial decomposition of organic matter is likely not limited by N (52).
The interpretation of a strong N mineralization in the Mediterranean woodland was supported by the discrimination factor (Figure 2D). The highest discrimination factor across the ecosequence was found in the woodland (i.e., the strongest 15N enrichment with decreasing N content with depth), which indicated the most intense N mineralization which most likely results in the highest N losses from soils at this side across the ecosequence (12). Consistent with this, aminopeptidase activities were as high or higher (per unit SOC) in the Mediterranean woodland than in the temperate rainforest (Figures 3B,D), pointing as well to a fast mobilization of organically bound N, but overall N demand of this ecosystem is lower, fueling losses which result in the observed highest 15N discrimination. Higher N mineralization but less precipitation in the Mediterranean woodland than in the temperate rainforest could lead to an accumulation of mobile 15N-depleted . Especially the strong seasonality of rainfall in the Mediterranean site can amplify this accumulation. For one, brief water pulses in dry periods can decouple the mineralization activity of fast responding microorganisms and the nutrient uptake of slow(er) responding plants (4, 59–61).
Furthermore, strong rainfall events during dry periods can result in the cell rupture of water saving microorganisms in dry soils, due to a rapid increase of osmotic pressure (8, 62, 63). Thereby, easily available N will be released that can be rapidly mineralized by surviving microorganisms and inorganic, mobile N can accumulate (8, 62, 63). The decoupling of microbial and plant activity in dry periods makes the accumulated (and 15N-depleted) highly susceptible to leaching during subsequent rainfall events (60, 61, 64).
Microbial Contribution to N Cycle Along the Ecosequence
High N losses under Mediterranean woodland and high N demand in temperate rainforest call for N recycling. This became evident with high N acquiring enzyme activities under Mediterranean woodland and temperate rainforest (Figure 3). While aminopeptidase activities did not differ between the two sites, activities of β-1,4-N-acetylglucosaminidase, a chitinase important for mineralizing N from chitin (65), increased with increasing precipitation (Figures 3A,B). As described in Stock et al. (35), increasing chitinase activities reflect a source shift of organic N, from a peptide-based dominated nutrition under arid and Mediterranean conditions to a peptide- and chitin-based N nutrition for microorganisms in the temperate rainforest. This nutritional shift was also reflected in the fungal abundance relative to SOC (Figure 4D). Soil fungal biomass positively correlate to chitinases enzyme activity (66) because their cell walls contain N-acetylglucosamine, the main substrate of chitinases (67). Moreover, several publications showed a negative correlation between fungal biomass and organic matter quality linked to the N availability for plants (68–70). This is consistent with our results in which abundance of fungi per SOC was found highest in the rhizosphere of the temperate rainforest (Figure 4D) characterized by the highest chitinase activity and highest C:N ratio along the ecosequence (Figure 3). This supports findings of Stock et al. (26), that plants in the temperate rainforest outsource their nutrient acquisition to arbuscular mycorrhizal fungi. Fungal abundance per unit SOC in the rhizosphere of arid shrublands was much lower compared to other sites (Figure 4D) indicating that plants under arid conditions invest less into fungi than plants of Mediterranean shrubland or temperate rainforests.
Soil fraction (bulk topsoil vs. rhizosphere) influenced the percentage of diazotrophs of the prokaryotic part of the community. The percentage of diazotrophs in the rhizosphere was generally higher than in bulk topsoil at all sites (~10, ~8, and ~16 folds under arid shrubland, Mediterranean woodland, and temperate rainforest, respectively) (Figures 5C,D). This represents the frequently reported rhizosphere effect (71, 72) and underlines the importance of C and energy supply and thus the rhizosphere habitat for soil N cycling (73). Even though litter input is an important C source in the temperate rainforest, the quality and amount of C needed by diazotrophs for N fixation may not be met by litter C input. In contrast, the rhizosphere environment can supply diazotrophs with the needed C and energy, considering that roots supply more easily available C into the soil than rainforest floor litter (74, 75). Symbiotic N-fixing microorganisms, such as Rhizobia, and free-living N-fixing bacteria, such as Azotobacter, are both profiting from the benefits that root association provides (76, 77), where plant photosynthesis supplies diazotrophs with C in exchange for N (78). Generally, nifH gene copy number decreased from temperate rainforest to arid shrubland (Figure 5). Biological N-fixation is an immensely C and energy costly process, which can only be supported if environmental conditions (such as nutrient, water, or light availability) allow sufficient plant primary production and, thus, plant C investment in diazotrophs (71, 79). A higher net primary productivity in rainforest than woodland or shrubland (80) allows rainforest plants, with conservative root traits and a lower nutrient uptake capacity (26), to increase their N supply by the support of diazotrophs in high abundance in their rhizosphere.
Also, water shortage under arid and Mediterranean conditions likely hampers the investment of plants in N-fixing microorganisms. Greater soil moisture with increasing mean annual precipitation (29), on the contrary, results in more frequent anaerobic conditions favorable for free-living rhizosphere diazotrophs, and thus increases biological N-fixation (81). Interestingly, the abundance of diazotrophs in the rhizosphere decreases with depth of the temperate rainforest, whereas it increases with depth in the rhizosphere under the Mediterranean woodland and arid shrubland. This altered N fixation profile along soil depth might indicate distinct patterns of plant C allocation between sites. Plants in the arid shrubland seem to dominantly allocate C to the subsoil, which may remain partly moist even in the dry season, whereas plants in the temperate rainforest seem to focus their C allocation to nutrient-rich topsoils. The absolute abundance of diazotrophs decreased with increasing aridity (Figure 5C). The relative abundance (as percentage of diazotrophs in the prokaryotic community (Figure 5D) also decreased from the temperate rainforest to Mediterranean woodland but was similar in the woodland and arid shrubland. This pointed to a high relative importance of N fixation to cover the N demand of plants in the dry sites.
Conclusions
By combining molecular biology and soil biogeochemical tools along a continental transect, we were able to examine N acquisition strategies in ecosystems distinct in mean annual precipitation, mean annual temperate, and vegetation cover, but developed on similar granitoid soil parent material. While the accessibility of organic matter-bound N for microorganisms is restricted in the temperate rainforest, and N is rather immobilized in microbial biomass than mineralized, the organic-bound N in soils under Mediterranean woodland and arid shrubland is more available. Low N contents and low annual precipitations in the shrubland likely drive microorganisms to intensively recycle N. In contrast, a fast N mineralization and high leaching potential in the Mediterranean woodland likely result in larger N losses and a less intensive recycling of N than in the shrubland. Chitinase activities and relative bacterial and fungal abundance indicate an N source shift: from a peptide-based nutrition with intensive recycling of litter N at the arid and Mediterranean sites to a peptide- and chitin-based N nutrition in the temperate rainforest, where fungal necromass plays a crucial role as intermediate N pool. The absolute abundance of diazotrophs in the rhizosphere increased with increasing precipitation. Relative abundance (as percentage of diazotrophs in prokaryotic community) was of similar importance in both the arid and Mediterranean sites. This indicates the importance of diazotrophs for plant N nutrition under dryer ecosystems. The percentage of diazotrophs from the microbial bulk soil community was between 0.18% and 0.64% and increased to 2.09 and 8.20% in the rhizosphere. 8- to 16 times higher abundance of diazotrophs in the rhizosphere than in bulk soil highlights the importance of the rhizosphere as hotspot for the N fixation from atmosphere irrespective of the biotic and abiotic constraints.
Data Availability Statement
The raw data supporting the conclusions of this article will be made available by the authors, without undue reservation.
Author Contributions
KA contributed to conceptualization and design of the study, investigation, performed experimental work, data curation, and writing, reviewing, and editing of original manuscript. SSt and MK contributed to conceptualization and design of the study, investigation, sampling and performed experimental work, data curation, and writing, reviewing, and editing of original manuscript. FH contributed to data analysis and writing, reviewing, and editing of original manuscript. FN, FM, CM, and SSp contributed to reviewing and editing of original manuscript. AG contributed to conceptualization and design of the study and reviewing and editing of original manuscript. YK and MD contributed to conceptualization and design of the study, investigation, and reviewing and editing of original manuscript. All authors approve the submitted version.
Funding
This work was funded by the German Research Foundation (DFG) [project number KU 1184/36-11, DI 2136-11 and GO 897/13-1] within the Priority Program 1803 EarthShape – Earth Surface Shaping by Biota.
Conflict of Interest
The authors declare that the research was conducted in the absence of any commercial or financial relationships that could be construed as a potential conflict of interest.
Publisher's Note
All claims expressed in this article are solely those of the authors and do not necessarily represent those of their affiliated organizations, or those of the publisher, the editors and the reviewers. Any product that may be evaluated in this article, or claim that may be made by its manufacturer, is not guaranteed or endorsed by the publisher.
Acknowledgments
We thank the Chilean National Park Service Corporación Nacional Forestal (CONAF) for the permission to work in the National Park La Campana and the National Park Nahuelbuta as well as the Comunidad Agrícola Quebrada de Talca for the possibility to work in the local exclusion area for studying biodiversity and conservation. YK thanks the Program of Competitive Growth of Kazan Federal University and the RUDN University Strategic Academic Leadership Program. We are also thankful to the Center for Advanced Research in Arid Zones (CEAZA) for providing the possibility to work in the National Reserve Santa Gracia and the Centre for Stable Isotope Research and Analysis (KOSI).
Supplementary Material
The Supplementary Material for this article can be found online at: https://www.frontiersin.org/articles/10.3389/fsoil.2022.817641/full#supplementary-material
References
1. Cregger MA, McDowell NG, Pangle RE, Pockman WT, Classen AT. The impact of precipitation change on nitrogen cycling in a semi-arid ecosystem. Funct Ecol. (2014) 28:1534–44. doi: 10.1111/1365-2435.12282
2. Nearing MA, Jetten V, Baffaut C, Cerdan O, Couturier A, Hernandez M, et al. Modeling response of soil erosion and runoff to changes in precipitation and cover. Catena. (2005) 61:131–54. doi: 10.1016/j.catena.2005.03.007
3. Turpin-Jelfs T, Michaelides K, Blacker JJ, Benning LG, Williams JM, Anesio AM. Distribution of soil nitrogen and nitrogenase activity in the forefield of a High Arctic receding glacier. Ann Glaciol. (2018) 59:87–94. doi: 10.1017/aog.2018.35
4. Austin AT, Yahdjian L, Stark JM, Belnap J, Porporato A, Norton U, et al. Water pulses and biogeochemical cycles in arid and semiarid ecosystems. Oecologia. (2004) 141:221–35. doi: 10.1007/s00442-004-1519-1
5. Stark JM, Firestone MK. Mechanisms for soil moisture effects on activity of nitrifying bacteria. Appl Environ Microbiol. (1995) 61:218–21. doi: 10.1128/aem.61.1.218-221.1995
6. Weltzin JF, Loik ME, Schwinning S, Williams DG, Fay PA, Haddad BM, et al. Assessing the response of terrestrial ecosystems to potential changes in precipitation. Bioscience. (2003) 53:941–52. doi: 10.1641/0006-3568(2003)053<0941:ATROTE>2.0.CO;2
7. Kreuzwieser J, Gessler A. Global climate change and tree nutrition: influence of water availability. Tree Physiol. (2010) 30:1221–34. doi: 10.1093/treephys/tpq055
8. Schimel J, Balser TC, Wallenstein M. Microbial stress-response physiology and its implications for ecosystem function. Ecology. (2007) 88:1386–94. doi: 10.1890/06-0219
9. Xiang SR, Doyle A, Holden PA, Schimel JP. Drying and rewetting effects on C and N mineralization and microbial activity in surface and subsurface California grassland soils. Soil Biol Biochem. (2008) 40:2281–9. doi: 10.1016/j.soilbio.2008.05.004
10. Austin AT, Vitousek PM. Nutrient dynamics on a precipitation gradient in Hawai'i. Oecologia. (1998) 113:519–29. doi: 10.1007/s004420050405
11. Brunn M, Condron L, Wells A, Spielvogel S, Oelmann Y. Vertical distribution of carbon and nitrogen stable isotope ratios in topsoils across a temperate rainforest dune chronosequence in New Zealand. Biogeochemistry. (2016) 129:37–51. doi: 10.1007/s10533-016-0218-4
12. Natelhoffer KJ, Fry B. Controls on Natural Nitrogen-15 and Carbon-13 Abundances in Forest Soil Organic Matter. Soil Sci Soc Am J. (1988) 52:1633–40. doi: 10.2136/sssaj1988.03615995005200060024x
13. Billings SA, Richter DD. Changes in stable isotopic signatures of soil nitrogen and carbon during 40 years of forest development. Oecologia. (2006) 148:325–33. doi: 10.1007/s00442-006-0366-7
14. Austin AT. Differential effects of precipitation on production and decomposition along a rainfall gradient in Hawaii. Ecology. (2002) 83:328–38. doi: 10.1890/0012-9658(2002)083<0328:DEOPOP>2.0.CO;2
15. Kuzyakov Y, Xu X. Competition between roots and microorganisms for nitrogen: mechanisms and ecological relevance. New Phytol. (2013) 198:656–69. doi: 10.1111/nph.12235
16. Galloway JN, Dentener FJ, Capone DG, Boyer EW, Howarth RW, Seitzinger SP, et al. Nitrogen cycles: past, present, and future. Biogeochemistry. (2004) 70:153–226. doi: 10.1007/s10533-004-0370-0
17. Bradley JA, Singarayer JS, Anesio AM. Microbial community dynamics in the forefield of glaciers. Proc Biol Sci. (2014) 281:1795. doi: 10.1098/rspb.2014.0882
19. Duc L, Noll M, Meier BE, Burgmann H, Zeyer J. High diversity of diazotrophs in the forefield of a receding alpine glacier. Microb Ecol. (2009) 57:179–90. doi: 10.1007/s00248-008-9408-5
20. Zehr JP, Jenkins BD, Short SM, Steward GF. Nitrogenase gene diversity and microbial community structure: a cross-system comparison. Environ Microbiol. (2003) 5:539–54. doi: 10.1046/j.1462-2920.2003.00451.x
21. Gaby JC, Buckley DH. A global census of nitrogenase diversity. Environ Microbiol. (2011) 13:1790–9. doi: 10.1111/j.1462-2920.2011.02488.x
22. Lin YX, Ye GP, Liu DY, Ledgard S, Luo JF, Fan JB, et al. Long-term application of lime or pig manure rather than plant residues suppressed diazotroph abundance and diversity and altered community structure in an acidic Ultisol. Soil Biol Biochem. (2018) 123:218–28. doi: 10.1016/j.soilbio.2018.05.018
23. Inomura K, Bragg J, Riemann L, Follows MJ. A quantitative model of nitrogen fixation in the presence of ammonium. PLoS One. (2018) 13:e0208282. doi: 10.1371/journal.pone.0208282
24. Heijnen JJ, Roels JA. A macroscopic model describing yield and maintenance relationships in aerobic fermentation processes. Biotechnol Bioeng. (1981) 23:739–63. doi: 10.1002/bit.260230407
25. Gallon J. The oxygen sensitivity of nitrogenase: a problem for biochemists and micro-organisms. Trends Biochem Sci. (1981) 6:19–23. doi: 10.1016/0968-0004(81)90008-6
26. Stock SC, Koester M, Boy J, Godoy R, Najera F, Matus F, et al. Plant carbon investment in fine roots and arbuscular mycorrhizal fungi: a cross-biome study on nutrient acquisition strategies. Sci Total Environ. (2021) 781:146748. doi: 10.1016/j.scitotenv.2021.146748
27. Übernickel K, Ehlers TA, Ershadi MR, Paulino L, Fuentes Espoz JP, Maldonado A, et al. Time Series of Meteorological Station Data in the EarthShape Study Areas in the Coastal Cordillera, Chile. (2020).
28. Fick SE, Hijmans RJ. WorldClim 2: new 1-km spatial resolution climate surfaces for global land areas. Int J Climatol. (2017) 37:4302–15. doi: 10.1002/joc.5086
29. Bernhard N, Moskwa LM, Schmidt K, Oeser RA, Aburto F, Bader MY, et al. Pedogenic and microbial interrelations to regional climate and local topography: new insights from a climate gradient (arid to humid) along the Coastal Cordillera of Chile. Catena. (2018) 170:335–55. doi: 10.1016/j.catena.2018.06.018
30. Canessa R, Brink L, Saldaña A, Rios RS, Hättenschwiler S, Mueller CW, et al. Relative effects of climate and litter traits on decomposition change with time, climate and trait variability. J Ecol. (2020) 109:447–58. doi: 10.1111/1365-2745.13516
31. Hulton NRJ, Purves RS, McCulloch RD, Sugden DE, Bentley MJ. The last glacial maximum and deglaciation in southern South America. Quat Sci Rev. (2002) 21:233–41. doi: 10.1016/S0277-3791(01)00103-2
32. Oeser RA, Stroncik N, Moskwa LM, Bernhard N, Schaller M, Canessa R, et al. Chemistry and microbiology of the Critical Zone along a steep climate and vegetation gradient in the Chilean Coastal Cordillera. Catena. (2018) 170:183–203. doi: 10.1016/j.catena.2018.06.002
33. Schaller M, Ehlers TA, Lang KAH, Schmid M, Fuentes-Espoz JP. Addressing the contribution of climate and vegetation cover on hillslope denudation, Chilean Coastal Cordillera (26°-38°S). Earth Planet Sci Lett. (2018) 489:111–22. doi: 10.1016/j.epsl.2018.02.026
34. Koester M, Stock SC, Najera F, Abdallah K, Gorbushina A, Prietzel J, et al. From rock eating to vegetarian ecosystems - disentangling processes of phosphorus acquisition across biomes. Geoderma. (2021) 388:114827. doi: 10.1016/j.geoderma.2020.114827
35. Stock SC, Koster M, Dippold MA, Najera F, Matus F, Merino C, et al. Environmental drivers and stoichiometric constraints on enzyme activities in soils from rhizosphere to continental scale. Geoderma. (2019) 337:973–82. doi: 10.1016/j.geoderma.2018.10.030
36. Wilson KH, Blitchington RB, Greene RC. Amplification of bacterial 16S ribosomal DNA with polymerase chain reaction. J Clin Microbiol. (1990) 28:1942–6. doi: 10.1128/jcm.28.9.1942-1946.1990
37. Nakatsu CH, Marsh TL. Analysis of microbial communities with denaturing gradient gel electrophoresis and terminal restriction fragment length polymorphism. In: Reddy CA, Beveridge TJ, Breznak JA, Marzluf GA, Schmidt TM, Snyder LR, editors. Methods for General and Molecular Microbiology. Washington: ASM Press (2007). p. 909–23. doi: 10.1128/9781555817497.ch41
38. Stevenson BS, Drilling HS, Lawson PA, Duncan KE, Parisi VA, Suflita JM. Microbial communities in bulk fluids and biofilms of an oil facility have similar composition but different structure. Environ Microbiol. (2011) 13:1078–90. doi: 10.1111/j.1462-2920.2010.02413.x
39. O'Donnell K. Fusarium and its near relatives. In: Reynolds DR, Taylor JW, editors. The Fungal Holomarph: Mititic, Meiotic and Pleomorpic Speciation in Fungal Systematic. Wallingford: CAB International (1993). p. 225–33.
40. Cocolin L, Manzano M, Aggio D, Cantoni C, Comi G. A novel polymerase chain reaction (PCR) - denaturing gradient gel electrophoresis (DGGE) for the identification of Micrococcaceae strains involved in meat fermentations. Its application to naturally fermented Italian sausages. Meat Sci. (2001) 58:59–64. doi: 10.1016/S0309-1740(00)00131-5
41. Hsu SF, Buckley DH. Evidence for the functional significance of diazotroph community structure in soil. ISME J. (2009) 3:124–36. doi: 10.1038/ismej.2008.82
42. Poly F, Monrozier LJ, Bally R. Improvement in the RFLP procedure for studying the diversity of nifH genes in communities of nitrogen fixers in soil. Res Microbiol. (2001) 152:95–103. doi: 10.1016/S0923-2508(00)01172-4
43. Martin-Sanchez PM, Gebhardt C, Toepel J, Barry J, Munzke N, Gunster J, et al. Monitoring microbial soiling in photovoltaic systems: A qPCR-based approach. Int Biodeterior Biodegrad. (2018) 129:13–22. doi: 10.1016/j.ibiod.2017.12.008
44. Alfaro-Espinoza MG, Ullrich MS. Isolation and Molecular Characterization of Nitrogen-Fixing Bacteria Associated With Mangroves Roots. Bremen: Universität Bremen. (2011).
45. R Core Team. R: A Language and Environment for Statistical Computing. Vienna: R Foundation for Statistical Computing (2018).
46. Paternoster R, Brame R, Mazerolle P, Piquero A. Using the correct statistical test for the equality of regression coefficients. Criminology. (1998) 36:859–66. doi: 10.1111/j.1745-9125.1998.tb01268.x
47. Vu VQ. ggbiplot: A ggplot2 Based Biplot. R package. (2011). p. 342. Available online at: http://github.com/vqv/ggbiplot
48. Booth MS, Stark JM, Rastetter E. Controls on nitrogen cycling in terrestrial ecosystems: A synthetic analysis of literature data. Ecol Monogr. (2005) 75:139–57. doi: 10.1890/04-0988
49. Zhang D, Hui D, Luo Y, Zhou G. Rates of litter decomposition in terrestrial ecosystems: global patterns and controlling factors. Journal of Plant Ecology. (2008) 1:85–93. doi: 10.1093/jpe/rtn002
50. Pei G, Liu J, Peng B, Gao D, Wang C, Dai W, et al. Nitrogen, lignin, C/N as important regulators of gross nitrogen release and immobilization during litter decomposition in a temperate forest ecosystem. For Ecol Manag. (2019) 440:61–9. doi: 10.1016/j.foreco.2019.03.001
52. Janssen BH. Nitrogen mineralization in relation to C:N ratio and decomposability of organic materials. Plant Soil. (1996) 181:39–45. doi: 10.1007/BF00011290
53. Cleveland CC, Liptzin D. C:N:P stoichiometry in soil: is there a “Redfield ratio” for the microbial biomass? Biogeochemistry. (2007) 85:235–52. doi: 10.1007/s10533-007-9132-0
54. Aerts R. Climate, leaf litter chemistry and leaf litter decomposition in terrestrial ecosystems: a triangular relationship. Oikos. (1997) 79:439. doi: 10.2307/3546886
55. Hogberg P. Tansley Review No. 95 (15) N Natural abundance in soil-plant systems. New Phytol. (1997) 137:179–203. doi: 10.1046/j.1469-8137.1997.00808.x
56. Hobbie EA, Ouimette AP. Controls of nitrogen isotope patterns in soil profiles. Biogeochemistry. (2009) 95:355–71. doi: 10.1007/s10533-009-9328-6
57. Drollinger S, Kuzyakov Y, Glatzel S. Effects of peat decomposition on δ13C and δ15N depth profiles of Alpine bogs. Catena. (2019) 178:1–10. doi: 10.1016/j.catena.2019.02.027
58. Robinson D. δ15N as an integrator of the nitrogen cycle. Trends Ecol Evol. (2001) 16:153–62. doi: 10.1016/S0169-5347(00)02098-X
59. Schwinning S, Sala OE. Hierarchy of responses to resource pulses in arid and semi-arid ecosystems. Oecologia. (2004) 141:211–20. doi: 10.1007/s00442-004-1520-8
60. McCulley RL, Burke IC, Lauenroth WK. Conservation of nitrogen increases with precipitation across a major grassland gradient in the Central Great Plains of North America. Oecologia. (2009) 159:571–81. doi: 10.1007/s00442-008-1229-1
61. Reichmann LG, Sala OE, Peters DPC. Water controls on nitrogen transformations and stocks in an arid ecosystem. Ecosphere. (2013) 4:art11. doi: 10.1890/ES12-00263.1
62. Kieft TL, Soroker E, Firestone MK. Microbial biomass response to a rapid increase in water potential when dry soil is wetted. Soil Biol Biochem. (1987) 19:119–26. doi: 10.1016/0038-0717(87)90070-8
63. Unger S, Maguas C, Pereira JS, David TS, Werner C. The influence of precipitation pulses on soil respiration - assessing the “Birch effect” by stable carbon isotopes. Soil Biol Biochem. (2010) 42:1800–10. doi: 10.1016/j.soilbio.2010.06.019
64. Chen J, Kuzyakov Y, Jenerette GD, Xiao GL, Liu W, Wang ZF, et al. Intensified precipitation seasonality reduces soil inorganic n content in a subtropical forest: greater contribution of leaching loss than N2O emissions. J Geophys Res Biogeosci. (2019) 124:494–508. doi: 10.1029/2018JG004821
65. Olander LP, Vitousek PM. Regulation of soil phosphatase and chitinase activityby N and P availability. Biogeochemistry. (2000) 49:175–91. doi: 10.1023/A:1006316117817
66. Parham JA, Deng SP. Detection, quantification and characterization of β-glucosaminidase activity in soil. Soil Biol Biochem. (2000) 32:1183–90. doi: 10.1016/S0038-0717(00)00034-1
67. Rietl AJ, Jackson CR. Effects of the ecological restoration practices of prescribed burning and mechanical thinning on soil microbial enzyme activities and leaf litter decomposition. Soil Biol Biochem. (2012) 50:47–57. doi: 10.1016/j.soilbio.2012.03.008
68. Myers RT, Zak DR, White DC, Peacock A. Landscape-level patterns of microbial community composition and substrate use in upland forest ecosystems. Soil Sci Soc Am J. (2001) 65:359–67. doi: 10.2136/sssaj2001.652359x
69. Hogberg MN, Hogberg P, Myrold DD. Is microbial community composition in boreal forest soils determined by pH, C-to-N ratio, the trees, or all three? Oecologia. (2007) 150:590–601. doi: 10.1007/s00442-006-0562-5
70. Boyle SA, Yarwood RR, Bottomley PJ, Myrold DD. Bacterial and fungal contributions to soil nitrogen cycling under Douglas fir and red alder at two sites in Oregon. Soil Biol Biochem. (2008) 40:443–51. doi: 10.1016/j.soilbio.2007.09.007
71. Burgmann H, Meier S, Bunge M, Widmer F, Zeyer J. Effects of model root exudates on structure and activity of a soil diazotroph community. Environ Microbiol. (2005) 7:1711–24. doi: 10.1111/j.1462-2920.2005.00818.x
72. Kuzyakov Y, Razavi BS. Rhizosphere size and shape: temporal dynamics and spatial stationarity. Soil Biol Biochem. (2019) 135:343–60. doi: 10.1016/j.soilbio.2019.05.011
73. Emmett BD, Buckley DH, Drinkwater LE. Plant growth rate and nitrogen uptake shape rhizosphere bacterial community composition and activity in an agricultural field. New Phytol. (2020) 225:960–73. doi: 10.1111/nph.16171
74. Jones DL, Nguyen C, Finlay RD. Carbon flow in the rhizosphere: carbon trading at the soil-root interface. Plant Soil. (2009) 321:5–33. doi: 10.1007/s11104-009-9925-0
75. Spohn M, Kuzyakov Y. Spatial and temporal dynamics of hotspots of enzyme activity in soil as affected by living and dead roots-a soil zymography analysis. Plant Soil. (2014) 379:67–77. doi: 10.1007/s11104-014-2041-9
76. Poole P, Ramachandran V, Terpolilli J. Rhizobia: from saprophytes to endosymbionts. Nat Rev Microbiol. (2018) 16:291–303. doi: 10.1038/nrmicro.2017.171
77. Smercina DN, Evans SE, Friesen ML, Tiemann LK. To fix or not to fix: controls on free-living nitrogen fixation in the rhizosphere. Appl Environ Microbiol. (2019) 85:e02546–e02518. doi: 10.1128/AEM.02546-18
78. Pankievicz VCS, Irving TB, Maia LGS, Ane JM. Are we there yet? The long walk towards the development of efficient symbiotic associations between nitrogen-fixing bacteria and non-leguminous crops. BMC Biol. (2019) 17:99. doi: 10.1186/s12915-019-0710-0
79. Klucas RV. Associative nitrogen fixation in plants. In: Dilworth MJ, Glenn AR, editors. Biology and Biochemistry of Nitrogen Fixation. Amsterdam: Elsevier (1991). p. 187–198.
80. Werner C, Schmid M, Ehlers TA, Fuentes-Espoz JP, Steinkamp J, Forrest M, et al. Effect of changing vegetation and precipitation on denudation - Part 1: Predicted vegetation composition and cover over the last 21 thousand years along the Coastal Cordillera of Chile. Earth Surface Dyn. (2018) 6:829–58. doi: 10.5194/esurf-6-829-2018
Keywords: nitrogen, rhizosphere, microbial abundance, natural abundance of 15N, nitrogen fixation, nitrogen uptake
Citation: Abdallah K, Stock SC, Heeger F, Koester M, Nájera F, Matus F, Merino C, Spielvogel S, Gorbushina AA, Kuzyakov Y and Dippold MA (2022) Nitrogen Gain and Loss Along an Ecosystem Sequence: From Semi-desert to Rainforest. Front. Soil Sci. 2:817641. doi: 10.3389/fsoil.2022.817641
Received: 18 November 2021; Accepted: 20 January 2022;
Published: 15 February 2022.
Edited by:
Haijian Bing, Institute of Mountain Hazards and Environment, Chinese Academy of Sciences (CAS), ChinaReviewed by:
Mianhai Zheng, South China Botanical Garden, Chinese Academy of Sciences (CAS), ChinaJinlong Dong, Institute of Soil Science, Chinese Academy of Sciences (CAS), China
Copyright © 2022 Abdallah, Stock, Heeger, Koester, Nájera, Matus, Merino, Spielvogel, Gorbushina, Kuzyakov and Dippold. This is an open-access article distributed under the terms of the Creative Commons Attribution License (CC BY). The use, distribution or reproduction in other forums is permitted, provided the original author(s) and the copyright owner(s) are credited and that the original publication in this journal is cited, in accordance with accepted academic practice. No use, distribution or reproduction is permitted which does not comply with these terms.
*Correspondence: Khaled Abdallah, a2hhbGVkLmFiZGFsbGFoQGJhbS5kZQ==
†These authors have contributed equally to this work and share first authorship