 Viktoriia Meklesh1,2*
 Luigi Gentile3†
 Erika Andersson2
 Abhishek Bhattacharya4
 Marcelo A. de Farias5Mateus B. Cardoso5,6
 Henrik Stålbrand4Watson Loh7Martin Škerlep3
 Emma Kritzberg3
 Anders Tunlid3
 Ulf Olsson2
 Per Persson1,3
- 1Centre for Environmental and Climate Science, Faculty of Science, Lund University, Lund, Sweden
- 2Physical Chemistry Division, Department of Chemistry, Lund University, Lund, Sweden
- 3Department of Biology, Lund University, Lund, Sweden
- 4Center for Molecular Protein Science, Division of Biochemistry and Structural Biology, Department of Chemistry, Lund University, Lund, Sweden
- 5Brazilian Nanotechnology National Laboratory, Brazilian Center for Research in Energy and Materials, Campinas, Brazil
- 6Brazilian Synchrotron Light Laboratory, Brazilian Center for Research in Energy and Materials, Campinas, Brazil
- 7Institute of Chemistry, University of Campinas, Campinas, Brazil
Components of dissolved organic matter (DOM) span from sub-nm molecules to colloidal aggregates of several hundred nm. The colloidal fraction is important for the transport of organic matter and associated elements in the environment, and for the stability of DOM constituents with respect to microbial decomposition. This study focuses on the colloidal properties of DOM extracted from spruce forest soils of a chronosequence. The DOM samples were obtained by common water extraction procedures at 21 and 100°C, respectively. We applied an experimental approach combining chemical analysis with light and X-ray scattering techniques that informed on the colloidal size, charge, and structure of DOM. Results showed that two main types of colloids were present: semi-flexible cylinders and fractal aggregates. The cylinders consisted of carbohydrates, presumably hemicelluloses, while the aggregates were a composite material containing a large fraction of carbohydrates together with aliphatics and clay particles. These fractal aggregates dominated the cold-water extracts whereas the strong increase in total organic carbon by hot-water extraction caused a concomitantly strong increase of semi-flexible cylinders, which became the predominant species. Comparison between the chronosequence soils showed that with increasing forest age, the amount of carbon extracted per gram of soil declined and the concentration of the semi-flexible cylinders decreased. Thus, the distribution between the fractal aggregates and cylinders in the forest soil DOM samples depends on the composition of the soil organic matter and the leaching temperature. Changes in this distribution may have important implications for the reactivity and stability of DOM colloids.
Introduction
The soluble fraction of organic compounds in soils, i.e., dissolved organic matter (DOM), plays a crucial role in the biogeochemical cycles of carbon and other elements that are either associated with or in other ways affected by DOM (1–3). For instance, DOM contributes to the formation of organo-mineral associations that are believed to protect organic compounds from microbial decomposition (4–6), and lateral export of soil DOM to surface waters connects the terrestrial and aquatic carbon cycles (7). Moreover, metal ions and inorganic and organic molecules can bind to components of DOM and these interactions influence the fate of both nutrients and contaminants (8–10).
Terrestrial DOM is formed from the decay of plant litter material and biomolecules released from living and dead microorganisms. Accordingly, DOM composition can be roughly divided into main classes of chemical compounds such as carbohydrates, lignin-like aromatic compounds, tannins, fatty acids, polypeptides, and low molecular-weight organic acids. However, the molecular diversity in each class is typically very large as shown by numerous spectroscopic and chromatographic studies of DOM (11). In particular high-resolution mass spectrometry (MS) has been instrumental in highlighting the molecular diversity of DOM and such analyses have identified several hundreds to thousands of low molecular weight compounds in DOM that can be assigned to the main compound classes (12–14). Also, nuclear magnetic resonance (NMR) spectroscopy has made important contributions to our understanding of DOM composition (13, 15–18). Typically, NMR spectroscopy cannot provide the same detailed molecular characterization of DOM as available from high-resolution MS, but NMR has the advantage of often giving a better representation of the bulk composition since this technique is not limited by the same selectivity issues of the ionization process required in MS (11).
An important characteristic of DOM is that it is operationally defined as the fraction of organic matter in solution that passes through a filter of a given pore size (typically 0.45 or 0.2 μm). This implies that DOM components can vary over several orders of magnitude in size from sub-nm molecules to colloidal objects of several 100 nm. While our understanding of DOM composition has increased significantly with the introduction of new spectroscopic methods, less is known about the properties of DOM colloids, in particular the correlation between composition and the colloidal structure and size. This knowledge gap limits our ability to assess the fate of DOM colloids because in analogy with bio-macromolecules the reactivity and function of DOM colloids are strongly related to their shape and structure (19, 20). For instance, these properties will influence the retention of DOM as it is filtered through the soil profile and the ability of DOM colloids to serve as a vector for metals, nutrients and contaminants. Also, DOM colloids present a high concentration of organic carbon (21) and are believed to be important for stabilization of organic matter. Recent conceptual models have suggested that organic molecules in soils can form supramolecular aggregates and the formation of these aggregates will alter the bioavailability of the organic molecules (22, 23). However, the information on the structure and reactivity of such colloidal aggregates in soil DOM is scarce.
Much of what is known about DOM colloids comes from studies either of synthetic systems or of water samples from ponds, rivers, or oceans. Based on these studies a picture has emerged where the low molecular weight compounds of DOM self-associate into larger colloidal aggregates (24–26). These colloids at nanometer length scales can further assemble into larger clusters of μm sizes. Experimental evidences for this view have been obtained by size exclusion chromatography, NMR spectroscopy, transmission electron microscopy, atomic force microscopy, dynamic light scattering (DLS) and small-angle neutron scattering (SANS) (19, 25, 27–35). In parallel with and triggered by the experimental findings there has been a development of conceptual models describing the architecture of the colloidal and macromolecular part of DOM. Wershaw (24) proposed that during decomposition, aromatic and lipid plant components are transformed to amphiphilic molecules that form micelle-like aggregates in solution. Subsequently, Schulten and Schnitzer (36) proposed a model where DOM is described as a branched and cross-linked network with room for solvent molecules, electrolyte ions and organic molecules. This is in line with Benedetti et al. (37) who suggested that DOM, consisting of humic and fulvic acids, can be viewed as polymer gels. Later, it was argued that DOM consists of supramolecular aggregates that are clustered together by weak hydrophobic and hydrogen bonds (25). Ni and Pignatello (38) recognized that in addition to such weak bonds, DOM can aggregate via the formation of strong charge-assisted hydrogen bonds. A recent development of this model described the supramolecular aggregates in DOM as a hierarchical organization where smaller aggregates stabilized by strong hydrogen bonds are encapsulated in a dynamic and dispersible hydrogel that is held together by weaker forces (20).
The proposed models of colloidal and macromolecular structure of DOM are important conceptual frameworks for understanding the role of DOM in biogeochemical processes in terrestrial and aquatic environments. However, more experimental evidence is needed to further corroborate and refine the models and so far empirical data on the colloidal structure and size of soil DOM is limited. In order to link these colloidal DOM properties to biogeochemical soil processes such as microbial DOM decomposition and formation of organo-mineral associations that are central to soil functions, we need a proper description of the colloidal DOM because of the intimate relationship between colloidal structure and function. To accomplish this we argue that both the chemical composition and colloidal structure need to be characterized and have therefore applied an experimental approach that includes both spectroscopic and light and X-ray scattering techniques. To our knowledge, this is the first study that implements and shows the potential of such a comprehensive multi-technique approach to determine the composition, size, charge, and structure of the DOM colloids. Specifically, we address the questions how these colloidal properties vary with commonly used extraction procedures as well as forest stand age by comparing DOM extracted by cold (21°C) and hot (100°C) water from the O-horizon of a Norway spruce forest of three different ages (35, 61, and 90-years-old). Results are compared with adjacent field sites devoid of tree growth. We acknowledge that the extraction temperatures do not reflect natural soil conditions, instead temperature variation should be viewed as a mean to probe fundamental characteristics of the organic material and to reveal effects of extraction procedures used in many soil science studies.
Materials and Methods
Soils Samples
The soil samples were collected in October 2018 at the Tönnersjöheden controlled experimental area (39, 40), located at Simlångsdalen (56°42′2.47″N, 13°6′57.75″W) in the county of Halland, Southwestern Sweden. The soils have developed on glacio-fluvial material and are classified as dysric arenosols and dystric regosols (41). The soil samples were collected from the top organic layer of 3 afforested plots representing a first-generation Norway spruce (Picea abies) chronosequence of 35, 61, and 90-years-old stands. To each forest plot we assigned an adjacent reference plot, with only grass growing, from which reference samples were collected, to represent soil without tree growth. Hence, in total the study included six soil samples, three from forested, and three from reference plots. Depending on the organic O layer development the sampled depth was different: ~10 cm in the 90-years-old stand; ~7 cm in the 61-years-old stand; ~5 cm in the 35-years-old stand and the top 10 cm in all the reference grassland soils. DOM extracts from all soils were characterized with bulk elemental analysis, NMR and IR spectroscopy, dynamic light scattering and small angle X-ray scattering. For the carbohydrate analysis (see section Carbohydrate Analysis) we used soils from the same plots but collected ca. 6 months later in April 2019 due to lack of material. We were also given the opportunity to perform an X-ray scattering synchrotron experiment on a dilution series of one DOM sample as well as cryogenic transmission electron microscopy (cryo-TEM) measurements (see sections Small-Angle X-Ray Scattering and Cryogenic-Transmission Electron Microscopy). The soil available for these measurements was from a 48-years-old forest plot of the same experimental area. After collection, all soil samples were sieved through a 2 mm nylon mesh sieve and stored in sealed plastic bags at 4°C in the dark. The DOM extracts were made within 1 month after soil sampling except the samples for carbohydrate analysis that were extracted ca. 5 months after collection.
Extraction of DOM
The DOM fraction in soils are commonly extracted with water or dilute salt solutions (3, 42). In this study, the soil samples were extracted using either cold (21°C) or hot (100°C) water. While 21°C rather may be considered as ambient, we here use the notation “cold” in accordance with previous studies that used the cold and hot extraction terminology (43, 44). According to Zsolnay (2), depending on the size of the pores in the solid matrix where DOM is located, these samples should contain DOM fractions in soils that are available and mobile, available in-situ but not mobile, and part of the fraction that is potentially available. The extractions were carried out by mixing the soil samples with Milli-Q water at a 1:5 w/v ratio (a 1:2 w/v ratio was used for the cold DOM extracts subjected to carbohydrate analysis). The soil suspension was shaken for 24 h at room temperature in the case of cold-water extraction while the hot-water extract was obtained from boiling for 1 h. The suspensions were filtered through a nylon mesh with 150 μm mesh openings (SEFAR Nitex 03-150/50; Sefar, Heiden, Switzerland) and the solution phase was centrifuged at 4,000 rpm (1,700 g-force) for 5 min. The supernatants were separated from the remaining soil particles by sequential filtration using glass fiber filters (2.7 μm, Grade GF/D; 1.6 μm, GF/A; 0.7 μm, GF/F; Whatman, Maidstone, UK) and a 200 nm sterile membrane filter (Sarstedt AG and Co., KG, Nuembrecht, Germany). The DOM extracts were stored in sterile test tubes at 4°C. DOM was freeze-dried prior to the solid-state 13C NMR, IR spectroscopy and the dilution experiments. The final DOM solutions of the 35-, 61-, and 90-years-old forest soils from cold-water extraction are denoted FC35, FC61, and FC90 while the hot-water extracts are denoted FH35, FH61, and FH90. The corresponding reference (grassland) DOM samples are denoted GCref35, GCref61, GCref90, GHref35, GHref61, and GHref90. To check the reproducibility of the extraction protocol, two independent extractions were carried out by two different persons for each soil, and these were characterized with respect to TOC, pH, 1H NMR spectra, and Fe concentration. Their mean values and standard deviations are calculated and reported in Table 1. One of these extraction series was selected and characterized in detail by means of additional spectroscopic and scattering methods. This series was also dialyzed.
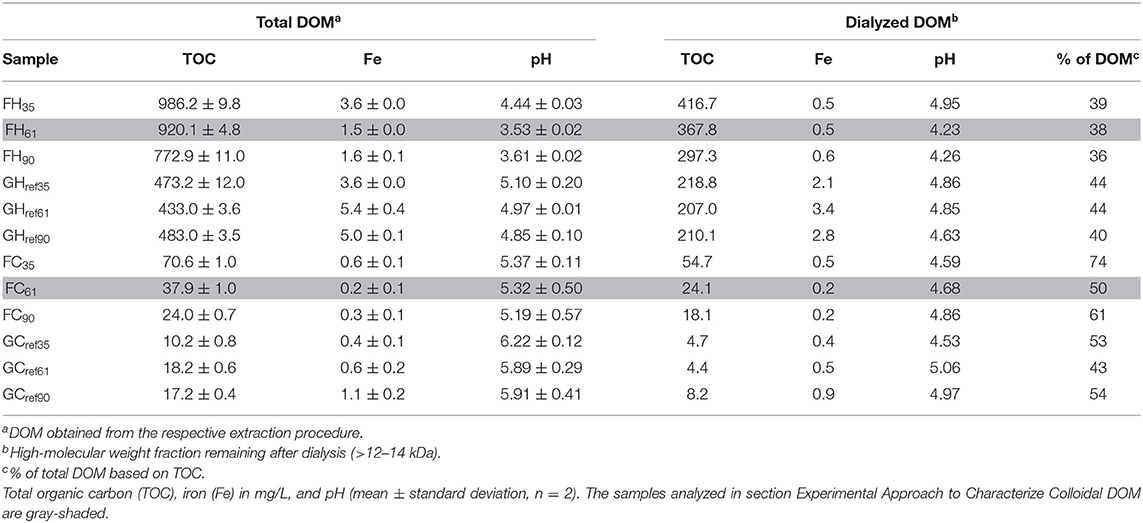
Table 1. Chemical composition of the DOM samples.
DOM dialysis was accomplished using Spectra/Por® 2 membrane with molecular weight cut-off of 12–14 kDa, corresponding to a membrane pore size of ca. 4 nm (45). The DOM extracts were dialyzed for 10 days at 4°C. The Milli-Q water was exchanged every ca. 12 h. The ratio of sample to water was 10 (i.e., 10 ml of DOM in 100 ml of Milli-Q water). The remaining high molecular weight fraction (>12–14 kDa) was used for further analysis and is denoted as dialyzed DOM hereafter.
pH was measured directly on extracted DOM solutions using a combination pH electrode (ref no. 6.0224.100, CH-9100 Herisau, Metrohm AG, Switzerland). The electrode was calibrated against two buffer solutions with pH 4.0 and 7.0 (Metrohm AG, Switzerland) at 21°C. The calibration and conversion of measured electric potential from millivolts into pH scale was accomplished with a laboratory pH meter (one channel, 913 pH meter, Metrohm AG, Switzerland).
Elemental Analysis of DOM
The concentrations of total organic carbon (TOC) and total nitrogen (TN) were measured with an organic C analyzer (Shimadzu Corp., Kyoto, Japan) equipped with a total nitrogen module (TNM-1). The amounts of iron (Fe) and phosphorous (P) were determined by means of ICP-OES instrument (Inductively Coupled Plasma Optical Emission Spectrometry) from Optima 8300, Perkin Elmer, Waltham, MA, USA.
Solid-State 13C NMR Spectroscopy
Solid-state 13C NMR spectra were obtained from freeze-dried DOM samples on a Bruker AVII-500 spectrometer (Bruker, Germany) operating at a frequency of 125 MHz for 13C and at 500 MHz for 1H. The temperature was kept at 25°C using a BVT-2000 temperature control (Bruker). The cross-polarization magic angle spinning (CP-MAS) technique was employed using a ramped 1H pulse to fulfill the Hartmann-Hahn matching condition (46). The sample was spun at the magic angle with a spinning frequency of 5 kHz. For each spectrum 3040 scans were acquired with a relaxation delay of 5 s. The free induction decay (FID) was multiplied by an exponential function corresponding to a line broadening of 85 Hz before Fourier transformation. A zero-order phase correction was applied to the spectra, and the 13C chemical shifts were calibrated with glycine (43.67 ppm).
1H NMR Spectroscopy
Solution state, 1H spectra were recorded on a Bruker Avance III HD 500.17 MHz spectrometer (Bruker, Germany), equipped with a 5-mm broadband probe. All spectra were acquired at room temperature and the samples had a final volume of 0.5 ml and composition of composition of 90 to 10 in v/v of water/deuterium oxide D2O (99.8%, Armar Chemicals, Switzerland). DOM spectra were recorded with a modified water-suppression pulse sequence (excitation sculpting) using an acquisition time of 1 s and a relaxation delay of 4 s (47). This procedure facilitated the observation of the relatively weak resonances from DOM components in aqueous solution. In total 1,024 scans were recorded, and the spectral resolution was 1 data point per 0.0001 ppm corresponding to 131,072 data points per scan. The residual HDO peak at 4.694 ppm was used as a reference to calibrate chemical shifts. Spectra were baseline corrected (zero-order and first-order) and processed with 2 Hz of apodization (Lorentzian broadening function) using Bruker TopSpin software version 4.0.6. In order to determine the relative intensity distribution, the spectra were divided into six chemical shift regions that were integrated using the Origin software (v. Pro 2018).
IR Spectroscopy
The diffuse reflectance infrared Fourier-transform (DRIFT) spectra of freeze-dried DOM samples were recorded with Bruker IR spectrometer (VERTEX 80v; Bruker, Billerica, Massachusetts) equipped with Praying Mantis™ Diffuse Reflection Accessory (Harrick Scientific Products Inc.). The spectra were recorded at room temperature under vacuum. Samples were prepared using 98 mg of KBr (Merck, Uvasol CAS no. 7758-02-3, Darmstadt, Germany) mixed with 2 mg of freeze-dried DOM, thoroughly ground and mixed, and placed into the sample cup. For each sample, 128 scans were collected at a resolution of 4 cm−1. IR spectra were cut from 4,000 to 400 cm−1 and baseline corrected using a spline interpolation method in the Origin software (v. Pro 2018).
Dynamic Light Scattering and Electrophoretic Mobility Measurements
The dynamic light scattering (DLS) and electrophoretic mobility data were acquired with a Zetasizer Nano ZS instrument (Malvern Instruments, Ltd., Worcestershire, UK). Both types of measurements were performed at 25°C and at a fixed scattering angle of 173° using a wavelength of 632.8 nm. The average colloidal size was calculated from a cumulant analysis of the field correlation function, g1(τ) (see in Supplementary Material S2.1). ζ-potential was calculated from electrophoretic mobility with the Henry equation: UE = (2εε0ζ/3η0)f(κRH), where ζ is the zeta-potential at the particle surface, ε is the dielectric constant of the medium, ε0 is the permittivity of the vacuum, and η0 is solvent viscosity. For water ε = 78.5 and η0 = 0.8872 Pa·s at 25°C. The ζ values were calculated using the Smoluchowski approximation f(κRH) = 1.5, which is valid for aqueous solutions having moderate electrolyte concentrations (48). The measured correlation function and electrophoretic mobility values were averaged over three consecutive measurements.
Small-Angle X-Ray Scattering
The SAXS measurements were performed with a SAXSLab Ganesha 300XL instrument (SAXSLAB ApS, Skovlunde, Denmark), which is a pinhole collimated system equipped with a Genix 3D X-ray source (Xenocs SA, Sassenage, France). The scattering intensity I(q) was recorded at three different sample-to-detector distances, yielding a combined scattering vector q-range of 0.004–1 Å−1. The scattering vector q is defined as q = (4π/λ)sin(θ/2), where λ = 1.54 Å is the X-ray wavelength and θ is the scattering angle. Samples were sealed at room temperature in a 1.5-mm diameter quartz capillary (Hilgenberg GmbH, Malsfeld, Germany). In all cases, the temperature was controlled by an external recirculating water bath fixed to 25.0 ± 0.1°C. The two-dimensional (2D) scattering pattern was recorded using a 2D 300 k Pilatus detector (Dectris Ltd., Baden, Switzerland) and radially averaged using SAXSGui software to obtain I(q). The measured scattering patterns were corrected for background capillary and solvent scattering and transformed to an absolute scale by calibration against scattering from Milli-Q water.
SAXS experiments on a dilution series of DOM samples were performed at the SAXS1 beamline of the Brazilian Synchrotron Light Laboratory (LNLS, Brazil), using two sample-detector distances, 0.88 and 3.07 m, to cover a two order of magnitude q-range. The high flux of the synchrotron beamline was necessary to detect the low scattering intensity of the dilute DOM samples.
Carbohydrate Analysis
The monosugar components of the carbohydrates present in the DOM soil samples were determined by acid hydrolysis using a modified method of Aguedo et al. (49). The acid hydrolysis method was optimized for this study and a new method was developed for separation and analysis of the eight monosaccharides using high-performance anion-exchange chromatography with pulsed amperometry (HPAEC-PAD). Two milliliters of the newly prepared cold DOM extracts were hydrolyzed using a final concentration of 0.5 M H2SO4 for 3h at 100°C and neutralized using 0.1M Ba(OH)2. Millipore water was then added up to a final volume of 10 ml. Each extract was hydrolyzed in triplicates. The original DOM sample(s) (diluted 5-fold in Millipore water) were used for analysis of free monosaccharides, however, none were detected. The samples were filtered (0.22 μm) and analyzed by HPAEC (IC-5000, Dionex) using a CarboPac PA20 column (150 mm × 3, 6.5 μm) and guard column (30 mm × 3 mm) of the same material. Two different separation methods were used for analysis of monosaccharides; the first method was used to quantify fucose, galactose, glucose, xylose, mannose, and ribose while the second method quantified rhamnose and arabinose. In the first method, the separation was carried out using an isocratic flow of 0.45 mM NaOH for 22 min followed by washing with 100 mM NaOH for 5 min and re-equilibration with 0.45 mM NaOH for 5 min. The flow rate was maintained at 0.5 ml/min. In the second method, the separation was carried out using a gradient flow of 7.5 mM-1 mM NaOH for 12 min followed by washing with 100 mM NaOH for 5 min and re-equilibration with 7.5 mM NaOH for 5 min. The flow rate was maintained at 0.3 ml/min. Standards of fucose, galactose, glucose, xylose, mannose, ribose, rhamnose, and arabinose were used for quantification. Anhydro correction to account for the protons or hydroxides added during the hydrolysis of polysaccharides was applied to determine the amount of monosugars in polymeric form. The correction was carried out by first subtracting the free monosaccharides (in this case none) from the total content and then multiplying the amount of hexoses and deoxy-sugars with 0.90 and amount of pentoses with 0.88.
Cryogenic-Transmission Electron Microscopy
Lacey carbon-coated copper grids (Ted Pella, USA) were subjected to a glow discharge treatment using a Pelco easiGlow discharge system (Ted Pella, USA). Subsequently, the samples were prepared on these grids in a controlled environment vitrification system (Vitrobot Mark IV, Thermo Fischer Scientific, USA). Samples were analyzed using a TALOS F200C (Thermo Fischer Scientific, USA) transmission electron microscope operating at 200 kV under low dose condition. The images were acquired with a CMOS camera Ceta 16M 4k × 4k pixels (Thermo Fischer Scientific, USA). The measurements were performed at the Brazilian Nanotechnology National Laboratory (LNNano).
We summarized all the methods and main outcomes in Figure 1.
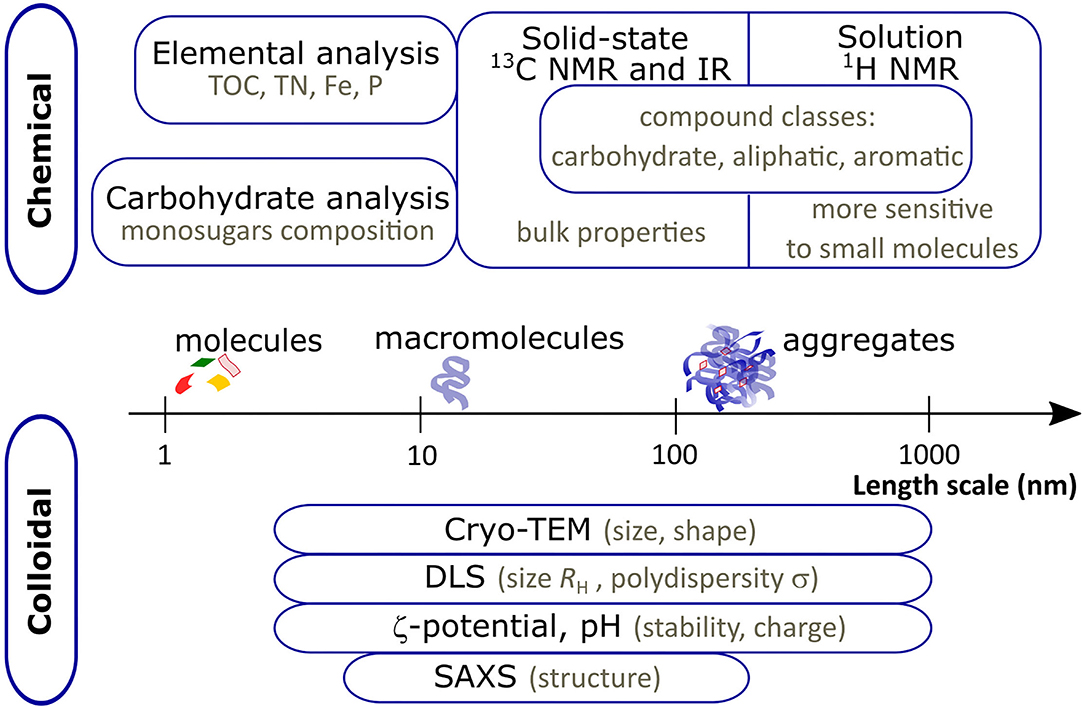
Figure 1. Schematic diagram summarizing the chemical and colloidal characterization methods used in the study with main outcomes of the experiments. The length scale corresponds to the size probed with colloidal methods.
Results and Discussion
Major Chemical Components of the DOM Samples
The TOC concentrations of the extracted DOM samples reflect the extraction efficiency. These concentrations were markedly higher in samples extracted with hot than cold water, which highlighted the strong temperature dependence of the extraction procedure (Table 1). This result is consistent with a previously observed exponential increase of dissolved organic C and N when the extraction temperature was increased from 20 to 80°C (50). We observed similar increasing trends with increasing temperature for the other analyzed elements (Table 1 and Supplementary Table S1), and the correlation between higher TOC and lower pH indicated an acidic character of some of the extracted compounds. In the dialyzed samples, the TOC concentrations dropped to 36–44% and 43–74% of the corresponding TOC values of total DOM in the hot and cold extracted samples, respectively (Table 1). These results imply that the fraction of colloidal carbon compounds in the DOM samples is within the same range as those values because the cut-off of the dialysis membrane (4 nm) is close to the low end of the colloidal length scale (48). Hence, the carbon compounds remaining after dialysis should be mainly of colloidal character and roughly spanning the size range 4–200 nm. Moreover, we observed decreasing TOC concentrations with increasing forest stand age for both FH and FC samples. This trend persisted in the dialyzed samples suggesting that increasing stand age also resulted in a decrease of the colloidal fraction. Compared to the FH and FC samples, the reference soil samples displayed no clear trend in TOC concentrations with sampling sites suggesting that the soil materials of the reference samples were similar probably because of similar grass vegetation.
The solid-state CP-MAS 13C NMR spectra obtained on freeze-dried hot and cold DOM extracts showed pronounced resonances at 50–80 ppm and around 100 ppm indicative of O-alkyl carbon atoms (Figure 2A). These resonances are in agreement with cellulose-like materials and thus suggested a predominance of carbohydrates in the DOM samples (51, 52). The NMR spectra also contained resonances consistent with the presence of aliphatic terminal carbons [–CH3 and (–CH2-)n] of fatty acids and/or acetyl and alkyl groups in carbohydrates (53–55), and resonances originating from carboxylic acids, esters and/or amides (COOH, COO−, COOR, and CONH2) (53). The signals from aromatic compounds, such as lignin fragments, in the region 110–165 ppm were weak, but relatively more pronounced in FC61 than FH61 (Figure 2A). Further details are provided in Supplementary Material S1.2.
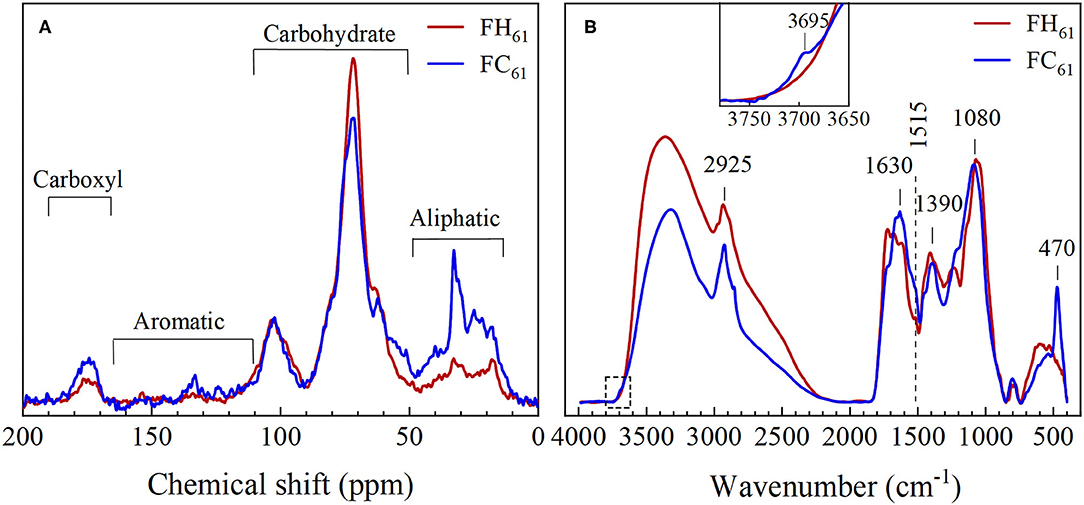
Figure 2. Solid-state spectroscopic characterization of FH61 (red line) and FC61 (blue line) by (A) solid-state 13C NMR and (B) diffuse reflectance IR spectroscopy. NMR spectra of all samples are shown in Supplementary Figure S1. IR spectra were normalized to the area between 2,000 and 400 cm−1. The inset in panel (B) highlights a diagnostic clay mineral peak at 3,695 cm−1. The dashed vertical line at 1,515 cm−1 highlights the presence of aromatic lignin-like compounds. IR spectra of all samples are shown in Supplementary Figure S2. Tentative assignments of the principal IR bands are provided in Supplementary Material S1.3; Supplementary Table S2.
In agreement with the results from the 13C NMR, the IR spectra of freeze-dried DOM extracts were dominated by bands between 1,000 and 1,150 cm−1 indicative of carbohydrates and the stretching mode of –CH2- at 2,925 cm−1 indicated more aliphatic structures in FC than FH extracts (Figure 2B) (56, 57). In comparison with the NMR data the IR spectra showed a more obvious sign of aromatic, lignin-like structures indicated by the pronounced shoulder at 1,515 cm−1 (marked with a dashed line in Figure 2B). In agreement with the 13C NMR results, this shoulder was relatively stronger in FC as compared to FH samples. The spectrum of FC extracts also displayed notable IR spectral contributions from clay minerals such as kaolinite (58, 59), e.g., at 3,695 and 470 cm−1. For more detailed spectral assignments see Supplementary Material S1.3.
Complementary 1H NMR experiments were performed on the DOM solutions using the excitation sculpting technique that suppresses the main signal from water (Figure 3). Resonances in the 1H NMR spectra presented below are proportional to proton concentrations in DOM. The total area under the 1H NMR spectrum of FC61 was 3% of the total area of FH61, which is comparable to the difference in TOC (Table 1). The relative concentrations of DOM compounds were further quantified by dividing the spectra into six resonance intervals (Figure 3): (R1) 0.6–1.65 ppm (alkyl, R–CH3, R–CH2-R); (R2) 1.65–2.2 ppm (acetate, CH3COO− and CH3COO–R); (R3) 2.2–3.0 ppm (HC–C=Y, α protons to carboxyl, carbonyl groups, and aromatic ring, HC–X, protons next to nitrogen or halogen atom); (R4) 3.0–4.3 ppm (HC–O–R, α protons to carbon attached to oxygen groups, carbohydrates, alcohols, and ether); (R5) 6.0–7.8 ppm (Ar–H, aromatic protons including quinones, phenols and ammonium protons, and N–H); (R6) 7.8–9.0 (HCOO− (formate), sterically hindered protons of aromatics, nitrogen heteroaromatics) (18, 53). The region between 4.3 and 6 ppm was excluded from the analysis due to superimposition on the water peak, thus signals mainly from double bonds (olefins) and anomeric protons in carbohydrates are not detected (53). These calculations confirmed that carbohydrates were a substantial component in all FH and FC extracts corresponding to 56–68 and 32–37%, respectively, of the total spectrum integral (Supplementary Material S1.4; Supplementary Figure S4).
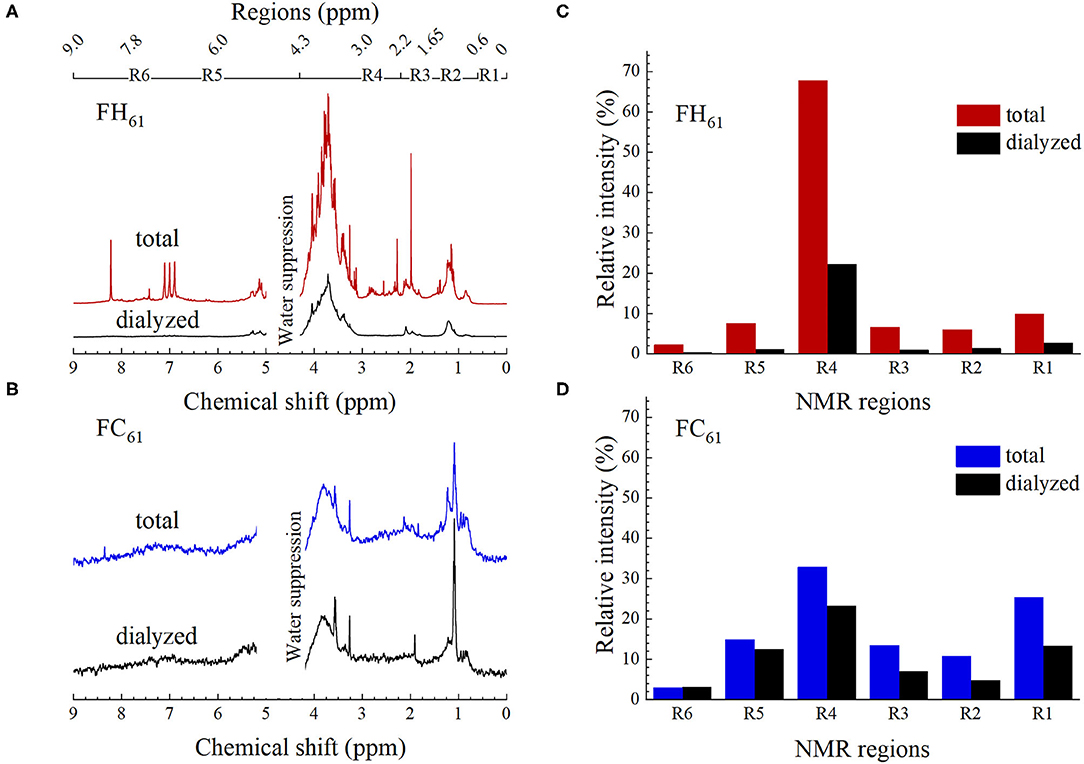
Figure 3. High-resolution 1H-NMR spectra of (A) total and dialyzed FH61 (B) total and dialyzed FC61; corresponding peak area integrals normalized to the area of the total DOM spectra of (C) hot and (D) cold DOM. Spectra and their corresponding normalized integrals of all other samples are shown in Supplementary Figures S3, S4, including replicates.
Several of the characteristic features of the 1H NMR spectra remained after dialysis, which indicated that both low molecular weight compounds and structures/aggregates larger than the 4 nm cut-off of the dialysis membrane contributed to the 1H NMR spectra of the un-dialyzed DOM samples. The total area of the FH61 and FC61 decreased by 64 and 28% (Figures 3C,D), respectively, and this change was similar to the change in TOC (Table 1) suggesting a rough correlation between TOC and the NMR resonances and that a substantial fraction of the DOM was recorded in the 1H NMR spectra. Evaluation of the relative intensity changes showed that the carbohydrate content of dialyzed FH61 extract decreased from 68 to 22% (Region 4, Figure 3C) while the effect was less pronounced for FC61 sample with a decrease from 33 to 23% (Figure 3D). Further information on the 1H NMR analysis is provided in Supplementary Material S1.4. The aggregated results from the TOC, Fe, pH, and 1H NMR analyses of two replicas showed little or no difference in the composition of DOM from the two extraction series (Table 1; Supplementary Figures S3, S4) and confirmed the reproducibility of the extraction methods.
The relatively high concentrations of carbohydrates detected in FH and FC typically originate either from litter or from microbes in spruce forest soils. Among common carbohydrates, cellulose is water insoluble, hence it is likely that the DOM carbohydrates of plant origin are mainly hemicelluloses or other non-cellulosic carbohydrates. At the same time, microbes may synthesize large amounts of galactose, mannose, rhamnose, and fucose (60, 61). We performed an in-depth analysis of the neutral sugar components in the FC samples (Supplementary Material S1; Supplementary Table S3). These results showed that the hydrolyzed samples were dominated by monosugars consistent with a predominance of hemicelluloses in DOM.
To assess the differences between the chemical composition of the DOM samples, we conducted a Principal Component Analysis (PCA, Supplementary Figure S5) of the data from the TOC, Fe and pH measurements, and relative intensity in the six 1H NMR regions (R1–R6). The total and dialyzed DOM samples separated along PC1 and the difference driving this separation was the removal of small acids, sugars and ammonium (<4 nm) in the dialyzed samples. PC2 separated the hot water extracts from the rest, and TOC, Fe, and Region 4 (carbohydrates) were the main factors driving the PC2 variance. Finally, a conclusion from the PCA analysis was that, despite the differences in DOM related to the soil type as discussed above, it is the extraction temperature and dialysis that drive the clustering of data into the four main groups identified in the PCA plot.
Experimental Approach to Characterize Colloidal DOM
The main aim of this study was to develop a model of colloidal DOM based on the chemical information presented in section Major Chemical Components of the DOM Samples and that is consistent with experimental DLS and SAXS data. For model development, we have selected FH61 and FC61 and used an extended set of techniques and experiments, including cryo-TEM and synchrotron-based SAXS. In section Colloidal Properties of DOM From Boreal Forest Stands of Different Age, the final model is applied to explain the DLS and SAXS of the complete set of DOM samples.
Size and Charge of Colloidal DOM
The average colloidal size and charge of FH61 and FC61 were determined by means of DLS and electrophoretic mobility experiments. The DLS yields an autocorrelation function, which is typically analyzed to obtain a hydrodynamic radius, RH, and a polydispersity index, σ, which is a measure of the heterogeneity of the colloidal size distribution in the sample. In this study, we interpreted the DLS results conservatively and used a formalism to fit the experimental data which is described in Supplementary Material S2.1. The correlation functions, g1(τ), of FH61 and FC61 were significantly different (Figure 4) and these differences were manifested both in the hydrodynamic radius and the dispersity. Data fits yielded FH61 and FC61 <RH>z of 113 and 90 nm, respectively, which was not surprising given the fact that the DOM solutions were filtered through 0.2 μm membranes. Perhaps more importantly from the perspective of the DOM colloidal properties was the result that FH61 was more polydisperse (σ = 0.69) than FC61 (σ = 0.40). Thus, the marked increase in TOC produced by hot-water extraction (Table 1), mainly caused by an increased solubility of carbohydrates as indicated by NMR (Figure 3), resulted in a less uniform distribution of colloidal sizes. Along with the large loss of carbohydrates after dialysis of FH61 (Figure 3) these overall results indicated that extraction by hot water yields a very wide size distribution of carbohydrates, from molecules to colloids, and this is distinctly different from the cold-water extracts that are dominated by carbohydrates in the colloidal size fraction.
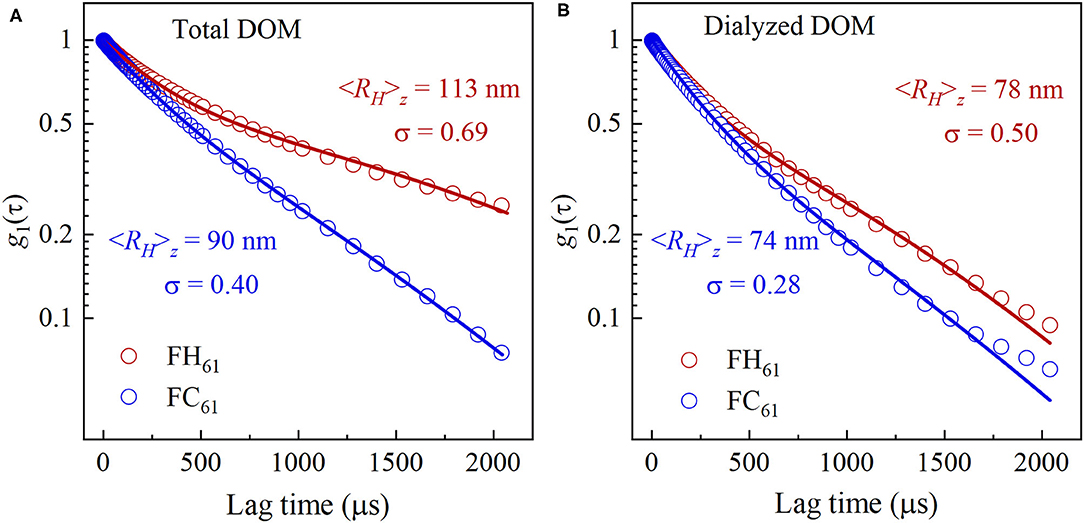
Figure 4. Scattered field correlation functions, g1(τ) obtained by DLS measurements of FH61 (red circles) and FC61 (blue circles) and the corresponding cumulant fits to the data (solid lines) of (A) total and (B) dialyzed DOM. <RH>z is the average hydrodynamic size of DOM and σ is the polydispersity index.
Dialysis of FH61 and FC61 decreased both the average size <RH>z and the polydispersity index (Figure 4). The decrease in size was somewhat surprising but is likely an effect of the loss of low molecular weight ions and changes in pH during the dialysis (Table 1). Avena et al. (62) observed size variations of humic and fulvic acids as a function of pH and the ionic strength, however, we have insufficient details on the compositional changes induced by dialysis to pinpoint the cause of the decrease of <RH>z. It is notable though that dialysis and the concomitant convergence of pH lead to convergence of <RH>z and σ.
We also determined the charge characteristics of FH61 and FC61 colloids via zeta-potential (ζ) experiments. The ζ-potential of FH61 and FC61 were both negative at ~−9 and −28 mV, respectively. The significantly more negative ζ-potential of FC61 indicated a higher (net negative) charge density than FH61. Most likely, the different charge properties of the DOM samples were a consequence of the lower pH = 3.5 of FH61 as compared to pH = 5.7 of FC61 (Table 1). If the colloidal DOM is charge stabilized mainly by carboxylate groups, as indicated by NMR and IR spectroscopy (Figure 2), that typically have a pKa value in the range 4–4.5, a significant fraction of these groups will be protonated at pH = 3.5, while they are predominantly dissociated at pH = 5.7. The fact that FH61 displays |ζ| <10 suggests that colloids in these solutions would be unstable and aggregate with time (63). However, the reproducibility of the DLS measurements and the stability of the SAXS intensities during the experiments showed that the colloids in our samples were stable on the timescales of minutes to days (Supplementary Material S2.2; Supplementary Figures S6, S7). This is in contrast to previous studies on filtered pond water that aggregated within minutes after being subjected to shear (20). Over long timescales of years the FC61 remained quite stable whereas the colloids in FH61 aggregated to larger particles (Supplementary Material S2.2; Supplementary Figure S7). This was likely an effect of the low pH of FH61 (Table 1) promoting charge neutralization and subsequent aggregation.
Structure of Colloidal DOM
The power of the SAXS method to characterize colloid systems resembling our DOM samples has been demonstrated in previous studies (10, 33, 64–66). In Figure 5, we compare SAXS patterns of FH61 and FC61, and the marked differences between the scattering profiles indicated differences in the colloidal structures of the two DOM solutions. From scattering vector q ~ 0.02 Å−1 FH61 displayed a power law decay following I(q) ~ q−1.7, which is consistent with scattering from large polymer coils, i.e., excluded volume chains (67). The I(q)~q−1.7 scaling persists at high q-values and we observe no regime of q−1 scattering. This implies that the chains are highly flexible (67). Below q ~ 0.02 Å−1 the scattered intensity of FH61 was characterized by an upturn and a steeper negative slope (Figure 5A), indicating the presence of some additional even larger objects. In contrast, the SAXS pattern of FC61 followed essentially one linear function over the measured q range, and the slope was similar to that of FH61 at high q (Figure 5B).
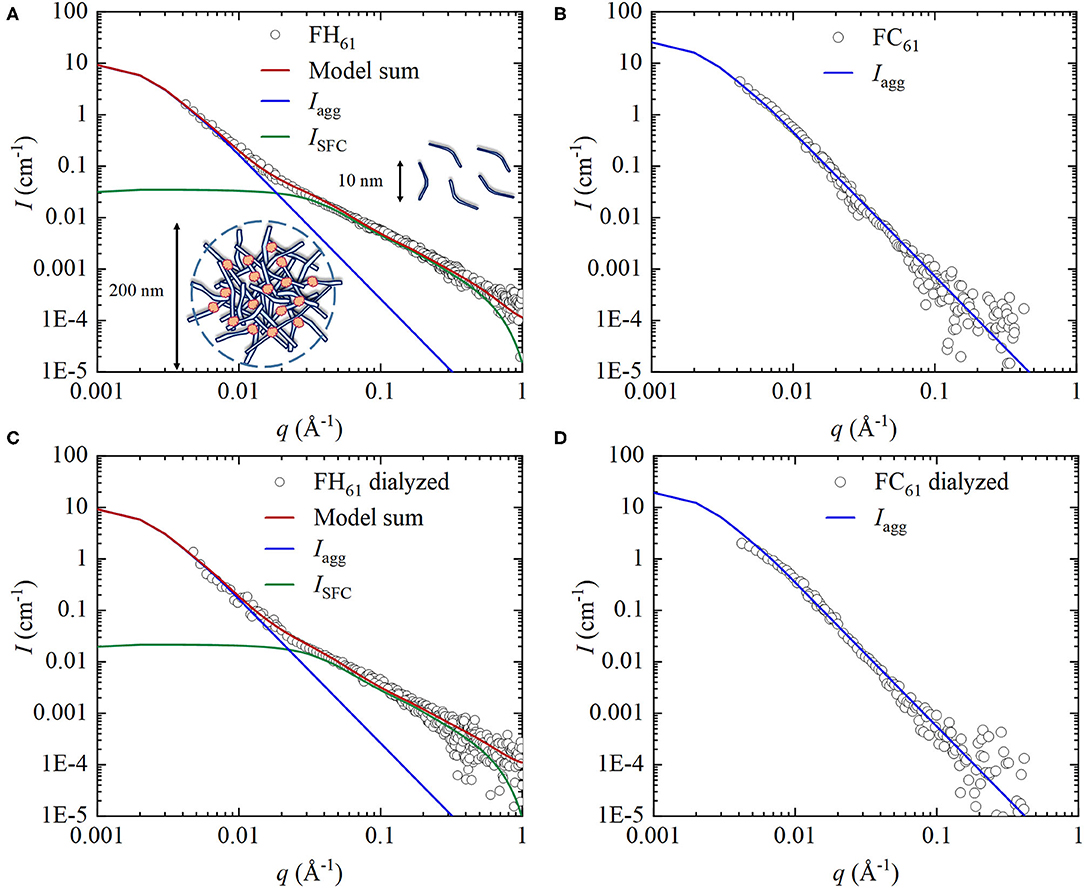
Figure 5. SAXS profiles obtained from (A) FH61, (B) FC61 and after dialysis (C) FH61, (D) FC61. Green lines represent model scattering from semi-flexible cylinders (depicted as coils of about 10 nm diameter), ISFC(q). Blue lines represent model scattering from fractal clusters Iagg(q) (depicted as aggregates of about 200 nm diameter). Red lines represent the full scattering model, i.e., I(q) = ISFC(q) + Iagg(q).
To obtain quantitative information, the SAXS data were compared with model simulations. These models were based on the qualitative SAXS information discussed as well as the chemical characterization of the DOM samples. We know that FH61 was dominated by carbohydrates including hemicelluloses and that above q ~ 0.02 Å−1 the I(q)~q−1.7 scaling suggested scattering from flexible coils. Thus, a reasonable assumption is that these objects can be described as semi-flexible cylinders consisting of hemicelluloses (68, 69). The detailed model description of the semi-flexible cylinders is provided in the Supplementary Material S2.3, and for FH61 the calculated scattered intensity from these cylinders, ISFC(q), described the observed scattering above q ~ 0.02 Å−1 reasonably well (Figure 5A, green line). However, this model alone was unable to explain the SAXS pattern of FH61 at low q. To improve the fit at low q values we introduced a second fraction of colloids described as mass fractal aggregates, which would be consistent with a more complex composition as compared to the semi-flexible cylinders. The model of scattering intensity from DOM solutions containing two colloid fractions includes a large parameter space, and to constrain the model we have fixed several parameters based on the assumption that the colloids mainly contain hemicelluloses. We have also used information from the DLS measurements, in particular <RH>z to estimate the radius of gyration, Rg. The relationship between Rg and <RH>z is not straightforward and depends on the shape of the objects. For spherical objects the relationship Rg = 0.775 <RH>z has been proposed (70), and as will be shown below the average <RH>z of all DOM samples is close to 100 nm. We therefore fixed Rg to 70 nm in all simulations of the SAXS data. This will introduce a systematic error but facilitate comparison between samples. The final model contained five variables namely the effective molar mass and concentration of the semi-flexible coils, and the concentration, molar mass and radius of gyration of the fractal aggregates. Full description of the model, including assumptions and constrains, is provided in the Supplementary Material S2.3.
The full scattering model resulted in a good fit to the FH61 SAXS pattern over the complete q-range measured (Figure 5A). The model parameters presented in Table 2 indicated that the colloids in FH61 were completely dominated by semi-flexible cylinders (~ 97% of the total concentration). This result suggests that the strong increase in TOC during hot-water extraction (Figure 3) generates considerable amounts of polymer chains consisting of hemicelluloses. In contrast, the model of the FC61 SAXS pattern predicted the presence of fractal aggregates only (Figure 5B; Table 2). The concentration of these fractal aggregates was larger in FC61 than FH61 (Table 2). Still, even though we only have two data points, the temperature dependence of the colloidal concentration seemed to be stronger for the semi-flexible coils than the fractal aggregates. For typical carbohydrates such as cellulose (C6H10O5)n and hemicellulose (C5H8O4)n (71) the ratios of the total molecular weight of the carbohydrates to the atomic weight of carbon are 2.25 and 2.2, respectively. If we compare the combined concentrations, ccyl + cagg (Table 2), divided by 2.2, with the TOC values, we note that they are of the same order of magnitude, providing some further support for our proposed colloidal model. Still, the values of ccyl and cagg should be regarded only as rough estimates, considering the approximations and assumptions involved in the SAXS modeling and in particular the correlation between c and M. Moreover, while FH61 was strongly dominated by carbohydrates FC61 was less so (Figure 3). Hence in the case of FC61 it is likely that also other compounds in the colloidal fraction contributed to the scattering such as the high-molecular weight aliphatics detected in the dialyzed samples (Figures 3B,D) as well as the clay particles detected by IR spectroscopy (Figure 2B).
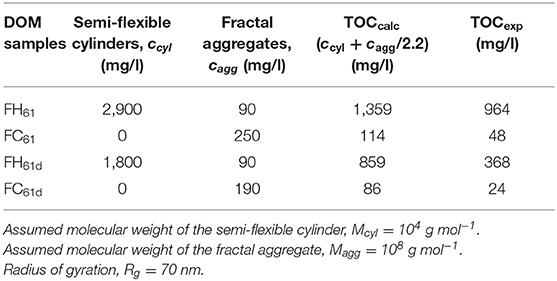
Table 2. Summary of the SAXS modeling results.
To further explore the validity of the proposed model of colloidal DOM we used cryo-TEM as an independent method to directly observe the colloidal structures ex-situ. For this experiment, we used DOM extracted from the same field site but a slightly younger forest stand (48 years-old). The cryo-TEM images of both hot- and cold-water extracted DOM indicated the presence of elongated structures of low contrast and dense structures of higher contrast (Figure 6). These structures are in qualitative agreement with the semi-flexible cylinders and the fractal aggregates, respectively, of our model. The low contrast of the elongated structures representing the semi-flexible cylinders agrees with a composition dominated by hemicellulose, which is a low electron density material. The fractal aggregates of higher contrast support our interpretation that the composition is more complex, and the higher contrast may originate from the presence of clay particles indicated by IR spectroscopy (Figure 2B). The limited statistics provided by a few cryo-TEM images in comparison with bulk DOM prevent us from estimating DOM particle concentrations from these images, but it is notable that we detect some semi-flexible cylinders also in the FC sample although the concentration seems to be much lower than in FH. While SAXS data clearly shows a very large difference in the ratio between semi-flexible cylinders and fractal aggregates in hot- and cold-water extracted DOM, the concentration of the cylinders in the latter sample is likely not zero as indicated by the modeling but rather too small to be detected in our SAXS experiments.
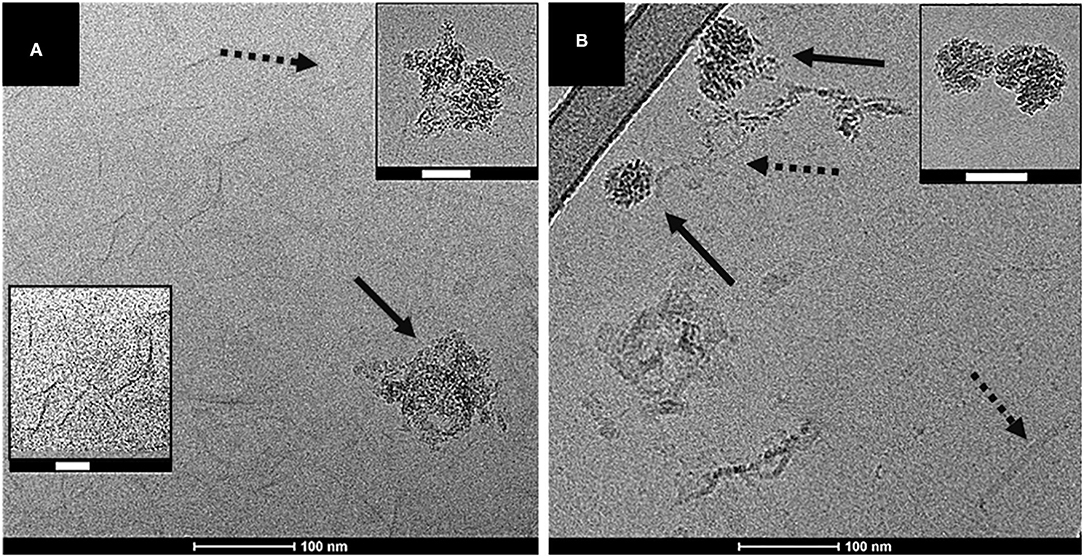
Figure 6. Cryo-TEM images of (A) hot-water and (B) cold-water extracted DOM samples. Solid arrows highlight high electron density structures while dashed arrows highlight low electron density structures. Scale bars (100 nm) are shown below the images. The insets in panel (A) show close ups of high and low electron density structures, while panel (B) displays high electron density structures only. The white scale bar in the insets represents 50 nm.
To assess the stability of the colloidal structures and how this agrees with our proposed model, we performed a dilution series of DOM solutions and measured the SAXS and DLS patterns. The DOM samples studied by cryo-TEM were also used for these experiments. The normalized SAXS pattern and the DLS correlation function remained unchanged upon dilution (Supplementary Figure S8), indicating that the colloidal structures were stable and not consisted of loose assemblies of molecules and particles. This is in agreement with our colloidal model because the semi-flexible cylinders should be unaffected by dilution and desorption processes from composite organo-mineral aggregates often are exceedingly slow (72).
Finally, we examined the SAXS patterns of dialyzed FH61 and FC61 and these were almost identical to the patterns of the corresponding DOM samples before dialysis (Figure 5). This was expected because the large colloids objects should remain after dialysis. However, modeling of the SAXS patterns indicated some changes in the concentrations of the colloids (Table 2). In particular, the concentration of the semi-flexible cylinders in FH61 decreased from 2,900 to 1,800 mg/l whereas the concentration of the fractal aggregates remained unchanged, and in FC61 cagg decreased only marginally from 250 to 190 mg/l. We suggest that the cylinders are affected because in extended conformations there is an increased likelihood that they will escape the 4 nm pores of the dialysis membrane. This interpretation is consistent with a predominance of single, semi-flexible polymer chains of hemicelluloses.
Colloidal Properties of DOM From Boreal Forest Stands of Different Age
We noted from the chemical analyses that FH DOM samples displayed decreasing TOC with forest stand age and that pH decreased for the two older soils while within the other groups, i.e., FC, GH, and GC, the samples were more similar (Table 1). However, the differences between the groups of DOM samples were not manifested in the DLS measurements that indicated average hydrodynamic radii < RH>z around 100 nm in all DOM extracts and similar ζ-potentials of the FH samples despite the difference in pH and TOC (Table 3). Instead the ζ-potentials corroborated a trend observed for the FH61 and FC61 samples namely that hot-water extracted DOM displayed less negative surface charge (−9 to −11 mV) in comparison to the cold-water samples (−11 to −30 mV), which is consistent with the lower pH of the two FH samples. It is also interesting to note that the range in surface charge of the FC samples is greater, and that may suggest a higher variability of the charge determining ions since pH is similar in these FC samples (Table 1).
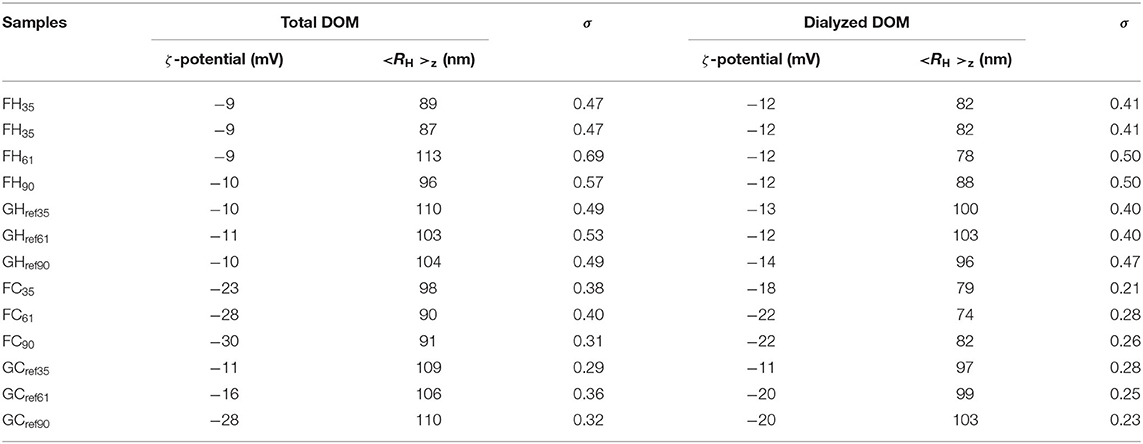
Table 3. Summary of results from DLS and ζ-potential measurements of all DOM samples before and after dialysis.
The characteristic difference in the shape of the SAXS profiles between the hot- and cold-water extracted DOM persisted when we compared all DOM samples. The FC and GC samples followed a linear function over a wide q-range while the FH and GH samples displayed a change in shape to a steeper negative slope at low q-values (Supplementary Figure S9). Furthermore, the slopes of the SAXS profiles at high q-values were similar for all DOM samples. In line with these qualitative observations, the quantitative simulations of the SAXS data, using the model described in section DOM Colloidal Properties, showed that semi-flexible cylinders dominated all hot-water extracted samples while in cold-water extracted DOM only fractal aggregates were detected (Table 4). The most notable trend was for the FH samples where we observed a decrease in the concentration of the semi-flexible cylinders with increasing forest stand age. This trend correlates with the decrease in TOC (Table 1) and indicates that the amounts of extractable carbohydrates, presumably hemicellulose, that make up the semi-flexible cylinders, decrease with forest age. We observed small variations in the concentrations of the fractal aggregates but due to the extensive data collection times on a lab-source SAXS instrument, we present no replicates and hence cannot ascertain whether these variations are real trends or merely random variations. Future work should address this issue preferably using high-brilliance synchrotron sources thereby reducing the time for data collection. Moreover, a future question to address will be how the different pools of DOM colloids respond to microbial decomposition. To this end, it will be important to determine the low concentrations of the semi-flexible cylinders that likely are present also in the cold-water extract, although we do not detect this fraction in our SAXS analysis.
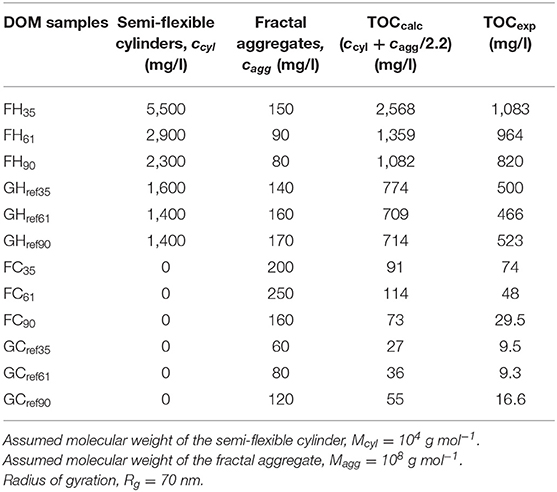
Table 4. Summary of the SAXS modeling results of all DOM samples.
Conclusions
We have characterized the colloids present in water-extracted soil organic matter with respect to charge, size, and structure. This was accomplished by combining a range of experimental techniques thereby providing information on both chemical composition and the physical properties of the colloids. We acknowledge that parts of the results are presented without analytical replicas, mainly because of the large number of time consuming experimental techniques involved in the investigation. Nevertheless, the quantitative results showed clear trends and the minor variation observed between the different grassland samples or between the forest soil samples with different forest stand age, indicate that expected statistical variations may be small. Here, in this paper, we have focused on extracting a large amount of information about DOM by combining a large number of techniques, and we argue that a combination of techniques is necessary to extract meaningful parameters from the modeling of X-ray scattering data that inform about the colloidal structures. The main conclusion from our study is that ca. 40–70% of the total organic carbon in our soil DOM samples is present in the colloidal size fraction and that two main types of colloids predominate: semi-flexible cylinders and fractal aggregates. The former type consists of essentially pure carbohydrates, presumably hemicelluloses, while the latter is a composite material containing a large fraction of carbohydrates but also inorganic particles, such as clays. The distribution between the two colloidal size fractions is strongly dependent on the extraction temperature where the semi-flexible cylinders are favored by higher temperatures. An important challenge for future research is to examine whether the colloidal structures affect organic matter stability, i.e., if different colloidal fractions differ in their susceptibility to microbial decomposition and if they are degraded by different microbial mechanisms. Should there exist a diversity in the microbial response to the various colloids it will also be crucial to increase the understanding of how temperature, as well as other external parameters, affect the generation of DOM colloids of different characteristics. Our results showed that dilution had no effect on either the semi-flexible cylinders or the fractal aggregates and that they were stable for days and likely also over longer time-periods. This stability contrasts recent results from studies on colloids in pond-water and humic acid solutions that were highly dynamic and affected by shearing forces. Thus, the supramolecular model of DOM based on the concept of dynamic hydrogels seems not to be applicable to our soil DOM solutions, which emphasize the need for more experimental studies on different DOM systems to establish relationships between DOM composition, environmental conditions, and the properties of DOM colloids. On this note, our results from the different spruce forest soils are interesting because they show that increasing the age and thus the thickness of the organic soils horizon reduces the extraction of the colloidal carbohydrates that constitute the semi-flexible cylinders. This can potentially influence microbial processes as well as the transport of organic matter from upper soil horizons to the minerogenic layers and the formation and properties of mineral-associated organic matter.
Data Availability Statement
The raw data supporting the conclusions of this article will be made available by the authors, upon reasonable request.
Author Contributions
VM: investigation, formal analysis, data curation, and writing—original draft. LG: conceptualization, investigation, formal analysis, data curation, and writing—review and editing. EA: investigation, and writing—review and editing. AB: investigation, formal analysis, data curation, and writing—review and editing. MF and MC: investigation, formal analysis, and writing—review and editing. HS: conceptualization, and writing—review and editing. WL: investigation, formal analysis, and writing—review and editing. MŠ and EK: resources, and writing—review and editing. AT: conceptualization, writing—review and editing, supervision, and funding. UO: conceptualization, formal analysis, data curation, writing—review and editing, supervision, and funding. PP: conceptualization, formal analysis, data curation, writing— review and editing, supervision, project administration, and funding. All authors contributed to the article and approved the submitted version.
Funding
This work was supported by grants from the strategic research area Biodiversity and Ecosystem Services in a Changing Climate (BECC), the Knut and Alice Wallenberg Foundation (2013.0073), and the Swedish Research Council (2016-04561 and 2017-04261). LG acknowledges support from the Crafoord Foundation (20180566). This project has received funding from the European Union's Horizon 2020 research and innovation program under grant agreement No. 731019 (EUSMI).
Conflict of Interest
The authors declare that the research was conducted in the absence of any commercial or financial relationships that could be construed as a potential conflict of interest.
Publisher's Note
All claims expressed in this article are solely those of the authors and do not necessarily represent those of their affiliated organizations, or those of the publisher, the editors and the reviewers. Any product that may be evaluated in this article, or claim that may be made by its manufacturer, is not guaranteed or endorsed by the publisher.
Acknowledgments
The author thanks the São Paulo Research Foundation FAPESP for support to this collaboration (2015/25406-5 and 2017/50184-1). The authors would like to thank the Brazilian Nanotechnology National Laboratory (LNNano) and the Brazilian Synchrotron Light Laboratory (LNLS) both at the Brazilian Center for Research in Energy and Materials (CNPEM) for the use of electron microscopy and synchrotron light facilities.
Supplementary Material
The Supplementary Material for this article can be found online at: https://www.frontiersin.org/articles/10.3389/fsoil.2022.832706/full#supplementary-material
References
1. Chantigny MH. Dissolved and water-extractable organic matter in soils: a review on the influence of land use and management practices. Geoderma. (2003) 113:357–80. doi: 10.1016/S0016-7061(02)00370-1
2. Zsolnay Á. Dissolved organic matter: artefacts, definitions, and functions. Geoderma. (2003) 113:187–209. doi: 10.1016/S0016-7061(02)00361-0
3. Bolan NS, Adriano DC, Kunhikrishnan A, James T, McDowell R, Senesi N. Chapter 1 - Dissolved organic matter: biogeochemistry, dynamics, and environmental significance in soils. In: Sparks DL, editors. Advances in Agronomy. Academic Press (2011). p. 1–75.
4. Kalbitz K, Schmerwitz J, Schwesig D, Matzner E. Biodegradation of soil-derived dissolved organic matter as related to its properties. Geoderma. (2003) 113:273–91. doi: 10.1016/S0016-7061(02)00365-8
5. Lützow MV, Kögel-Knabner I, Ekschmitt K, Matzner E, Guggenberger G, Marschner B, et al. Stabilization of organic matter in temperate soils: mechanisms and their relevance under different soil conditions - a review. Eur J Soil Sci. (2006) 57:426–45. doi: 10.1111/j.1365-2389.2006.00809.x
6. Kögel-Knabner I, Guggenberger G, Kleber M, Kandeler E, Kalbitz K, Scheu S, et al. Organo-mineral associations in temperate soils: integrating biology, mineralogy, and organic matter chemistry. J Plant Nutr Soil Sci. (2008) 171:61–82. doi: 10.1002/jpln.200700048
7. Jansen B, Kalbitz K, McDowell WH. Dissolved organic matter: linking soils and aquatic systems. Vadose Zone J. (2014) 13:1–4. doi: 10.2136/vzj2014.05.0051
8. Philippe A, Schaumann GE. Interactions of dissolved organic matter with natural and engineered inorganic colloids: a review. Environ Sci Technol. (2014) 48:8946–62. doi: 10.1021/es502342r
9. Polubesova T, Chefetz B. DOM-affected transformation of contaminants on mineral surfaces: a review. Crit Rev Environ Sci Technol. (2014) 44:223–54. doi: 10.1080/10643389.2012.710455
10. Guénet H, Davranche M, Vantelon D, Gigault J, Prévost S, Taché O, et al. Characterization of iron-organic matter nano-aggregate networks through a combination of SAXS/SANS and XAS analyses: impact on As binding. Environ Sci Nano. (2017) 4:938–54. doi: 10.1039/C6EN00589F
11. Nebbioso A, Piccolo A. Molecular characterization of dissolved organic matter (DOM): a critical review. Anal Bioanal Chem. (2013) 405:109–24. doi: 10.1007/s00216-012-6363-2
12. Maria E, Crançon Crançon P, Lespes G, Bridoux MC. Spatial variation in the molecular composition of dissolved organic matter from the Podzol soils of a temperate pine forest. ACS Earth Space Chem. (2019) 3:1685–96. doi: 10.1021/acsearthspacechem.9b00164
13. Thieme L, Graeber D, Hofmann D, Bischoff S, Schwarz MT, Steffen B, et al. Dissolved organic matter characteristics of deciduous and coniferous forests with variable management: different at the source, aligned in the soil. Biogeosciences. (2019) 16:1411–32. doi: 10.5194/bg-16-1411-2019
14. Mangal V, DeGasparro S, Beresford DV, Guéguen C. Linking molecular and optical properties of dissolved organic matter across a soil-water interface on Akimiski Island (Nunavut, Canada). Sci Total Environ. (2020) 704:135415. doi: 10.1016/j.scitotenv.2019.135415
15. Lam B, Simpson AJ. Direct 1H NMR spectroscopy of dissolved organic matter in natural waters. Analyst. (2008) 133:263–9. doi: 10.1039/B713457F
16. Gao SJ, Zhao C, Shi ZH, Zhong J, Liu JG, Li JQ. Spectroscopic characteristics of dissolved organic matter in afforestation forest soil of Miyun District, Beijing. J Anal Methods Chem. (2016) 2016:1480857. doi: 10.1155/2016/1480857
17. Han R, Lv J, Luo L, Wen B, Zhang S. Molecular-scale investigation of soil fulvic acid and water-extractable organic matter by high-resolution mass spectrometry and 1H NMR spectroscopy. Environ Chem. (2019) 16:92–100. doi: 10.1071/EN18124
18. Whitty SD, Waggoner DC, Cory RM, Kaplan LA, Hatcher PG. Direct noninvasive 1H NMR analysis of stream water DOM: Insights into the effects of lyophilization compared with whole water. Magn Reson Chem. (2021) 59:540–53. doi: 10.1002/mrc.4935
19. Esfahani MR, Stretz HA, Wells MJ. Abiotic reversible self-assembly of fulvic and humic acid aggregates in low electrolytic conductivity solutions by dynamic light scattering and zeta potential investigation. Sci Total Environ. (2015) 537:81–92. doi: 10.1016/j.scitotenv.2015.08.001
20. Wells MJM, Stretz HA. Supramolecular architectures of natural organic matter. Sci Total Environ. (2019) 671:1125–33. doi: 10.1016/j.scitotenv.2019.03.406
21. Yan J, Manelski R, Vasilas B, Jin Y. Mobile colloidal organic carbon: an underestimated carbon pool in global carbon cycles? Front Environ Sci. (2018) 6:148. doi: 10.3389/fenvs.2018.00148
22. Schmidt MWI, Torn MS, Abiven S, Dittmar T, Guggenberger G, Janssens IA, et al. Persistence of soil organic matter as an ecosystem property. Nature. (2011) 478:49–56. doi: 10.1038/nature10386
23. Lehmann J, Kleber M. The contentious nature of soil organic matter. Nature. (2015) 528:60–8. doi: 10.1038/nature16069
24. Wershaw RL. Membrane-Micelle Model for Humus in Soils and Sediments and Its Relation to Humification. US Geological Survey Water-Supply Paper 2410 (1994).
25. Piccolo A. The supramolecular structure of humic substances. Soil Sci. (2001) 166:810–32. doi: 10.1097/00010694-200111000-00007
26. Sutton R, Sposito G. Molecular structure in soil humic substances: the new view. Environ Sci Technol. (2005) 39:9009–15. doi: 10.1021/es050778q
27. Senesi N, Rizzi FR, Dellino P, Acquafredda P. Fractal dimension of humic acids in aqueous suspension as a function of pH and time. Soil Sci Soc Am J. (1996) 60:1773–80. doi: 10.2136/sssaj1996.03615995006000060023x
28. Myneni SC, Brown JT, Martinez GA, Meyer-Ilse W. Imaging of humic substance macromolecular structures in water and soils. Science. (1999) 286:1335–7. doi: 10.1126/science.286.5443.1335
29. Simpson AJ. Determining the molecular weight, aggregation, structures and interactions of natural organic matter using diffusion ordered spectroscopy. Magn Reson Chem. (2002) 40:S72–S82. doi: 10.1002/mrc.1106
30. Baigorri R, Fuentes M, González-Gaitano G, García-Mina JM. Simultaneous presence of diverse molecular patterns in humic substances in solution. J Phys Chem B. (2007) 111:10577–82. doi: 10.1021/jp0738154
31. Jarvie HP, King SM. Small-angle neutron scattering study of natural aquatic nanocolloids. Environ Sci Technol. (2007) 41:2868–73. doi: 10.1021/es061912p
32. Colombo C, Palumbo G, Angelico R, Cho HG, Francioso O, Ertani A, et al. Spontaneous aggregation of humic acid observed with AFM at different pH. Chemosphere. (2015) 138:821–8. doi: 10.1016/j.chemosphere.2015.08.010
33. Gentile L, Wang T, Tunlid A, Olsson U, Persson P. Ferrihydrite nanoparticle aggregation induced by dissolved organic matter. J Phys Chem A. (2018) 122:7730–8. doi: 10.1021/acs.jpca.8b05622
34. Klučáková M. Size and charge evaluation of standard humic and fulvic acids as crucial factors to determine their environmental behavior and impact. Front Chem. (2018) 6:235. doi: 10.3389/fchem.2018.00235
35. Hakim A, Suzuki T, Kobayashi M. Strength of humic acid aggregates: effects of divalent cations and solution pH. ACS Omega. (2019) 4:8559–67. doi: 10.1021/acsomega.9b00124
36. Schulten HR, Schnitzer M. Chemical model structures for soil organic matter and soils. Soil Sci. (1997) 162:115–30. doi: 10.1097/00010694-199702000-00005
37. Benedetti MF, Van Riemsdik WH, Koopal LK. Humic substances considered as a heterogeneous donnan gel phase. Environ Sci Technol. (1996) 30:1805–13. doi: 10.1021/es950012y
38. Ni J, Pignatello JJ. Charge-assisted hydrogen bonding as a cohesive force in soil organic matter: water solubility enhancement by addition of simple carboxylic acids. Environ Sci Process Impacts. (2018) 20:1225–33. doi: 10.1039/C8EM00255J
39. Rosenqvist L, Kleja DB, Johansson MB. Concentrations and fluxes of dissolved organic carbon and nitrogen in a Picea abies chronosequence on former arable land in Sweden. For Ecol Manage. (2010) 259:275–85. doi: 10.1016/j.foreco.2009.10.013
40. Hansson K, Fröberg M, Helmisaari H-S, Kleja DB, Olsson BA, Olsson M, et al. Carbon and nitrogen pools and fluxes above and below ground in spruce, pine and birch stands in southern Sweden. For Ecol Manage. (2013) 309:28–35. doi: 10.1016/j.foreco.2013.05.029
41. Hansson K, Olsson BA, Olsson M, Johansson U, Kleja DB. Differences in soil properties in adjacent stands of Scots pine, Norway spruce and silver birch in SW Sweden. For Ecol Manage. (2011) 262:522–30. doi: 10.1016/j.foreco.2011.04.021
42. Kalbitz K, Angers D, Kaiser K, Chantigny M. Extraction and characterization of dissolved organic matter. In: Carter MR, Gregorich EG, editors. Soil Sampling and Methods of Analysis, 2nd Edn. Boca Raton, FL: CRC Press (2007). p. 617–35.
43. Davidson EA, Galloway LF, Strand MK. Assessing available carbon: comparison of techniques across selected forest soils. Commun Soil Sci Plant Anal. (1987) 18:45–64. doi: 10.1080/00103628709367802
44. Landgraf D, Leinweber P, Makeschin F. Cold and hot water-extractable organic matter as indicators of litter decomposition in forest soils. J Plant Nutr Soil Sci. (2006) 169:76–82. doi: 10.1002/jpln.200521711
45. Guo L, Santschi PH. Ultrafiltration and its applications to sampling and characterisation of aquatic colloids. In: Wilkinson KJ, Lead JR, editors. Environmental Colloids and Particles. Chichester: John Wiley and Sons, Ltd. (2007). p. 159–221.
46. Peersen OB, Wu X, Kustanovich I, Smith SO. Variable-amplitude cross-polarization MAS NMR. J Magn Reson A. (1993) 104:334–9. doi: 10.1006/jmra.1993.1231
47. Hwang TL, Shaka AJ. Water suppression that works - excitation sculpting using arbitrary wave-forms and pulsed-field gradients. J Magn Reson Ser A. (1995) 112:275–9. doi: 10.1006/jmra.1995.1047
48. Evans F, Wennerström H. Colloidal Domain : Where Physics, Chemistry and Biology Meet. New York, NY: Wiley-VCH (1999).
49. Aguedo M, Fougnies C, Dermience M, Richel A. Extraction by three processes of arabinoxylans from wheat bran and characterization of the fractions obtained. Carbohydr Polym. (2014) 105:317–24. doi: 10.1016/j.carbpol.2014.01.096
50. Curtin D, Beare MH, Chantigny MH, Greenfield LG. Controls on the extractability of soil organic matter in water over the 20 to 80°C temperature range. Soil Sci Soc Am J. (2011) 75:1423–30. doi: 10.2136/sssaj2010.0401
51. Kamida K, Okajima K, Matsui T, Kowsaka K. Study on the solubility of cellulose in aqueous alkali solution by deuteration IR and 13C NMR. Polym J. (1984) 16:857–66. doi: 10.1295/polymj.16.857
52. Gustavsson S, Alves L, Lindman B, Topgaard D. Polarization transfer solid-state NMR: a new method for studying cellulose dissolution. RSC Adv. (2014) 4:31836–9. doi: 10.1039/C4RA04415K
53. Wilson MA. Applications of nuclear magnetic resonance spectroscopy to the study of the structure of soil organic matter. J Soil Sci. (1981) 32:167–86. doi: 10.1111/j.1365-2389.1981.tb01698.x
54. Krosshavn M, Kögel-Knabner I, Southon TE, Steinnes E. The influence of humus fractionation on the chemical composition of soil organic matter studied by solid-state 13C NMR. J Soil Sci. (1992) 43:473–83. doi: 10.1111/j.1365-2389.1992.tb00153.x
55. Gilardi G, Abis L, Cass AEG. Carbon-13 CP/MAS solid-state NMR and FT-IR spectroscopy of wood cell wall biodegradation. Enzyme Microb Technol. (1995) 17:268–75. doi: 10.1016/0141-0229(94)00019-N
56. Gu B, Schmitt J, Chen Z, Liang L, McCarthy JF. Adsorption and desorption of natural organic matter on iron oxide: mechanisms and models. Environ Sci Technol. (1994) 28:38–46. doi: 10.1021/es00050a007
57. Silverstein RM, Webster FX, Kiemle DJ. Spectrometric Identification of Organic Compounds. John Wiley and Sons, Inc. (2005).
58. Nayak PS, Singh BK. Instrumental characterization of clay by XRF, XRD and FTIR. Bull Mater Sci. (2007) 30:235–8. doi: 10.1007/s12034-007-0042-5
59. Chukanov NV, Chervonnyi AD. Infrared Spectroscopy of Minerals and Related Compounds. Cham: Springer International Publishing (2016).
60. Haynes RJ, Francis GS. Changes in microbial biomass-C, soil carbohydrate-composition and aggregate stability induced by growth of selected crop and forage species under field conditions. J Soil Sci. (1993) 44:665–75. doi: 10.1111/j.1365-2389.1993.tb02331.x
61. Gigliotti G, Kaiser K, Guggenberger G, Haumaier L. Differences in the chemical composition of dissolved organic matter from waste material of different sources. Biol Fert Soils. (2002) 36:321–9. doi: 10.1007/s00374-002-0551-8
62. Avena MJ, Vermeer AWP, Koopal LK. Volume and structure of humic acids studied by viscometry pH and electrolyte concentration effects. Colloid Surf. A. (1999) 151:213–24. doi: 10.1016/S0927-7757(98)00504-4
64. Österberg R, Mortensen K. Fractal dimension of humic acids. Eur Biophys J. (1992) 21:163–7. doi: 10.1007/BF00196759
65. Österberg R, Mortensen K, Ikai A. Direct observation of humic acid clusters, a nonequilibrium system with a fractal structure. Naturwissenschaften. (1995) 82:137–9. doi: 10.1007/BF01177274
66. Rice JA, Tombácz E, Malekani K. Applications of light and X-ray scattering to characterize the fractal properties of soil organic matter. Geoderma. (1999) 88:251–64. doi: 10.1016/S0016-7061(98)00108-6
68. Pedersen JS, Schurtenberger P. Scattering functions of semiflexible polymers with and without excluded volume effects. Macromolecules. (1996) 29:7602–12. doi: 10.1021/ma9607630
69. Chen WR, Butler PD, Magid LJ. Incorporating intermicellar interactions in the fitting of SANS data from cationic wormlike micelles. Langmuir. (2006) 22:6539–48. doi: 10.1021/la0530440
70. Richards EG. An Introduction to Physical Properties of Large Molecules in Solution. Cambridge: Cambridge University Press (1980).
71. Chen H. Lignocellulose biorefinery conversion engineering. In: Chen H, editor. Lignocellulose Biorefinery Engineering. Amsterdam; Boston, MA: Elsevier (2015). p. 87–124.
Keywords: carbohydrates, chronosequence, IR, NMR, organic colloids, small-angle X-ray scattering, dynamic light scattering, water-extractable organic matter
Citation: Meklesh V, Gentile L, Andersson E, Bhattacharya A, de Farias MA, Cardoso MB, Stålbrand H, Loh W, Škerlep M, Kritzberg E, Tunlid A, Olsson U and Persson P (2022) Characterization of the Colloidal Properties of Dissolved Organic Matter From Forest Soils. Front. Soil Sci. 2:832706. doi: 10.3389/fsoil.2022.832706
Received: 10 December 2021; Accepted: 02 March 2022;
Published: 29 March 2022.
Edited by:
Stephanie Ann Yarwood, University of Maryland, College Park, United StatesReviewed by:
Michael Kaiser, University of Nebraska-Lincoln, United StatesMathieu Thevenot, Université de Bourgogne, France
Copyright © 2022 Meklesh, Gentile, Andersson, Bhattacharya, de Farias, Cardoso, Stålbrand, Loh, Škerlep, Kritzberg, Tunlid, Olsson and Persson. This is an open-access article distributed under the terms of the Creative Commons Attribution License (CC BY). The use, distribution or reproduction in other forums is permitted, provided the original author(s) and the copyright owner(s) are credited and that the original publication in this journal is cited, in accordance with accepted academic practice. No use, distribution or reproduction is permitted which does not comply with these terms.
*Correspondence: Viktoriia Meklesh, dmlrdG9yaWlhLm1la2xlc2hAY2VjLmx1LnNl
†Present Address: Luigi Gentile, Department of Chemistry, University of Bari Aldo Moro, Bari, Italy