 Gannouka Nadjire1*
 Alimata Arzouma Bandaogo2
 Amanuel W. Gebremichael3†
 Oumarou Ouédraogo1†Joseph Issaka Boussim1
- 1Laboratoire de Biologie et Ecologie Végétales, Université Joseph KIZERBO, Ouagadougou, Burkina Faso
- 2Département Gestion des Ressources Naturelles et Système de Production, Institut de l’Environnement et de Recherches Agricoles, Farako-Bâ/Bobo-Dioulasso, Burkina Faso
- 3GFZ Helmholtz-Zentrum fur Geoforschung, Potsdam, Germany
Climate variability, soil type, land use, and vegetation structure modulate soil organic carbon (SOC) dynamics, but their effects on sensitive soil carbon indicators are not adequately quantified in semi-arid ecosystems. This research examined the independent and synergistic impacts of pedo-climate, land use, and canopy cover on permanganate oxidizable carbon (POXC), soil microbial respiration (CO2-C), and the carbon mineralization rate (CMR) in the semi-arid regions of West Africa to determine their effectiveness as indicators of soil carbon dynamics. We collected 480 composite soil samples across Sudanian and Sudano-Sahelian zones, covering three land use types (cropland, fallow, protected area), two canopy positions (subcanopy, intercanopy), and two depths (0–10 cm, 10–30 cm). POXC, CO2-C, and SOC concentrations were analyzed, and CMR was derived from CO2-C per unit SOC. The indicators exhibited distinct sensitivities, with POXC responding primarily to pedo-climate and canopy cover. CO2-C was influenced by all factors with depth-amplified variation, and CMR was most sensitive to land use and canopy position in topsoil but shifted to pedo-climatic control at depth. The fixed effects explained a small portion (14% to 16%) of topsoil (0–10 cm) variance, indicating significant unmeasured variability sources. Depth-moderated indicator relationships, POXC–SOC correlations weakened with depth, whereas CO2-C–CMR associations strengthened, indicating a transition from surface labile carbon control to deeper microbial and nutrient constraints. Critically, the indicators provide complementary, depth‑explicit information; POXC and SOC contextualize pool size and labile availability, whereas CO2-C and CMR assess the functional accessibility and energetic feasibility of decomposition. Therefore, these metrics are best used jointly to signal early changes rather than as stand-alone indicators. Future work should identify additional drivers to enhance capacity across depths and contexts.
1 Introduction
Soil organic carbon (SOC) plays a critical role in global biogeochemical cycles, significantly influencing climate regulation. It stores more carbon than the atmosphere and vegetation combined (1, 2), meaning even minor shifts in SOC stocks can significantly impact atmospheric CO2 levels and climate change (3). Beyond climate regulation, SOC is essential for sustaining ecosystems by improving soil fertility, increasing water retention, promoting biodiversity, and supporting essential ecosystem services such as nutrient cycling and organic matter decomposition (4, 5). Maintaining and increasing SOC stocks is therefore central to climate change mitigation, land degradation neutrality, and achieving multiple Sustainable Development Goals (6, 7).
Semi-arid zones face major challenges in managing soil carbon due to severe climatic conditions, including high temperatures, erratic rainfall, and prolonged dry periods, which contribute to soil fragility (8–10). These pressures limit primary productivity and microbial activity, leading to inherently low soil organic carbon levels (11) and making these ecosystems vulnerable to degradation, with climate extremes exacerbating SOC loss (11–13). Understanding soil carbon dynamics in these susceptible environments is crucial for developing effective land management strategies.
Traditional methods for assessing SOC dynamics are often lengthy and costly, making them impractical for frequent monitoring or large-scale assessments (14, 15). They can also fail to capture rapid, short-term changes in carbon pools. Consequently, there is growing interest in rapid, sensitive, and affordable indicators such as Permanganate Oxidizable Carbon (POXC), microbial respiration (CO2-C), and Carbon Mineralization Rate. POXC represents a labile fraction of SOC that responds quickly to changes in management and environment (15–18). It offers valuable insights into soil organic matter quality, nutrient cycling, and microbial activity, serving as a sensitive and cost-effective indicator of soil health and carbon dynamics (17, 19, 20). POXC is particularly valuable for providing an early indication of changes in soil carbon stabilization and mineralization processes (15, 21). Similarly, Microbial Respiration (CO2-C) measures the fraction of SOC decomposable by microorganisms, thereby reflecting soil metabolic activity and the size of the active carbon pool (22). This measurement reveals the efficiency with which microorganisms convert organic substrates into CO2 versus biomass, its contribution to soil fertility, and its sensitivity to land-use and land cover changes (23, 24). CO2-C is widely used as an indicator of soil biological activity and health (25). The Carbon Mineralization Rate (CMR) complements these two indicators by quantifying microbial decomposition and CO2 release, serving as a direct indicator of carbon stabilization or loss (26, 27). Monitoring these labile carbon pools provides early indications of SOC changes and is vital for improving soil health (28).
Despite their importance, a significant scientific gap remains in understanding the efficacy of these rapid indicators in reflecting complex carbon dynamics across varied land use, canopy structure, and pedo-climatic gradients, especially in West African semi-arid zones. These regions lack baseline data and suitable methodologies for resource-limited laboratories, hindering effective management practices for SOC accrual (29). The complex interactions between land use, land cover changes, and contrasting pedo-climatic conditions in regulating SOC dynamics are still poorly understood (30, 31). Investigating the responses of these indicators to these complex interactions is fundamental to establishing their role as diagnostic tools for soil health and carbon sequestration potential.
This study aims to address these knowledge gaps by investigating whether POXC, CO2-C, and CMR effectively reflect carbon dynamics across varying land use and pedo-climatic gradients in the semi-arid zones of West Africa. specifically, the study aims to: (i) assess how pedo-climate, land use, and canopy cover influence carbon indicators and SOC; (ii) evaluate the complementarity of key soil carbon indicators by comparing the relationships between carbon pools (SOC, POXC) and carbon fluxes (CO2-C, CMR) across two soil depths (0–10 cm and 10–30 cm).
We hypothesize that: (1) the selected soil carbon indicators exhibit distinct responses to environmental factors; and (2) POXC, CO2-C, and CMR provide complementary information for evaluating SOC dynamics. Testing these hypotheses will help determine if rapid, cost-effective indicators can effectively complement intensive SOC monitoring, providing valuable insights into carbon cycling within West African semi-arid ecosystems.
2 Materials and methods
2.1 Study area
The study was conducted in two main climatic zones of Burkina Faso: the Sudanian and Sudano-Sahelian zones (Figure 1). The climate is tropical and seasonal, with one rainy season followed by a long dry season (32). The Sudanian zone corresponds to a dry subhumid climate, whereas the Sudano-Sahelian zone is semi-arid (33, 34). The primary differences between the zones stem from the duration of the wet season, total rainfall, and temperature variability. Over 2008–2023, the Sudanian zone received an average annual rainfall of 1058 ± 180 mm, compared to 692 ± 162 mm in the Sudano-Sahelian zone (National Meteorology Agency of Burkina Faso). Mean annual temperatures were 27.9 ± 0.4°C and 29.2 ± 0.3°C, respectively, with relative humidity levels of 66% and 60%.

Figure 1. Map of the study area showing isohyet distribution and the locations of the study’s protected areas within different climatic zones. The upper left inset indicates the study country’s location within Africa, while the upper right inset presents the major soil types of Burkina Faso. BNDT, Base Nationale de Données Topographique of Burkina Faso; WRB, World Reference Base for soil resources.
Vegetation varies along this gradient: the Sudano-Sahelian zone features savanna grasslands and gallery forests, while the Sudanian zone supports denser savannas and open woodlands. Soil mapping (Figure 1c) identified Nitisols, Lixisols, and Plinthosols in the Sudanian zone, and Plinthosols, Regosols, and Leptosols in the Sudano-Sahelian zone (35). Because soil types overlap with climatic zones, this study considers a pedo-climatic effect rather than a purely climatic one. Soils in both zones are generally poor in organic matter and nutrients (36). The main land uses are croplands, grazing areas, and protected areas.
Croplands are a continuous cultivated area; crop production in Burkina Faso is mainly rainfed smallholder farming, involving over 73% of the active population, with most farms smaller than 5 ha (37, 38). Major crops include sorghum, millet, maize, rice, and cowpea, alongside cash crops such as cotton, sesame, groundnut, and soybean. Crop varieties are adapted to local climates: short-cycle cereals dominate in the Sudano-Sahelian zone, while the Sudanian zone supports longer-cycle varieties (39). Grazing lands often consist of fallow fields, forming transition zones between croplands and protected areas (40). Both cropland and fallows dominant tree species across both zones are Vitellaria paradoxa, Parkia biglobosa, Lannea microcarpa, and Faidherbia albida. In contrast, protected areas, clearly defined pieces of land by the government, exhibit greater variation in species composition between climatic zones.
2.2 Study design
This study employed a nested sampling design, capturing variations across different scales, from broad pedoclimatic zones down to specific sub-habitat types (Figure 2). To ensure spatial representativeness, two distinct sites were selected within each pedo-climatic zone, establishing four total study sites. Three main land use types (LUT), cropland, fallow, and protected area were delineated. This sequence is commonly used to assess changes in vegetation structure and soil functioning in West African savanna landscapes (41, 42). Croplands featured continuous cultivation for at least 20 years. Fallow lands, uncultivated for a minimum of five years, served as transitional systems that permit partial recovery of soil properties and biological activity after cultivation. Protected areas exhibited minimal or absent anthropogenic disturbance, allowing the preservation of essential ecosystem functions and services. For each LUT at every site, ten plots were randomly established, measuring 50 m × 50 m for cropland and fallow, and 50 m × 20 m for protected areas (43), yielding 120 plots across the study. Within each plot, two sub-habitat types, subcanopy and intercanopy, were distinguished based on canopy cover. The subcanopy referred to soil directly beneath the main tree canopy, while the intercanopy corresponded to open areas between trees (44). This sub-habitat distinction was used as a proxy for ecosystem structure and function, reflecting processes such as net primary productivity and plant biodiversity, which are closely associated with soil carbon dynamics (45). In croplands and fallows, subcanopy measurements typically involved Vitellaria paradoxa, Parkia biglobosa, and Lannea microcarpa. Protected areas, however, displayed varied subcanopy species. Carbon inputs, influenced by climate and land use, demonstrated varying mean biomass estimates; for instance, croplands showed 0.50 ± 0.02 t ha−1y-1 in the Sudanian zone and 0.34 ± 0.02 t ha−1y-1 in the Sudano-Sahelian zone (46), while protected areas had higher values of 5.44 ± 0.29 t ha−1y-1 in the Sudanian zone and 3.87 ± 0.12 t ha−1y-1 in the Sudano-Sahelian zone (47).
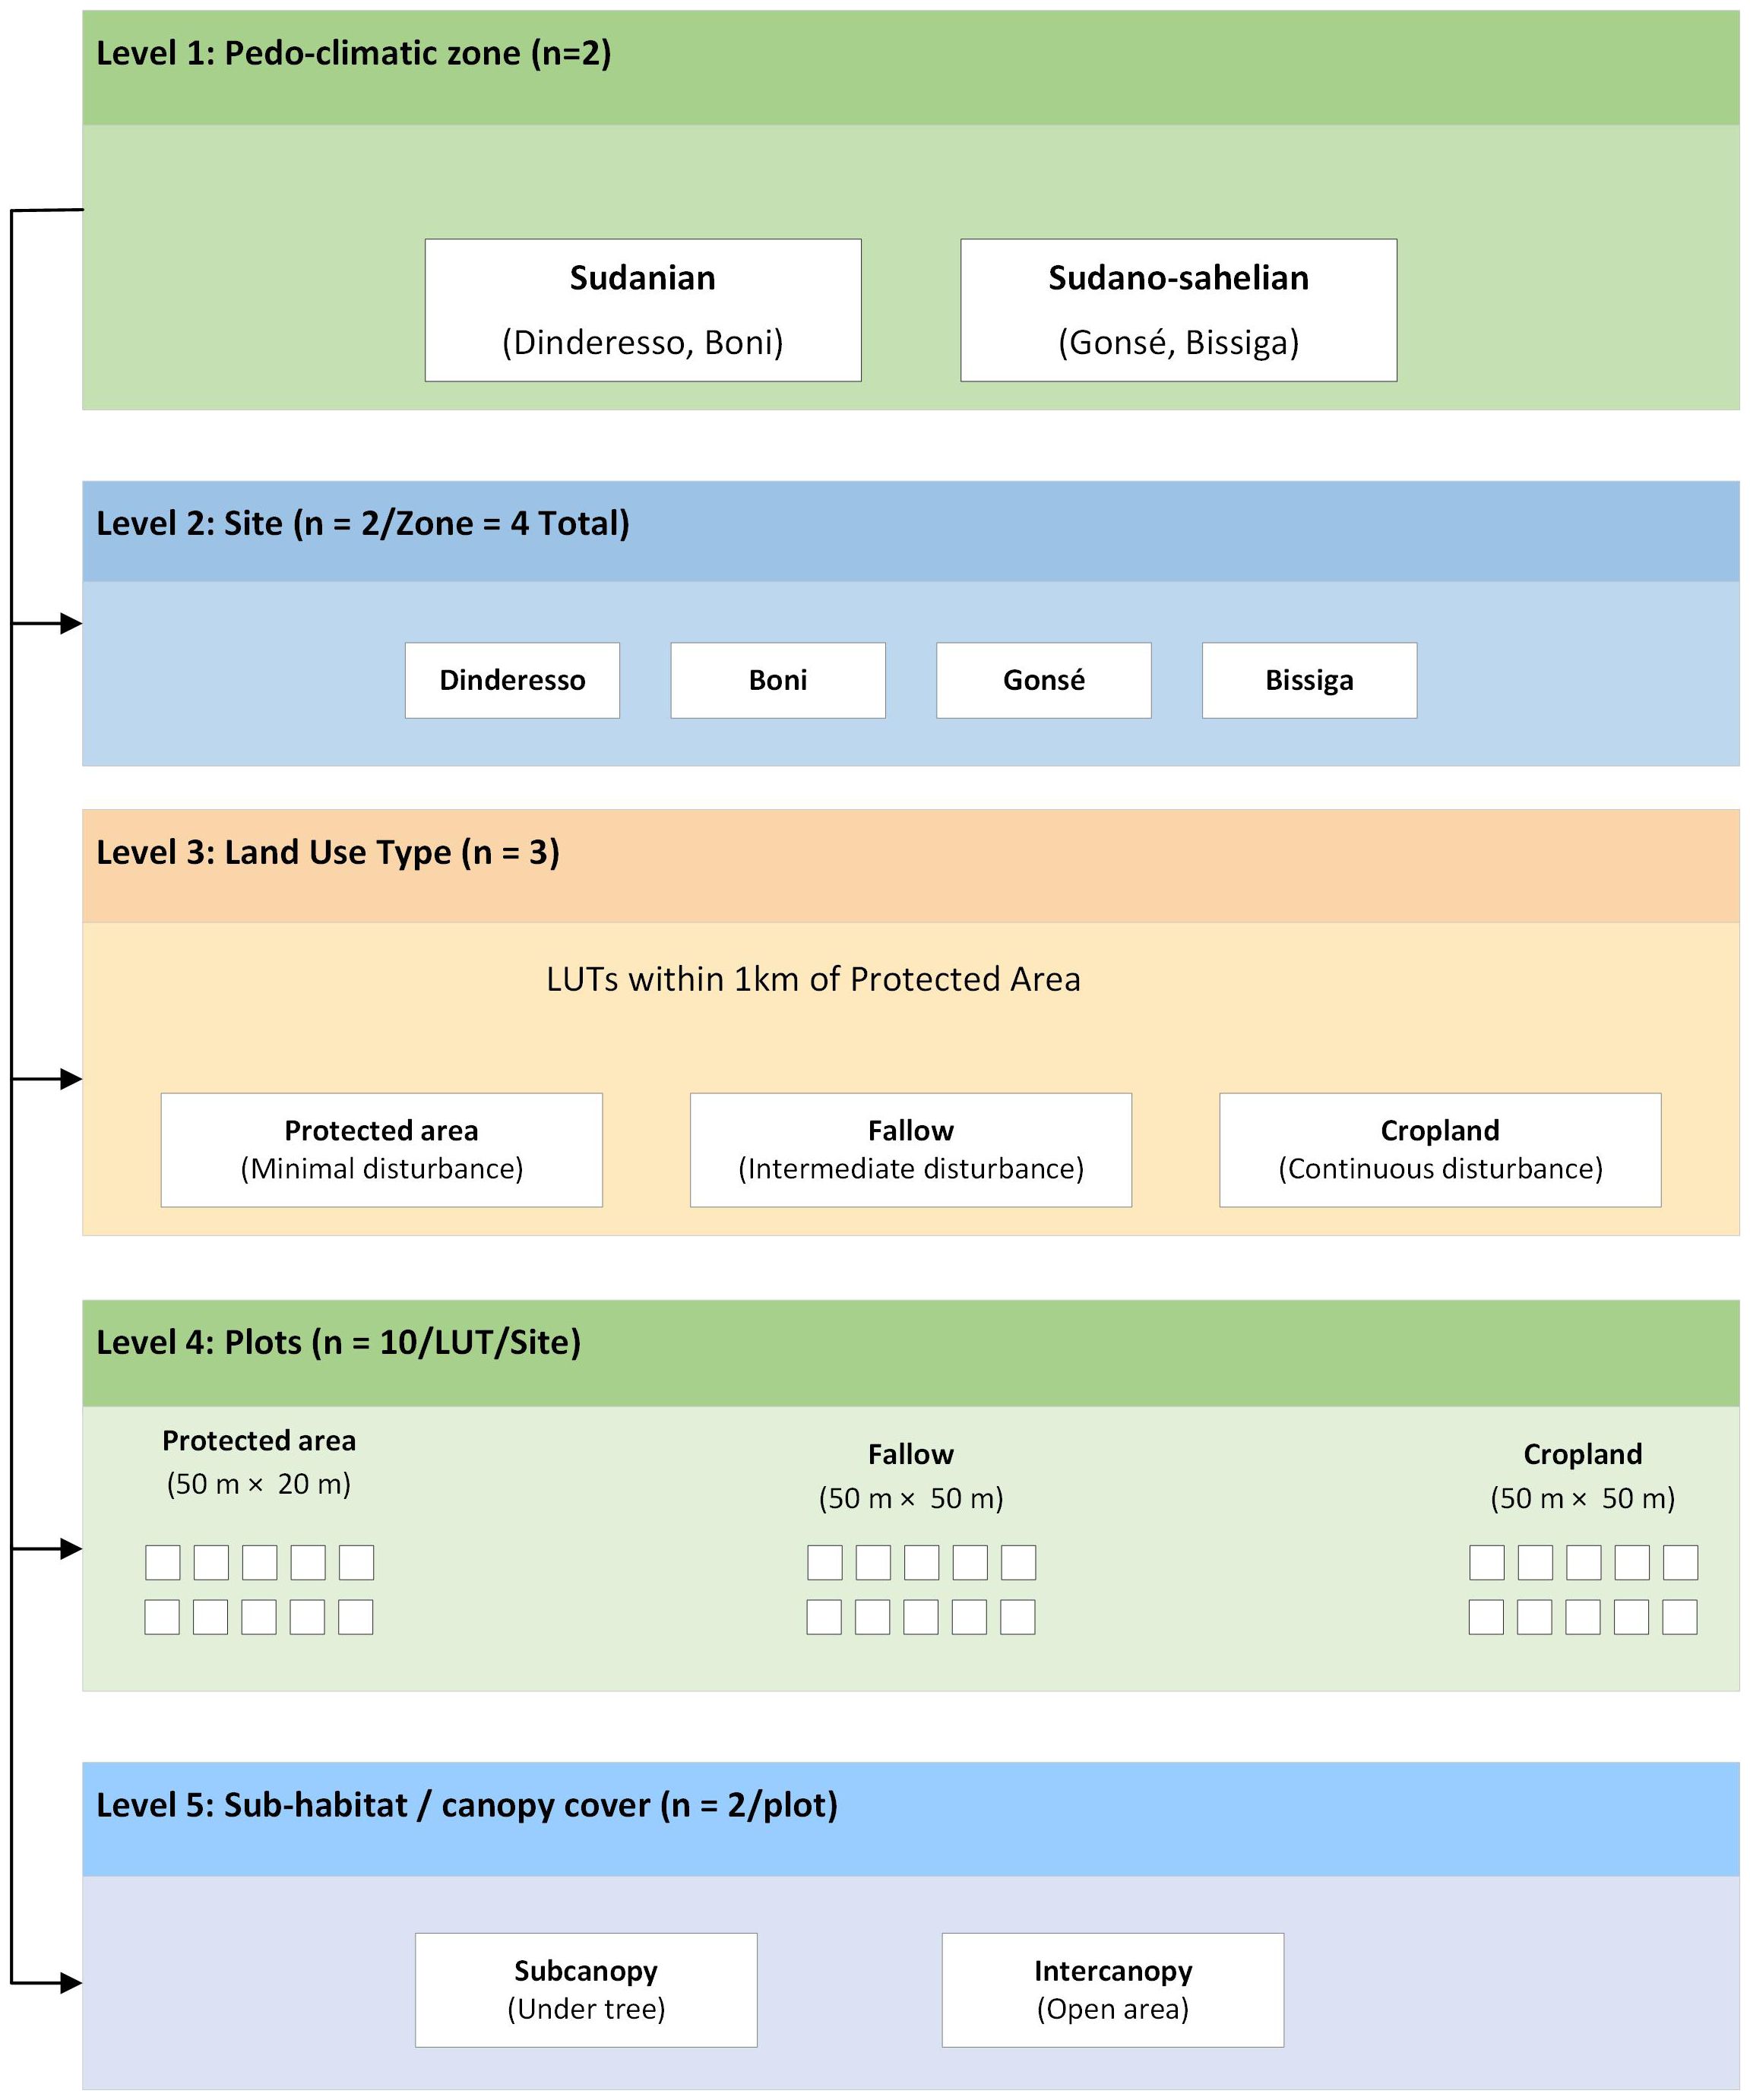
Figure 2. Conceptual diagram of the study design showing the different scales taken into account for soil sampling. LUT, Land use type.
2.3 Soil sampling strategy
Field data were collected across all sites after crop harvesting, between October and November. For each of the two distinguished sub-habitat types (subcanopy and intercanopy) within each plot, three 1 m × 1 m quadrats were randomly placed (Figure 3a). Soils collected from three sides of each quadrat (Figure 3b) were combined into a single composite sample per quadrat and per depth. These three quadrat composite samples were then further combined to form a single representative sample for each sub-habitat at each depth. Soil samples were collected from two distinct depths: 0–10 cm (topsoil) and 10–30 cm (subsurface soil). The complex design (Table 1) yielded a total of 480 soil samples. After collection, all soil samples were homogenized, air-dried to constant weight, and subsequently ground, with only the fractions measuring less than 2 mm retained for biological and chemical analysis.
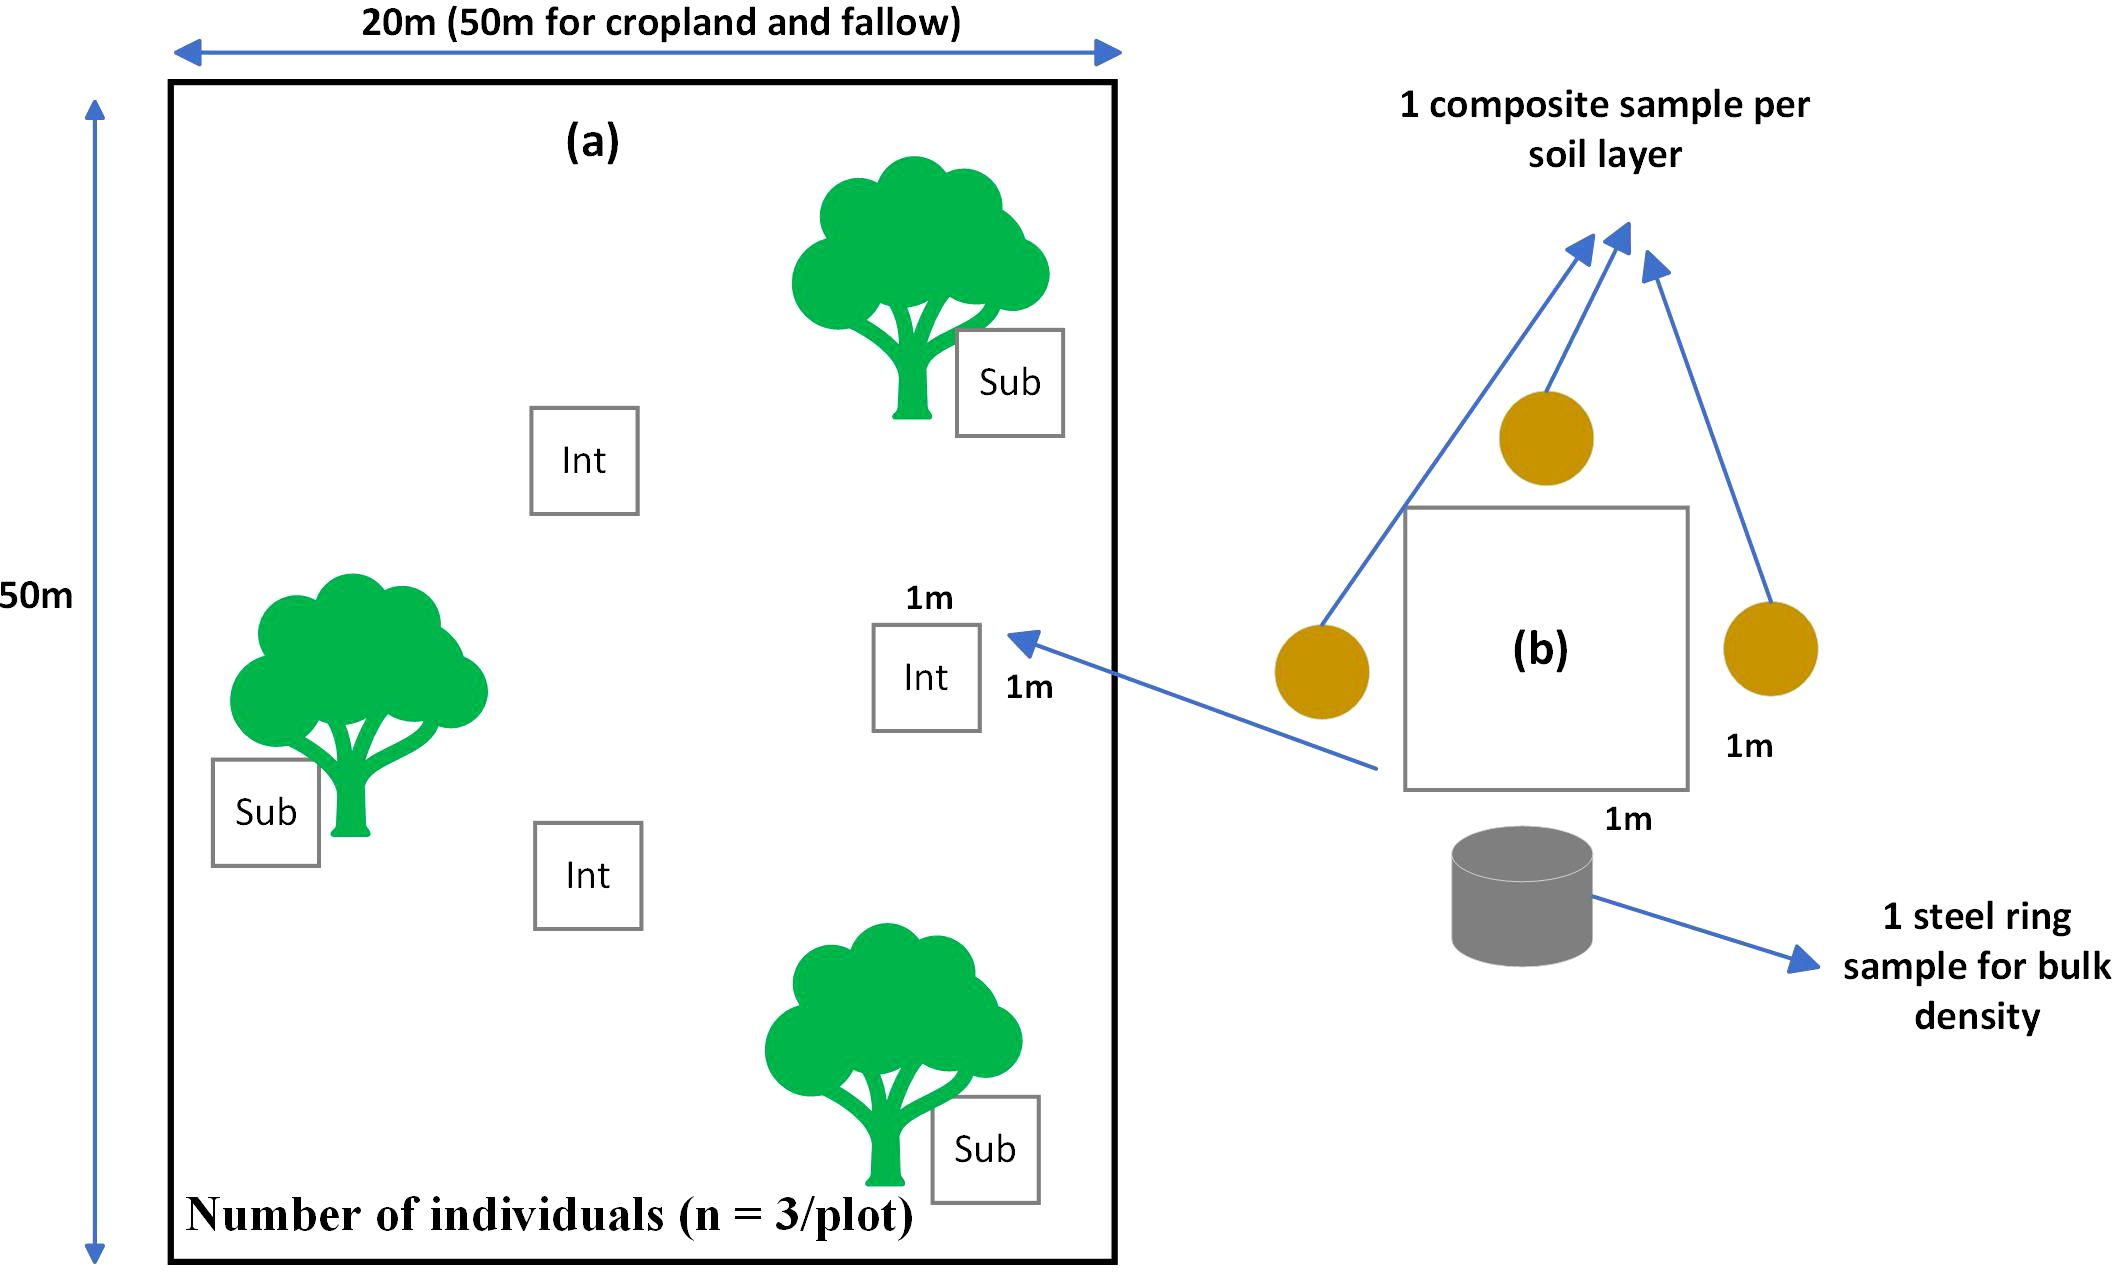
Figure 3. Sampling design at plot level with quadrat locations within a plot (A), and the diagram on the right side shows soil sampling locations around a quadrat (B). Sub, Subcanopy cover; Int, Intercanopy cover.

Table 1. Structure of the nested sampling design showing the hierarchical organization of sampling units across pedo-climatic zones, sites, land use types, plots, sub-habitats, and soil depths.
2.4 Laboratory analysis
2.4.1 Permanganate-oxidizable carbon measurement
Soil Labile Carbon was quantified as permanganate oxidizable carbon following the procedure described by Weil et al. (48). Air-dried soil samples (<2 mm) were weighed (2.5 g) into 50 mL centrifuge tubes and mixed with 20 mL of a 0.02 mol L⁻¹ KMnO4 solution. The suspensions were shaken vigorously for 2 min to ensure complete contact between soil and oxidant. After agitation, tubes were centrifuged at low speed to obtain a clear supernatant. An aliquot (0.5 mL) of the supernatant was then diluted with 49.5 mL of deionized water. The absorbance of the diluted KMnO4 solution was measured at 550 nm, and POXC was calculated using the standard (Equation 1):
where Abs is the sample absorbance, a and b are calibration constants, and Wt is the soil mass in grams. Results are expressed as mg POXC per kg of dry soil.
2.4.2 Soil microbial respiration measurement
Soil microbial respiration (CO2-C) or mineralizable carbon was determined using the incubation method (49, 50), which is based on the capture of carbon dioxide (CO2) released by microbial activity in an alkaline solution. For this purpose, 100 g of air-dried and rewetted to 50% water-filled pore space soil was placed in airtight glass jars, each containing a small beaker with 10 mL of sodium hydroxide solution (NaOH 0.1 N) without direct contact with the soil. The jars were incubated at a constant temperature of 28°C for 21 days. The CO2 released through microbial respiration was trapped by the NaOH solution and quantified through acid-base titration (51). At each measurement interval, the NaOH solution was removed and titrated with hydrochloric acid (HCl 0.1 N) using phenolphthalein as an indicator. Titrations were performed every 24 hours during the first week, and every 48 hours from the second week until the end of the incubation period. This approach allowed for a detailed temporal monitoring of soil microbial activity. The amount of carbon released as CO2 was calculated using the following, Equation 2:
where Vb is the volume (in litters) of acid used to titrate the blank (without soil), Vs is the volume used to titrate the sample, N is the normality of the acid, and the factor 6 corresponds to the atomic mass of carbon (12 g/mol) divided by 2, since 2 moles of NaOH react with 1 mole of CO2. Results were initially expressed in mg of carbon per 100 g of dry soil and then converted to mg of CO2/kg of soil to facilitate comparison and interpretation.
2.4.3 Soil organic carbon measurement
Soil Organic Carbon was measured by the modified Walkley Black method (52). 0.5g of finely ground and air-dry soil was weighed and 2.0 mL of 10% (0.34 M) K2Cr2O7 solution was added, followed by 5.0 mL of concentrated H2SO4. The mixture was allowed to stand for 30 minutes to complete oxidation, then 20.0 mL of distilled water was added, and the samples were left overnight. The absorbance of the calibration standards and samples was measured using a spectrophotometer set at 600 nm. A calibration curve with a correlation coefficient (R²) ≥ 0.99 was required to validate the analysis. The organic carbon content (%) was calculated following Equation 3:
where mg Csample is the analyte/concentration of carbon in the sample, mg C blank is the analyte/concentration of C in the blank, W is the mass of the air-dried soil (mg), and f=1.3 is the correction factor. Carbon concentrations were converted to g/kg by multiplying by 10.
2.4.4 Carbon mineralization calculation
The mineralization rate was calculated as the ratio between the cumulative amount of carbon mineralized (CO2-C) over the incubation period and the total soil organic carbon content (Equation 4), expressed as a percentage (53). This index provides an estimate of the relative proportion of organic carbon subject to microbial mineralization under controlled conditions.
Where CO2-C is the carbon dioxide released by soil sample incubation, and SOC, the soil organic carbon.
2.5 Statistical analysis
All statistical analyses were conducted separately for the two soil depths (0–10 cm and 10–30 cm) using R software (Version 4.4.3) with the packages lme4, lmerTest, FactoMineR, ggplot2, and MuMIn (54). To assess the individual and combined effects of pedo-climatic zone, land-use type, and canopy-cover type on POXC, CO2-C, CMR, and SOC, we used linear mixed-effects models (LMM) (55) with pedo-climate, land use, and canopy type as fixed factors. Initially, we attempted to specify a full nested random-effects structure, but this resulted in a singularity warning. Therefore, we simplified the model according to recommendations for complex designs (56), retaining only the plot as a random intercept. For each response variable (POXC, CO2-C, CMR, and SOC), data normality was assessed using the Shapiro-Wilk test. Given the non-normality of residuals, the data underwent log transformation before analysis. The significance of fixed effects was tested using three-way ANOVA with the lmerTest package in R. To assess the relative contributions of fixed and random effects, marginal and conditional R² values were calculated using the MuMIn package (55). Marginal R² quantifies the variance explained by fixed effects alone, while conditional R² reflects the variance explained by both fixed and random effects combined (57). A marginal R² close to zero indicates that the fixed effects explain little variation, and a large difference between marginal and conditional R² suggests substantial variation due to random effects. Model fit was evaluated through residual diagnostics, and post-hoc pairwise comparisons were performed using Tukey-adjusted means. The relationships between POXC, CO2-C, CMR, and SOC were analyzed while controlling for fixed effects such as pedo-climatic zone, land use type, and canopy cover type. This was done using Pearson correlation, with coefficients calculated for each grouping factor and visualized through correlation heatmaps. These analyses aimed to determine whether POXC, CO2-C, and CMR offer complementary insights for evaluating SOC dynamics. For all statistical tests, a significance level of α = 0.05 was used.
3 Results
3.1 Effect of pedo-climate, land use, and canopy cover on carbon pools, respiration, and carbon mineralization rate
The indicators responded differently to pedo-climate, land use, and canopy cover under semi-arid conditions. POXC varied significantly with climatic zone (p < 0.001) and canopy cover (p < 0.001); however, neither land use nor interactions among the main factors had significant effects (p > 0.05, Table 2). The Sudanian zone and subcanopy cover had the highest POXC values (Table 2). Regardless of soil depth, POXC showed similar responses to climate, land use, and canopy cover, with these factors together explaining only 16% of the variation (R²m = 0.16) in topsoil. When accounting for the random effect of plot, explained variation increased to 70% (R²c = 0.70), indicating that POXC depends more on site-specific management practices than on climatic zone, land-use category, or canopy cover.
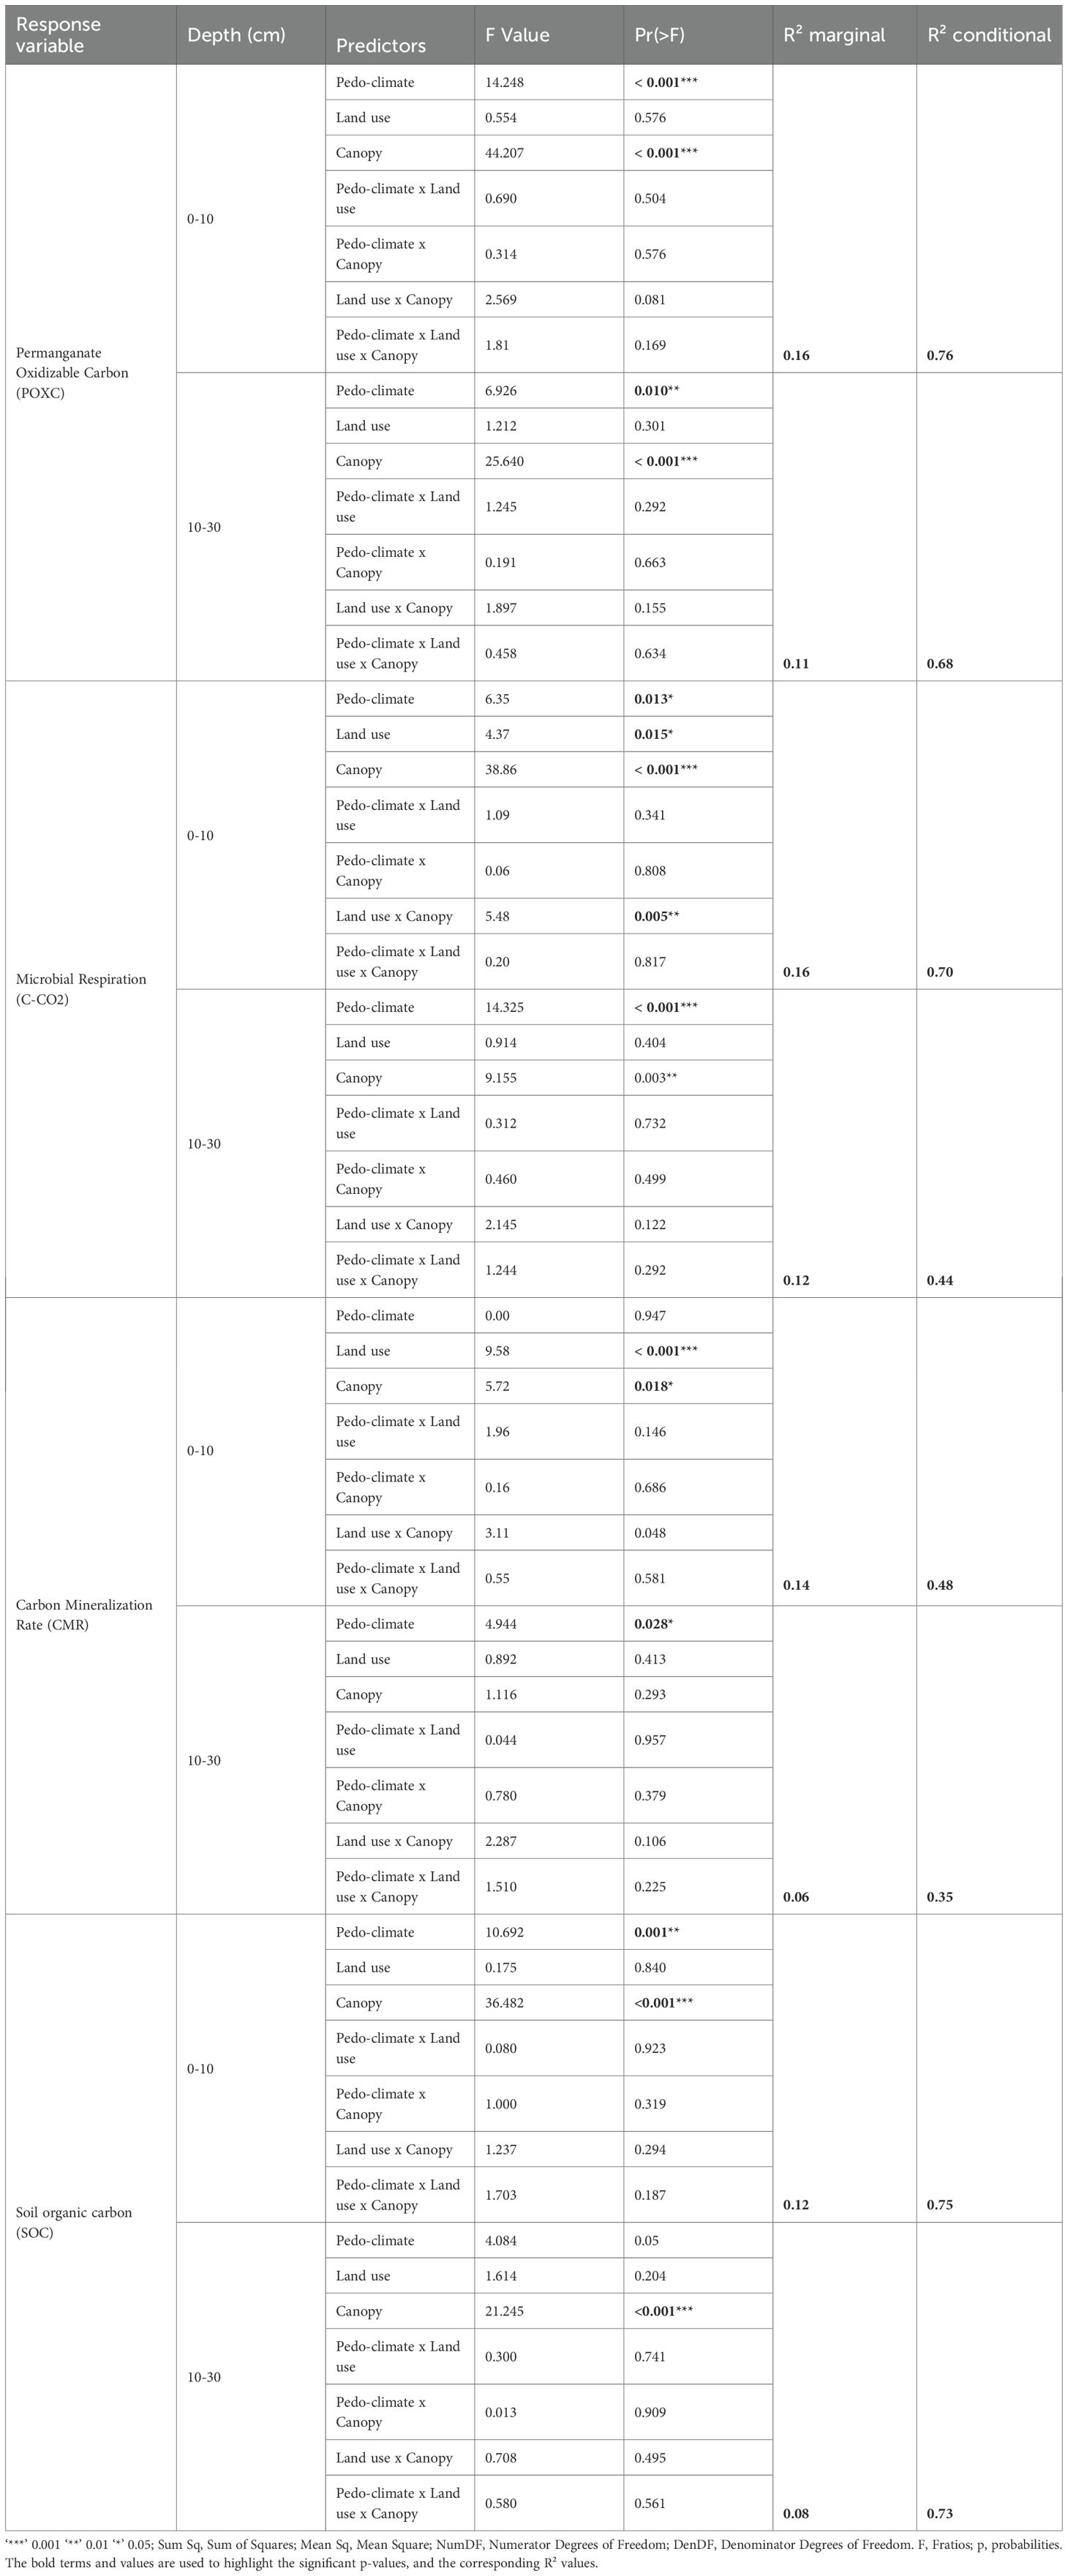
Table 2. Linear mixed model testing the effect of climate, land use, and canopy cover on permanganate-oxidizable carbon, microbial respiration, and carbon mineralization rate, with plot as a random effect.
CO2-C, in contrast, was significantly influenced in topsoil by pedo-climate (p = 0.013), canopy cover (p < 0.001), land use (p = 0.015), and the land use × canopy cover interaction (p = 0.005). In subsurface soil, only pedo-climate (p <0.001) and canopy cover (p = 0.003) had significant effects (Table 2). Higher CO2-C concentrations were observed in the Sudanian zone (627.49 ± 331.44 mg CO2 kg⁻¹ soil), fallows (676.30 ± 381.65 mg CO2 kg⁻¹ soil), and subcanopy cover (643.93 ± 206.31 mg CO2 kg⁻¹ soil) in topsoil, with similar patterns also observed in subsurface soil (Table 3). The variance explained was R²m = 0.16 and R²c = 0.70 in the topsoil, and R²m = 0.122 and R²c = 0.436 in the subsurface soil, indicating a stronger influence of random plot-level effects compared with fixed effects. No significant interactive effect between Pedo-climate x land use and pedo-climate x land use x canopy cover was observed for CO2-C (Table 2).
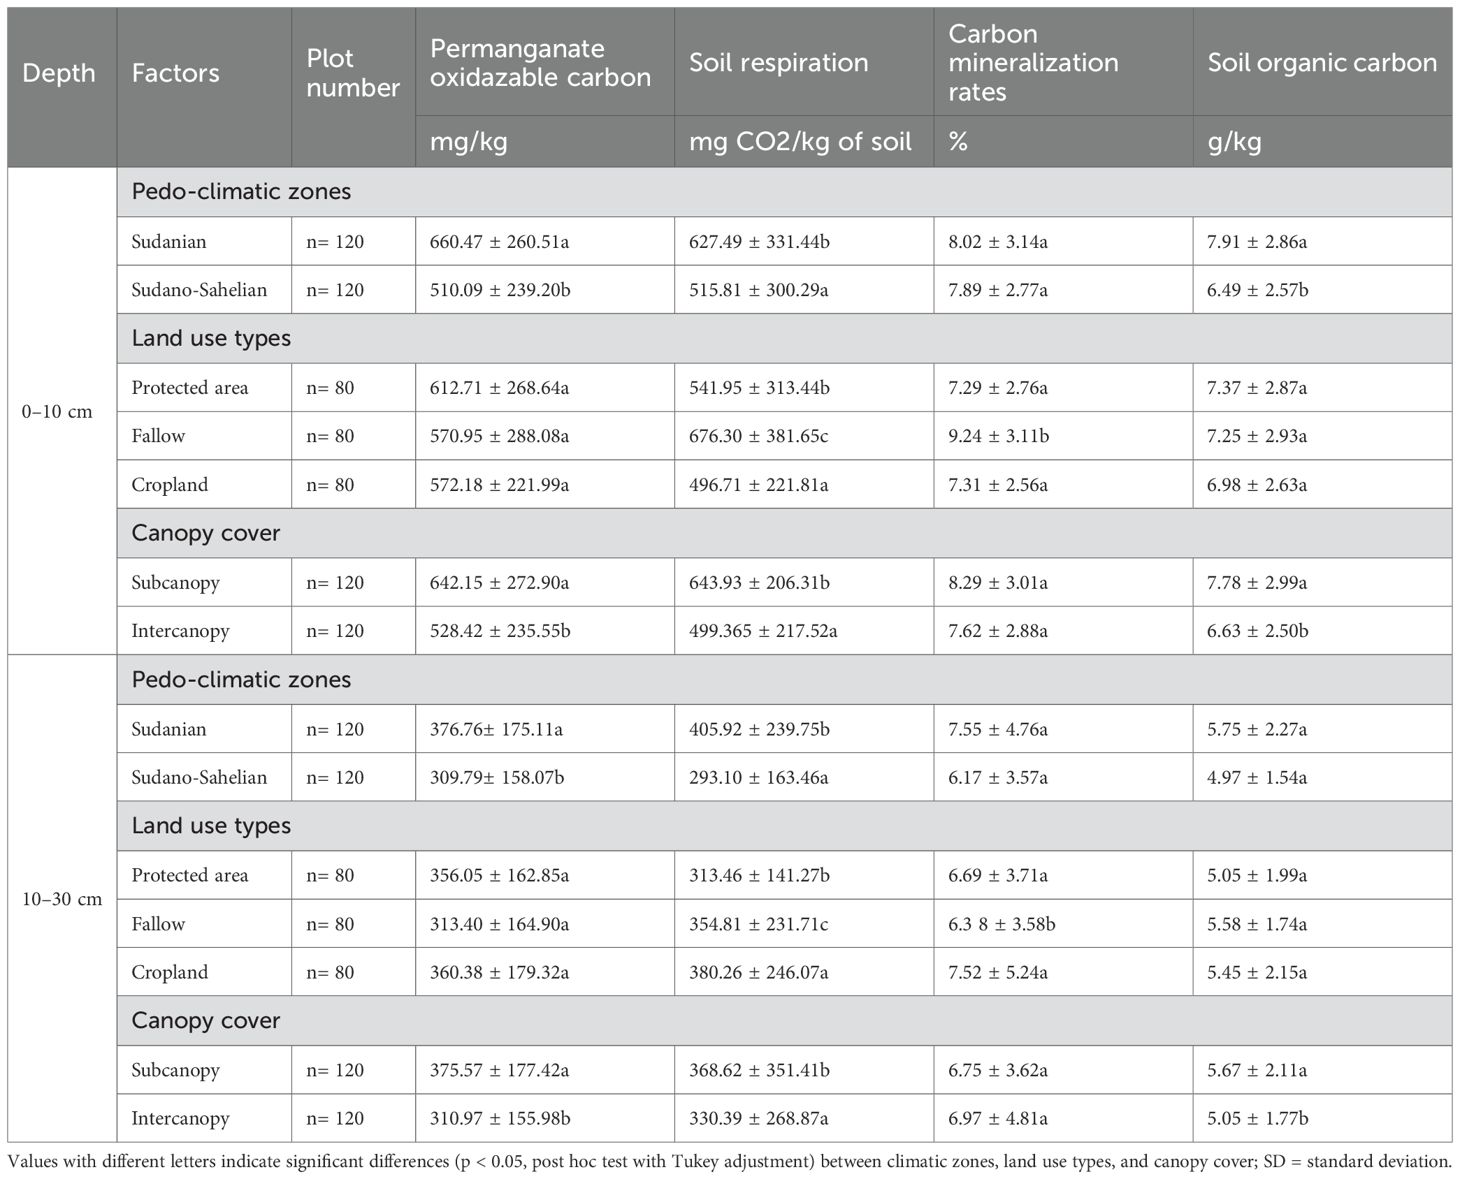
Table 3. Permanganate-oxidizable carbon, microbial respiration, and carbon mineralization rate variation across climatic zones, land use types, and canopy cover type (mean ± SD).
CMR exhibited depth-specific variation. In topsoil, CMR differed significantly by land use (p = 0.0001) and canopy cover (p = 0.018), while in subsurface soil, only pedo-climate had a significant effect (p = 0.028, Table 2). The highest mineralization rates were found in fallows (9.24 ± 3.11%) and subcanopy cover (8.29 ± 3.01%) in topsoil, and in the Sudanian zone in subsurface soil (Table 3). No interactive effect between factors was observed for CMR. Fixed effects of pedo-climate, land use, and canopy explained only a modest proportion of the variance (topsoil: R²m = 0.14; subsurface: R²m = 0.061), while conditional R² values (topsoil: R²c = 0.48; subsurface: R²c = 0.353) indicate that plot-level variability accounted for most of the explained variance (Table 2).
SOC showed similar spatial patterns to POXC. In the topsoil, SOC was significantly influenced by pedo-climatic conditions and canopy cover, whereas in the subsoil, only canopy cover had a significant effect (Table 2). In both layers, land use and all interaction terms had no significant effect on SOC. SOC concentrations were higher in the Sudanian zone (7.91 ± 2.86 g.kg-1) and under subcanopy cover (Table 3). Although the land use effect was not significant, SOC tended to be higher in protected areas and lower in croplands in the topsoil. In the subsoil, SOC remained greater under subcanopy cover, with slightly higher values in croplands and lower in protected areas, though differences were not significant. Fixed factors explained 12% of SOC variation in the topsoil and 7.9% in the subsoil, increasing to 75% and 73.4%, respectively, when random effects were included.
3.2 Relationship between soil organic carbon, permanganate oxidizable carbon, respiration, and mineralization rate
Pearson’s correlation analyses were used to explore the relationships and potential complementarity among various soil carbon indicators across different pedo-climatic zones, land use types, and canopy positions in both topsoil (Figure 4) and subsurface soil (Supplementary Figure S1). A consistent and strong positive correlation was observed between SOC and POXC across all evaluated factors. The correlation coefficient r ranged from 0.77 in the Sudano-Sahelian zone to 0.82 in the Sudanian zone (Figure 4A) and from 0.78 to 0.86 in different land use types (Figure 4B), indicating that POXC represents a large and proportional fraction of the total SOC pool. CO2-C was also positively correlated with both SOC and POXC. The relationship between CO2-C and POXC was consistently strong, with r values of 0.61-0.67 in pedo-climatic zones and 0.65-0.74 across land uses, and 0.56-0.69 in canopy type (Figure 4C). This suggests that the labile POXC fraction is a key substrate for microbial activity. In contrast, the CMR displayed distinct correlation patterns. It showed a moderate to strong positive correlation with CO2-C across most conditions (r = 0.53 to 0.67), linking it directly to soil biological function. However, CMR exhibited a weak and non-significant correlation with the absolute amount of labile carbon, POXC (r = -0.08 to 0.19), and a similarly weak, often slightly negative, correlation with total SOC (r = -0.19 to 0.07). This demonstrates that CMR provides information that is not captured by measurements of the carbon pool alone.

Figure 4. Pearson correlations among Soil organic carbon, Permanganate-oxidizable carbon, microbial respiration, and carbon mineralization rate in topsoil, showing by climatic zone (A), land use type (B), and canopy cover type (C).
In the subsurface layer (10–30 cm), the relationships between soil carbon indicators were notably different from those in the topsoil, reflecting altered biogeochemical drivers at depth (Supplementary Figure S1). The positive correlation between SOC and POXC persisted, but was generally weaker than in the topsoil layer, with r values ranging from 0.63 to 0.74 (Supplementary Figure S1). This suggests that while POXC still represents a component of the total SOC pool, its proportional contribution may be less consistent at depth, where organic matter is typically older and more processed. A key distinction in the subsurface was the pronounced decoupling of carbon pool (SOC and POXC) from soil respiration (CO2-C). The correlations between CO2-C and both SOC and POXC were substantially weaker and more variable across all conditions compared to the topsoil. For example, in the intercanopy position and cropland, the correlation between CO2-C and POXC was very weak (r = 0.13 and r = 0.14, respectively). This indicates that the absolute quantity of total or labile carbon is a poor predictor of microbial activity in the subsurface. Despite this decoupling, the CMR maintained a strong and significant positive correlation with CO2-C across most contexts (r = 0.57 to 0.85). Concurrently, CMR remained uncorrelated or was negatively correlated with both POXC (r = -0.32 to 0.22) and SOC (r = -0.36 to -0.02). This robust pattern underscores that CMR reflects a dimension of soil carbon dynamics that is independent of the size of the carbon stocks and is a more reliable indicator of soil function at depth.
4 Discussion
4.1 Pedo-climatic controls on soil carbon availability, turnover, and vulnerability
Pedo-climate emerged as a dominant control, fundamentally shaping soil organic carbon dynamics and microbial activity. The Sudanian zone consistently exhibited higher concentrations of POXC, SOC, and CO2-C efflux across soil depths compared to the drier Sudano-Sahelian zone. This marked contrast is attributed to the more favorable moisture-temperature regimes and greater biomass inputs, specifically from the woodland-savanna with taller grasses and higher tree density (58, 59), characteristic of the Sudanian zone. Higher rainfall, lower temperatures, and denser vegetation promote more substantial organic matter inputs, microclimate regulation, and sustained microbial activity, thereby enhancing labile carbon pools and overall decomposition rates (58). Conversely, the Sudano-Sahelian zone’s drier, more variable climate and sparser vegetation (open savanna-steppe with shorter grasses) restrict microbial activity and substrate availability, leading to lower carbon concentrations and efflux. Soil type may also contribute to these differences, as it is confounded with the climate effect in this study, which is consistent with previous studies showing that POXC is sensitive to edaphic and climatic variation (19, 20). Given that POXC acts as a sensitive measure of active, biologically available organic matter and is highly responsive to recent additions (60), its variation with pedo-climate in semi-arid zones strongly indicates that local microclimatic conditions play a dominant role in shaping the status of easily accessible carbon. The elevated CO2-C in the Sudanian zone, therefore, signifies faster mineralization and potentially lower carbon stabilization unless balanced by higher plant productivity.
The impact of pedo-climate on carbon mineralization rate was notably depth-dependent. While POXC, SOC, and CO2-C showed general sensitivity to pedo-climate across depths, CMR was significantly affected by pedo-climate primarily in subsurface soils, with the lowest values in the Sudano-Sahelian zone. This is likely due to stronger mineral association of organic matter and diffusional limits in subsurface soils, which are relaxed more frequently under the wetter Sudanian conditions (Cao et al., 2019). Studies have shown that carbon mineralization potentials are negatively correlated with aridity (61, 62) and that microbial communities from drier soils can exhibit higher moisture sensitivity (63). This implies that while surface carbon dynamics respond broadly to pedo-climate, subsurface soil carbon cycling is more acutely constrained by sustained moisture availability, emphasizing that drier conditions limit substrate diffusion and microbial activity at depth (62). Consequently, enhancing deeper carbon inputs through management practices such as deep-rooted species or mulching is crucial for carbon stabilization in the Sudano-Sahelian subsurface soils.
4.2 Effect of land use and canopy cover on soil carbon indicators
Land use exerted a nuanced influence on soil carbon dynamics, often interacting with local vegetation structure. Interestingly, POXC and SOC showed a limited response to the three land use types. This can be explained by several factors, including relatively modest differences in carbon inputs among land uses due to some anthropogenic perturbation in the protected area (47, 64), and the tree keeping in the cropland and Fallow (65, 66). Furthermore, due to financial constraints precluding the purchase of mineral fertilizers, farmers in the region applied manure and compost to their croplands (67, 68), which is a good source of carbon inputs in cropland. This practice, while beneficial, may not always be fully reflected by certain indicators. For instance, the limited responsiveness of POXC to land use can be influenced by the characteristic low SOC levels in semi-arid environments (11, 69). In such complex systems, where aridity strongly mediates microbial activity and soil organic matter properties, the interpretation of carbon indicators like POXC can be challenging due to inherent variability and the multitude of uncaptured mechanisms affecting decomposition rates (70). Additionally, potential methodological limitations of the POXC assay might obscure subtle changes in composition (21, 60, 71).
In contrast, CO2-C efflux and CMR in topsoil were significantly and consistently modified by land use, following the sequence of Fallow > Cropland ≈ Protected area. This sensitivity highlights their role as functional output indicators, effectively capturing microbial responses to disturbance, residue management, and substrate quality. Fallow systems, benefiting from greater litter and root inputs and minimal disruption, provide readily mineralizable substrates, even smaller, and improved microhabitats, thus enhancing respiration and mineralization. This finding aligns with evidence of superior biological activity and restoration potential in fallow lands (42, 72, 73), although it also points to a trade-off with increased nutrient cycling and potential carbon loss (74), suggesting a low carbon stabilization potential as higher CMR (6.17-9.24%).
The vegetation structure, particularly canopy cover, played a critical role in modulating microclimatic conditions and carbon dynamics within all land use types. Soils beneath subcanopy areas consistently exhibited higher POXC, SOC, CO2-C, and CMR compared to intercanopy areas. This is attributed to the protective role of large tree canopies, which shield the soil from erosion and extreme temperatures, maintain higher and more stable soil moisture, and provide continuous organic matter inputs through litter and root exudates, as revealed by several studies (75–78). This buffering effect creates a more favorable microhabitat for microbial activity, enhancing decomposition and carbon cycling, and ultimately contributing to improved soil structure, fertility, and ecosystem resilience. This underscores the central role of aboveground vegetation in mitigating environmental extremes and sustaining soil carbon in water-limited landscapes. Therefore, strategies that preserve or restore tree cover are essential for soil carbon sequestration and ecosystem functioning in these vulnerable regions.
Critically, pedo-climate, land use, and canopy cover explained together less than 20% of the variation in these indicators, suggesting their responses are driven by more intricate interactions, such as site-specific edaphic properties and microclimate (62). The limited response of POXC to land use confirms that it alone is insufficient to characterize soil carbon dynamics, which is consistent with Margenot et al. (79) findings; instead, it should be combined with process-oriented measures.
4.3 Vertical stratification of carbon dynamics and the complementary roles of selected indicators
The functional complementarity of soil carbon pools (SOC, POXC) and flux (CO2-C, CMR) indicators is revealed through a distinct vertical stratification of carbon dynamics. The relationships between carbon pools and microbial activity shift fundamentally with depth, transitioning from a substrate-driven paradigm in the topsoil to a system where carbon processing is decoupled from carbon pool size in the subsurface soil. This depth-dependent shift exposes the unique and non-interchangeable information provided by each indicator, consistent with studies showing that labile carbon proxies and respiration metrics respond differently across environmental and management contexts (80, 81). In the topsoil, where fresh organic matter is abundant, there is a notable overlap between indicators, with POXC serving as a highly reliable proxy for available fuel, due to its strong positive relation with CO2-C, which confirms that carbon quantity is a primary driver of flux in this layer. However, in the subsurface soil (10 to 30 cm), the connection between carbon pools and fluxes breaks down. This means that microbial activity depends on factors beyond just the availability of easily accessible carbon, but is also influenced by the stability of older organic matter as revealed by several studies (82, 83). SOC and POXC effectively quantify quantity and lability, but biological indicators CO2−C and CMR register realized and potential microbial processing under prevailing constraints. This divergence reveals that these indicators provide essential, distinct information: POXC indicates potential substrate, whereas CO2-C and CMR reflect realized ecosystem function. Combining them avoids blind spots inherent in any single class of metrics. This necessity of integrating different types of metrics, such as combining chemical and biological measures, is supported by other studies seeking a holistic view of soil function (84, 85). Therefore, this study demonstrates that a robust assessment of soil carbon in semi-arid zone requires moving beyond any single measurement. For a complete picture, use POXC with CO2−C/CMR in topsoil to capture labile−pool sensitivity and functional response, but prioritize CO2−C and CMR in subsurface soils to estimate accessibility and energy limits while using SOC/POXC to contextualize pool size and stabilization state. Reporting depth−stratified panels that pair chemical fractions with respiration metrics provides a defensible, process−oriented evaluation of carbon dynamics in semi−arid soils across land use and environmental gradients.
5 Conclusion
This study evaluated the effectiveness of Permanganate Oxidizable Carbon (POXC), soil microbial respiration (CO2-C), and carbon mineralization rate (CMR) as indicators of carbon dynamics in semi-arid zones, considering the influences of pedo-climate, land use, and canopy cover. POXC and Soil Organic Carbon (SOC) primarily responded to pedo-climatic zones and canopy cover, indicating that inherent soil and climate conditions, along with vegetation structure, are more dominant than management practices in shaping their dynamics. CO2-C showed a general sensitivity to all three factors, confirming its roles as an integrated measure of microbial activity and carbon turnover. CMR’s responses varied with depth; land use and canopy cover influenced it in the topsoil, while climate influenced it at deeper levels. Despite their observed responsiveness, the factors studied (pedo-climate, land use, and canopy cover) explained only a small portion (less than 20%) of the total variation in these indicators. This suggests that other unquantified factors, complex interactions, or soil heterogeneity significantly influence these indicators, meaning a solely factor-based approach offers an incomplete understanding. POXC, CO2-C, and CMR are important preliminary indicators that reflect changes in soil carbon dynamics across various land uses and climatic conditions. As soil depth increases, CO2-C and CMR become more closely linked, while the correlation between SOC and POXC remains positive but weaker in subsurface soils. This suggests a transition from surface dynamics driven by substrate availability to constraints related to accessibility and protection deeper in the soil profile. Together, the depth-specific responses of POXC, CO2-C, and CMR highlight their complementary strengths, including pool size and lability in the topsoil, as well as functional accessibility and energetic limitations in subsurface soils. This information provides a clear, process-oriented foundation for evaluating carbon dynamics and management impacts in semi-arid West Africa.For evaluating carbon dynamics, employ POXC alongside CO2−C/CMR in the topsoil to assess the sensitivity of the labile carbon pool and its functional responses. When looking at subsoils, concentrate on CO2−C and CMR to understand accessibility and energy limitations. Furthermore, use the SOC/POXC ratio to offer insight into the size and stabilization status of the carbon pools. Future research should identify additional influential factors, refine depth-specific thresholds, and test indicator resilience under extreme climate scenarios to inform comprehensive soil management in semi-arid ecosystems.
Data availability statement
The raw data supporting the conclusions of this article will be made available by the authors, without undue reservation.
Author contributions
GN: Conceptualization, Data curation, Formal Analysis, Funding acquisition, Investigation, Methodology, Visualization, Writing – original draft, Writing – review & editing. AB: Conceptualization, Methodology, Funding acquisition, Resources, Supervision, Validation, Writing – review & editing. AG: Validation, Methodology, Writing – review & editing. OO: Conceptualization, Funding acquisition, Project administration, Supervision, Writing – review & editing. JB: Supervision, Validation, Writing – review & editing.
Funding
The author(s) declare that financial support was received for the research and/or publication of this article. This work was supported by the German Federal Ministry of Education and Research within the West African Science Service Centre for Climate Change and Adapted Land Use [grant numbers 01LG2081A] and the Prince Albert II of Monaco Foundation through the Intergovernmental Panel on Climate Change Research Scholarship.
Acknowledgments
The authors would like to extend our heartfelt gratitude to Institut de l’Environment et de Recherches Agricoles (INERA) Farakoba/programme gestion de ressources naturelles for granting us access to their plant and soil laboratory, which was instrumental in conducting our soil analyses.
Conflict of interest
The authors declare that the research was conducted in the absence of any commercial or financial relationships that could be construed as a potential conflict of interest.
Correction note
This article has been corrected with minor changes. These changes do not impact the scientific content of the article.
Generative AI statement
The author(s) declare that Generative AI was used in the creation of this manuscript. Generative AI was used to assist with proofreading and grammar correction.
Any alternative text (alt text) provided alongside figures in this article has been generated by Frontiers with the support of artificial intelligence and reasonable efforts have been made to ensure accuracy, including review by the authors wherever possible. If you identify any issues, please contact us.
Publisher’s note
All claims expressed in this article are solely those of the authors and do not necessarily represent those of their affiliated organizations, or those of the publisher, the editors and the reviewers. Any product that may be evaluated in this article, or claim that may be made by its manufacturer, is not guaranteed or endorsed by the publisher.
Supplementary material
The Supplementary Material for this article can be found online at: https://www.frontiersin.org/articles/10.3389/fsoil.2025.1671112/full#supplementary-material
Supplementary Figure 1 | Pearson correlations among soil organic carbon, permanganate-oxidizable carbon, microbial respiration, and carbon mineralization rate in subsurface soil, showing by climatic zone (A), land use type (B), and canopy cover type (C).
References
1. Lal R, Monger C, Nave L, and Smith P. The role of soil in regulation of climate. Phil Trans R Soc B. (2021) 376:20210084. doi: 10.1098/rstb.2021.0084, PMID: 34365818
2. Beillouin D, Cardinael R, Berre D, Boyer A, Corbeels M, Fallot A, et al. A global overview of studies about land management, land-use change, and climate change effects on soil organic carbon. Global Change Biol. (2022) 28:1690–702. doi: 10.1111/gcb.15998, PMID: 34873793
3. Tian H, Lu C, Yang J, Banger K, Huntzinger DN, Schwalm CR, et al. Global patterns and controls of soil organic carbon dynamics as simulated by multiple terrestrial biosphere models: Current status and future directions. Global Biogeochemical Cycles. (2015) 29:775–92. doi: 10.1002/2014GB005021, PMID: 27642229
4. Adekiya AO, Alori ET, Ogunbode TO, Sangoyomi T, and Oriade OA. Enhancing organic carbon content in tropical soils: strategies for sustainable agriculture and climate change mitigation. TOASJ. (2023) 17:e18743315282476. Available online at: https://openagriculturejournal.com/VOLUME/17/ELOCATOR/e18743315282476/.
5. Lal R. Soil health and carbon management. Food Energy Secur. (2016) 5:212–22. doi: 10.1002/fes3.96
6. FAO. Soil organic carbon: the hidden potential. Rom: Food and Agriculture Organization of the United Nations (2017). 1 p.
7. Don A, Seidel F, Leifeld J, Kätterer T, Martin M, Pellerin S, et al. Carbon sequestration in soils and climate change mitigation—Definitions and pitfalls. Global Change Biol. (2024) 30:e16983. doi: 10.1111/gcb.16983, PMID: 37905459
8. Scholes RJ. The future of semi-arid regions: A weak fabric unravels. Climate. (2020) 8:43. Available online at: https://www.mdpi.com/2225-1154/8/3/43.
9. Da Silva BF, Dos Santos Rodrigues RZ, Heiskanen J, Abera TA, Gasparetto SC, Biase AG, et al. Evaluating the temporal patterns of land use and precipitation under desertification in the semi-arid region of Brazil. Ecol Inf. (2023) 77:102192. Available online at: https://linkinghub.elsevier.com/retrieve/pii/S1574954123002212.
10. Tariq A, Sardans J, Zeng F, Graciano C, Hughes AC, Farré-Armengol G, et al. Impact of aridity rise and arid lands expansion on carbon-storing capacity, biodiversity loss, and ecosystem services. Global Change Biol. (2024) 30:e17292. doi: 10.1111/gcb.17292, PMID: 38634556
11. Traoré S, Ouattara K, Ilstedt U, Schmidt M, Thiombiano A, Malmer A, et al. Effect of land degradation on carbon and nitrogen pools in two soil types of a semi-arid landscape in West Africa. Geoderma. (2015) 241–242:330–8. Available online at: https://linkinghub.elsevier.com/retrieve/pii/S001670611400425X.
12. OSS. Sahel and West Africa - Atlas of land cover maps - Strengthening Resilience through services related to innovation, communication and knowledge. Tunis, Tunisie: Sahara and Sahel Observatory (OSS) (2019). p. 204. BRICKS (Benin, Burkina Faso, Chad, Ethiopia, Ghana, Mali, Mauritania, Niger, Nigeria, Senegal, Sudan and Togo).
13. Mesele SA, Mechri M, Okon MA, Isimikalu TO, Wassif OM, ASamoah E, et al. Current problems leading to soil degradation in africa: raising awareness and finding potential solutions. Eur J Soil Sci. (2025) 76:e70069. doi: 10.1111/ejss.70069
14. Ewing PM, TerAvest D, Tu X, and Snapp SS. Accessible, affordable, fine-scale estimates of soil carbon for sustainable management in sub-Saharan Africa. Soil Sci Soc Amer J. (2021) 85:1814–26. doi: 10.1002/saj2.20263
15. Hurisso TT, Culman SW, Horwath WR, Wade J, Cass D, Beniston JW, et al. Comparison of permanganate-oxidizable carbon and mineralizable carbon for assessment of organic matter stabilization and mineralization. Soil Sci Soc Amer J. (2016) 80:1352–64. doi: 10.2136/sssaj2016.04.0106
16. Romero CM, Engel RE, D’Andrilli J, Chen C, Zabinski C, Miller PR, et al. Patterns of change in permanganate oxidizable soil organic matter from semiarid drylands reflected by absorbance spectroscopy and Fourier transform ion cyclotron resonance mass spectrometry. Organic Geochemistry. (2018) 120:19–30. Available online at: https://linkinghub.elsevier.com/retrieve/pii/S0146638018300561.
17. Bongiorno G, Bünemann EK, Oguejiofor CU, Meier J, Gort G, Comans R, et al. Sensitivity of labile carbon fractions to tillage and organic matter management and their potential as comprehensive soil quality indicators across pedoclimatic conditions in Europe. Ecol Indic. (2019) 99:38–50. Available online at: https://linkinghub.elsevier.com/retrieve/pii/S1470160X18309415.
18. Vellenga, Ewing PM, Tracy J, English M, Neher D, Darby H, et al. POXC UVM soil Health Research and Extension Center. UVM-SHREC-FS-07-02. Burlington, USA: University of Vermont Soil Health Research and Extension Center (SHREC) Tests (2025).
19. Duval ME, Galantini JA, Martínez JM, and Limbozzi F. Labile soil organic carbon for assessing soil quality: influence of management practices and edaphic conditions. CATENA. (2018) 171:316–26. Available online at: https://linkinghub.elsevier.com/retrieve/pii/S034181621830300X.
20. Ramírez PB, Calderón FJ, Fonte SJ, Santibáñez F, and Bonilla CA. Spectral responses to labile organic carbon fractions as useful soil quality indicators across a climatic gradient. Ecol Indic. (2020) 111:106042. Available online at: https://linkinghub.elsevier.com/retrieve/pii/S1470160X19310386.
21. Pulleman M, Wills S, Creamer R, Dick R, Ferguson R, Hooper D, et al. Soil mass and grind size used for sample homogenization strongly affect permanganate-oxidizable carbon (POXC) values, with implications for its use as a national soil health indicator. Geoderma. (2021) 383:114742. Available online at: https://linkinghub.elsevier.com/retrieve/pii/S0016706120313148.
22. Bandura C, Elmquist D, Hall S, Ruark M, and Kampa J. An overview of common soil health indicators. Crops Soils. (2025). Available online at: https://cropsandsoils.extension.wisc.edu/articles/an-overview-of-common-soil-health-indicators/ (Accessed September 20, 2025).
23. Santiago T, Pablo LP, Olga SC, Veronica G, and Marina GP. Soil microbial communities respond to an environmental gradient of grazing intensity in south Patagonia Argentina. J Arid Environments. (2021) 184:104300. Available online at: https://linkinghub.elsevier.com/retrieve/pii/S0140196320301993.
24. Adedayo AA, Fadiji AE, and Babalola OO. Quantifying the respiratory pattern of rhizosphere microbial communities in healthy and diseased tomato plants using carbon substrates. J Soil Sci Plant Nutr. (2023) 23:6485–96. doi: 10.1007/s42729-023-01504-z
25. Crookston BS, Yost MA, Bowman M, Veum K, and Stevens JR. Microbial respiration gives early indication of soil health improvement following cover crops. J Soil Water Conserv. (2023) 78:272–81. doi: 10.2489/jswc.2023.00015
26. He Y, Wang Y, Jiang Y, Yin G, Cao S, Liu X, et al. Drivers of soil respiration and nitrogen mineralization change after litter management at a subtropical Chinese sweetgum tree plantation. Soil Use Manage. (2023) 39:92–103. doi: 10.1111/sum.12823
27. Wang X, Sheng L, Li Y, Jiang H, Lv Z, Qi W, et al. Soil labile organic carbon indicating seasonal dynamics of soil organic carbon in northeast peatland. Ecol Indic. (2022) 138:108847. Available online at: https://linkinghub.elsevier.com/retrieve/pii/S1470160X22003181.
28. Nazir MJ, Li G, Nazir MM, Zulfiqar F, Siddique KHM, Iqbal B, et al. Harnessing soil carbon sequestration to address climate change challenges in agriculture. Soil Tillage Res. (2024) 237:105959. Available online at: https://linkinghub.elsevier.com/retrieve/pii/S0167198723003264.
29. McCarty GW, Iii JBR, Yost R, Doraiswamy PC, and Doumbia M. Evaluation of methods for measuring soil organic carbon in West African soils. Afr J Agric Res. (2010) 5:2169–77.
30. Bellè SL, Riotte J, Sekhar M, Ruiz L, Schiedung M, and Abiven S. Soil organic carbon stocks and quality in small-scale tropical, sub-humid and semi-arid watersheds under shrubland and dry deciduous forest in southwestern India. Geoderma. (2022) 409:115606. Available online at: https://linkinghub.elsevier.com/retrieve/pii/S0016706121006868.
31. Benslama A, Benbrahim F, Rym-Gadoum L, Gómez-Lucas I, Mordan-Vidal MM, Navarro-Pedreño J, et al. Soil carbon storage under different types of arid land use in Algeria. Environ Geochem Health. (2024) 46:330. doi: 10.1007/s10653-024-02036-w, PMID: 39017950
32. Wittig R, König K, Schmidt M, and Szarzynski J. A study of climate change and anthropogenic impacts in West Africa. Env Sci Poll Res Int. (2007) 14:182–9. doi: 10.1065/espr2007.02.388, PMID: 17561777
33. Zomer RJ, Xu J, and Trabucco A. Version 3 of the global aridity index and potential evapotranspiration database. Sci Data. (2022) 9:409. Available online at: https://www.nature.com/articles/s41597-022-01493-1., PMID: 35840601
34. Spinoni J, Vogt J, Naumann G, Carrao H, and Barbosa P. Towards identifying areas at climatological risk of desertification using the Köppen-Geiger classification and FAO aridity index: TOWARDS IDENTIFYING AREAS AT CLIMATOLOGICAL RISK OF DESERTIFICATION. Int J Climatol. (2015) 35:2210–22. doi: 10.1002/joc.4124
35. Caspari T and SChad P. World Soil Map according to WRB2014, derived from the Harmonized World Soil Database. Wageningen: ISRIC – World Soil Information (2022).
36. Buerkert A and Hiernaux P. Nutrients in the West African Sudano-Sahelian zone: Losses, transfers and role of external inputs. J Plant Nutr Soil. (2011) 161:365–83. doi: 10.1002/jpln.1998.3581610405
37. FAO. Burkina Faso country fact sheet on food and agriculture policy trends (2014). FAO. Available online at: https://www.fao.org/4/i3760e/i3760e.pdf (Accessed September 19, 2025).
38. INSD. Caracteristiques Des Menages Agricoles Du Burkina Faso (2023). Burkina Faso: Institut national de la statistique et de la démographie. Available online at: https://www.insd.bf/sites/default/files/2024-07/Caract%C3%A9ristiques%20des%20m%C3%A9nages%20agricoles%20au%20Burkina%20Faso.pdf. Report No.: 5eme RGPH.
39. Tomalka J, Lange S, Röhrig F, and Gornott C. Climate Risk Profile: Burkina Faso (2020). GIZ. Available online at: https://www.pik-potsdam.de/en/institute/departments/climate-resilience/projects/project-pages/agrica/giz_climate-risk-profile_burkina-faso_en (Accessed September 19, 2025).
40. Nianogo DA and Thomas DI. Forest-livestock interactions in West Africa (2004). Royal Swedish Academy of Agriculture and Forestry; African Forest Research Network ; Food and Agriculture Organisation of the United Nations. Available online at: https://afforum.org/sites/default/files/English_29.pdf. Report No.: Main report.
41. Ouédraogo O, Bondé L, Boussim JI, and Linstädter A. Caught in a human disturbance trap: Responses of tropical savanna trees to increasing land-use pressure. For Ecol Manage. (2015) 354:68–76. Available online at: https://linkinghub.elsevier.com/retrieve/pii/S037811271500362X.
42. Zoungrana A, Cissé M, Traoré M, De Cannière C, Bationo BA, Visser M, et al. Influence of agroforestry systems on earthworm diversity and soil properties in a Sudano-Sahelian landscape. Geoderma Regional. (2024) 37:e00786. Available online at: https://linkinghub.elsevier.com/retrieve/pii/S2352009424000336.
43. Thiombiano A, Glele Kakaï R, Bayen P, Boussim IJ, and Mahamane A. Méthodes et dispositifs D’inventaires forestiers en afrique de L’ouest: état des lieux et propositions pour une harmonisation. Annales Des Sci Agronomiques. (2016) 20:15–31. (spécial Projet Undesert-UE).
44. Sandhage-Hofmann A, Angombe S, Kindermann L, Linstädter A, and Mörchen R. Conservation with elephants and agricultural intensification: effects on lignin and n-alkanes in soils of sub-Saharan Africa. Geoderma. (2022) 425:116009. Available online at: https://linkinghub.elsevier.com/retrieve/pii/S0016706122003160.
45. Poorter L, van der Sande MT, Thompson J, Arets EJMM, Alarcón A, Álvarez-Sánchez J, et al. Diversity enhances carbon storage in tropical forests. Global Ecol Biogeography. (2015) 24:1314–28. doi: 10.1111/geb.12364
46. Bougma P taoré C, Bondé L, Yaro VSO, Gebremichael AW, and Ouédraogo O. Assessing carbon emissions from biomass burning in croplands in Burkina Faso, west africa. Fire. (2023) 6:402. Available online at: https://www.mdpi.com/2571-6255/6/10/402.
47. Yaro VSO, Bondé L, Bougma P taoré C, Sedgo I, Guuroh RT, Gebremichael AW, et al. Greenhouse gas emission from prescribed fires is influenced by vegetation types in West African Savannas. Sci Rep. (2024) 14:23754. Available online at: https://www.nature.com/articles/s41598-024-73753-6., PMID: 39390052
48. Weil RR, Stine MA, Gruver JB, Samson-Liebig SE, and Islam KR. Estimating active carbon for soil quality assessment: A simplified method for laboratory and field use. Am J Altern Agric. (2003) 18:3–17. doi: 10.1079/AJAA2003003
49. Haney RL, Brinton WH, and Evans E. Estimating soil carbon, nitrogen, and phosphorus mineralization from short-term carbon dioxide respiration. Commun Soil Sci Plant Anal. (2008) 39:2706–20. doi: 10.1080/00103620802358862
50. FAO. Standard operating procedure for soil respiration rate (2023). GLOSOLAN. Available online at: https://openknowledge.fao.org/server/api/core/bitstreams/e9f3525e-d101-4fee-9330-ba166eafa90d/content.
51. Anderson JPE. Soil respiration. In: Methods of soil analysis: part 2, chemical and microbiological properties. Madison, USA: American Society of Agronomy; Soil Science Society of America (1982). p. 831–71. Available online at: https://www.openagrar.de/receive/timport_mods_00010894 (Accessed October 7, 2025).
52. FAO. Standard operating procedure for soil organic carbon. In: Walkley-Black method: titration and colorimetric method, vol. 27. Rome, Italy: Global Soil Laboratory Network GLOSOLAN (2019). Available online at: https://openknowledge.fao.org/server/api/core/bitstreams/e498d73e-1711-4d18-9183-aa8476387e2c/content (Accessed October 7, 2025).
53. Mao X, Sun T, Liu X, Zhou J, Ma Q, Wu L, et al. Disentangle the drivers of soil organic carbon mineralization and their temperature sensitivity in both topsoil and subsoil: Implication of thermal stability and chemical composition. Ecol Indic. (2024) 158:111399. Available online at: https://linkinghub.elsevier.com/retrieve/pii/S1470160X23015418.
54. R Core Team. A Language and Environment for Statistical Computing (2024). Vienna, Austria: R Foundation for Statistical Computing. Available online at: https://www.R-project.org/ (Accessed July 7, 2025).
55. Crawley MJ. The R book (2013). Chichester, West Sussex, UK: Wiley. Available online at: http://www.bio.ic.ac.uk/research/mjcraw/therbook/index.htm.
56. Oberpriller J, De Souza Leite M, and Pichler M. Fixed or random? On the reliability of mixed-effects models for a small number of levels in grouping variables. Ecol Evol. (2022) 12:e9062. doi: 10.1002/ece3.9062, PMID: 35898418
57. Nakagawa S and Schielzeth H. A general and simple method for obtaining R2 from generalized linear mixed-effects models. Methods Ecol Evol. (2013) 4:133–42. doi: 10.1111/j.2041-210x.2012.00261.x
58. Karlson M and Ostwald M. Remote sensing of vegetation in the Sudano-Sahelian zone: A literature review from 1975 to 2014. J Arid Environments. (2016) 124:257–69. Available online at: https://linkinghub.elsevier.com/retrieve/pii/S014019631530046X.
59. Savadogo S, Nacoulma BMI, Lykke AM, Balima LH, and Thiombiano A. Local knowledge on population structure and conservation of Lannea species in Burkina Faso (West Africa). Trees Forests People. (2025) 19:100781. Available online at: https://linkinghub.elsevier.com/retrieve/pii/S2666719325000093.
60. Woodings FS and Margenot AJ. Revisiting the permanganate oxidizable carbon (POXC) assay assumptions: POXC is lignin sensitive. Agric Env Lett. (2023) 8:e20108. doi: 10.1002/ael2.20108
61. Hou J, Dijkstra FA, Zhang X, Wang C, Lü X, Wang P, et al. Aridity thresholds of soil microbial metabolic indices along a 3, 200 km transect across arid and semi-arid regions in Northern China. PeerJ. (2019) 7:e6712. Available online at: https://peerj.com/articles/6712., PMID: 30993045
62. Cao Z, Jia Y, Cai Y, Wang X, Hu H, Zhang J, et al. Past aridity’s effect on carbon mineralization potentials in grassland soils. Biogeosciences. (2019) 16:3605–19. Available online at: https://bg.copernicus.org/articles/16/3605/2019/.
63. Yin J and Porporato A. Global self-similar scaling of terrestrial carbon with aridity. Geophysical Res Lett. (2023) 50:e2022GL101040. doi: 10.1029/2022GL101040
64. Lindsey PA, Anderson SH, Dickman A, Gandiwa P, Harper S, Morakinyo AB, et al. Shepherding sub-saharan africa’s wildlife through peak anthropogenic pressure toward a green anthropocene. Annu Rev Environ Resour. (2022) 47:91–121. doi: 10.1146/annurev-environ-120920-125536
65. Belem M, Bayala J, and Kalinganire A. Defining the poor by the rural communities of Burkina Faso: implications for the development of sustainable parkland management. Agroforest Syst. (2011) 83:287–302. doi: 10.1007/s10457-011-9390-7
66. Lohbeck M, Albers P, Boels LE, Bongers F, Morel S, Sinclair F, et al. Drivers of farmer-managed natural regeneration in the Sahel. Lessons for restoration. Sci Rep. (2020) 10:15038. Available online at: https://www.nature.com/articles/s41598-020-70746-z., PMID: 32929116
67. Theriault V, Smale M, and Haider H. Economic incentives to use fertilizer on maize under differing agro-ecological conditions in Burkina Faso. Food Sec. (2018) 10:1263–77. doi: 10.1007/s12571-018-0842-z, PMID: 32968463
68. Ayantunde AA, Oluwatosin BO, Yameogo V, and Van Wijk M. Perceived benefits, constraints and determinants of sustainable intensification of mixed crop and livestock systems in the Sahelian zone of Burkina Faso. Int J Agric Sustainability. (2020) 18:84–98. doi: 10.1080/14735903.2019.1698494
69. Bationo A, Kihara J, Vanlauwe B, Waswa B, and Kimetu J. Soil organic carbon dynamics, functions and management in West African agro-ecosystems. Agric Syst. (2007) 94:13–25. Available online at: https://linkinghub.elsevier.com/retrieve/pii/S0308521X06001065.
70. Wade J, Maltais-Landry G, Lucas DE, Bongiorno G, Bowles TM, Calderón FJ, et al. Assessing the sensitivity and repeatability of permanganate oxidizable carbon as a soil health metric: An interlab comparison across soils. Geoderma. (2020) 366:114235. Available online at: https://linkinghub.elsevier.com/retrieve/pii/S0016706119330095.
71. Culman SW, Snapp SS, Freeman MA, Schipanski ME, Beniston J, Lal R, et al. Permanganate oxidizable carbon reflects a processed soil fraction that is sensitive to management. Soil Sci Soc America J. (2012) 76:494–504. doi: 10.2136/sssaj2011.0286
72. Gonnety JT, Assémien EFL, Guéi AM, N’Dri AA, Djina Y, Koné AW, et al. Effect of land-use types on soil enzymatic activities and chemical properties in semi-deciduous forest areas of Central-West Côte d’Ivoire. Biotechnol Agron Soc Environ. (2012) 16:478–85. Available online at: https://popups.uliege.b/1780-450/index.php?id=17004&file=1&pid=9148.
73. Adekiya AO, Aremu C, Agbede TM, Olayanju A, Ejue WS, Adegbite KA, et al. Soil productivity improvement under different fallow types on Alfisol of a derived savanna ecology of Nigeria. Heliyon. (2021) 7:e06759. Available online at: https://linkinghub.elsevier.com/retrieve/pii/S2405844021008628., PMID: 33898846
74. Condron L, Stark C, O’Callaghan M, Clinton P, and Huang Z. The role of microbial communities in the formation and decomposition of soil organic matter. In: Soil Microbiology and Sustainable Crop Production. Springer, Dordrecht (2010). p. 81–118. doi: 10.1007/978-90-481-9479-7_4
75. McCourty MA, Gyawali AJ, and Stewart RD. Of macropores and tillage: influence of biomass incorporation on cover crop decomposition and soil respiration. Soil Use Manage. (2018) 34:101–10. doi: 10.1111/sum.12403
76. Rao KS and Meena A. Assessment of soil microbial and enzyme activity in the rhizosphere zone under different land use/cover of a semiarid region, India. Ecol Process. (2021) 10:16. doi: 10.1186/s13717-021-00288-3
77. Ofiti NOE, Zosso CU, Soong JL, Solly EF, Torn MS, Wiesenberg GLB, et al. Warming promotes loss of subsoil carbon through accelerated degradation of plant-derived organic matter. Soil Biol Biochem. (2021) 156:108185. Available online at: https://linkinghub.elsevier.com/retrieve/pii/S0038071721000572.
78. Wu H, Cui H, Fu C, Li R, Qi F, Liu Z, et al. Unveiling the crucial role of soil microorganisms in carbon cycling: A review. Sci Total Environ. (2024) 909:168627. Available online at: https://linkinghub.elsevier.com/retrieve/pii/S0048969723072558., PMID: 37977383
79. Margenot AJ, Wade J, and Woodings FS. The misuse of permanganate as a quantitative measure of soil organic carbon. Agric Env Lett. (2024) 9:e20124. doi: 10.1002/ael2.20124
80. Liptzin D, Norris CE, Cappellazzi SB, Bean GM, Cope M, Greub KLH, et al. An evaluation of carbon indicators of soil health in long-term agricultural experiments. Soil Biol Biochem. (2022) 172:108708. Available online at: https://linkinghub.elsevier.com/retrieve/pii/S0038071722001651.
81. Martin T and Sprunger CD. Sensitive measures of soil health reveal carbon stability across a management intensity and plant biodiversity gradient. Front Soil Sci. (2022) 2:917885/full. doi: 10.3389/fsoil.2022.917885/full
82. Mikutta R, Turner S, Schippers A, Gentsch N, Meyer-Stüve S, Condron LM, et al. Microbial and abiotic controls on mineral-associated organic matter in soil profiles along an ecosystem gradient. Sci Rep. (2019) 9:10294. Available online at: https://www.nature.com/articles/s41598-019-46501-4., PMID: 31312015
83. Tamura M and Suseela V. Warming and labile substrate addition alter enzyme activities and composition of soil organic carbon. Front For Glob Change. (2021) 4:691302/full. doi: 10.3389/ffgc.2021.691302/full
84. Lehmann J, Bossio DA, Kögel-Knabner I, and Rillig MC. The concept and future prospects of soil health. Nat Rev Earth Environ. (2020) 1:544–53. Available online at: https://www.nature.com/articles/s43017-020-0080-8., PMID: 33015639
Keywords: carbon dynamics, soil labile carbon, pedo-climatic conditions, dryland, microbial respiration, mineralization rates
Citation: Nadjire G, Bandaogo AA, Gebremichael AW, Ouédraogo O and Boussim JI (2025) Can permanganate oxidizable carbon, microbial respiration, and carbon mineralization rate reflect carbon dynamics across land use and pedo-climate gradients in West African semi-arid zones? Front. Soil Sci. 5:1671112. doi: 10.3389/fsoil.2025.1671112
Received: 22 July 2025; Accepted: 25 November 2025; Revised: 13 November 2025;
Published: 11 December 2025; Corrected: 15 December 2025.
Edited by:
Steffen A. Schweizer, Technical University of Munich, GermanyReviewed by:
Qing-Fang Bi, Max Planck Institute for Biogeochemistry, GermanyAlexis Thoumazeau, Centre de Coopération Internationale en Recherche Agronomique pour le Développement (CIRAD), France
Copyright © 2025 Nadjire, Bandaogo, Gebremichael, Ouédraogo and Boussim. This is an open-access article distributed under the terms of the Creative Commons Attribution License (CC BY). The use, distribution or reproduction in other forums is permitted, provided the original author(s) and the copyright owner(s) are credited and that the original publication in this journal is cited, in accordance with accepted academic practice. No use, distribution or reproduction is permitted which does not comply with these terms.
*Correspondence: Gannouka Nadjire, Z2Fubm91a2FuYWRqaXJlQGdtYWlsLmNvbQ==
†ORCID: Amanuel W. Gebremichael, orcid.org/0000-0001-6003-1974
Oumarou Ouédraogo, orcid.org/0000-0002-0440-2766