 Haosheng Lin
- Institute for Astronomy, University of Hawaii, Pukalani, HI, USA
Tremendous progress has been made in the field of observational coronal magnetometry in the first decade of the Twenty-First century. With the successful construction of the Coronal Multichannel Magnetometer (CoMP) instrument, observations of the linear polarization of the coronal emission lines (CELs), which carry information about the azimuthal direction of the coronal magnetic fields, are now routinely available. However, reliable and regular measurements of the circular polarization signals of the CELs remain illusive. The CEL circular polarization signals allow us to infer the magnetic field strength in the corona, and is critically important for our understanding of the solar corona. Current telescopes and instrument can only measure the coronal magnetic field strength over a small field of view. Furthermore, the observations require very long integration time that preclude the study of dynamic events even when only a small field of view is required. This paper describes a new instrument concept that employs large-scale multiplexing technology to enhance the efficiency of current coronal spectropolarimeter by more than two orders of magnitude. This will allow for the instrument to increase the integration time at each spatial location by the same factor, while also achieving a large field of view coverage. We will present the conceptual design of a 100-slit coronal spectropolarimeter that can observe six CELs simultaneously. Instruments based on this concept will allow us to study the evolution of the coronal magnetic field even with coronagraphs with modest aperture.
1. Introduction
In the low density, high temperature and highly ionized coronal plasma, magnetic fields suppress cross-field-line motion of charged particles, thereby creating an atmosphere with highly anisotropic local thermodynamic properties, thus shaping the appearance of the corona to closely resemble that of the magnetic field lines. However, large scale flows of charged particles (electric currents) in turn alter the large scale structure of the magnetic fields. Therefore, detailed observations of the behavior of magnetic fields and plasmas during major eruptions, as well as during quiet periods, are the crucial data needed for understanding the interaction between the fields and the coronal plasmas, and the physics of solar eruptions. While it has been more than a century since the ground-breaking work of Hale (1908) that revealed the magnetic nature of the sun, direct measurement of magnetic fields in the outer layer of the solar atmosphere remains difficult. Much progress has been made in the past two decades in the field of coronal polarimetry to directly measure the polarization of coronal emission lines (CELs) that responds directly to coronal magnetic fields (Casini and Judge, 1999; Lin and Casini, 2000; Lin et al., 2000, 2004). The Coronal Multichannel Polarimeter (CoMP), in particular, can now provide direct measurements of the FeXIII line linear polarization on a daily basis (Tomczyk et al., 2008). Nevertheless, direct inference of the coronal magnetic fields from these measurements remains a challenging task due to the low optical density of the coronal atmosphere.
Recent advancements in scalar and vector tomography based on space EUV intensity and ground intensity and linear polarization data of CELs have further allowed us to make direct inference of the 3D magnetic and thermodynamic structure of the corona from these observations (Kramar et al., 2016). As shown by Kramar et al. (2016), coronal magnetic fields derived from tomographic reconstruction of EUV and white light data for Carrington Rotation 2112, revealed several possible deficiencies in MHD simulated models of the same period, and demonstrated the importance of direct 'observations' for research of coronal magnetic fields.
While we have finally attained the capability to derive the 3D magnetic and thermodynamic structures of the corona from direct observations, their accuracy and applicability are still subject to the limitations of existing instrumentation. For examples, CEL polarimetry at present is only possible from ground-based instrumentation, and with a single sight line from Earth. True tomographic observations that sample the corona from multiple lines of sight (LOS) simultaneously is currently not possible. Therefore, we have relied on the rotation of the Sun to provide the multiple LOS measurements for use with tomographic inversion tools. Accordingly the results from these tomographic inversions are the static component of the coronal fields during the period of the observations. To resolve the dynamic time scales of solar eruptions, true tomography with simultaneous observations from multiple sight lines is needed. Next, tomography with only linear polarization input is insensitive to certain magnetic field configurations (Kramar et al., 2013). However, the amplitudes of the circular polarization signals of the CELs are two orders of magnitude lower than that of the linear polarization. Therefore, the sensitivity of our synoptic coronal polarimeters needs to be greatly improved for tomographic inversion to provide coverage of the full range of coronal magnetic field configurations. Finally, Figure 1 shows the solar corona observed in six different CELs with excitation temperatures ranging from 0.5 to 2.2 MK (Habbal et al., 2011). The dramatic difference in the appearance of the corona between ions with low and high ionization temperatures is a manifestation of the (spatial) non-uniformity of the coronal temperature. Therefore, polarization measurements at only one CEL sample only coronal plasma with temperature within a narrow range around the ionization temperature of the spectral line. In order to “see” the entire corona, observations at multiple spectral lines spanning a broad range of the coronal temperature is needed.
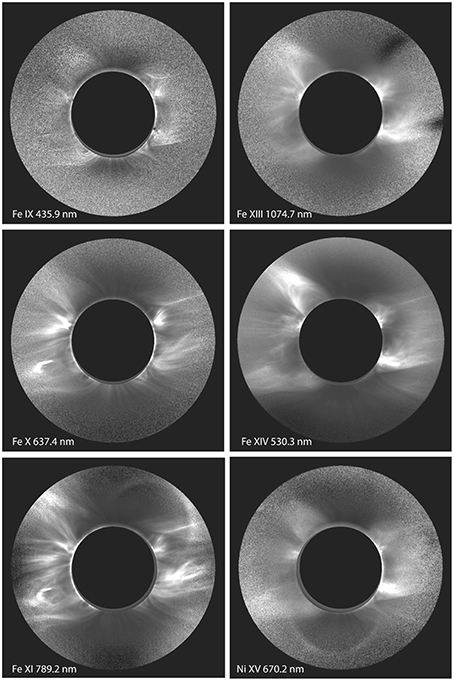
Figure 1. The solar corona from the solar limb to about 2.5 R⊙ from disk center observed during the 2010 South Pacific total eclipse (Habbal et al., 2011) in six coronal emission lines with temperature ranging from 0.8 to 2.0 MK. Images are courtesy of S. Habbal.
Observational coronal magnetometry is a new field that will eventually provide solar physicists the magnetic and thermodynamic structure of the solar corona needed for every aspect of coronal research. Even with its current limitations, this new capability to directly derive the 3D corona magnetic field structure from measurements of signals originating from the corona, as opposed to extrapolations or MHD simulations that rely on information of magnetic fields at the lower boundary layers, is an important new capability that will provide new insight into the physical processes that define the corona. Therefore, it is critically important that we continue to develop and improve our observing capability to provide data with comprehensive coverage in spatial, temporal, polarization, and temperature domains to allow tomographic inversion techniques to yield a complete picture of the corona.
In this paper, we present the conceptual design of a new coronal magnetometer, called the massively-multiplexed Coronal Spectropolarimetric Magnetometer (mxCSM), for the measurement of the intensities, velocities, and polarizations of the six CELs shown in Figure 1 simultaneously. This instrument will provide CEL polarization data with sufficient spatial, spectral, and temporal resolution, and spatial, temperature, and velocity field coverage to enable high precision vector tomographic inversion of the coronal magnetic fields. mxCSM adapts the large-scale multiplexing strategy demonstrated by the massively-multiplexed SPECtroheliograph (mxSPEC, Lin, 2014) proof-of-concept instrument. Its optical system consists of a new catadioptric off-axis Gregorian coronagraph and two100-slit, 3-line spectrographs. It uses six 4096 × 4096 format CCDs and/or IR cameras to observe the six spectral lines simultaneously. With this new design, mxCSM can deliver close to three orders of magnitude improvement in capability over current generation of coronal magnetometers without the use of large aperture telescopes. This conceptual design that will be described in the following sections serves to showcase the potential of the large-scale multiplexing strategy for instrumentations for coronal magnetism research in particular, and for future solar spectroscopic instrumentations in general. More importantly, due to its compact design, mxCSM is ideally suited for deployment in space. We envision that future missions with two or more mxCSMs deployed in circumsolar orbits similar to the Solar Terrestrial Relations Observatory (STEREO) mission will provide multiple LOS measurements to enable true tomographic inversion of the coronal magnetic and thermodynamic structures.
2. The Development of Modern Multiple-Slit Spectrographs
2.1. FIRS: The Facility IR Spectropolarimeter
Multi-slit spectroscopy is a simple, yet very effective method of multiplexing spectra from multiple slices of a 2D spatial field onto a 2D array detector. It was first conceived 40 years ago (Martin et al., 1974; Livingston et al., 1980) but had not been widely adapted in the digital age until it was revived by Srivastava and Mathew (1999). Lin (2003), unaware of the historical developments and the new effort in India, independently conceived the design for a multi-slit, multi-wavelength IR spectropolarimeter in late 1990s. Its design goals were to take advantage the large multiplexing capability of modern large-format, high-performance visible and IR focal plane arrays (FPAs) and new high-efficiency narrow passband Dense Wavelength Division Multiplexing (DWDM) filter technology developed for telecommunication applications to improve the imaging capability and operational efficiency of grating-based spectropolarimeters. This design was first realized through the development and construction of the Facility IR Spectropolarimeter (FIRS, Jaeggli et al., 2010) for the Dunn Solar Telescope (DST) of the National Solar Observatory (NSO) in Sunspot, New Mexico. In addition to realizing the potential of the multi-slit design, FIRS also advanced an achromatic reflecting spectrograph design that uses coarsely-ruled echelle grating to allow for observations of multiple spectral lines simultaneously on the same spectrograph to further increase the operational efficiency of the instrument. FIRS supports observations with a maximum of 4 slits. The primary constraints on the number of slits for FIRS are (1) the relatively modest size of the 1024 × 1024 format IR camera available, (2) the requirements for high spectral resolution (with a spectral sampling size Δλ≈λ∕300, 000), and (3) substantial Doppler velocity field coverage (e.g., ≥200 kms). In order to cover a spectral window of approximately ±120 km/s around the spectral lines, 256 pixels per slit were dedicated to record the spectra at each spatial sampling point. Nevertheless, even with a relatively small number of slits, it takes only 190 scan steps to observe a 150″ × 75″ field with 0.3″ spatial sampling size, a factor of 4 faster than a single slit instrument.
2.2. mxSPEC: The Massively Multiplex Spectroheliograph Concept
For science that requires only low or medium spectral resolution, a large field of view coverage with moderate spatial resolution, multi-slit spectrograph can be reconfigured with low dispersion gratings to accommodate a large number of slits without the reduction of the spectral window (and Doppler velocity field) coverage, thereby greatly reducing the number of scan steps needed to scan the full 2D field. This enables a scanning grating spectrograph to perform 3D imaging spectroscopy with very high temporal resolution. The proof-of-concept instrument, mxSPEC, was assembled at the full-disk port of the DST in 2014 using DST inventory optics, a He I 1083 nm DWDM bandpass isolation filter (BIF) with 1.4 nm bandpass, and a 10 frame per second (fps) Raytheon Virgo 2K 2048 × 2048 IR camera. In this setup, the DST aperture was reduced to 135 mm, and mxSPEC observed the full solar disk with 1″ pixel−1 spatial sampling. mxSPEC was equipped with a photolithographically etched 49-slit mask. The slits are separated by 750 μm distance, with a slit width of 12.5 μm. The Sun illuminates 34 to 35 of the 49 slits at any given time, while the IR camera sees 41 of the 49 slits. Thus, only 60 scan steps, or less than 8 seconds (including processing overhead) are required to obtain a 2460 × 2048 × 50 (x, y, λ) hyper-spectral data cube. The spectrograph yields a 250 mÅ /pixel spectral sampling size (λ∕Δλ = 40, 000), and a ±225 km∕s Doppler velocity coverage centered on the nearby Si ı 1072.7 nm line. Figure 2 shows a sample multi-slit full-Sun spectral image from mxSPEC, detailed spectra around a sunspot near the east limb and a full-disk He I 1083 nm line core image constructed from a full disk scan. Image sequences of the whole sun in He I 1083 nm line showing many aspects of chromosphere dynamics are available at http://www.ifa.hawaii.edu/users/lin/default/mxSPEC.html.
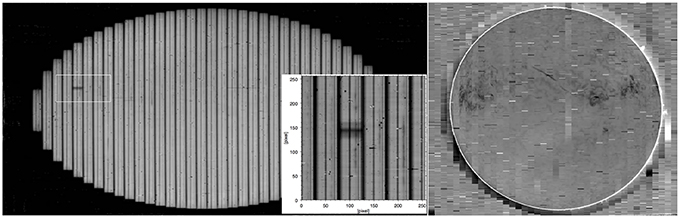
Figure 2. Left: 34-slit spectra of the full Sun obtained with the mxSPEC proof-of-concept instrument. Each vertical slice in the image is a horizontally dispersed spectrum. The 2048 × 2048 image was rescaled to a 2408 × 1024 image to better display the slit spectra. Close-up of spectra of a sunspot in the rectangular box in the full-disk spectral image are shown in the insert. Right: He I 1083 nm line core image constructed from a full-disk scan. The black and white short horizontal lines are data reduction artifacts due to defective pixels.
3. The Massively-Multiplex Coronal Spectropolarimetric Magnetometer
In order to observe six spectral lines spanning over two octaves in wavelength simultaneously through a single telescope, an optical system that can project an achromatic image of the sun at the full-disk occulter, as well as at the entrance slits of the spectrographs is needed. Furthermore, the spectrograph also needs to be achromatic to support multi-wavelength observations. We have designed a new wide-field catadioptric coronagraph based on an off-axis Gregorian telescope, and a 100-slit refractive Czerny-Turner spectrograph that can observe three spectral lines simultaneously. The system is equipped with two spectrographs to support simultaneous observations of six spectral lines. The following sections describe the designs of the coronagraph and the spectrographs.
3.1. The Catadioptric Off-Axis Gregorian Coronagraph
3.1.1. The Imaging System of mxCSM Coronagraph
Classical Lyot coronagraphs employ low-scatter, super polished singlet objective lens to minimize the scattered light at the prime focus, and a prime focus occulter to prevent the disk light from traveling further downstream. However, due to the dispersion of the index of reflection, the size and location the solar image formed by the objective lens vary as functions of wavelength. It is therefore difficult to observe more than one spectral line at the same time with the Lyot coronagraphs. The catadioptric optical system of mxCSM overcomes this limitation of the classical Lyot coronagraph. Figures 3–6 shows the ZEMAX layouts of the optical system of mxCSM projected in the Y-Z, X-Y, Z-X plane, and an isometric 3D shaded model, respectively. This optical design is based on a CCD camera with 4096 × 4096 format and 9 μm pixels. The catadioptric off-axis Gregorian coronagraph consists of an aspheric aperture corrector (AC, aperture Φ = 300 mm) followed by an off-axis parabolic primary mirror (M1, Φ = 300 mm, Focal Length FL = 800 mm, Off-Axis Distance OAD = 300 mm) and a concave off-axis elliptical secondary mirror (M2, Φ = 120 mm, FL = 244.6 mm, OAD = 160 mm, conic C = −0.158). A full-disk occulter is placed at the M1 focus to block disk light. The effective focal length at the Gregorian focus is 1850 mm. An entrance aperture stop (AS) placed between AC and M1, and a Lyot stop (LS) placed on the image of AS formed by M2 limit the effective aperture of the telescope. The location of AS is chosen such that the Lyot stop can be located at an accessible location outside of the region with overlapping beams near M2. The diameter of AS is oversized to 275 mm. Edge diffractions of AS will be blocked by the Lyot stop, which also limits the effective telescope aperture to 250 mm. This design achieves better than 1″ spatial resolution within a 0.375 degree field (1.5 R⊙) from Fe XIV 530 nmto Si X 1430 nm, as demonstrated by the spot diagram in Figure 7.
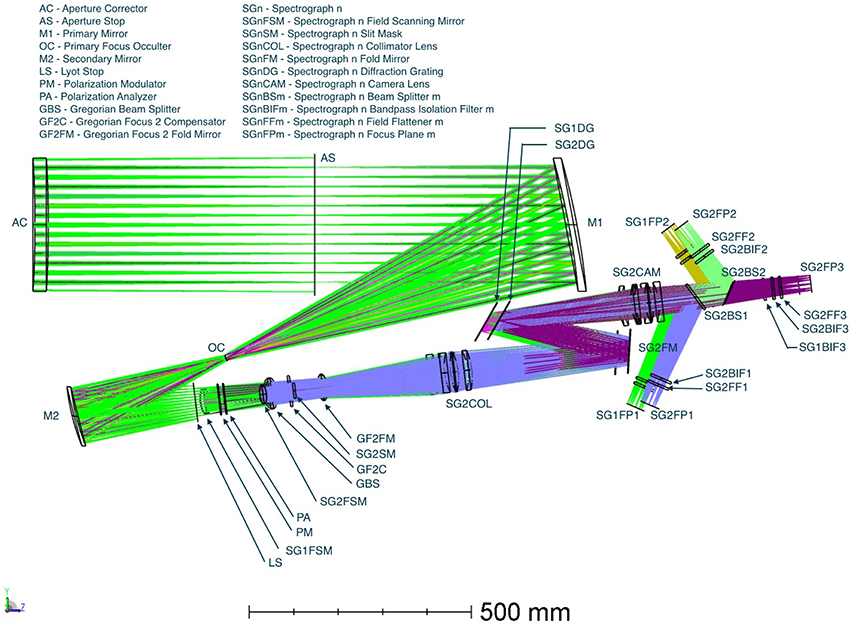
Figure 3. ZEMAX side view of the mxCSM optical system. The effective aperture of the telescope is defined by Lyot Stop (downstream from M2).
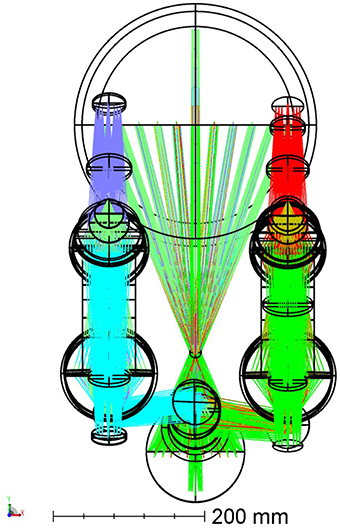
Figure 4. ZEMAX front view of mxCSM.
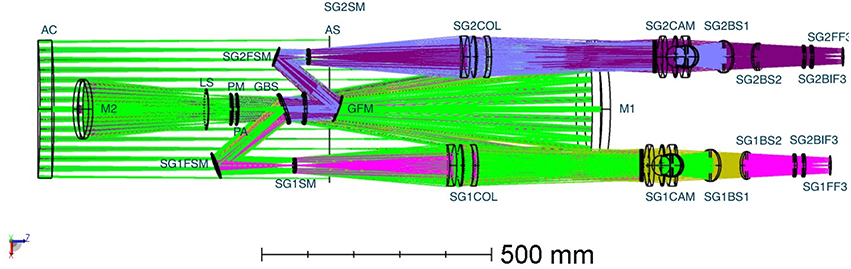
Figure 5. ZEMAX Top view of mxCSM.
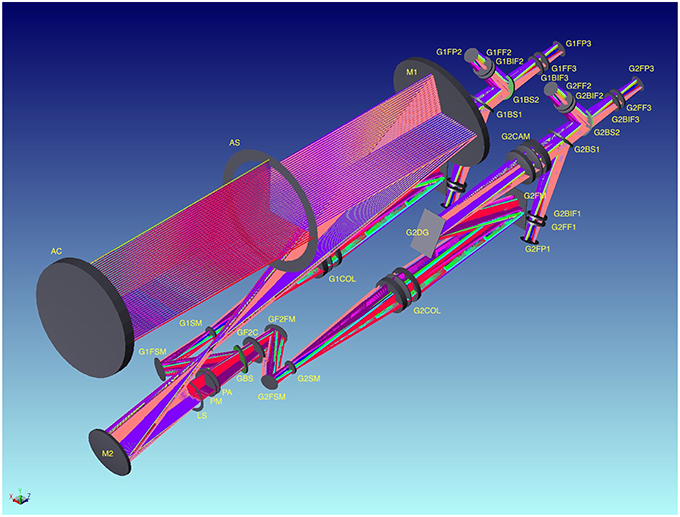
Figure 6. ZEMAX Isometric view of mxCSM.
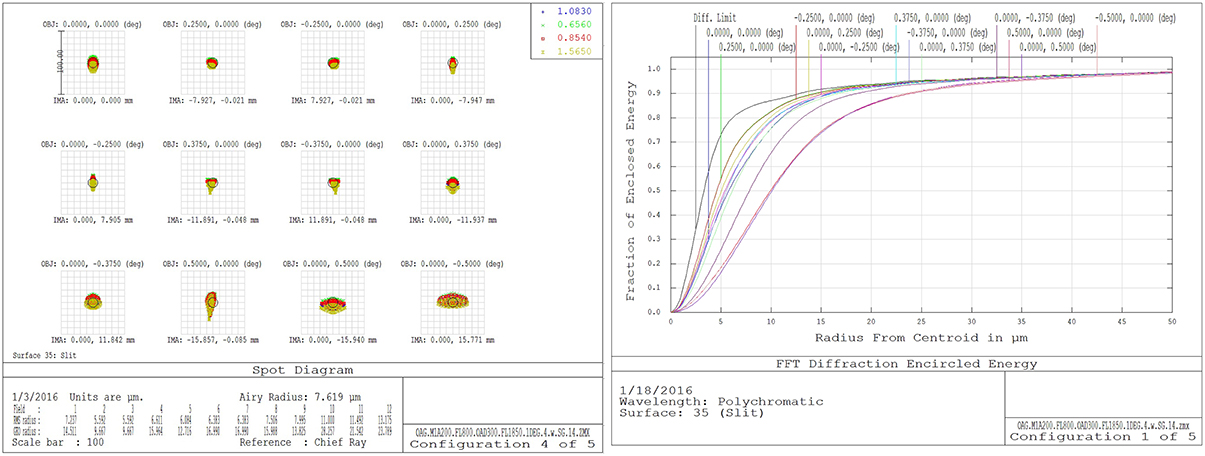
Figure 7. Left: Spot diagram of the catadioptric off-axis Gregorian coronagraph at its Gregorian focus. Right: Encircled energy.
To support simultaneous observations of six spectral lines, a Gregorian beam splitter (GBS) splits the beam coming down from M2 into two arms. Light with wavelengths shorter than 750 nm is reflected again with the spectrograph 1 fold and scan mirror (SG1FSM) to feed the first spectrograph SG1. The transmitted light is reflected by a Gregorian fold mirror (GFM) and then SG2FSM to feed the second spectrograph. SG1FSM and SG2FSM also serve as the field scanning mirrors of the spectrographs.
The optical system of mxCSM is designed for use with CCDs with 9 μm pixels. With an effective focal length of 1850 mm at the Gregorian foci, and a 1:1 magnification between the entrance and exit slit focal planes, the spatial sampling size is 1″ per pixel. The slit masks, SG1SM and SG2SM of the spectrographs have 100 parallel slits with width of 9 μm, separated by a distance of 432 μm. It takes only 48 scan steps to complete the scanning of the 1.2 × 1 degree field of view (FOV).
For polarization measurements, a simple polarimeter consists of a rotating achromatic λ∕3 waveplate polarization modulator PM followed by a linear polarizer PA are shown between M2 and GBS for single-beam polarimetry. For dual beam polarimetry, the linear polarization analyzer PA can be replaced by Wollaston prisms placed near the focal planes of the spectrograph (§ 3.2).
3.1.2. Scattered Light Considerations
The most important aspect of a coronagraph design is the scattered light performance of the optical system. The primary source of instrumental scattered light of a classical Lyot coronagraph is the scattering of disk light off the dusts and imperfections on the surfaces and in the substrate of the objective lens. For ground-based observations, Elmore (2007) has found that the scattered light of the MK4 coronagraph located at Mauna Loa Solar Obserovatory is dominated by dust particle accumulation on the objective lens of the coronagraphs even immediately after cleaning the objective. As Mauna Loa is one of the best ground-based coronal sites, this finding strongly suggests that for ground-based coronal observations dust control is the most critical element for achieving low scattered light level, provided that the objective of the coronagraph is of sufficient quality. Indeed, a recent scattered light study performed for the COSMO Large Coronagraph project at HAO (Gallagher, 2015) showed that a super polished coronagraph singlet lens with a 0.7 nm root-mean-square (RMS) micro roughness polish over the spatial period from 3 to 0.4 mm produces a scattered light of approximately at a distance of 1.1 R⊙ from disk center and at the wavelength of of the Fe XIII 1075 nm coronal emission line. Whereas, the total scattered light produced by the 0.7 nm RMS objective plus contribution from dust accumulation on the objective surface equivalent to a cleanliness level (CL) of CL220 is approximately at 1.1 μm and 1.1 R⊙. Here I⊙ and R⊙ denote the intensity of the Sun at disk center, and the radius of the Sun, respectively.
For a catadioptric Gregorian telescope, the scattering off the surface of the primary mirror M1 is an additional source of instrumental scattered light. Given identical surface quality, a mirror produces approximately two times the scattered light than a lens Gallagher (2015). We estimated that for a catadioptric Gregorian coronagraph, the combined scattered light off the aperture corrector and the primary mirror with 0.4 nm RMS micro roughness on all three optical surface is equal to that of a classical Lyot coronagraph with 0.7 nm RMS surface quality on the two surfaces of the objective lens. Modern optical fabrication techniques can now produce mirrors with RMS micro roughness well below 0.5 nm. Therefore, while a catadioptric Gregorian coronagraph will need to be polished with a surface micro roughness specification that is almost two times more stringent than that for a lens coronagraph in order to achieve the same instrumental scattered light performance, the cost differential for the additional polishing (which should be a small fraction of the total cost required to build a functional system) is more than compensated by the multi-spectral-line observing capability that the catadioptric optical system enables, and the multitude of improvements in the operational efficiency that it will provide.
With properly controlled instrumental scattered light using super-polished surfaces, the primary source of the instrumental scattered light is the accumulation of dust particles on the optical surfaces upstream of the occulter at the primary focus of the system. Decades of operations of Lyot coronagraphs at the Evans Facility of the National Solar Observatory in Sunspot, New Mexico, Mauna Loa Solar Observatory on the Big Island of Hawaii, Mees Solar Observatory on Haleakala, and other coronal observatories around the world had demonstrated the effectiveness of lens cleaning techniques and the robustness of the super polished lens surfaces to withstand repeated cleaning without long-term degradation of the scattered light performance of the coronagraphs. On the other hand, while mirror coronagraphs like SOLARC (Kuhn et al., 2003) offer unparalleled wavelength coverage and simultaneous multi-line observations, our experience from operation of SOLARC was that cleaning of its primary mirror is difficult and inevitably scratches the mirror surface and degrades its scattered light performance over time. Therefore, it is important that the primary mirror surface of mxCSM be kept clean to minimize dust contamination. With a catadioptric optical system, the aperture corrector can serve as the window of an air-tight or semi-air-tight enclosure to enclose M1 to eliminate or minimize the need of periodic cleaning of the M1 surface. With comprehensive dust control measure, such as (slightly) clean air over-pressurized dome, the semi-air-tight M1 enclosure, and extended lens tube in front of AC, supplemented with cleaning of the external surface of AC when necessary, low total scattered light can be achieved on a regular basis.
3.2. Compact 3-Line Spectrographs
Spectroscopy and spectropolarimetry of CELs are particularly well suited for the mxSPEC concept. In the million-degree corona, the Doppler width of the CELs are of the order of λ∕10, 000, where λ is the wavelength of the spectral line. Therefore, a spectrograph with only moderate resolution that samples the spectra with about λ∕40, 000 sample size is sufficient. However, in order to observe multiple spectral lines over a large wavelength range simultaneously, an achromatic spectrograph is needed. mxCSM uses two identical (except for the grating angles) 3-line spectrographs for observation of a total of 6 spectral lines simultaneously. The spectrographs are folded refractive Czerny-Turner spectrographs based on a pair of air-spaced achromatic triplet lenses and a medium-resolution diffraction grating with 7.9 line/mm ruling blazed at 26.7 degree. The optical layout of the first spectrograph is shown again in Figure 8 without the rest of the optical system for clarity. The effective focal length of the air-spaced triplet lenses is 381 mm. The nominal spectrograph angle ϕ(≡α−β) is set to 20 degree Table 1 shows the spectrograph configuration parameters and performance characteristics of the six spectral lines shown in Figure 1. The collimator SG1COL forms an image of the pupil approximately 650 mm away from the collimator, where the diffraction grating SG1DG is located. The fold mirror SG1FM and the grating redirect the beam away from the direction of the entrance slit. Due to the coarse-ruling and the moderate blaze angle, most of the wavelengths in the visible and near-IR wavelengths are diffracted in approximately the same angular direction. This allows all the spectra to be formed by a single camera lens with minimal image quality degradation. The camera lens (SG1CAM) is placed one focal length away from the grating to produce a telecentric beam. Two dichroic beam splitters (SG1BS1 and SG1BS2) split the exit beams into three arms with different wavelength bands, allowing for observation of three spectral lines simultaneously. Three ultra-narrow bandpass isolation filters (BIFs) with bandwidth equal to λ∕1000 centered at the wavelength of the spectral lines are placed in the telecentric beams in the three arms, each followed by a field flattener optimized for each spectral line.
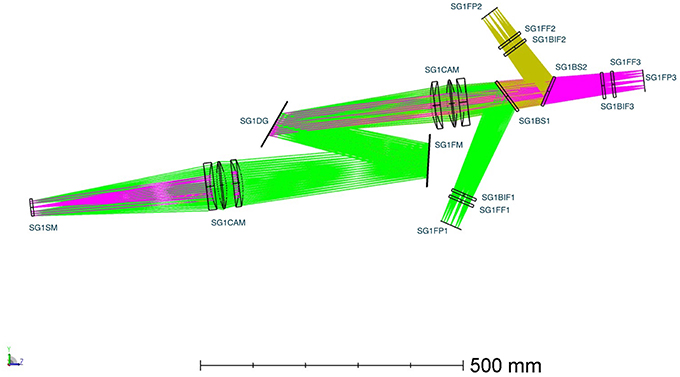
Figure 8. The optical layout of mxCSM spectrograph.
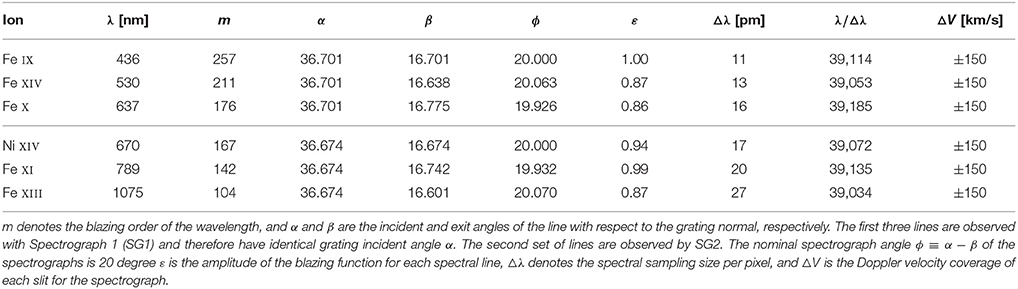
Table 1. Instrument characteristics of the mxCSM spectrographs.
The slit masks of mxCSM will be configured with 100 parallel slits with slit width of 9 μm and slit separation of 432 μm between neighboring slits. Therefore, it will take only 48 scan steps to cover a 1.2 × 1 degree FOV. Due to the anamorphic demagnification of the spectrographs, the images of the entrance slits are separated by 360 μm, or 40 pixels on the CCDs at the exit slit planes. With the 380 mm focal length, 20 degree spectrograph angle, and the 7.9 line/mm grating blazed at 26.7 degree, the 9 μm pixel of the CCD samples the spectra with a sample size of Δλ≈λ∕39, 000 for all wavelengths. The width of λ∕1000 of the 40-pixel spectral windows of each slit thus cover a Doppler velocity window of ± 150 km/s.
The ultra-narrow bandpass isolation filters will have a flat top transmission profile with a minimum 90% (−0.5 dB) transmission bandwidth of λ∕2000, and a maximum 0.1% (-30 dB) transmission bandwidth of λ∕1000 to eliminate crosstalk of spectra from neighboring slits and overlapping orders. The size of the BIFs will be approximately 50 × 50 mm.
3.3. Polarimetry Sensitivity Estimates
With the simple optical system, mxCSM will have very high photon throughput. The maximum number of optical surfaces (Spectrograph 2, Arm 3) is 35, excluding the diffraction grating and the bandpass isolation filters. Assuming a nominal 99.5% efficiency for each optical surface using high-performance anti-reflection coating, 70% efficiency for the diffraction grating, 90% efficiency for the BIFs, and 75% quantum efficiency for the detector, the overall system throughput of the system is about 40%. The expected photon flux in the continuum spectra near the Fe XIII 1075 nm line with a total scattered light (including sky, dust, and instrumental contribution) of , with different spatial and temporal binning is listed in Table 2. Using a circular polarization amplitude of 1 × 10⁻³ for a 10 G magnetic field, the estimated 3σ detection limits of the line-of-sight component of the coronal magnetic field B3σ of mxCSM for the Fe XIII 1075 nm line are 35 G, 12 G, and 4 G, respectively, with spatial resolution of 1″, 3″ and 10″ and temporal resolution of 2 h per map if the scattered light background is . This is sufficient to measure the coronal magnetic field in most active regions up to 1.4R⊙, based on the experience from the SOLARC coronagraph. In comparison, it would take a conventional single slit spectropolarimeter a minimum of 26.7 h of observation to obtain one full-polarization map of the 1.2 × 1.0 degree field.
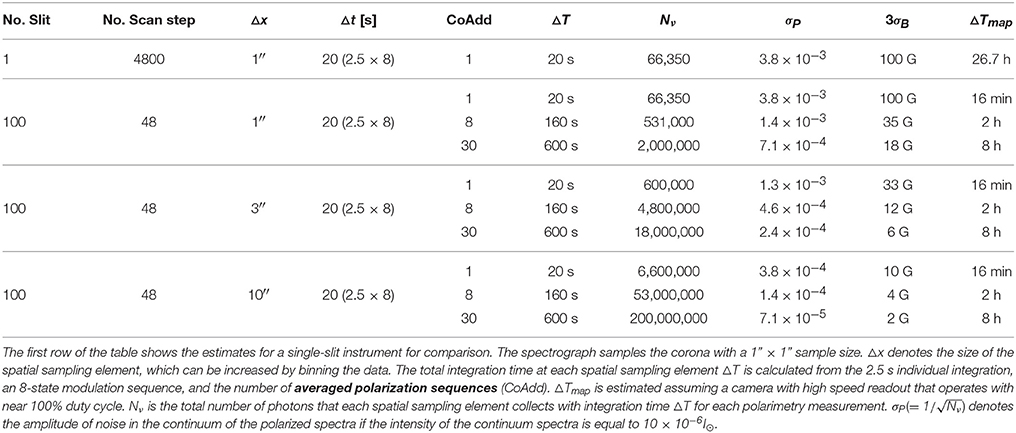
Table 2. Estimates of continuum photon flux Nν, normalized photon noise level σP, 3σ longitudinal magnetic field detection limit B3σ, and total time △Tmap required to scan a 1.2 × 1.0 degree FOV of mxCSM for the Fe XIII 1075 nm line polarimetric observations, assuming a 20% system efficiency, which includes the 50% transmission of the exit linear polarizer of the polarimeter, and a scattered light background for coronal observation.
The high polarization sensitivity of the hourly and daily averaged data will also allow us to measure the orientation of the coronal magnetic fields from the orientation of the linear polarization of the CEL at very large distance from the limb. It will also allow us to explore the possibility of measuring the line-of-sight magnetic field strength in quiet regions. These observations will provide the data necessary for tomographic inversion of the coronal magnetic fields.
4. Summaries and Discussions
We have presented a conceptual design for a new instrument, optimized for high-temporal resolution spectroscopic measurements of the intensity and polarization of multiple CELs over a very large field of view for research in coronal magnetism. Key technologies that enable this new instrument configuration are (1) large-format focal plane arrays, (2) high-efficiency ultra narrow bandpass isolation filters, and (3) new catadioptric wide-field coronagraph designs. Integration of these technologies enables the implementation of large-scale multiplexing technique to efficiently project the spectra of a very large number of slices of the image plane of the telescope onto multiple focal plane arrays to be recorded simultaneously. The large-scale multiplexing design greatly enhances the capability of the telescope with moderate apertures for observations that require a large field of view coverage. For comparison, the time required for the 25 cm aperture, 6-line, 100-slit coronal spectropolarmeter coronagraph presented in this paper to observe the 1 degree FOV is comparable to that of a 6-m coronagraph equipped with current single-slit, single-wavelength spectropolarimeter. But mxCSM can be constructed with only a fraction of the cost required for the construction of a 6-m class coronagraph.
The high system throughput of this design also makes it an ideal design for future space missions where size and weight of the instruments are severely limited. Finally, we note that although large-scale multiplexing strategy can greatly enhance the capabilities of a current generation of small aperture telescopes, it should also be implemented for future large ground-based telescope projects. For example, a 1-m class mcCSM would yield a magnetic field sensitivity of 10 G with a 3″ spatial sampling and 15 min temporal resolution. This will directly enable study of the evolution of active region coronal magnetic fields during solar flares and coronal mass ejections, and finally allow us to test theoretical models of solar eruptions.
Author Contributions
The author confirms being the sole contributor of this work and approved it for publication.
Funding
The hardware used for the demonstration of the mxSPEC proof-of-concept instrument were acquired with two NSF Major Research Instrument grants, NSF ATM#0421582, and NSF ATM#0923560.
Conflict of Interest Statement
The author declares that the research was conducted in the absence of any commercial or financial relationships that could be construed as a potential conflict of interest.
Acknowledgments
The author thanks Shadia Habbal for helpful comments and review of the paper, and for graciously providing the 2010 Eclipse data for inclusion in this paper. The author also thanks John W. Harvey and Sarah F. Martin for information on early multiple-slit spectroscopy works.
References
Casini, R., and Judge, P. G. (1999). Spectral lines for polarization measurements of the coronal magnetic field. II. Consistent treatment of the stokes vector for magnetic-dipole transitions. Astrophys. J. 522, 524–539. doi: 10.1086/307629
Elmore, D. (2007). TMk4 Scattered Light Analysis. High Altitude Observatory Coronal Solar Magnetism Observatory Technical Note 10.
Gallagher, D. (2015). COSMO Stray Light Analysis. High Altitude Observatory Coronal Solar Magnetism Observatory Document 16-COSMOLC-DE-7003.
Habbal, S. R., Druckmüller, M., Morgan, H., Ding, A., Johnson, J., Druckmüllerová, H., et al. (2011). Thermodynamics of the solar corona and evolution of the solar magnetic field as inferred from the total solar eclipse observations of 2010 july 11. Astrophys. J. 734, 120. doi: 10.1088/0004-637X/734/2/120
Hale, G. E. (1908). On the probable existence of a magnetic field in sun-spots. Astrophys. J. 28, 315. doi: 10.1086/141602
Jaeggli, S. A., Lin, H., Mickey, D. L., Kuhn, J. R., Hegwer, S. L., Rimmele, T. R., et al. (2010). FIRS: a new instrument for photospheric and chromospheric studies at the DST. Mem. Soc. Astronom. Ital. 81, 763.
Kramar, M., Inhester, B., Lin, H., and Davila, J. (2013). Vector tomography for the coronal magnetic field. II. Hanle effect measurements. Astrophys. J. 775, 25. doi: 10.1088/0004-637X/775/1/25
Kramar, M., Lin, H., and Tomczyk, S. (2016). Direct observation of coronal magnetic fields by vector tomography of the coronal emission line polarizations. Astrophys. J. Lett. 819:36. doi: 10.3847/2041-8205/819/2/L36
Kuhn, J. R., Coulter, R., Lin, H., and Mickey, D. L. (2003). “The SOLARC off-axis coronagraph,” in Innovative Telescopes and Instrumentation for Solar Astrophysics, Vol. 4853 of Proc. SPIE, eds S. L. Keil and S. V. Avakyan, 318–326. doi: 10.1117/12.460296
Lin, H. (2003). “ATST near-IR spectropolarimeter,” in Innovative Telescopes and Instrumentation for Solar Astrophysics, Vol. 4853 of Proc. SPIE, eds S. L. Keil and S. V. Avakyan, 215–222. doi: 10.1117/12.460374
Lin, H. (2014). “mxSPEC: a massively multiplexed full-disk spectroheliograph for solar physics research,” in Ground-Based and Airborne Instrumentation for Astronomy V, Vol. 9147 of Proc. SPIE, eds S. K. Ramsay, I. S. McLean and H. Takami (Montréal, QC), 914712.
Lin, H., and Casini, R. (2000). A classical theory of coronal emission line polarization. Astrophys. J. 542, 528–534. doi: 10.1086/309499
Lin, H., Kuhn, J. R., and Coulter, R. (2004). Coronal magnetic field measurements. Astrophys. J. Lett. 613, L177–L180. doi: 10.1086/425217
Lin, H., Penn, M. J., and Tomczyk, S. (2000). A new precise measurement of the coronal magnetic field strength. Astrophys. J. Lett. 541, L83–L86. doi: 10.1086/312900
Livingston, W., Harvey, J., Doe, L. A., Gillespie, B., and Ladd, G. (1980). The kitt-peak coronal velocity experiment. Bull. Astronom. Soc. Ind. 8, 43.
Martin, S. F., Ramsey, H. E., Carroll, G. A., and Martin, D. C. (1974). Multi-slit spectrograph and H alpha Doppler system. Solar Phys. 37, 343–350. doi: 10.1007/BF00152493
Srivastava, N., and Mathew, S. K. (1999). A digital imaging multi-slit spectrograph for measurement of line-of-Sight velocities on the sun. Solar Phys. 185, 61–68. doi: 10.1023/A:1005189319845
Keywords: corona, magnetic fields, spectropolarimetry, instrumentation
Citation: Lin H (2016) mxCSM: A 100-slit, 6-Wavelength Wide-Field Coronal Spectropolarimeter for the Study of the Dynamics and the Magnetic Fields of the Solar Corona. Front. Astron. Space Sci. 3:9. doi: 10.3389/fspas.2016.00009
Received: 12 February 2016; Accepted: 08 March 2016;
Published: 30 March 2016.
Edited by:
Sarah Gibson, National Center for Atmospheric Research, USAReviewed by:
Gordon James Duncan Petrie, National Solar Observatory, USAJonathan Wesley Cirtain, NASA, USA
Copyright © 2016 Lin. This is an open-access article distributed under the terms of the Creative Commons Attribution License (CC BY). The use, distribution or reproduction in other forums is permitted, provided the original author(s) or licensor are credited and that the original publication in this journal is cited, in accordance with accepted academic practice. No use, distribution or reproduction is permitted which does not comply with these terms.
*Correspondence: Haosheng Lin, bGluQGlmYS5oYXdhaWkuZWR1