 Isabel Márquez1*
 Josefa Masegosa1
 Omaira González-Martin2
 Lorena Hernández-Garcia3
 Mirjana Pović1,4Hagai Netzer5
 Sara Cazzoli1
 Ascensión del Olmo1
- 1Instituto de Astrofisica de Andalucia (CSIC), Granada, Spain
- 2Instituto de Radioastronomía y Astrofísica, Universidad Nacional Autónoma de México, Morelia, Mexico
- 3Istituto di Astrofisica e Planetologia Spaziali, Rome, Italy
- 4Ethiopian Space Science and Technology Institute and Entoto Observatory and Research Center, Addis Ababa, Ethiopia
- 5Raymond and Beverly Sackler Faculty of Exact Sciences, School of Physics and Astronomy and the Wise Observatory, Tel-Aviv University, Tel Aviv, Israel
Low-ionization nuclear emission-line regions (LINERs) are specially interesting objects since not only they represent the most numerous local Active Galactic Nuclei population, but they could be the link between normal and active galaxies as suggested by their low X-ray luminosities. The origin of LINER nuclei being still controversial, our works, through a multiwavelength approach, have contributed, firstly, to confirm that a large number of nuclear LINERs in the local universe are AGN powered. Secondly, from the study of X-ray spectral variability, we found that long term variations are very common, and they are mostly related to hard energies (2–10keV). These variations might be due to changes in the absorber and/or intrinsic variations of the source. Thirdly, Mid-infrared (MIR) imaging also indicates that LINERs are the low luminosity end of AGN toward lower luminosities, and MIR spectroscopy shows that the average spectrum of AGN-dominated LINERs with X-ray luminosities LX(2–10 keV) > 1041 erg/s is similar to the average mid-IR spectrum of AGN-dominated Seyfert 2s; for fainter LINERS, their spectral shape suggests that the dusty-torus may disappear. Fourth, the extended Hα emission of LINERs at HST resolution indicates that they follow remarkably well the Narrow Line Region morphology and the luminosity-size relation obtained for Seyfert and QSOs; HST Hα morphology may suggest the presence of outflows, which could contribute to the line broadening, with the resulting consequences on the percentage of LINERs where the Broad Line Region is detected. This issue is being revisited by our group with a high spectral resolution set of optical data for nearby type-1 LINERs. Finally, concerning systematic studies on the role of star formation in LINERs, which are scarce, our contribution deals with the study of a sample of the most luminous, highest star formation rate LINERs in the local Universe (at z from 0.04 to 0.11), together with its comparison with both lower-redshift LINERs and luminous LINERs previously detected at z ~ 0.3. Most of our sources have LAGN ~ LSF, suggesting co-evolution of black hole and stellar mass. The AGN luminosity of local LINERs generally is related to the position they occupy on the main-sequence traced by Star Forming galaxies.
1. Introduction
LINERs (Low Ionization Nuclear Emission Line Regions) were initially classified among Active Galactic Nuclei (AGN) since their emission line ratios could not be explained as produced by star forming processes (Heckman, 1980); they show optical spectra dominated by emission lines from low ionization species [(OI), (NII), (SII)] and faint high-ionization emission lines. The quantification of these properties is given by the position they occupy in diagnostic diagrams using optical (Veilleux and Osterbrock, 1987; Kewley et al., 2006) or Mid-infrared emission line ratios (Sturm et al., 2005, 2006; Bendo et al., 2006; Dale et al., 2006; Rupke et al., 2007; Smith et al., 2007). AGN were widely recognized as sources photo-ionized by a power-law continuum (Halpern and Steiner, 1983). Nevertheless, already pioneering works showed that the spectra of LINERs could also be explained by shock ionization models (Dopita and Sutherland, 1995; Franceschini et al., 2005) and photoionization by post-AGB stars, specially in the case of weak LINERs in ellipticals (Binette et al., 1994). Some LINER nuclei show broad permitted emission lines (type-1 LINERs, about 25% of all local LINERs, see Ho 2002) that, if confirmed as being produced by the Broad Line Region (BLR), would unambiguously connect type-1 LINERs to the AGN family. In the case of type-2 LINERs, the debate is still open, with the interpretation of all type-2 LINERs as low-luminosity AGN beeing still controversial, since the contribution from evolved (post-AGB) stars, low mass X-ray binaries or diffuse thermal plasma may have an important role (see Ho et al. 1997a for a full discussion on the topic; see also Eracleous et al. 2002; Stasińska et al. 2008; McKernan et al. 2010).
Already in Heckman's seminal work, LINERs were found to have lower luminosities that Seyfert nuclei and were generally identified in early-type hosts, a result which is irrespective of the interaction class, in the sense of finding the same morphologies in isolated and interacting LINER galaxies (Márquez and Masegosa, 2010; Márquez et al., 2010). LINERs are frequently found among nearby galaxies. For instance, around 40% of the galaxies in the Palomar Spectroscopic Survey (Ho et al., 1997a, and references therein) fall in this category. In the recent work by Leslie et al. (2016), 6.5% of the 202708 galaxies in their sample are classified as LINERs. Evidence is also compelling on LINERs probaly hosting heavily obscured (Compton-thick) AGN (González-Martín et al., 2009a, and references therein) which may imply that they may be even more numerous than previously deduced from optical selections. Therefore, their study seems relevant for understanding the demography of nearby AGN. AGN LINERs are found to be located at the faintest end of the fundamental correlation between star formation rate and accretion, representing very inefficient accreting systems (Satyapal et al. 2004; Dudik et al. 2005; Satyapal et al. 2005; Ho 2008; but see Netzer 2009). Ho (2009) places them in a sequence of decreasing Lbol/LEdd which goes from Seyferts to LINERs, and transition objects, down to passive absorption-line systems. Understanding LINERs would therefore be important for a better understanding of low-efficiency accretion processes and their connection with higher power AGN activity. Provided that the mass of the central supermassive black hole and the mass of the hosting galaxy bulge are correlated and that there exists the expected connection between AGN with galaxy formation and evolutionary processes (e.g., Leslie et al. 2016), the study of LINERs is relevant for inferring their role as eventual end-products in the evolution of galaxies (see for instance Wang et al. 2008).
Together with the host contamination, the presence of eventual extinction and circumnuclear star formation hamper the detection and characterization of such faint sources, still today. After more than 30 years of research, it is clear that the nature of the ionizing source in LINERs have to be studied through a multi-wavelength approach (review by Ho, 2008 and references therein).
This paper is focused on the contributions from our group on the multi-wavelength research on LINERs that we started more than a decade ago, and that mainly refer to (i) the study of the X-ray properties and variability of LINERs, (ii) the analysis of their mid-infrared Spitzer spectroscopy, (iii) the morphology of the ionized galaxies in the nuclear regions with high spatial resolution HST imaging, (iv) the study of optical emission lines in local type-1 LINERs and (v) the determination of the star formation properties of LINERs at low redshifts (from 0.04 to 0.11). Before going deeper into the details, we want to emphasize that we use the available information to minimize in our samples the contamination from those LINERs that could not belong to the AGN family, as explained in the following section.
2. AGN LINERs
Previous works have shown that LINER-like spectra can also arise in a galactic disc (see for example González-Martín et al. 2009b). In fact the contribution from fast shocks in extra-nuclear spectra, the so-called Low Ionization Emission Region (LIER), can produce the observed optical line ratios (Dopita et al., 1997) as can ejecta from starburst driven winds (Armus et al., 1990) or even a diffuse ionized plasma (Collins and Rand, 2001). An example for the LINER galaxy NGC5966 is given in Figure 1.
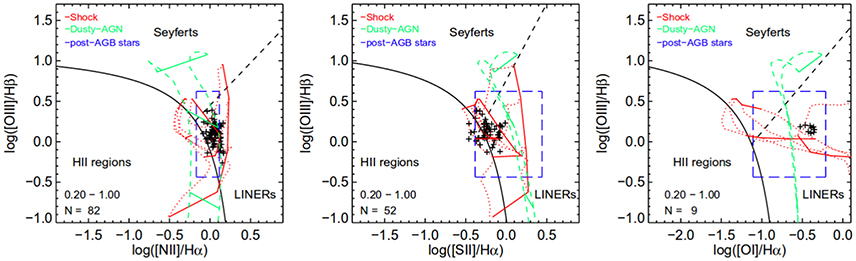
Figure 1. Diagnostic BPT diagrams for the LINER galaxy NGC 5966. The crosses correspond to the different locations across the galaxy provided by integral field spectroscopic data. The black solid curve is the theoretical maximum starburst model (Kewley et al., 2001). The black-dashed curves represent the Seyfert-LINER dividing line (Kewley et al., 2006; Schawinski et al., 2007). The red lines represent shock grids models (Allen et al., 2008). Green curves indicate grids of photoionization by an AGN (Groves et al., 2004). The blue boxes correspond to the predictions of photoionization models by pAGB stars (Binette et al., 1994). Adapted from Figure 9 in Kehrig et al. (2012). A&A 540, A11, 2012, reproduced with permission © ESO.
The challenge is to determine which sources with a LIER-like spectrum actually harbor a LINER powered by an AGN. To make this determination, a number of diagnostics exist at different wavelengths (Baldwin et al., 1981; Veilleux and Osterbrock, 1987; Sturm et al., 2005, 2006; Bendo et al., 2006; Dale et al., 2006; Kewley et al., 2006; Rupke et al., 2007; Smith et al., 2007). In addition to the traditional diagrams by Baldwin et al. (1981) BPT, the use of the WHAN diagnostics (which use the width of Hα, WHα, vs. [N II]/Hα) by Cid Fernandes et al. (2011) has been recently added to discriminate between weak AGN and retired galaxies where the process of forming stars has stopped and hot low-mass evolved stars are the ionizing source. Even if a great proportion of galaxies belonging to the initial LINER class are reclassified as retired galaxies, all LINERs with WHα > 3 Å are considered as weak AGN (see Figures 1, 6 in Cid Fernandes et al., 2011).
The detection of broad permitted lines (type-1 LINERs) is another indication of an AGN, as they are the detection of point like sources with AGN-like spectral properties at X-ray, UV and radio frequencies, and which are more secure indicators in the case of such sources showing variability. All the available indicators above have been used when selecting our sample galaxies in order to secure their AGN nature.
2.1. X-ray Properties and Variability
X-ray data offer the most reliable probe of the high energy spectrum for luminosity AGN. Additionally, the X-ray domain provides many AGN signatures, and therefore studies at X-rays frequencies become one of the most important for determining the AGN nature of LINERs. The advent of Chandra and XMM-Newton resulted in much progress on the field. Different studies carried out in the last decade show that an AGN is present in at least 50% of LINERs (Ho et al., 2001; Satyapal et al., 2004, 2005; Dudik et al., 2005), unless the AGN contribution to the 0.5–10 keV luminosity may be 60% (Flohic et al., 2006). Bolometric luminosities, Lbol, can be estimated from X-ray luminosities, LX, by considering an universal bolometric correction for LINERs, Lbol ~ LX. The derived Eddington ratios would imply that LINERs are the faintest end of the correlation between star formation rates and mass accretion, hosting very inefficient accretion processes (Eracleous et al., 2002; Dudik et al., 2005; Flohic et al., 2006; Ho, 2009).
Our first effort in this field was focused on the analysis of the X-ray properties of 51 LINERs with Chandra data (González-Martín et al., 2006). We found that their X-ray morphologies, spectra, and color-color diagrams together imply that a high percentage of LINER galaxies may host an AGN (González-Martín et al., 2006). We then updated our sample, including all LINERs from the catalog by Carrillo et al. (1999) with useful observations from Chandra and/or XMM-Newton; the resulting sample was the largest of LINERs (82 galaxies) with such data to date (González-Martín et al., 2009b,a). We first considered as AGN-candidates as those with a nuclear point-like source at the hard X-ray energy range (4.5–8.0 keV); at least ~60% of the studied LINERs were class as AGN-candidate (see Figure 2). HST optical images and literature data on emission lines, radio compactness, and stellar population results were compiled, and their study allowed us to conclude that an AGN might be present in 90% of the sample. The spectral analysis at X-rays indicates that best fits involve a composite model: (1) an absorbed primary power-law continuum and (2) a soft component below 2 keV described by an absorbed, scattered and/or thermal component (González-Martín et al., 2009b). According to the most common tracers for Compton-thickness, i.e., the X-ray spectral index (Maiolino et al., 1998; Cappi et al., 2006), the FX(2–10 keV) / F([OIII]) ratio (Panessa et al., 2006, and references therein), and the equivalent width of FeKα emission line (Matt, 1997; Bassani et al., 1999), about 50% of the studied LINERs showed evidence of being Compton-thick, a property more commonly found among LINERs than among Seyferts (González-Martín et al., 2009a, and references therein). Compared to Seyfert galaxies, LINERS have larger black hole masses and lower Eddington ratios, consistent with LINERs preferring early-type hosts. However note that, once X-ray luminosities were corrected for Compton-thickness, LINERs appeared to have lower X-ray luminosities and Eddington ratios, but somewhat overlapping the range of type-2 Seyferts, as further confirmed by Hernández-García et al. (2016) (see Figure 3).
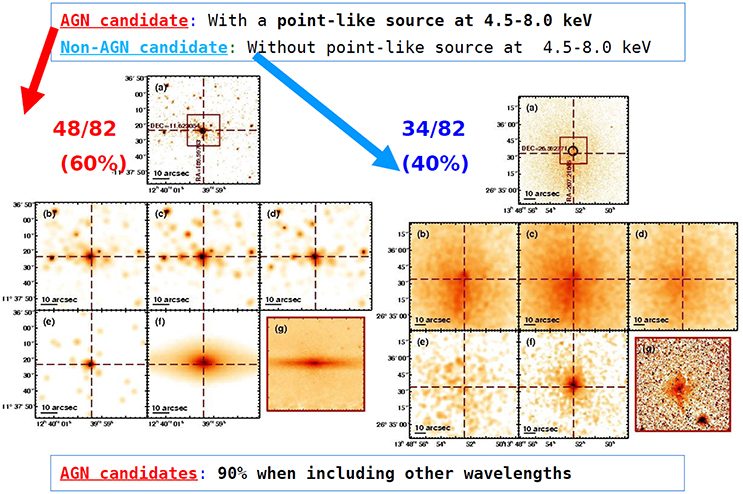
Figure 2. This figure summarizes the results of the classification of the 82 LINERS in our sample based on X-ray imaging, where AGN-candidates were defined as those with a nuclear point-like source at the hard X-ray energy range (4.5–8.0 keV). An example of an AGN candidate is given in the left (NGC 4594) and for an non-AGN candidate in the right (CGCG 162–010). In both columns we represent: Top: 0.6–8.0 keV band without smoothing. Center-left: 0.6–0.9 keV band. Center-center: 1.6–2.0 keV band. Center-right: 4.5–8.0* keV band. Bottom left: 6.0–7.0 keV band. Center-bottom: 2MASS image in Ks band. Bottom-right: sharp-divided HST optical image in the filter F814 W of the region marked as a rectangle in the top image. The sharp-dividing technique consists on dividing the original image by a smoothed version, and is aimed at better showing the internal structure (Márquez et al., 2003). The initial percentage of 60% AGN-candidates when only using X-ray imaging rises to 90% when the information at other wavelengths is considered (González-Martín et al., 2009b).
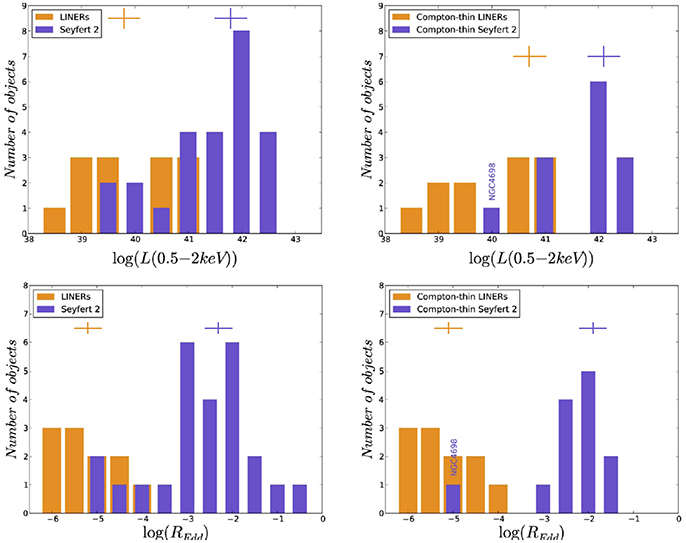
Figure 3. Histograms of the hard X-ray luminosities (top) and Eddington ratios (bottom) of LINER and Seyfert 2 nuclei analyzed in Hernández-García et al. (2016), for the entire sample of LINERs and Seyfert 2s (left), and Compton-thin LINERs and Seyfert 2s (right). The crosses represent the median values. Adapted from Figure 3 in Hernández-García et al. (2016).
In addition to a number of studies devoted to individual sources, the variability of LINERs as a family was studied at X-rays (Ptak and Griffiths, 1998; Pian et al., 2010) (see also Younes et al. 2011; 2012 but only for type 1 LINERs) and at UV (Maoz et al., 2005). Other works have considered LINERs but within the group of low luminosity AGN, where some Seyferts are also considered (González-Martín and Vaughan, 2012; Young et al., 2012, for example).
Starting with the finding of X-ray variability in the type-2 LINER NGC 4102 (González-Martín et al., 2011), and with the aim of contributing to the study of variability in LINERs in an homogeneous way, we extended our analysis to a sample of 17 AGN-LINERs with multi-epoch XMM-Newton and/or Chandra observations, to study both long and short-term variations. Variability is detected on timescales from days to years in 50% of the targets, but no short-term variations are detected. Flux variations are generally due to changes in the normalization of the power-law component at hard energies (Hernández-García et al., 2013, 2014, 2016).
When LINERs are compared to Seyfert 2 galaxies, we find that changes are mostly related to variations in the nuclear continuum, with variations in the absorbers and at soft energies in a few cases in both families. Compton-thick sources do not show variability, most probably because the AGN is not accessible in the 0.5–10 keV energy band. We find that the X-ray variations may occur similarly in the two families, LINERs and Seyfert 2s, in the sense that they are related to the nuclear continuum, although they might have different accretion mechanisms. Variability at UV wavelengths is detected in LINERs but not in Seyfert 2s, suggesting that some LINERs may have an unobstructed view of the inner disk where the UV, sometimes variable, emission may take place. This result appears to be compatible with the disappearance of the torus and/or the broad-line region in at least some LINERs (Hernández-García et al., 2016).
2.2. Mid Infrared Spectroscopy
At Mid Infrared (MIR) frequencies, among arguments to reinforce for the existence of a non-thermal component in LINERs are the overall shape of the continuum and the detection and line ratios of emission lines. As shown by Lawrence et al. (1997), LINERs are dominated by the stellar host in the range 1–5 μm but a strong excess is observed in the range between 10 and 20 μm, which may indicate the presence of less hot dust than in Seyferts. The unique study done so far at MIR frequencies by Sturm et al. (2005) has shown that two different LINER populations exist: infrared-bright and infrared-faint LINERs. The LINER emission in the former often show spatially extended (non-AGN) LINER emission and show MIR Spectral Energy Distributions (SED) typical of starburst galaxies. Emission in infrared-faint LINERs mostly arise from compact nuclear regions, and their MIR SEDs are much bluer. Fine-structure emission lines from highly excited gas, such as [OIV], suggesting the presence of an AGN, is detected in both populations.
Our study of LINERs in the MIR, low spectral-resolution Spitzer data, complemented with QSOs, Seyferts 1 and 2 and starburst galaxies, allows us to conclude that the spectrum of faint LINERs (those with LX < 1041 erg/s) is different from the average spectra of any of the other optical classes (see Figure 4). We suggest that their dominant emission might be a combination of an elliptical galaxy host, a starburst, a jet, and/or Advection-dominated Accretion Flow emission (González-Martín et al., 2015). Concerning the analysis of the existing correlation between the emissions at MIR and X-rays in AGN (Gandhi et al., 2010; Asmus et al., 2014), our analysis of the galaxy NGC 835 (González-Martín et al., 2016) has pointed out that the knots seen at X-rays are mostly located in the inner side of this MIR emission, which may suggest that outflows are present in the circumnuclear region.
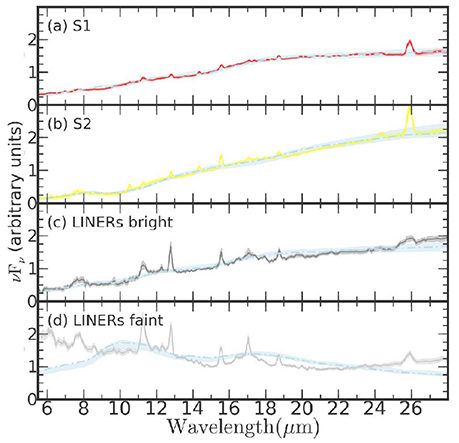
Figure 4. Best fit to clumpy models (dot-dashed light-blue line) for the average spectra of Seyfert 1s (a), Seyfert 2s (b), bright LINERs (c), and faint LINERs (those with LX < 1041 erg/s). (d), From Figure 9 in González-Martín et al. A&A 578, A74, 2015, reproduced with permission © ESO.
Several authors have claimed that less luminous AGN are not capable of sustaining a dusty torus structure (Elitzur and Shlosman 2006, also reviewed by Heckman and Best 2014 and references therein). In order to study the gradual re-sizing and disappearance of the torus, we examined MIR Spitzer/IRS spectra of a sample of ~ local AGN of different luminosities, from low-luminosity AGN and powerful Seyferts. A decomposition method was applied to decontaminate the torus component from other contributors (Hernán-Caballero et al., 2015); the nuclear fluxes provided by high spatial resolution MIR (or X-ray images and the Asmus' relation) were used to anchor the torus component. Starburst objects were included to ensure secure decomposition of the Spitzer/IRS spectra. Five groups were defined according to the torus contribution to the 5–15 μm range (Ctorus) and Lbol, with a progressively higher Ctorus and an increase of Lbol from Group 1 (no torus contribution, log(Lbol) ~ 41) up to Group 5 (Ctorus ~ 80% and log(Lbol) ~ 44). The fit of clumply models to the average spectra of each group indicated that, in Group 1, the torus is no longer present, supporting that the torus disappears at low luminosities. For Groups 3, 4, and 5, higher outer radii of the torus were found for higher luminosities, consistent with a re-sizing of the torus according to AGN luminosity (González-Martín et al., 2017).
2.3. HST Hα Imaging
To get additional clues on the nature of LINERs in the absence of high resolution X-ray data, indirect information can be obtained from correlations between X-ray properties at lower resolution and optical/NIR properties at higher resolution. In particular, the study of the properties of the ionized gas and its relation to those at X-rays may be enlightening. The Hα morphology of LINERs has been shown to consist on a point source embedded in an extended structure; this structure is sometimes clumpy and filamentary, and with clear indications of nuclear obscuration in some particular cases (similarly to what is found in low luminosity Seyferts) (Pogge et al., 2000; Chiaberge et al., 2005; Dai and Wang, 2008). Walsh et al. (2008) use STIS spectroscopy to demonstrate that the energy source at scales of tens of parsecs of 13 LINERs is consistent with photo-ionization by a central nuclear source, but outflows dominate their NLR kinematics.
We made use of the high spatial resolution provided by HST Hα imaging for 32 LINERs (Masegosa et al., 2011), with the aim of characterizing the ionized gas in the nuclear regions. An unresolved nuclear component can be identified in 84% of the sources. Extended emission with equivalent sizes ranging from a few tens to hundreds of parsecs is also seen, with morphologies that can be grouped into three classes: nuclear outflow candidates (42%, see an example in Figure 5), core-halo morphologies (25%) and nuclear spiral disks (14%). The equivalent radius of the Hα emission and the (2-10 keV) X-ray luminosities show a size-luminosity relation. Both the morphologies of the ionized gas and the relation between size and luminosity are completely equivalent to those found in low luminosity Seyferts, what indicated a common origin for the NLR of LINERs and Seyferts. We suggested for the first time a relation between the morphologies of the ionized gas and the soft X-rays in LINERs (Masegosa et al., 2011) similar to what was obtained for Seyferts (Schmitt and Kinney, 1996).
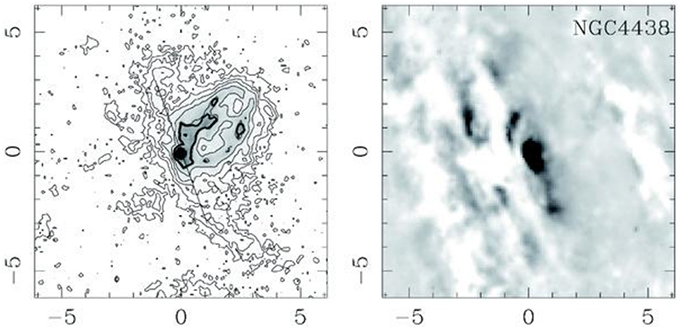
Figure 5. HST Hα (left) and sharp-divided images of NGC 4438, one of the objects with a morphology suggestive on hosting an outflow. We note that this galaxy hosts a type-1 LINER nucleus. From Figure 2 in Masegosa et al. A&A 527, A23, 2011, reproduced with permission © ESO.
2.4. The BLR in LINERs 1.9 Revisited
Spectropolarimetric observations at the Keck 10 m telescope of 14 LINERs have shown that the BLR is detected in polarized light in only three of them (Ho, 2008). But models based on a clumpy torus, suggest that the BLR cannot survive for bolometric luminosities Lbol < 1042ergs−1, in clear contradiction with the existence of type-1 LINER nuclei in general, and with the particular 22 cases in the Palomar Spectroscopic survey by Ho et al. (1997b). The properties of the BLR in these objects are hence far from being well understood.
Except for individual discoveries of type 1 LINERs (Storchi-Bergmann et al., 1993; Bower et al., 1996; Ho et al., 1997b; Eracleous and Halpern, 2001; Martínez et al., 2008), the only systematic work is Ho et al. (2003). They use an homogeneous detection method on a magnitude limited spectroscopic catalogue, so theirs is the best defined sample of type 1 LINERs. Unfortunately, their spectra quite often lack the required S/N for a precise measurement of the width of the broad Hα component. This could in principle be circumvented by using STIS-HST spectra, available for 14 out the 22 type 1 LINERs (Shields et al., 2007; Walsh et al., 2008; Balmaverde and Capetti, 2014). Nevertheless, as our analysis of the HST Hα imaging demonstrated, most objects show a morphology indicating the presence of outflows (Masegosa et al. 2011), which could contribute to the line broadening and consequently result in a wrong estimation of the BLR line width. Measuring the width of the low ionization line [OI]63001, which is not covered by the STIS-HST spectra (Balmaverde and Capetti, 2015; Constantin et al., 2015; Balmaverde et al., 2016), may help constrain whether outflows are relevant and estimate their contribution to the width of Hα.
We have observed, with the TWIN spectrograph attached to the 3.5 m telescope in Calar Alto, the 22 type 1 LINER galaxies in Ho's sample. The spectra covering the regions around both Hα and Hβ, with 0.54 A/pixel spectral resolution, have S/N ~ 50 for the former. Our aim was to analyze whether the presence of outflows may have an impact on the line-widths and therefore on the identification of type 1 LINERs. A careful subtraction of the underlying stellar component was performed, using both Starlight (Cid Fernandes et al., 2005) and Ppfx (Cappellari and Emsellem, 2004). The resulting narrow emission lines [SII] and [OI] were fitted by means of Gaussian single or double components, both providing in general different results for the line-widths. The line-widths and shifts of [NII] lines and Hα are fixed either to those from [SII] to [OI]; the best fit is determined from that with the smallest residuals. An additional broad component, indicative of a BLR, is also required only in eight cases (see for instance Figure 6). We find that outflows may explain the broad lines found in a number of these LINERs. A full discussion with these results and the comparison with those from previous works will be provided elsewhere (Marquez et al., 2017, in preparation).
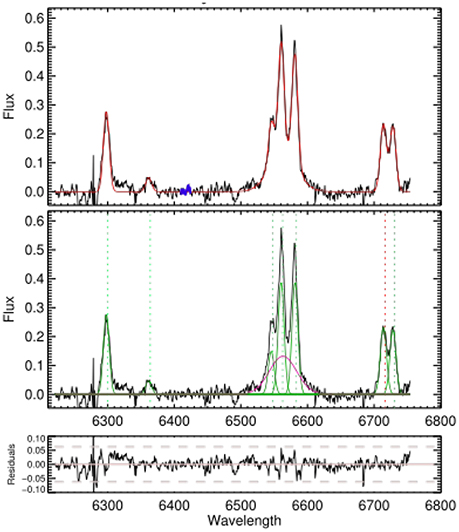
Figure 6. Top: Stellar population subtracted spectrum of NGC 3718 (black), together with the final model with single Gaussian components for the narrow lines and an additional very broad component for Hα. Middle: Narrow line fitting in green and very broad Hα in magenta. Bottom: Residual spectrum.
3. Most Luminous LINERs at Redshifts from 0.04 to 0.11
The best studied nearby LINERs are found in the nuclei of galaxies with little or no evidence of active star formation (SF). They are usually hosted by massive early-type galaxies (rarely spirals), with massive Super Massive Black Holes, old stellar populations and small amounts of gas and dust (e.g., Kauffmann et al. 2003; Cid Fernandes et al. 2004; Ho 2008; Leslie et al. 2016). Recently, a population of LINERs has been detected at z~0.3 (Tommasin et al., 2012), showing higher SF and AGN luminosities than those typical of nearby LINERs (Ho et al., 1997a).
Aimed at searching for similar objects at lower redshifts, we have studied a sample of 42 of these most luminous LINERs in terms of both AGN and Star Formation luminosities (log(LAGN) > 44.3 and log(LSF) > 44.3, hereafter MLLINERs) but in the local universe, at z = 0.04–0.11, through the analysis of our own spectroscopic data (long-slit spectroscopy with the TWIN and ALFOSC spectrographs attached to the 3.5 m telescope in Calar Alto and the NOT in La Palma, respectively) and FIR data (Herschel and IRAS). We find that local MLLINERs show considerable differences in comparison to other low-redshift LINERs, in terms of higher extinctions, higher star-formation rates and AGN luminosities. They are hosted by galaxies of all morphological types, including 25% of peculiar galaxies (with clear asymmetries, substructures and/or distortions). Our MLLINERs are located on the main sequence (MS) of star-forming galaxies (see Figure 7), again in contrast to nearby LINERs that usually lye below the MS (Leslie et al., 2016).
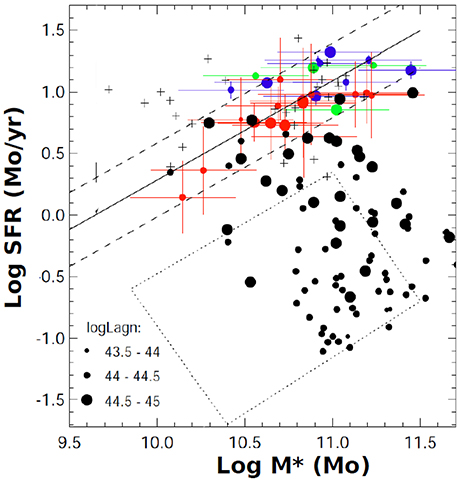
Figure 7. The relationship between SFR and total stellar mass. SFRs were measured either with Herschel/PACS FIR data (big green filled circles), with IRAS data (big dark blue filled circles), or through Dn4000 index from optical spectroscopic data (big red filled circles). The solid black line shows the Main Sequence for SF at z = 0.07 (Whitaker et al., 2012), and the dashed lines its typical width. Together with our MLLINERs, the entire sample of luminous LINERs (black dots), and the most luminous LINERs at z ~ 0.3 from Tommasin et al. (2012) (black crosses) are included. The dotted polygon represents the typical location of 60% of all LINERs at low redshifts (Leslie et al., 2016). AGN luminosity bins are represented with symbols of different sizes. Reproduced with permission from Figure 12. M. Povic et al. Star formation and AGN activity in the most luminous LINERs in the local universe. MNRAS (2016) 462 (3): 2878–2903. Published by Oxford University Press on behalf of The Royal Astronomical Society. Available online at: https://academic.oup.com/mnras/article/462/3/2878/2589850?searchresult=1. This figure is not covered by the Open-Access licence of this publication. For permissions contact Sm91cm5hbHMucGVybWlzc2lvbnNAT1VQLmNvbQ==.
MLLINERs have the same stellar masses (M∗), star forming rates and LAGN than those previously detected at z ~ 0.3 (Tommasin et al., 2012); hence we confirm the existence of such luminous LINERs in the local universe, and therefore discard an eventual evolutionary scenario with higher luminosity objects for higher redshifts. The median stellar mass of these MLLINERs corresponds to 6–7 × 10¹⁰ M⊙ which was found in previous work to correspond to the peak of relative growth rate of stellar populations and therefore for the highest SFRs. Other LINERs although showing similar AGN luminosities have lower SFR. We find that most of MLLINERs have LAGN ~ LSF suggesting co-evolution of black hole and stellar mass. The fraction of z = 0.04–0.11 LINERs located on the MS is 2, 3, 11, and 37% in the bins of log(LAGN) of (43–43.5), (43.5–44), (44–44.5), and (44.5–45), respectively (see Figure 7). Thus, we can safely conclude that the fraction of local LINERs on the main sequence of star-forming galaxies is related to their AGN luminosity. All these results are published in Pović et al. (2016).
4. Conclusions
The main conclusions of our contributions to the study of LINER AGN can be summarized as follows:
• From 60% to 90% of the studied LINERs in our initial sample of 82 objects with X-ray data can be considered as genuine AGN. The percentage of Compton-thick nuclei may be higher in LINERs than in Seyferts. Variability in X-rays is a common property in LINERs, with timescales from days to years. X-ray variations may occur similarly in LINERs and Seyfert 2s, i.e., they are related to the nuclear continuum, although they might have different accretion mechanisms, which may be related to the expected disappearance of the torus at low bolometric luminosities.
• Bright LINERs are similar to Seyfert 2s concerning MIR spectroscopic properties, whereas faint LINERs form a separate family. A refined decomposition of MIR spectra indicates that the torus contribution is negligible for LBOL < 1041 erg/s.
• The high spatial resolution HST imaging indicates that most LINERs show a broad-cone or core-halo Hα morphology, which may indicate the presence of outflows, specially in the former case.
• The study of new optical spectroscopic data around Hα of LINERs previously classified as type 1, allow a careful subtraction of the stellar component and the fitting to the resulting emission line spectra. Single/double Gaussian fitting results in the need of very broad Hα components only in 8 out of the 22 observed objects. The presence of such very broad lines being indicative of the detection of the BLR, the percentage of type 1 LINERs might be much smaller (~ 8%) than previously estimated (25%).
• The analysis of a sample of most luminous LINERs (with log(LAGN) > 44.3 and log(LSF) > 44.3, MLLINERs) at z = 0.04 −0.11 results in such objects having the same stellar masses (M∗), star forming rates and LAGN than luminous LINERs previously found at z = 0.3. Our MLLINERs are located along the line of LAGN = LSF. Most of them, with M∗ > 1010 M⊙, are located along the main sequence of star forming galaxies. Considering the whole population of LINERs [with log(LAGN) from 43 to 45], the fraction of LINERs on the MS depends on LAGN.
Still today LINERs remain interesting objects to be studied, and new data are needed to deepen in their knowledge. In particular, on one hand integral field spectroscopy will be of paramount importance to analyse the presence and relevance of shocks. On the other hand, MIR spectroscopy, with the required sensitivity and resolution with the advent of the JWST in the coming future, will provide an unprecedent approach to the hypothesis of the torus disapearence in such low luminous AGN.
Author Contributions
All authors have contributed to the text. The analysis of LINERs at X-rays made within our group mainly comes from the PhD theses by OG-M and LH-G. JM, and IM led the analysis of HST Hα imaging. MIR spectroscopic studies were led by OG-M. The recently acquired optical spectroscopy of type 1 LINERs is led by IM, SC, and AdO being responsible for the spectral fittings. The study of MLLINERs was led by MP, IM, HN, and JM.
Funding
These works were supported by Spanish grants AYA2001-2089, AYA2003-00128, AYA2006-01325, AYA2007-62190, AYA2010-15169, AYA2013-42227P, and AYA2016-76682C3-1-P. Regional funding from the Junta de Andalucia was obtained through the grant TIC-114 and the Excellence Project P08-TIC-03531. MP acknowledges support from the Ethiopian Space Science and Technology Institute (ESSTI) under the Ethiopian Ministry of Science and Technology (MoST).
Conflict of Interest Statement
The authors declare that the research was conducted in the absence of any commercial or financial relationships that could be construed as a potential conflict of interest.
Acknowledgments
We are grateful to our collaborators in the different papers produced within our group that are summarized in this contribution. IM acknowledges the kind invitation of the organizers of the meeting “QSO at All Cosmic Epochs.” We acknowledge the comments provided by the referees, who helped to improve the paper.
Footnotes
1. ^A single, unblended line, contrary to [NII] and [SII].
References
Allen, M., Groves, B., Dopita, M., Sutherland, R., and Kewley, L. (2008). The mappings iii library of fast radiative shock models. Astrophys. J. Suppl. Ser. 178, 20–55. doi: 10.1086/589652
Armus, L., Heckman, T., and Miley, G. (1990). The optical emission-line nebulae of powerful far-infrared galaxies. Astrophys. J. 364:471. doi: 10.1086/169431
Asmus, D., Hönig, S., Gandhi, P., Smette, A., and Duschl, W. (2014). The subarcsecond mid-infrared view of local active galactic nuclei - i. the n- and q-band imaging atlas. Mon. Not. R. Astron. Soc. 439:1648. doi: 10.1093/mnras/stu041
Baldwin, A., Phillips, M. M., and Terlevich, R. (1981). Classification parameters for the emission-line spectra of extragalactic objects. Publ. Astron. Soc. Pac. 93:5. doi: 10.1086/130766
Balmaverde, B., and Capetti, A. (2014). The hst view of the broad line region in low luminosity agn. Astron. Astrophys. 563, A119. doi: 10.1051/0004-6361/201321989
Balmaverde, B., and Capetti, A. (2015). The naked nuclei of low ionization nuclear emission line regions. Astron. Astrophys. 581, A76. doi: 10.1051/0004-6361/201526496
Balmaverde, B., Capetti, A., Moisio, D., Baldi, R., and Marconi, A. (2016). The hst view of the innermost narrow line region. Astron. Astrophys. 586, A48. doi: 10.1051/0004-6361/201526927
Bassani, L., Dadina, M., Maiolino, R., Salvati, M., Risaliti, G., Ceca, R. D., et al. (1999). A three-dimensional diagnostic diagram for seyfert 2 galaxies: Probing x-ray absorption and compton thickness. Astrophys. J. Suppl. Ser. 121:473. doi: 10.1086/313202
Bendo, G., Buckalew, B., Dale, D., Draine, B., Joseph, R. R. K. Jr., Sheth, K., et al. (2006). Spitzer and jcmt observations of the active galactic nucleus in the sombrero galaxy (ngc 4594). Astrophys. J. 645:134. doi: 10.1086/504033
Binette, L., Magris, C., Stasińska, G., and Bruzual, A. (1994). Photoionization in elliptical galaxies by old stars. Astron. Astrophys. 292:13.
Bower, G., Wilson, A., Heckman, T., and Richstone, D. (1996). Double-peaked broad emission lines in the nucleus of m81. Astron. J. 111:1901. doi: 10.1086/117928
Cappellari, M., and Emsellem, E. (2004). Parametric recovery of line-of-sight velocity distributions from absorption-line spectra of galaxies via penalized likelihood. Publ. Astron. Soc. Pac. 116:138. doi: 10.1086/381875
Cappi, M., Panessa, F., Bassani, L., Dadina, M., Cocco, G. D., Comastri, A., et al. (2006). X-ray spectral survey with xmm-newton of a complete sample of nearby seyfert galaxies. Astron. Astrophys. 446:459. doi: 10.1051/0004-6361:20053893
Carrillo, R., Masegosa, J., Dultzin-Hacyan, D., and Ordoñez, R. (1999). A multifrequency catalog of liners. Rev. Mex. Astron. Astrofis. 35:187.
Chiaberge, M., Capetti, A., and Macchetto, F. (2005). The hubble space telescope view of liner nuclei: evidence for a dual population? Astrophys. J. 625:716. doi: 10.1086/429612
Cid Fernandes, R., Delgado, R. G., Schmitt, H., Storchi-Bergmann, T., Martins, L., Pérez, E., et al. (2004). The stellar populations of low-luminosity active galactic nuclei. i. ground-based observations. Astrophys. J. 605:105. doi: 10.1086/382217
Cid Fernandes, R., Mateus, A., Sodré, L., Stasińska, G., and Gomes, J. M. (2005). Semi-empirical analysis of sloan digital sky survey galaxies - i. spectral synthesis method. Mon. Not. R. Astron. Soci. 358:363. doi: 10.1111/j.1365-2966.2005.08752.x
Cid Fernandes, R., Stasińska, G., Mateus, A., and Asari, N. V. (2011). A comprehensive classification of galaxies in the sloan digital sky survey: how to tell true from fake agn? Mon. Not. R. Astron. Soc. 413:1687. doi: 10.1111/j.1365-2966.2011.18244.x
Collins, J., and Rand, R. (2001). Ionization sources and physical conditions in the diffuse ionized gas halos of four edge-on galaxies. Astrophys. J. 551:57. doi: 10.1086/320072
Constantin, A., Shields, J., Ho, L., Barth, A., Filippenko, A., and Castillo, C. (2015). Dissecting the power sources of low-luminosity emission-line galaxy nuclei via comparison of hst-stis and ground-based spectra. Astrophys. J. 814:149. doi: 10.1088/0004-637X/814/2/149
Dai, H., and Wang, T.-G. (2008). The structure of narrow-line region in liners. Chin. J. Astron. Astrophys. 8:245. doi: 10.1088/1009-9271/8/3/01
Dale, D., Smith, J., Armus, L., Buckalew, B., Helou, G., Kennicutt, R. C. Jr., et al. (2006). Mid-infrared spectral diagnostics of nuclear and extranuclear regions in nearby galaxies. Astrophys. J. 646:161. doi: 10.1086/504835
Dopita, M., Koratkar, A., Allen, M. G., Tsvetanov, Z., Ford, H., Bicknell, G., and Sutherland, R. (1997). The liner nucleus of m87: a shock-excited dissipative accretion disk. Astrophys. J. 490:202. doi: 10.1086/304862
Dopita, M., and Sutherland, R. (1995). Spectral signatures of fast shocks. ii. optical diagnostic diagrams. Astrophys. J. 455:468. doi: 10.1086/176596
Dudik, R. P., Satyapal, S., Gliozzi, M., and Sambruna, R. (2005). A chandra snapshot survey of infrared-bright liners: A possible link between star formation, active galactic nucleus fueling, and mass accretion. Astrophys. J. 620:113. doi: 10.1086/426856
Elitzur, M., and Shlosman, I. (2006). The agn-obscuring torus: the end of the “doughnut” paradigm? Astrophys. J. 648, L101. doi: 10.1016/j.newar.2006.06.027
Eracleous, M., and Halpern, J. (2001). Ngc 3065: a certified liner with broad, variable balmer lines. Astrophys. J. 554:240. doi: 10.1086/321331
Eracleous, M., Shields, J., Chartas, G., and Moran, E. (2002). Three liners under the chandra x-ray microscope. Astrophys. J. 565:108. doi: 10.1086/324394
Flohic, H., Eracleous, M., Chartas, G., Shields, J., and Moran, E. (2006). The central engines of 19 liners as viewed by chandra. Astrophys. J. 647:140. doi: 10.1086/505296
Franceschini, A., Manners, J., Polletta, M., Lonsdale, C., Gonzalez-Solares, E., Surace, J., et al. (2005). A complete multiwavelength characterization of faint chandra x-ray sources seen in the spitzer wide-area infrared extragalactic (swire) survey. Astron. J. 129:2074. doi: 10.1086/428004
Gandhi, P., Horst, H., Smette, A., Hönig, S., Comastri, A., Gilli, R., et al. (2010). “Resolved mid-infrared imaging of agn: an isotropic measure of intrinsic power,” in X-ray Astronomy 2009; Present Status, Multi-Wavelength Approach and Future Perspectives (Bologna), Vol. 1248:431.
González-Martín, O., Hernández-García, L., Masegosa, J., Márquez, I., Rodríguez-Espinosa, J., Acosta-Pulido, J., et al. (2016). X-ray long-term variations in the low-luminosity agn ngc 835 and its circumnuclear emission. Astron. Astrophys. 587, A1. doi: 10.1051/0004-6361/201526990
González-Martín, O., Masegosa, J., Hernán-Caballero, A., Márquez, I., Almeida, C. R., Alonso-Herrero, A., et al. (2017). Hints on the gradual resizing of the torus in agns through decomposition of spitzer/irs spectra. Astrophys. J. 841:37. doi: 10.3847/1538-4357/aa6f16
González-Martín, O., Masegosa, J., Márquez, I., and Guainazzi, M. (2009a). Fitting liner nuclei within the active galactic nucleus family: a matter of obscuration? Astrophys. J. 704:1570. doi: 10.1088/0004-637X/704/2/1570
González-Martín, O., Masegosa, J., Márquez, I., Guainazzi, M., and Jiménez-Bailón, E. (2009b). An x-ray view of 82 liners with chandra and xmm-newton data. Astron. Astrophys. 506:1107. doi: 10.1051/0004-6361/200912288
González-Martín, O., Masegosa, J., Márquez, I., Guerrero, M., and Dultzin-Hacyan, D. (2006). X-ray nature of the liner nuclear sources. Astron. Astrophys. 460:45. doi: 10.1051/0004-6361:20054756
González-Martín, O., Masegosa, J., Márquez, I., Rodríguez-Espinosa, J., Acosta-Pulido, J., Almeida, C. R., et al. (2015). Nuclear obscuration in liners. clues from spitzer/irs spectra on the compton thickness and the existence of the dusty torus. Astron. Astrophys. 578, A74. doi: 10.1051/0004-6361/201425254
González-Martín, O., Papadakis, I., Braito, V., Masegosa, J., Márquez, I., Mateos, S., et al. (2011). Suzaku observation of the LINER NGC 4102. Astron. Astrophys. 527, A142. doi: 10.1051/0004-6361/201016097
González-Martín, O., and Vaughan, S. (2012). X-ray variability of 104 active galactic nuclei. xmm-newton power-spectrum density profiles. Astron. Astrophys. 544, A80. doi: 10.1051/0004-6361/201219008
Groves, B., Dopita, M., and Sutherland, R. (2004). Dusty, radiation pressure-dominated photoionization. i. model description, structure, and grids. Astrophys. J. Suppl. Ser. 153:9. doi: 10.1086/421113
Halpern, J., and Steiner, J. (1983). Low-ionization active galactic nuclei - x-ray or shock heated? Astrophys. J. 269, L37.
Heckman, T. (1980). An optical and radio survey of the nuclei of bright galaxies - stellar populations and normal hii regions. Astron. Astrophys. 87:142.
Heckman, T. M., and Best, P. N. (2014). The coevolution of galaxies and supermassive black holes: Insights from surveys of the contemporary universe. Ann. Rev. Astron. Astrophys. 52:589. doi: 10.1146/annurev-astro-081913-035722
Hernán-Caballero, A., Alonso-Herrero, A., Hatziminaoglou, E., Spoon, H., Almeida, C. R., Santos, T. D., et al. (2015). Resolving the agn and host emission in the mid-infrared using a model-independent spectral decomposition. Astrophys. J. 803:109. doi: 10.1088/0004-637X/803/2/109
Hernández-García, L., González-Martín, O., Márquez, I., and Masegosa, J. (2013). X-ray spectral variability of seven liner nuclei with xmm-newton and chandra data. Astron. Astrophys. 556, A47. doi: 10.1051/0004-6361/201321563
Hernández-García, L., González-Martín, O., Masegosa, J., and Márquez, I. (2014). X-ray spectral variability of liners selected from the palomar sample. Astron. Astrophys. 569, A26. doi: 10.1051/0004-6361/201424140
Hernández-García, L., Masegosa, J., González-Martín, O., Márquez, I., and Perea, J. (2016). Unveiling the physics of low-luminosity agns through x-ray variability: liner versus seyfert 2. Astrophys. J. 824:7. doi: 10.3847/0004-637X/824/1/7
Ho, L. (2002). “Nonstandard Central Engines in Nearby Galaxies,” in Astronomical Society of the Pacific Conference Series (San Francisco, CA).
Ho, L. (2008). Nuclear activity in nearby galaxies. Ann. Rev. Astron. Astrophys. 46:475. doi: 10.1146/annurev.astro.45.051806.110546
Ho, L. (2009). Radiatively inefficient accretion in nearby galaxies. Astrophys. J. 699:626. doi: 10.1088/0004-637X/699/1/626
Ho, L., Feigelson, E., Townsley, L., Sambruna, R., Garmire, G., Brandt, W., et al. (2001). Detection of nuclear x-ray sources in nearby galaxies with chandra. Astrophys. J. 549, L51. doi: 10.1086/319138
Ho, L., Filippenko, A., and Sargent, W. (1997a). A search for “dwarf” seyfert nuclei. v. demographics of nuclear activity in nearby galaxies. Astrophys. J. 487:568.
Ho, L., Filippenko, A., and Sargent, W. (2003). A search for “dwarf” seyfert nuclei. vi. properties of emission-line nuclei in nearby galaxies. Astrophys. J. 583:159. doi: 10.1086/345354
Ho, L., Filippenko, A., Sargent, W., and Peng, C. (1997b). A search for “dwarf” seyfert nuclei. iv. nuclei with broad hα emission. Astrophys. J. Suppl. Ser. 112:391.
Kauffmann, G., Heckman, T., White, S., Charlot, S., Tremonti, C., Brinchmann, J., et al. (2003). Stellar masses and star formation histories for 105 galaxies from the sloan digital sky survey. Mon. Not. R. Astron. Soc. 341:33. doi: 10.1046/j.1365-8711.2003.06291.x
Kehrig, C., Monreal-Ibero, A., Papaderos, P., Vílchez, J. M., Gomes, J. M., Masegosa, J., et al. (2012). The ionized gas in the CALIFA early-type galaxies I. Mapping two representative cases: NGC 6762 and NGC 5966. Astron. Astrophys. 540:A11. doi: 10.1051/0004-6361/201118357
Kewley, L., Dopita, M., Sutherland, R., Heisler, C., and Trevena, J. (2001). Theoretical modeling of starburst galaxies. Astrophys. J. 556:121. doi: 10.1086/321545
Kewley, L., Groves, B., Kauffmann, G., and Heckman, T. (2006). The host galaxies and classification of active galactic nuclei. Mon. Not. R. Astron. Soc. 372:961. doi: 10.1111/j.1365-2966.2006.10859.x
Lawrence, A., Elvis, M., Wilkes, B., McHardy, I., and Brandt, N. (1997). X-ray and optical continua of active galactic nuclei with extreme fe ii emission. Mon. Not. R. Astron. Soc. 285:879. doi: 10.1093/mnras/285.4.879
Leslie, S., Kewley, L., Sanders, D., and Lee, N. (2016). Quenching star formation: insights from the local main sequence. Mon. Not. R. Astron. Soc. 455, L82. doi: 10.1093/mnrasl/slv135
Maiolino, R., Salvati, M., Bassani, L., Dadina, M., della Ceca, R., Matt, G., et al. (1998). Heavy obscuration in x-ray weak agns. Astron. Astrophys. 338:781.
Maoz, D., Nagar, N. M., Falcke, H., and Wilson, A. S. (2005). The murmur of the sleeping black hole: Detection of nuclear ultraviolet variability in liner galaxies. Astrophys. J. 625:699. doi: 10.1086/429795
Márquez, I., and Masegosa, J. (2010). Galaxies hosting agn activity and their environments. Astrophys. Space Sci. Proc. 14:119. doi: 10.1007/978-3-642-11250-8_11
Márquez, I., Masegosa, J., Durret, F., Delgado, R. M. G., Moles, M., Maza, J., et al. (2003). The detection of stellar velocity dispersion drops in the central regions of five isolated seyfert spirals. Astron. Astrophys. 409:459. doi: 10.1051/0004-6361:20031059
Márquez, I., Varela, J., Masegosa, J., and del Olmo, A. (2010). “Agn in isolated and interacting galaxies in the palomar spectroscopic survey,” in Galaxies in Isolation: Exploring Nature Versus Nurture (Granada), Vol. 421:266.
Martínez, M., del Olmo, A., Coziol, R., and Focardi, P. (2008). Deficiency of broad-line agns in compact groups of galaxies. Astrophys. J. 678, L9. doi: 10.1086/588498
Masegosa, J., Márquez, I., Ramirez, A., and González-Martín, O. (2011). The nature of nuclear hα; emission in liners. Astron. Astrophy. 527, A23. doi: 10.1051/0004-6361/201015047
Matt, G. (1997). The x-ray spectrum of compton-thick seyfert 2 galaxies. Mem. Della Soc. Astron. Ital. 68:127.
McKernan, B., Ford, K., and Reynolds, C. (2010). Black hole mass, host galaxy classification and agn activity. Mon. Not. R. Astron. Soc. 407:2399. doi: 10.1111/j.1365-2966.2010.17068.x
Netzer, H. (2009). Accretion and star formation rates in low-redshift type ii active galactic nuclei. Mon. Not. R. Astron. Soc. 399:1907. doi: 10.1111/j.1365-2966.2009.15434.x
Panessa, F., Bassani, L., Cappi, M., Dadina, M., Barcons, X., Carrera, F. J., et al. (2006). On the x-ray, optical emission line and black hole mass properties of local seyfert galaxies. Astron. Astrophys. 455:173. doi: 10.1051/0004-6361:20064894
Pian, E., Romano, P., Maoz, D., Cucchiara, A., Pagani, C., and Parola, V. L. (2010). Variability and spectral energy distributions of low-luminosity active galactic nuclei: a simultaneous x-ray/uv look with swift. Mon. Not. R. Astron. Soc. 401:677. doi: 10.1111/j.1365-2966.2009.15689.x
Pogge, R., Maoz, D., Ho, L., and Eracleous, M. (2000). The narrow-line regions of liners as resolved with the hubble space telescope. Astrophys. J. 532:323. doi: 10.1086/308567
Pović, M., Márquez, I., Netzer, H., Masegosa, J., Nordon, R., Pérez, E., and Schoenell, W. (2016). Star formation and agn activity in the most luminous liners in the local universe. Mon. Not. R. Astron. Soc. 462:2878. doi: 10.1093/mnras/stw1842
Ptak, A., Yaqoob, T., Mushotzky, R., Serlemitsos, P., and Griffiths, R. (1998). X-ray variability as a probe of advection-dominated accretion in low-luminosity active galactic nuclei. Astrophys. J. 501, L37. doi: 10.1086/311444
Rupke, D., Veilleux, S., Kim, D.-C., Sturm, E., Contursi, A., Lutz, D., et al. (2007). “Uncovering the active galactic nuclei in low-ionization nuclear emission-line regions with spitzer,” in Central Engine of Active Galactic Nuclei, Vol. 373:525.
Satyapal, S., Dudik, R., O'Halloran, B., and Gliozzi, M. (2005). The link between star formation and accretion in liners: a comparison with other active galactic nucleus subclasses. Astrophys. J. 633:86. doi: 10.1086/449304
Satyapal, S., Sambruna, R., and Dudik, R. (2004). A joint mid-infrared spectroscopic and x-ray imaging investigation of liner galaxies. Astron. Astrophys. 414:825. doi: 10.1051/0004-6361:20031609
Schawinski, K., Thomas, D., Sarzi, M. C., Maraston Kaviraj, S., Joo, S.-J., Yi, S., and Silk, J. (2007). Observational evidence for agn feedback in early-type galaxies. Mon. Not. R. Astron. Soc. 382:1415. doi: 10.1111/j.1365-2966.2007.12487.x
Schmitt, H., and Kinney, A. (1996). A comparison between the narrow-line regions of seyfert 1 and seyfert 2 galaxies. Astrophys. J. 463:498. doi: 10.1086/177264
Shields, J., Rix, H.-W., Sarzi, M., Barth, A., Filippenko, A., Ho, L., et al. (2007). The survey of nearby nuclei with the space telescope imaging spectrograph: Emission-line nuclei at hubble space telescope resolution. Astrophys. J. 654:125. doi: 10.1086/509059
Smith, J., Draine, B., Dale, D., Moustakas, J., Kennicutt, R. C. Jr., Helou, G., et al. (2007). The mid-infrared spectrum of star-forming galaxies: global properties of polycyclic aromatic hydrocarbon emission. Astrophys. J. 656:770. doi: 10.1086/510549
Stasińska, G., Asari, N. V., Fernandes, R. C., Gomes, J., Schlickmann, M., Mateus, A., et al. (2008). Can retired galaxies mimic active galaxies? clues from the sloan digital sky survey. Mon. Not. R. Astron. Soc. 391, L29. doi: 10.1111/j.1745-3933.2008.00550.x
Storchi-Bergmann, T., Baldwin, J., and Wilson, A. (1993). Double-peaked broad line emission from the liner nucleus of ngc 1097. Astrophys. J. 410, L11. doi: 10.1086/186867
Sturm, E., Rupke, D., Contursi, A., Kim, D.-C., Lutz, D., Netzer, H., et al. (2006). Mid-infrared diagnostics of liners. Astrophys. J. 653, L13. doi: 10.1086/510381
Sturm, E., Schweitzer, M., Lutz, D., Contursi, A., Genzel, R., Lehnert, M., et al. (2005). Silicate emissions in active galaxies: from liners to qsos. Astrophys. J. 629, L21. doi: 10.1086/444359
Tommasin, S., Netzer, H., Sternberg, A., Nordon, R., Lutz, D., ongiorno, A., et al. (2012). Star formation in liner host galaxies at z ˜ 0.3. Astrophys. J. 753:155. doi: 10.1088/0004-637X/753/2/155
Veilleux, S., and Osterbrock, D. (1987). Spectral classification of emission-line galaxies. Astrophys. J. Suppl. Ser. 63:295. doi: 10.1086/191166
Walsh, J., Barth, A., Ho, L., Filippenko, A., Rix, H.-W., Shields, J., et al. (2008). Hubble space telescope spectroscopic observations of the narrow-line region in nearby low-luminosity active galactic nuclei. Astron. J. 136:1677. doi: 10.1088/0004-6256/136/4/1677
Wang, L., Mao, J., Xiang, S., and Yuan, Y. (2008). The effect of agn and sne feedback on star formation, reionization and the near infrared background. Chin. J. Astron. Astrophys. 8:631. doi: 10.1088/1009-9271/8/6/02
Whitaker, K. E., van Dokkum, P., Brammer, G., and Franx, M. (2012). The star formation mass sequence out to z = 2.5. Astrophys. J. 754, L29. doi: 10.1088/2041-8205/754/2/L29
Younes, G., Porquet, D., Sabra, B., and Reeves, J. N. (2011). Study of LINER sources with broad Hα emission. X-ray properties and comparison to luminous AGN and X-ray binaries. Astron. Astrophys. 530, A149. doi: 10.1051/0004-6361/201116806
Younes, G., Porquet, D., Sabra, B., Reeves, J. N., and Grosso, N. (2012). Study of liner sources with broad hα emission. spectral energy distribution and multiwavelength correlations. Astron. Astrophys. 539, A104. doi: 10.1051/0004-6361/201118299
Keywords: active galactic nuclei, ionization, morphology, star formation, galaxies
Citation: Márquez I, Masegosa J, González-Martin O, Hernández-Garcia L, Pović M, Netzer H, Cazzoli S and del Olmo A (2017) The AGN Nature of LINER Nuclear Sources. Front. Astron. Space Sci. 4:34. doi: 10.3389/fspas.2017.00034
Received: 25 August 2017; Accepted: 23 October 2017;
Published: 16 November 2017.
Edited by:
Fabio La Franca, Roma Tre University, ItalyReviewed by:
Daniela Bettoni, Osservatorio Astronomico di Padova (INAF), ItalyViviana Casasola, Osservatorio Astrofisico di Arcetri (INAF), Italy
Simonetta Puccetti, Agenzia Spaziale Italiana, Italy
Copyright © 2017 Márquez, Masegosa, González-Martin, Hernández-Garcia, Pović, Netzer, Cazzoli and del Olmo. This is an open-access article distributed under the terms of the Creative Commons Attribution License (CC BY). The use, distribution or reproduction in other forums is permitted, provided the original author(s) or licensor are credited and that the original publication in this journal is cited, in accordance with accepted academic practice. No use, distribution or reproduction is permitted which does not comply with these terms.
*Correspondence: Isabel Márquez, aXNhYmVsQGlhYS5lcw==