 Conor Wildy
 Bozena Czerny
- Center for Theoretical Physics, Polish Academy of Sciences, Warsaw, Poland
Several observed spectral properties of quasars are believed to be influenced by quasar orientation. In this investigation we examine the effect of orientation on the Mg II line located at 2,798 Å in a sample of 36 radio-loud quasars, with orientation angles having been obtained in a previous study using radio observations. We find no significant relationship between orientation angle and either Mg II line full-width at half-maximum or equivalent width. The lack of correlation with inclination angle contradicts previous studies which also use radio data as a proxy for inclination angle and suggests the Mg II emission region does not occupy a disk-like geometry. The lack of correlation with Mg II equivalent width, however, is reported in at least one previous study. Although the significance is not very strong (86%), there is a possible negative relationship between inclination angle and Fe II strength which, if true, could explain the Fe II anti-correlation with [O III] strength associated with Eigenvector 1. Interestingly, there are objects having almost edge-on inclinations while still exhibiting broad lines. This could be explained by a torus which is either clumpy (allowing sight lines to the central engine) or mis-aligned with the accretion disk.
1. Introduction
Active Galactic Nuclei (AGN) are luminous sources powered by accretion onto supermassive black holes at the centres of galaxies. Orientation angles are known to affect the observed properties of AGN. For example it is thought that Type 1 objects, which show broad lines in their unpolarized spectra, have a low inclination angle with respect to the accretion disk axis and therefore enable an unobscured view of the central engine, while Type 2 objects, which only exhibit narrow lines, are thought to be viewed at high inclination and therefore obscured by a dusty torus oriented such that it is co-planar with the accretion disk (Urry and Padovani, 1995). This is supported by the detection of broad lines in polarized light from Type 2 objects (Miller and Goodrich, 1990) and higher column density x-ray absorbers in Type 2 objects compared with Type 1 (Turner and Pounds, 1989). It is plausible that the inclination angle can influence the broad line morphology within the group of Type 1 objects. Studies have already indicated this for Hβ in multi-quasar samples, where the width of the broad emission line is dependent on the inclination angle such that at higher inclinations the line tends to be broader (Wills and Browne, 1986; Runnoe et al., 2013). Such a phenomenon is easily explained by assuming that the bulk of the broad line region (BLR) is located in a flattened disk-like structure, with the observed velocity of an individual BLR cloud (vobs) being related to its intrinsic velocity (vint) by vobs = vintsinθi, where θi is the inclination angle.
Quasars are a luminous sub-category of AGN mostly exhibiting Type 1 features. Many thousands have their observed optical spectra catalogued within the Sloan Digital Sky Survey (SDSS) (Adelman-McCarthy et al., 2008), enabling statistical analysis of large samples of these objects. One such example relevant to quasar inclination angles was that of Shen and Ho (2014) which examined the so-called Eigenvector 1 correlations originally described by Boroson and Green (1992). This correlation is mainly due to the inverse relationship between the strengths of Fe II and the optical narrow lines of [O III], and also shows an inverse relationship between the width of Hβ and its strength. The paper of Shen and Ho (2014) showed that, in a sample of approximately 20,000 objects, [O III] strength is roughly constant at a given Fe II strength, while the full-width at half-maximum (FWHM) of Hβ varies significantly between objects. That paper concluded that this variation in FWHM was due to orientation, while the strength anti-correlation of Fe II with [O III] was not. It was described in Risaliti et al. (2011) that, since the emission of [O III] is probably isotropic and scales with the quasar bolometric luminosity, then it is plausible that [O III] EW tracks the quasar inclination angle, with higher EW indicating higher inclination angle. This was further supported in that paper by examination of the shape of the distribution of EW values. A recent study by Bisogni et al. (2017), revealed that the Mg II equivalent width (EW) was not dependent on [O III] EW, suggesting that the emission of Mg II, unlike the case of [O III], was anisotropic. This is consistent with the postulate that BLR emission is located in a disk-like structure.
In this investigation we test the dependence of Mg II width and strength on inclination angle. To do so we selected objects from those listed in Kuźmicz and Jamrozy (2012), which have direct measurements of quasar orientation obtained from radio data and whose spectra are archived in the SDSS. We improve on the multi-component fit of the underlying continuum in that paper by including the Balmer continuum emission as well as the power-law continuum and broadened Fe II templates, allowing us to obtain more accurate Mg II EW measurements and profile shapes.
2. Objects Used in the Quasar Sample
There are 91 quasars in the Kuźmicz and Jamrozy (2012) paper with optical and radio observations obtained from previous catalogs (see references therein), for which inclination angle measurements were obtainable. Inclination angles were calculated in that study using the follow equation:
where , Sj and Scj are the peak flux density of the lobes appearing closer to and further from the core respectively and α is the spectral index which is assumed to be α = −0.6 from Wardle and Aaron (1997). The constant βj is the jet velocity which, in agreement with Wardle and Aaron (1997) and Arshakian and Longair (2004), was fixed at 0.6c.
Of the 91 quasars are included 43 objects which are categorized as Giant Radio Quasars (GRQs), defined as objects having a radio structure >0.72 Mpc after applying the cosmological parameters of Spergel et al. (2003). As that study was designed to reveal any differences between GRQs and the rest of the radio-loud quasar population, they also selected a comparison sample made up of 48 objects having a smaller radio structure. As their study found on average no statistically significant differences in quasar optical spectra between the two populations, we made no distinction between the two categories and treated all objects as one sample. Only objects having SDSS spectral coverage spanning the entire range 2,300–3,300 Å in the quasar rest frame were subject to analysis, as this allows an adequate span to fit the underlying emission made up of the power-law continuum from the accretion disk, broadened Fe II emission and Balmer continuum emission from the BLR. Finally, only 36 objects from the sample underwent scientific analysis due to: (i) five objects having no SDSS spectra; (ii) 30 objects not meeting the 2,300–3,300 Å criterion; (iii) one object having heavily absorbed Mg II emission; and (iv) 19 objects being unable to be fitted satisfactorily. These 36 objects and their spectral parameters measured in this study are listed in Table 1. All EW values are calculated with respect to the disk power-law continuum.
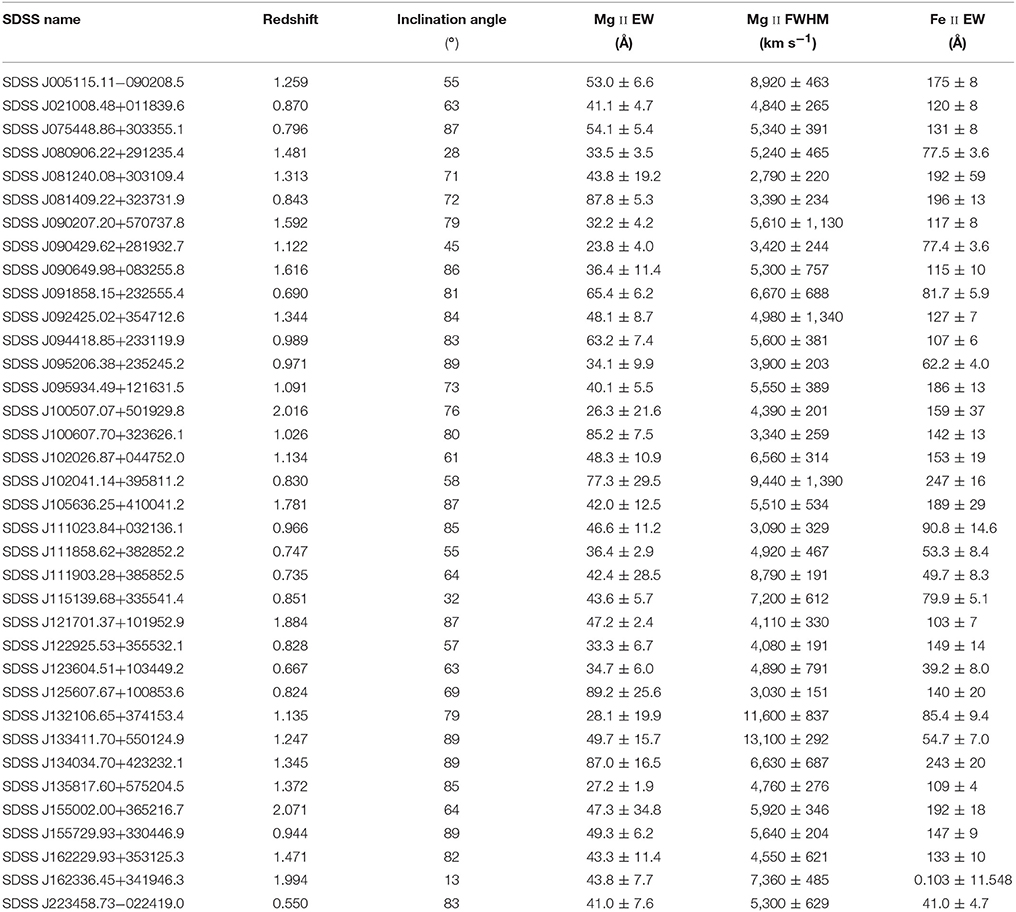
Table 1. List of quasars used for Mg II analysis.
3. Emission Components in the Spectral Region of Mg II
The Mg II line exists in a complex spectral region of the UV known as the “small blue bump” (SBB), whose underlying emission must be accurately reconstructed in order to correctly measure the Mg II strength and width. The SBB consists of a BLR Balmer continuum and Fe II emission made up of many overlapping broadened lines which, as they are blended, give the appearance of continuous emission. The SBB adds to the underlying power-law continuum to give the total continuous emission spanning the wavelengths occupied by the Mg II line. This line itself is modelled using 1 or 2 Gaussian profiles, in the two profile case no significance is assigned to the properties of the individual components, they are used simply to generate the total profile from their sum. The modelled Fe II emission is based on the template of Tsuzuki et al. (2006). The calculation of the Balmer continuum was not performed in the fitting procedure of Kuźmicz and Jamrozy (2012), hence our fitting method represents an important improvement over their technique. The Balmer continuum was calculated using the following equation obtained from Grandi (1982):
where is the BC flux at frequency ν, is the flux of the BC at the Balmer edge (3,646 Å), Te is the electron temperature, k is the Boltzmann constant and h is the Planck constant. The fitting of all three SBB components was performed in a four-step manner for each quasar. First, the power-law continuum was fitted to relatively line-free regions outside the approximate extent of the SBB (less than 2,300 Å and greater than 3,700 Å) using the specfit software within the Image Reduction and Analysis Facility (IRAF). Second, the Fe II template and Balmer continuum were fitted to spectral regions spanning 2,300–2,600 Å and 3,000–3,300 Å using chi-square minimization, after subtraction of the power-law continuum. These wavelength ranges were used as they are neighbouring bands on either side of the Mg II line. The electron temperature of the plasma generating the Balmer continuum was treated as a free parameter and allowed to vary between 4,000 and 20,000 K in steps of 1,000 K, as was the Balmer edge flux which varied in steps of 0.01% of the continuum subtracted quasar flux. For the Fe II template, the free parameters were Gaussian broadening of between 0 and 3,000 km s−1 in steps of 1,000 km s−1 and the normalization, which varied in steps of 0.01% of the continuum subtracted quasar flux. Third, the Mg II model was fitted to each quasar spectrum with the power-law and SBB continuum subtracted, using specfit. Fourth, all four components were simultaneously re-fitted to the region 2,300–3,300 Å using specfit, with only normalizations allowed to vary. An image of an example resultant fit is shown in Figure 1.
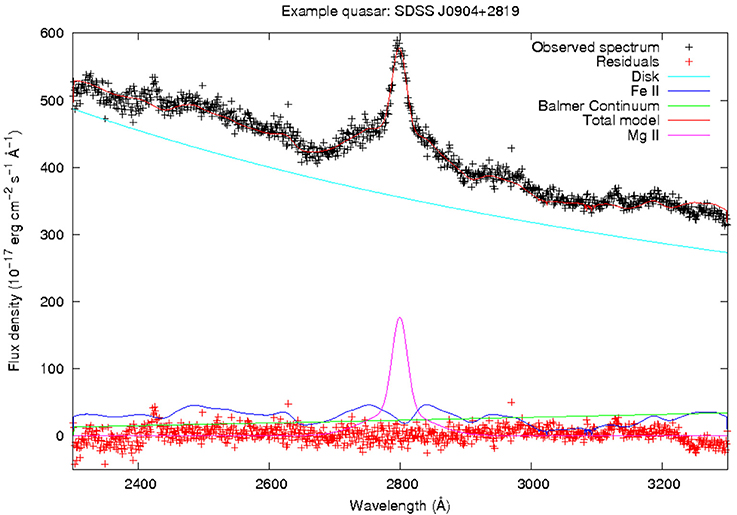
Figure 1. Final fit to the spectrum of quasar SDSS J090429.62+281932.7 (black crosses) showing all four spectral components and the total model. Residuals are the difference between the total model and the observed datapoints.
4. Analysis
4.1. Relationship between Mg II Width and Quasar Inclination Angle
A Pearson test for correlation between the Mg II FWHM and the quasar inclination angle for the 36 objects was performed. This found a probability of 38% that there is an actual correlation between the two variables, indicating that the data is consistent with the null hypothesis (no correlation). Each quasar's FWHM and inclination angle, along with the best-fitting linear trend-line, is illustrated in Figure 2.
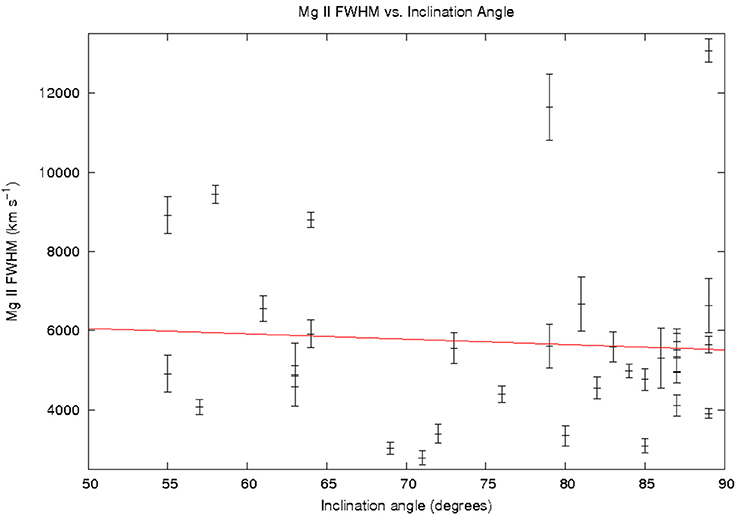
Figure 2. Quasar Mg II FWHM plotted against inclination angle, with vertical bars at each point indicating FWHM 1σ error range for each object. A best-fitting trend line (red) shows a small negative gradient, however a Pearson test indicates no correlation.
4.2. Relationship between Equivalent Width and Inclination Angle
Similar to the procedure for Mg II FWHM, the EW of the line was tested across all 36 quasars using a Pearson test for correlation. This provided a value of 38% likelihood of correlation. Again, this is consistent with the null hypothesis of no correlation. The Fe II EW was also measured over the same wavelength span as the Mg II line, revealing that there may be a hint of a correlation between the Fe II EW and inclination angle since the Pearson test indicates an 86% likelihood of correlation, much higher than for the other cases mentioned so far. If such a correlation does in fact exist, it is likely to be a negative relationship given that the correlation coefficient is negative. The relationship of both Mg II and Fe II EW as a function of inclination angle is illustrated in Figure 3.
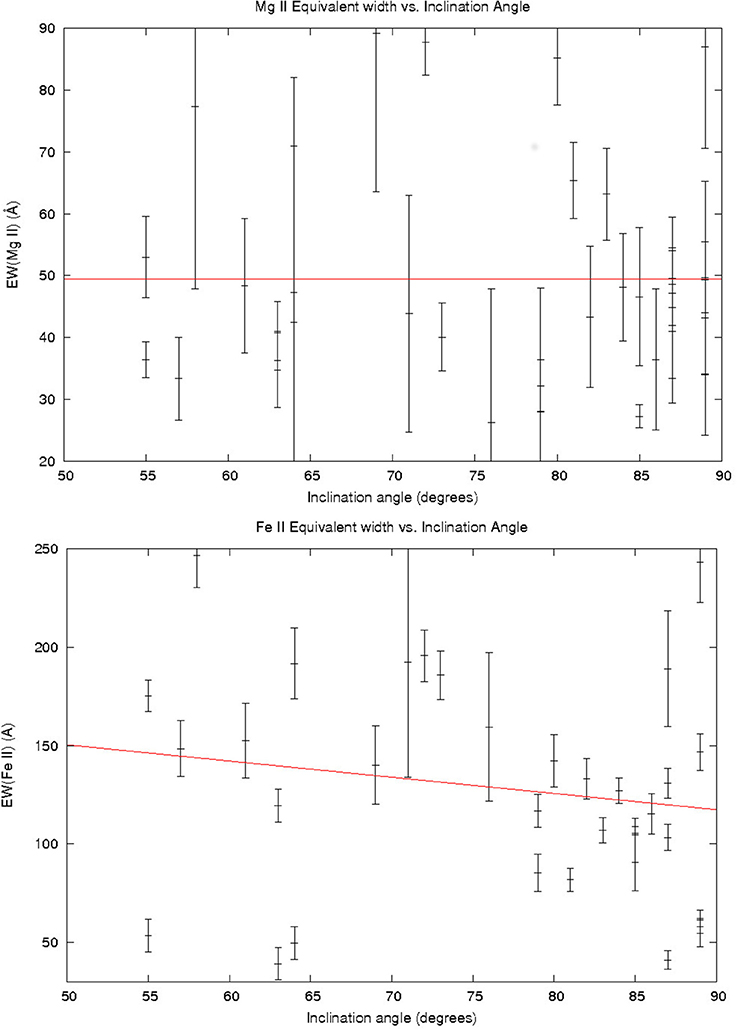
Figure 3. Quasar Mg II EW (top panel) and Fe II EW (bottom panel) plotted against inclination angle along with the respective best-fitting trend lines (red). Vertical bars at each point indicate EW 1σ error range for each object. For Fe II the correlation likelihood is higher (86%) when compared to that of Mg II (38%).
4.3. Broad Line Detection at Large Inclination Angles
One of the most interesting findings from the sample is the detection of broad emission lines at almost edge-on inclinations. This is somewhat surprising as it could be expected that at high inclinations the dusty torus obscures the view to the central source of the quasar. There are several examples of such objects in our sample, one of which is shown in Figure 4.
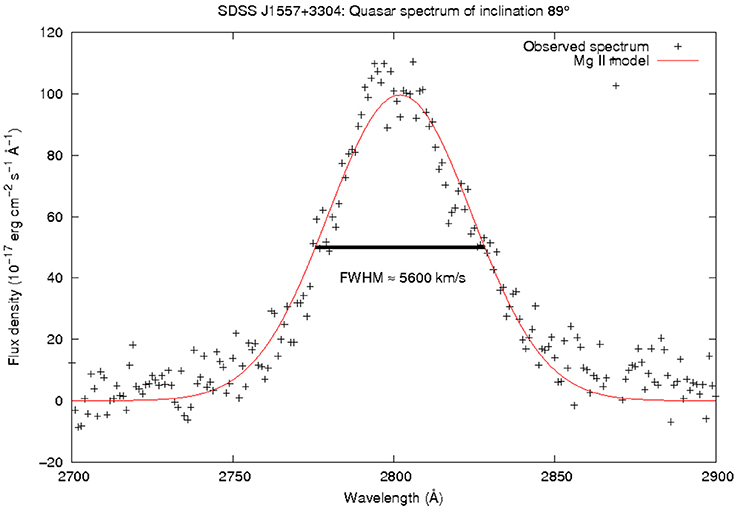
Figure 4. Mg II broad line emission as it appears in the quasar SDSS J155729.93+330446.9. The black crosses indicate the quasar flux after the disk power-law and the SBB emission were subtracted. The red line indicates the model Mg II emission which, at 5,600 km s−1, easily meets the definition of a broad line.
5. Discussion
The fact that we do not detect a correlation between the Mg II broad line width in our sample and the inclination angle is a somewhat surprising result which contradicts reports in other studies. For example, Aars et al. (2005) found a correlation between the radio-derived inclination angle and the Mg II FWHM, which is in accordance with what would be expected if the broad line region, including the Mg II emitting gas, were located in a flattened-disk geometry. A flattened BLR is further supported by the study of Kimball et al. (2011) which found no correlation between the Mg II EW and the ratio of radio core flux to lobe flux, the latter being an inclination indicator. If instead a dependence between these two values was to have been found, this would imply that the broad line emission is substantially more isotropic than that of the accretion disk and therefore that the BLR cannot have a disk geometry. In the case of [O III] the line emission is isotropic and therefore its EW could potentially track the inclination angle (Risaliti et al., 2011).
Like Kimball et al. (2011) our findings also indicate a lack of correlation between Mg II EW and inclination angle. Considering the lack of correlation of either line width or EW with inclination in our study, it is possible that the BLR exists in an intermediate geometry between an isotropically emitting sphere and an anisotropically emitting thin-disk. Possibilities for such geometries include a thick disk, a distorted disk, or some combination of both. This could result in only a weak relationship between inclination and line width, rendering it undetectable in our sample size, while still presenting no strong evidence of isotropic emission from the relationship between inclination angle and line EW. This could explain the correlation between [O III] EW and broad line width seen in Risaliti et al. (2011), as their sample size is much larger than ours, consisting of approximately 6,000 SDSS quasars.
There is no strong indication of a correlation between Fe II EW and inclination (such a conclusion would require a confidence >95%), however it is stronger than the others, at 86%. This correlation, if it exists, is negative. If the [O III] emission is an accurate indicator of inclination, then this would support the findings of Bisogni et al. (2017) and may be a contributor to the anti-correlation between [O III] and Fe II strength found from the Eigenvector 1 relationship (Boroson and Green, 1992). A possible physical explanation for this, if the anti-correlation is true, is the Fe II emission being located in a disk which is even thinner than the accretion disk (Bisogni et al., 2017), however this is speculative. It is not possible to accurately measure the Fe II line widths using our method as there are only three values of broadening used and in many cases more than one value gives an acceptable fit to the spectrum.
The fact that broad lines are visible at high inclinations requires an explanation, since, in the common unification explanation for different AGN types, Type 1 Seyferts/quasars should have an inclination angle lower than approximately 45°. Broad lines are only visible in Type 2 objects in polarized light (Antonucci and Miller, 1985). In fact, most of the objects studied here have inclination angles greater than 45°. If the torus is not smooth but is instead a clumpy structure, then this may allow a line-of-sight toward the central engine in the objects observed. In such a case the probability of detecting a broad line doesn't reach zero even if the inclination angle tends toward 90°. Gas inflow models have given support to a clumpy nature of the dusty torus (Netzer, 2015), providing evidence that this structure is possible. A further possibility is that of the torus being misaligned with the accretion disk in these cases. It should be noted in any case that the Kuźmicz and Jamrozy (2012) selection process necessarily found quasars at high inclination angle, since the selection criteria required objects to have both a large angular size and to be lobe-dominated. Quasars of this kind are very rare in the general quasar population (de Vries et al., 2006) and so our sample objects may have unusual properties compared to those in previous quasar samples compiled to determine the effects of inclination angle on spectral morphology.
Author Contributions
CW was responsible for obtaining and analyzing the data from the SDSS, as well as interpreting the results. BC devised and supervised the project.
Funding
This project was supported by the Polish Funding Agency National Science Centre, project 2015/17/B/ST9/03436/ (OPUS 9).
Conflict of Interest Statement
The authors declare that the research was conducted in the absence of any commercial or financial relationships that could be construed as a potential conflict of interest.
Acknowledgments
This work is based on spectroscopic observations made by the Sloan Digital Sky Survey. Funding for the Sloan Digital Sky Survey IV has been provided by the Alfred P. Sloan Foundation, the U.S. Department of Energy Office of Science, and the Participating Institutions.
References
Aars, C. E., Hough, D. H., Vermeulen, R. C., Readhead, A. C. S., Yu, L. H., Linick, J. P., et al. (2005). Optical spectrophotometry of a complete sample of 3CR lobe-dominated quasars. Astron. J. 130, 23–46. doi: 10.1086/430530
Adelman-McCarthy, J. K., Agüeros, M. A., Allam, S. S., Prieto, C. A., Anderson, K. S. J., Anderson, S. F., et al. (2008). The sixth data release of the sloan digital sky survey. Astrophys. J. Suppl. 175, 297–313. doi: 10.1086/524984
Antonucci, R. R. J., and Miller, J. S. (1985). Spectropolarimetry and the nature of NGC 1068. Astrophys. J. 297, 621–632. doi: 10.1086/163559
Arshakian, T. G., and Longair, M. S. (2004). On the jet speeds of classical double radio sources. Month. Notices R. Astron. Soc. 351, 727–732. doi: 10.1111/j.1365-2966.2004.07823.x
Bisogni, S., Marconi, A., and Risaliti, G. (2017). Orientation effects on spectral emission features of quasars. Month. Notices R. Astron. Soc. 464, 385–397. doi: 10.1093/mnras/stw2324
Boroson, T. A., and Green, R. F. (1992). The emission-line properties of low-redshift quasi-stellar objects. Astrophys. J. Suppl. 80, 109–135. doi: 10.1086/191661
de Vries, W. H., Becker, R. H., and White, R. L. (2006). Double-lobed radio quasars from the sloan digital sky survey. Astron. J. 131, 666–679. doi: 10.1086/499303
Kimball, A. E., Ivezić, Ž., Wiita, P. J., and Schneider, D. P. (2011). Correlations of quasar optical spectra with radio morphology. Astron. J. 141, 182. doi: 10.1088/0004-6256/141/6/182
Kuźmicz, A., and Jamrozy, M. (2012). Optical and radio properties of giant radio quasars: central black hole characteristics. Month. Notices R. Astron. Soc. 426, 851–867. doi: 10.1111/j.1365-2966.2012.21576.x
Miller, J. S., and Goodrich, R. W. (1990). Spectropolarimetry of high-polarization Seyfert 2 galaxies and unified Seyfert theories. Astrophys. J. 355, 456–467. doi: 10.1086/168780
Netzer, H. (2015). Revisiting the unified model of active galactic nuclei. Annu. Rev. Astron. Astrophys. 53, 365–408. doi: 10.1146/annurev-astro-082214-122302
Risaliti, G., Salvati, M., and Marconi, A. (2011). [O III] equivalent width and orientation effects in quasars. Month. Notices R. Astron. Soc. 411, 2223–2229. doi: 10.1111/j.1365-2966.2010.17843.x
Runnoe, J. C., Brotherton, M. S., Shang, Z., Wills, B. J., and DiPompeo, M. A. (2013). The orientation dependence of quasar single-epoch black hole mass scaling relationships. Month. Notices R. Astron. Soc. 429, 135–149. doi: 10.1093/mnras/sts322
Shen, Y., and Ho, L. C. (2014). The diversity of quasars unified by accretion and orientation. Nature 513, 210–213. doi: 10.1038/nature13712
Spergel, D. N., Verde, L., Peiris, H. V., Komatsu, E., Nolta, M. R., Bennett, C. l., et al. (2003). First-Year Wilkinson Microwave Anisotropy Probe (WMAP) Observations: Determination of Cosmological Parameters. Astrophys. J. Suppl. 148, 175–194. doi: 10.1086/377226
Tsuzuki, Y., Kawara, K., Yoshii, Y., Oyabu, S., Tanabe, T., and Matsuoka, Y. (2006). Fe II Emission in 14 Low-Redshift Quasars. I. Observations. Astrophys. J. 650, 57–79. doi: 10.1086/506376
Turner, T. J., and Pounds, K. A. (1989). The EXOSAT spectral survey of AGN. Month. Notices R. Astron. Soc. 240, 833–880. doi: 10.1093/mnras/240.4.833
Urry, C. M., and Padovani, P. (1995). Unified schemes for radio-loud active galactic nuclei. PASP 107, 803. doi: 10.1086/133630
Wardle, J. F. C., and Aaron, S. E. (1997). How fast are the large-scale jets in quasars? Constraints on both Doppler beaming and intrinsic asymmetries. Month. Notices R. Astron. Soc. 286, 425–435. doi: 10.1093/mnras/286.2.425
Keywords: active galaxies, accretion, broad line region, Mg II, spectroscopy
Citation: Wildy C and Czerny B (2017) The Relationship between Mg II Broad Emission and Quasar Inclination Angle Front. Astron. Space Sci. 4:43. doi: 10.3389/fspas.2017.00043
Received: 31 August 2017; Accepted: 30 October 2017;
Published: 14 November 2017.
Edited by:
Mauro D'Onofrio, Universita degli Studi di Padova, ItalyReviewed by:
Giovanna Maria Stirpe, Osservatorio astronomico di Bologna (INAF), ItalyMilan S. Dimitrijevic, Belgrade Astronomical Observatory, Serbia
Copyright © 2017 Wildy and Czerny. This is an open-access article distributed under the terms of the Creative Commons Attribution License (CC BY). The use, distribution or reproduction in other forums is permitted, provided the original author(s) or licensor are credited and that the original publication in this journal is cited, in accordance with accepted academic practice. No use, distribution or reproduction is permitted which does not comply with these terms.
*Correspondence: Conor Wildy, d2lsZHlAY2Z0LmVkdS5wbA==