 Michael M. Fausnaugh1,2*
 Bradley M. Peterson1,3,4
 David A. Starkey5,6Keith Horne5 and the AGN STORM Collaboration
- 1Department of Astronomy, Ohio State University, Columbus, OH, United States
- 2MIT Kavli Institute for Astrophysics and Space Research, Cambridge, MA, United States
- 3Center for Cosmology and AstroParticle Physics, Ohio State University, Columbus, OH, United States
- 4Space Telescope Science Institute, Baltimore, MD, United States
- 5SUPA Physics and Astronomy, University of St. Andrews, Scotland, United Kingdom
- 6Department of Astronomy, University of Illinois at Urbana-Champaign, Urbana, IL, United States
We show recent detections of inter-band continuum lags in three AGN (NGC 5548, NGC 2617, and MCG+08-11-011), which provide new constraints on the temperature profiles and absolute sizes of the accretion disks. We find lags larger than would be predicted for standard geometrically thin, optically thick accretion disks by factors of 2.3–3.3. For NGC 5548, the data span UV through optical/near-IR wavelengths, and we are able to discern a steeper temperature profile than the T ~ R−3/4 expected for a standard thin disk. Using a physical model, we are also able to estimate the inclinations of the disks for two objects. These results are similar to those found from gravitational microlensing of strongly lensed quasars, and provide a complementary approach for investigating the accretion disk structure in local, low luminosity AGN.
1. Introduction
Active galactic nuclei (AGN) are the markers of rapidly accreting super-massive black holes (SMBHs). The current picture of the sub-parsec scale structure of an AGN includes three main components: an accretion disk around the SMBH, a region of high-velocity gas (the “broad line region,” BLR), and a hot, X-ray emitting “corona.” Although this simple model can explain the observed features of AGN spectra, the detailed geometry and dynamics of the accretion disk, BLR, and corona are largely unknown. The sub-parsec scale structures are unresolved in even the closest AGN, so additional information must be obtained by indirect means.
Reverberation mapping (Blandford and McKee, 1982; Peterson, 1993, 2014) has emerged as a powerful way to probe these compact structures in the central parts of AGN. The principle of reverberation mapping is to search for time-variable flux signals and their light echoes, which encode information about these unresolved structures. For example, gas in the BLR reprocesses variations in the ionizing continuum flux from the accretion disk as variable emission line flux after a time delay that scales with the light-crossing time of the BLR. Measuring this time delay therefore provides a straightforward estimate of the BLR's spatial extent.
More recently, reverberation mapping techniques have been used to examine the structure of AGN accretion disks. A standard geometrically thin, optically thick accretion disk has a temperature profile of T ~ R−3/4 (Shakura and Sunyaev, 1973), so that the hot, inner parts of the accretion disk emit UV photons (~10–3,000 Å), while the cooler, outer annuli emit in the optical and near IR (~3,000–10,000 Å). If variations at shorter wavelengths (from the X-ray emitting corona or the inner edge of the disk) irradiate the outer annuli and drive longer wavelength variations, we expect a time delay between the UV and optical continuum variations that is proportional to the size of the accretion disk (Krolik et al., 1991).
Most attempts to measure continuum lags have not been able to detect time delays at >3σ (e.g., Sergeev et al., 2005; Arévalo et al., 2008; Breedt et al., 2010; Lira et al., 2015; Gliozzi et al., 2016; Troyer et al., 2016; Buisson et al., 2017; Jiang et al., 2017). The primary limitation is obtaining continuous, well-sampled (of order 1 day or less) light curves on time scales of weeks to months. However, Shappee et al. (2014) were able to detect continuum lags at high significance in NGC 2617 using rapid cadence Swift and ground-based light curves from observations spanning several weeks. Here, we report on recent detections of inter-band continuum lags in two other objects, NGC 5548 and MCG+08-11-011, as well as results from continued monitoring of NGC 2617.
2. AGN Storm
The AGN Space Telescope and Optical Reverberation Mapping project (STORM, De Rosa et al., 2015) is the most ambitious reverberation mapping experiment to date. We monitored the Seyfert 1 galaxy NGC 5548 for 6 months in 2014 with an unprecedented combination of cadence and wavelength coverage. The project was anchored by 171 observations with the Cosmic Origins Spectrograph onboard HST, and additional data were supplied by Chandra (Mathur et al., 2017) and Swift (Edelson et al., 2015), as well as a global compliment of ground-based observatories (Fausnaugh et al., 2016). We obtained light curves with approximately daily cadence over the six month baseline, at wavelengths in the far UV (1,100–1,700 Å with HST), near UV (1,900–2,600 Å with Swift), and optical/near IR (Johnson/Cousins UBVRI and SDSS ugriz).
Lags between the continuum emission at different wavelengths (and their uncertainties) were estimated in two ways: traditional cross-correlation techniques (the interpolated cross-correlation function and flux redistribution/random subset sampling; Gaskell and Peterson, 1987; White and Peterson, 1994) and a Bayesian model that infers the response function for an input driving light curve and its light echoes (JAVELIN; Zu et al., 2011). In both cases, the estimated lags agree and are detected at high significance. We measure the continuum lags relative to the light curve for emission at 1,367 Å, and the results are shown in Figure 1.
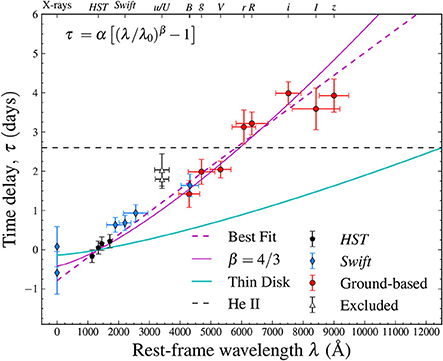
Figure 1. Time delays between inter-band continuum light curves as a function of rest-frame effective wavelength, adapted from Fausnaugh et al. (2016). The time delays are interpreted as reverberations across the accretion disk, with short-wavelength variations driving longer wavelengths. The time delays are measured relative to variations at 1,367 Å and the equation in the upper left corner describes the generic form of the lag-wavelength relation in a geometrically thin accretion disk, normalized to λ0 = 1,367 Å. The best fit to this relation (with α and β as free parameters) is shown with the dashed magenta line. The excluded points (from the u/U-band light curves) are noticeable outliers, likely because of contamination by Balmer continuum emission originating in the broad line region, and are excluded from the fit (see Fausnaugh et al., 2016 for details). The normalization parameter α can be predicted from the SMBH mass and mass accretion rate—based on values for NGC 5548 (see section 2), we show this prediction with the cyan line. The best-fit value is a factor of 3 larger than this prediction. A standard thin disk also has a temperature profile T ∝ R−3/4, which predicts β = 4/3. We show a fit with β fixed to 4/3 by the solid magenta line. Although the best fit is consistent with β = 4/3 at the 2σ level, physical modeling shows that the data strongly prefer a steeper temperature profile of T ~ R−1 (Starkey et al., 2017). Finally, the horizontal dashed black line shows the lag of the high-ionization state lines He II λ1640 and λ4686 relative to the 1,367 Å light curve—the lag is 2.45 days, slightly larger than the lag of the V-band light curve.
Assuming a disk reprocessing model, we can translate the observed lag-wavelength relation in Figure 1 to a wavelength dependent emissivity profile, which in turn depends on the temperature profile of the disk. For a given temperature profile T ~ Rβ, we expect that R ~ λ−1/β, and we take the lag τ as a measurement of the light crossing time across the disk R/c. The best fit yields β = 1.01 ± 0.14 (dashed magenta line in Figure 1), and is statistically consistent (~ 2σ) with the prediction for a standard thin disk (β = −3/4, solid magenta line in Figure 1). For comparison, the prediction for an T ~ R−3/4 thin disk is shown by the dashed magenta lines in Figure 1.
In addition, the magnitude of the lags provides information about the absolute size of the disk. In the standard thin accretion disk model, gravitational potential energy is converted into heat and radiation, and the product MBHṀ determines the temperature at the inner edge of the disk. Combined with the temperature profile, this information sets the disk's radial scale—for a fixed black hole mass, a higher accretion rate disk will appear larger at a given wavelength. We adopt a black hole mass of 5.2 × 10⁷ M⊙, determined from reverberation mapping of the Hβ emission line (Grier et al., 2012), and we assume an accretion rate of 10% of the Eddington rate, typical of Type 1 Seyfert galaxies (this value is similar to what would be inferred from the optical luminosity at 5,100 Å, see Netzer, 2013; Fausnaugh et al., 2016). For these parameters, the model prediction is shown by the cyan line in Figure 1, which underestimates the observed lag-wavelength relation by a factor of 3. In fact, the continuum lags are large enough (~2 light days from the 1,367 Å emission to the V-band) that they are comparable to the lags of the high-ionization state emission lines (such as HeII, which has a lag relative to the 1,367 Å emission of 2.45 days, shown by the black dashed horizontal line in Figure 1). This suggests that at least part of the BLR and continuum emitting source are of a similar physical size, if they are not identical or contiguous.
This result is fairly insensitive to other parameters in the thin disk reprocessing model, such as the fraction of heating due to X-rays and the assumed radiative efficiency of matter falling onto the black hole (Fausnaugh et al., 2016). We have also taken into account the contribution of emission from a range of disk radii at a given wavelength by estimating R with the flux-weighted mean radius across the entire disk. However, we ignored the inner edge of the disk in this calculation, instead anchoring the physical radius for emission at 1,367 Å (which has zero lag by definition) by extrapolating the fit to zero wavelength. In practice, the inner edge of the disk already makes significant contributions to emission at 1,367 Å and the relation is expected to turn over at shorter wavelengths, although this difference is small compared to the radii at which the disk emits in the optical (~2 light days).
More recently, Starkey et al. (2016) developed a physical model for inferring accretion disk properties from continuum reverberation mapping data (the Continuum REprocessing AGN MCMC code, CREAM). CREAM uses Bayesian methods to infer the input driving light curve required to produce the observed light curves as reverberation signals, as well as the detailed transfer functions in a thin disk reprocessing model. The parameters of the model are the temperature normalization at a fiducial radius (which is related to the product MBHṀ), the power-law index of the disk's temperature profile, and the inclination of the disk. The model also takes into account changes in the disk's spectrum due to instantaneous perturbations in the local disk temperature from variable irradiation.
For NGC 5548, results from CREAM are detailed by Starkey et al. (2017), who find a temperature profile power-law index consistent with the fit to the lags described above (0.99 ± 0.03), but with a much smaller uncertainty that rules out T ~ R−3/4. CREAM also finds an inclination of 36 ± 10 degrees, and the temperature at the inner edge of the disk is consistent with the mass accretion rate required to explain the large continuum lags. However, this accretion rate is well above the Eddington limit and inconsistent with the observed optical luminosity. Finally, there is a poor match between the inferred driving light curve and the X-ray light curves from Swift XRT, as shown in Figure 2. The X-ray variations are usually taken to drive the reprocessed variations at longer wavelengths because they are energetically dominant over the UV/optical variations (though this is not always the case, see for example Breedt et al., 2010), and the corona is believed to be compact and centrally located near the SMBH. However, the poor correlation shown in Figure 2 suggests that the X-rays do not directly drive the UV/optical variations, which is problematic for standard disk reprocessing models.
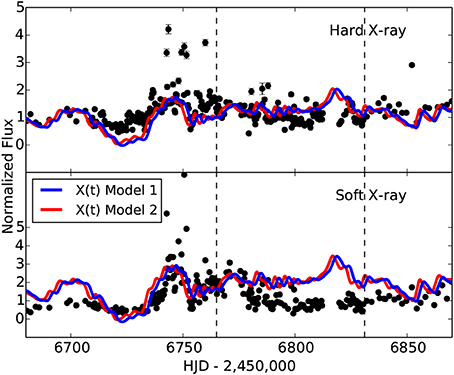
Figure 2. Comparison of the observed X-ray light curve from Swift (black points) and the inferred driving continuum light curve from CREAM (solid lines), reproduced from Starkey et al. (2017). The top panel is the hard X-ray (0.8–10 keV) light curve, the bottom panel is the soft X-ray light curve (0.3–0.8 keV). The blue line is for a model with the temperature profile of the disk fixed to T ~ R−3/4, the red line is for a model with the temperature profile left as a free parameter (the best fit is T ~ R−0.99 ± 0.03). The poor correlation shows that the observed X-ray light curve does not directly drive the variations in the UV/optical, which may be problematic for disk reprocessing models.
3. AGN 2014 Reverberation Mapping Campaign
In 2014, we monitored 10 other AGN besides NGC 5548. Space-based resources were not available for these targets—our main goal was to use spectroscopic observations to derive SMBH masses from continuum-Hβ lags. These results are presented by Fausnaugh et al. (2017). However, a unique addition to this campaign was the acquisition of high-quality multi-band imagining on approximately daily cadence, which allowed us to search for optical continuum reverberation signals.
We chose to measure lags relative to the g-band, as this is our bluest light curve that is relatively free of BLR emission (Balmer continuum emission is likely present in the u-band for these objects, see Fausnaugh et al., 2016). For two of our targets, we detected inter-band continuum lags at a statistically significant level: MCG+08-11-011 and NGC 2617 (Fausnaugh et al., submitted). Lags measured from the JAVELIN analysis are shown in Figure 3. As expected for the disk-reprocessing model, we generally find larger lags at longer wavelengths, though both objects show outliers and the lag-wavelength relation for NGC 2617 is consistent with a flat relation if the g/V-band lags are outliers. We also compared these results to the theoretical predictions described in section 2, based on the measured black hole masses from Fausnaugh et al. (2017), and accretion rate estimates from the observed optical luminosity at 5,100 Å (Netzer, 2013). Because of the shorter wavelength range of these data (ugriz and Johnson V-band), we fixed the lag-wavelength relation to τ ~ λ4/3 when fitting for the absolute size of the disk.
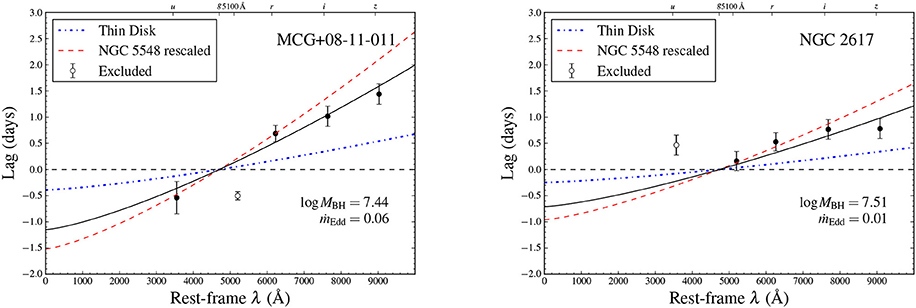
Figure 3. Continuum reverberation mapping results for two objects from the 2014 AGN monitoring campaign, adapted from Fausnaugh et al. (submitted). Only optical data were available for this campaign, and inter-band lags were therefore measured relative to the g-band light curve. The solid black line shows the best fit lag-wavelength relation for a disk with temperature profile fixed to T ~ R−3/4 (β = 4/3). The dot-dashed blue lines show the predicted normalization, based on the black hole masses and Eddington ratios given in the lower right hand corner of each panel (as measured by Fausnaugh et al. 2017). The dashed red lines show the fit to NGC 5548 from the STORM campaign rescaled to the parameters of these systems assuming standard thin-disk theory. The similarity of the solid black and dashed red lines suggests that, after extrapolating to UV wavelengths, the disks are larger than standard predictions by a similar amount as in NGC 5548. The excluded points were identified as outliers (again likely due to contamination by broad line region emission) and are discussed in detail by Fausnaugh et al. (submitted).
We find similar results as in NGC 5548, with larger observed disk sizes compared to theoretical expectations: a factor of 3.3 in MCG+08-11-011 (a 7.2σ result) and a factor of 2.3 in NGC 2617 (a 2.3σ result, which probably also captures the possibility of a flat lag-wavelength relation/unresolved lags). For comparison, we rescaled the observed NGC 5548 lag-wavelength relation from the STORM campaign, using the same theoretical dependence on black hole mass and mass accretion rate—these relations are shown by the red lines in Figure 3, and are generally consistent with the best fit.
We also analyzed these data using the CREAM physical model. We again fixed the temperature profile power-law index to −3/4, and we found temperatures at the inner edge of the disk hotter than would be implied by the SMBH masses and mass accretion rates derived from the optical luminosity. As described in section 2, this is consistent with large disk sizes inferred from the continuum lags. For MCG+08-11-011, we were unable to constrain the disk's inclination, and therefore fixed this parameter to 0 degrees for the final fit. For NGC 2617, we found an inclination of 43 ± 20 degrees. Given uncertainties in the black hole mass, bolometric corrections, and radiative efficiency, as well as systematic uncertainties such as internal extinction and possible kinematic luminosity in outflows, there are large uncertainties on the predictions for the temperature at the inner edge of the disk. It seems that the disk in NGC 2617 may be consistent with a standard thin disk model, while the total discrepancy in MCG+08-11-011 is difficult to explain with these uncertainties.
NGC 2617 provides a special test case for disk models, since Shappee et al. (2014) also measured the disk size from multi-wavelength monitoring data taken in 2013. The lags we measure here are consistent with those from Shappee et al. (2014) to within ~3σ, but are systematically smaller. This could be caused by two effects. First is a physical change in the disk. The dynamical time at ~1 light day from the black hole in NGC 2617 is ~1 month, so a bulk change in the accretion flow between 2013 and 2014 cannot be ruled out. The size of the disk is also expected to scale with luminosity, and NGC 2617 was a factor of 1.8 less luminous in 2014 than in 2013. However, this scaling of disk size with luminosity is based on a variable accretion rate, and the structure of the disk would then be predicted to respond on the viscous time scale (several decades to centuries for AGN accretion disks; see LaMassa et al., 2015).
An alternative interpretation is systematic effects in the reverberation mapping measurement. The observed time delay is not independent of the auto-correlation of the driving light curve, and the observed continuum variations are very different in the 2014 monitoring campaign compared to the data from 2013. In 2014, the variations are much more rapid and have a smaller amplitude, which will generally result in smaller lags and therefore a smaller inferred disk size (Goad and Korista, 2014).
4. Conclusions
We have reviewed recent detections of inter-band continuum lags in three AGN, NGC 5548, MCG+08-11-011, and NGC 2617. Our results suggest either larger accretion disks compared to theoretical expectations, or higher mass accretion rates than would be inferred from the optical luminosity. For the highest quality data and best wavelength coverage (AGN STORM observations of NGC 5548), there is also evidence of a departure from a standard temperature profile, with physical modeling preferring T ~ R−1.
These results corroborate those from gravitational microlensing of strongly lensed quasars, which also find larger disks sizes than expected and a range of temperature profiles (Blackburne et al., 2011; Mosquera et al., 2013; Jiménez-Vicente et al., 2014). Continuum reverberation mapping therefore promises to be a crucial avenue for further research into the structure of AGN accretion disks, especially for local and low-luminosity sources that are not accessible through microlensing. Several successful Swift proposals and ground-based observing campaigns are currently monitoring many more AGN in order to increase the sample of disk measurements (NGC 4151, Edelson et al., 2017, Mrk 509, PI: Edelson; NGC 4395, PI: McHardy, the LCO AGN Key project, PI: Horne).
Author Contributions
MF: wrote the manuscript and performed the photometric and time-series analysis; DS: developed and ran the CREAM models; BP and KH: advised this work; The AGN STORM collaboration consists of over 100 astronomers from around the world, with observers, theoreticians, and observatory directors/PIs, providing support, comments, and telescope time.
Funding
This work was supported by a Presidential Fellowship awarded to MF buy the Ohio State University. NSF grant AST-1008882 and STScI Grant GO-13330 supported MF and BP. KH acknowledges support from STFC grant ST/M001296/1.
Conflict of Interest Statement
The authors declare that the research was conducted in the absence of any commercial or financial relationships that could be construed as a potential conflict of interest.
Acknowledgments
Based on observations made with the NASA/ESA Hubble Space Telescope. This research has made use of the XRT Data Analysis Software (XRTDAS) developed under the responsibility of the ASI Science Data Center (ASDC), Italy. This work is based on observations obtained at the MDM Observatory, operated by Dartmouth College, Columbia University, Ohio State University, Ohio University, and the University of Michigan. This paper is partly based on observations collected at the Wise Observatory with the C18 telescope. The C18 telescope and most of its equipment were acquired with a grant from the Israel Space Agency (ISA) to operate a Near-Earth Asteroid Knowledge Center at Tel Aviv University. The Fountainwood Observatory would like to thank the HHMI for its support of science research for undergraduate students at Southwestern University. This research has made use of NASA's Astrophysics Data System, as well as the NASA/IPAC Extragalactic Database (NED) which is operated by the Jet Propulsion Laboratory, California Institute of Technology, under contract with the National Aeronautics and Space Administration.
References
Arévalo, P., Uttley, P., Kaspi, S., Breedt, E., Lira, P., and McHardy, I. M. (2008). Correlated X-ray/optical variability in the quasar. Mon. Not. R. Astron. Soc. 389, 1479–1488. doi: 10.1111/j.1365-2966.2008.13719.x
Blackburne, J. A., Pooley, D., Rappaport, S., and Schechter, P. L. (2011). Sizes and temperature profiles of quasar accretion disks from chromatic microlensing. Astrophys. J. 729:34. doi: 10.1088/0004-637X/729/1/34
Blandford, R. D., and McKee, C. F. (1982). Reverberation mapping of the emission line regions of Seyfert galaxies and quasars. Astrophys. J. 255, 419–439.
Breedt, E., McHardy, I. M., Arévalo, P., Uttley, P., Sergeev, S. G., Minezaki, T., et al. (2010). Twelve years of X-ray and optical variability in the Seyfert galaxy NGC 4051. Mon. Not. R. Astron. Soc. 403, 605–619. doi: 10.1111/j.1365-2966.2009.16146.x
Buisson, D. J. K., Lohfink, A. M., Alston, W. N., and Fabian, A. C. (2017). Ultraviolet and X-ray variability of active galactic nuclei with Swift. Mon. Not. R. Astron. Soc. 464, 3194–3218. doi: 10.1093/mnras/stw2486
De Rosa, G., Peterson, B. M., Ely, J., Kriss, G. A., Crenshaw, D. M., Horne, K., et al. (2015). Space telescope and optical reverberation mapping project. I. Ultraviolet observations of the seyfert 1 galaxy NGC 5548 with the cosmic origins spectrograph on hubble space telescope. Astrophys. J. 806:128. doi: 10.1088/0004-637X/806/1/128
Edelson, R., Gelbord, J. M., Horne, K., McHardy, I. M., Peterson, B. M., Arevalo, P., et al. (2015). Space telescope and optical reverberation mapping project. II. SWIFT and HST reverberation mapping of the accretion disk oF NGC 5548. Astrophys. J. 806:129. doi: 10.1088/0004-637X/806/1/129
Edelson, R., Gelbord, J. M., Cackett, E., Connolly, S., Done, C., Fausnaugh, M., et al. (2017). Swift monitoring of NGC 4151: evidence for a second X-ray/UV reprocessing. Astrophys. J. 840:41. doi: 10.3847/1538-4357/aa6890
Fausnaugh, M. M., Denney, K. D., Barth, A. J., Bentz, M. C., Bottorff, M. C., Carini, M. T., et al. (2016). Space telescope and optical reverberation mapping project. III. optical continuum emission and broadband time delays in NGC 5548. Astrophys. J. 821:56. doi: 10.3847/0004-637X/821/1/56
Fausnaugh, M. M., Grier, C. J., Bentz, M. C., Denney, K. D., De Rosa, G., Peterson, B. M., et al. (2017). Reverberation mapping of optical emission lines in five active galaxies. Astrophys. J. 840:97. doi: 10.3847/1538-4357/aa6d52
Gaskell, C. M., and Peterson, B. M. (1987). The accuracy of cross-correlation estimates of quasar emission-line region sizes. Astrophys. J. 65, 1–11. doi: 10.1086/191216
Gliozzi, M., Papadakis, I. E., Grupe, D., Brinkmann, W. P., and Raeth, C. (2016). Long-term monitoring of Ark 120 with Swift. Mon. Not. R. Astron. Soc. 464, 3955–3964. doi: 10.1093/mnras/stw2636
Goad, M. R., and Korista, K. T. (2014). Interpreting broad emission-line variations - I. Factors influencing the emission-line response. Mon. Not. R. Astron. Soc. 444, 43–61. doi: 10.1093/mnras/stu1456
Grier, C. J., Peterson, B. M., Pogge, R. W., Denney, K. D., Bentz, M. C., Paul Martini, et al. (2012). Reverberation mapping results for five Seyfert 1 galaxies. Astrophys. J. 755:60. doi: 10.1088/0004-637X/755/1/60
Jiang, Y.-F., Green, P. J., Green, J. E., Morganson, E., Shen, Y., Pancoast, A., et al. (2017). Detection of time lags between Quasar Continuum Emission Bands based on Pan-STARRS Light Curves. Astrophys. J. 836:186. doi: 10.3847/1538-4357/aa5b91
Jiménez-Vicente, J., Mediavilla, E., Kochanek, C. S., Muñoz, J. A., Motta, V., Falco, E., et al. (2014). The average size and temperature profile of quasar accretion disks. Astrophys. J. 783:47. doi: 10.1088/0004-637X/783/1/47
Krolik, J. H., Horne, K., Kallman, T. R., Malkan, M. A., Edelson, R. A., and Kriss, G. A. (1991). Ultraviolet variability of NGC 5548: dynamics of the continuum production region and geometry of the broad-line region. Astrophys. J. 371, 541.
Lira, P., Arévalo, P., Uttley, P., McHardy, I. M. M., and Videla, L. (2015). Long-term monitoring of the archetype Seyfert galaxy MCG-6-30-15: X-ray, optical and near-IR variability of the corona, disc and torus. Mon. Not. R. Astron. Soc. 454, 368–379. doi: 10.1093/mnras/stv1945
LaMassa, S. M., Cales, S., Moran, E. C., Myers, A. D., Richards, G. T., Eracleous, M., et al. (2015). The discovery of the first “changing look” quasar: new insights into the physics and phenomenology of active galactic nuclei. Astrophys. J. 800:144. doi: 10.1088/0004-637X/800/2/144
Mathur, S., Gupta, A., Page, K., Pogge, R. W., Krongold, Y., Goad, M. R., et al. (2017). Space telescope and optical reverberation mapping project. VII. Understanding the ultraviolet anomaly in NGC 5548 with X-Ray spectroscopy. Astrophys. J. 846, 55. doi: 10.3847/1538-4357/aa832b
Mosquera, A. M., Kochanek, C. S., Chen, B., Dai, X., Blackburne, J. A., and Chartas, G. (2013). The structure of the X-ray and optical emitting regions of the lensed Quasar Q 2237+0305. Astrophys. J. 769:53. doi: 10.1088/0004-637X/769/1/53
Netzer, H. (2013). The Physics and Evolution of Active Galactic Nuclei. Cambridge, UK: Cambridge University Press.
Peterson, B. M. (1993). Reverberation mapping of active galactic nuclei. PASP 105, 247–268. doi: 10.1086/133140
Peterson, B. M. (2014). Measuring the masses of supermassive black hole. Space Sci. Rev. 183, 253–275. doi: 10.1007/s11214-013-9987-4
Sergeev, S. G., Doroshenko, V. T., Golubinskiy, Y. V., Merkulova, N. I., and Sergeeva, E. A. (2005). Lag-luminosity relationship for interband lags between variations in B, V, R, and I bands in active galactic nuclei. Astrophys. J. 622, 129–135. doi: 10.1086/427820
Shakura, N. I., and Sunyaev, R. A. (1973). Black holes in binary systems. Observational appearance. Astron. Astrophys. 24, 337–355.
Shappee, B. J., Prieto, J. L., Grupe, D., Kochanek, C. S., Stanek, K. Z., De Rosa, G., et al. (2014). The man behind the curtain: X-rays drive the UV through NIR variability in the 2013 active galactic nucleus outburst in NGC 2617. Astrophys. J. 788:48. doi: 10.1088/0004-637X/788/1/48
Starkey, D. A., Horne, K., and Villforth, C. (2016). Accretion disc time lag distributions: applying CREAM to simulated AGN light curves. Mon. Not. R. Astron. Soc. 456, 1960–1973. doi: 10.1093/mnras/stv2744
Starkey, D., Horne, K., Fausnaugh, M. M., Peterson, B. M., Bentz, M. C., Kochanek, C. S., et al. (2017). Space telescope and optical reverberation mapping project. VI. Reverberating disk models foR NGC 5548. Astrophys. J. 835:65. doi: 10.3847/1538-4357/835/1/65
Troyer, J., Starkey, D., Cackett, E. M., Bentz, M. C., Goad, M. R., Horne, K., et al. (2016). Correlated X-ray/ultraviolet/optical variability in NGC 6814. Mon. Not. R. Astron. Soc. 456, 4040–4050. doi: 10.1093/mnras/stv2862
White, R. J., and Peterson, B. M. (1994). Comments on cross-correlation methodology in variability studies of active galactic nuclei. PASP 106, 879–889. doi: 10.1086/133456
Keywords: AGN continuum, galaxies: active, individual: NGC5548, NGC2617, MCG+08-11-011
Citation: Fausnaugh MM, Peterson BM, Starkey DA, Horne K and the AGN STORM Collaboration (2017) Continuum Reverberation Mapping of AGN Accretion Disks. Front. Astron. Space Sci. 4:55. doi: 10.3389/fspas.2017.00055
Received: 01 October 2017; Accepted: 20 November 2017;
Published: 05 December 2017.
Edited by:
Mauro D'Onofrio, Universitá degli Studi di Padova, ItalyReviewed by:
Dragana Ilic, University of Belgrade, SerbiaGiovanna Maria Stirpe, Osservatorio Astronomico di Bologna (INAF), Italy
Copyright © 2017 Fausnaugh, Peterson, Starkey, Horne and the AGN STORM Collaboration. This is an open-access article distributed under the terms of the Creative Commons Attribution License (CC BY). The use, distribution or reproduction in other forums is permitted, provided the original author(s) or licensor are credited and that the original publication in this journal is cited, in accordance with accepted academic practice. No use, distribution or reproduction is permitted which does not comply with these terms.
*Correspondence: Michael M. Fausnaugh, ZmF1c0BtaXQuZWR1