Abstract
We present preliminary results of a spectroscopic analysis for a sample of type 1 highly accreting quasars (L/LEdd ~ 1.0) at high redshift, z ~2–3. The quasars were observed with the OSIRIS spectrograph on the GTC 10.4 m telescope located at the Observatorio del Roque de los Muchachos in La Palma. The highly accreting quasars were identified using the 4D Eigenvector 1 formalism, which is able to organize type 1 quasars over a broad range of redshift and luminosity. The kinematic and physical properties of the broad line region have been derived by fitting the profiles of strong UV emission lines such as Aliiiλ1860, Siiii]λ1892 and Ciii]λ1909. The majority of our sources show strong blueshifts in the high-ionization lines and high Eddington ratios which are related with the productions of outflows. The importance of highly accreting quasars goes beyond a detailed understanding of their physics: their extreme Eddington ratio makes them candidates standard candles for cosmological studies.
1. 4DE1 main sequence
The 4D Eigenvector 1 (4DE1) formalism has been successful in arranging the type 1 AGN based on their spectral properties (Sulentic et al., 2000). Four observational parameters define four dimensions of the Eigenvector 1: the full width at half maximum (FWHM) of Hβ broad component (HβBC), the strength of optical Feii blend at 4570Å described by the ratio RFeII = I(Feii)/I(HβBC), the velocity shift of the Civλ1549 profile, and soft X-ray photon index (Γsoft). The main correlation between these properties is provided by the optical parameters, FWHM(HβBC) and the RFeII, which define the 4DE1 optical plane.
Changes in the spectroscopic features at FWHM(Hβ) = 4,000 km s−1 causes the identification of two populations: A and B. Sources with FWHM(Hβ) ≤ 4,000 km s−1 are cataloged as population A. In this population the broad component (BC) of the low-ionization emission lines (LIL; ionization potential IP ≲ 20 eV) can be very well-model by a Lorentzian profile, for example in the case of Hβ emission. They also show a high intensity of Feii, large asymmetries in the high ionization lines (HIL; IP > 40 eV), like Civλ1549, and an excess in the soft X-rays region. The majority of them are radio quiet sources. On the other hand, population B sources have a broader profile (FWHM; HβBC) > 4,000 km s−1). In this population the Hβ emission is redward asymmetric and it is modeled with two gaussian profiles. One of them corresponds to the BC located at the rest-frame, and the other is associated with a redshifted very broad component (VBC), which reaches widths ~10,000 km s−1. The Feii intensity in these sources is weak and there is no large asymmetries in the HIL profiles. The domain at FWHM > 4,000 km s−1 is mostly populated by radio loud objects (Zamfir et al., 2010).
Along optical 4DE1 diagram we find different subpopulations (Sulentic et al., 2002), which are shown in the left panel of the Figure 1. Population A bins (A1, A2, A3, and A4) are based on the increment of the Feii intensity, ΔRFeII = 0.5. A1 sources have a lower contribution of Feii, than A4 sources. Whereas population B bins (B1, B1+, B1++, and B2) varying according to a width increment of ΔFWHM(HβBC) = 4,000 km s−1. For example, B1++ sources have a large width than the B1. Indeed, population B bins can be also defined in terms of the RFeII, for example the B2 population has a 0.5 ≤ RFeII ≤ 1.0 and 4,000 ≤ FWHM(HβBC) ≤ 8,000 km s−1.
Figure 1

(Left) 4DE1 Optical Plane. Data belong to a sample of 470 bright low-z QSOs from Zamfir et al. (2010). The plane is divided in bins according to Sulentic et al. (2002). xA sources (green dots) are located inside the green square defined by RFeII ≥ 1 and FWHM(HβBC) ≤ 8,000 kms−1. The greenyellow dot indicates the position of I Zw 1. Gray dots correspond to the rest of the population A and B. The yellow shadow marks the 4DE1 optical sequence. (Right) Distribution of the xA candidates sample (black squares) in the plane defined by the flux ratios Al III λ1860/Si III]λ1892 and C III ]λ1909/Si III ]λ1892 obtained from the measurements done with the GTC spectra. The gray area corresponds to the area occupied by the xA sources according to previous studies.
Moving along the 4DE1 optical sequence, we find a well-organized variation of the physical properties like the black hole mass (MBH), electronic density (nH), ionization parameter (U) or dimensionless accretion rate (ṁ) (Marziani et al., 2001, 2010). For example, the most extreme B sources, the B1++, have a high black hole mass and a small dimensionless accretion rate compared with the most extreme for the population A, the A4 population. Then, the 4DE1 could be considered as an evolution diagram for type 1 AGN, which could be driven by the Eddington ratio, L/LEdd (Marziani et al., 2001; Shen and Ho, 2014; Fraix-Burnet et al., 2017). Updated results of the 4DE1 are found in Marziani et al. in this volume.
1.1. Extreme radiating sources along 4DE1
In each 4DE1 subpopulations we have identified specific properties. In this paper we focus on A3 and A4, which represent the 10% of the population A sources (Zamfir et al., 2010; Shen et al., 2011). In the optical range the main feature presented is the strong intensity of Feii at λ4570Å (Bachev et al., 2004), while in the UV the Civλ1549 emission line frequently shows a blueshifted component with a shift respect to the rest-frame of Δvr < −1,000 km s−1 (Sulentic et al., 2007).
A prototype A3 source at low redshift is I ZW 1 with z ≈ 0.0605, RFeII = 1.3 ± 0.1, log L/LEdd ≈ −0.11 ± 0.17; and a shift respect to the rest-frame of Civλ1549 Δvr < −1,670 ± 100 km s−1 (Boroson and Green, 1992; Negrete et al., 2012; Marziani and Sulentic, 2014). Within 4DE1 formalism, A3 and A4 sources have been cataloged as xA by Marziani and Sulentic (2014). Left panel of Figure 1 shows the area occupied by the xA sources in the 4DE1 optical plane.
Using optical and UV samples with around ~60 sources in each spectral range (Bachev et al., 2004; Negrete et al., 2013; Marziani and Sulentic, 2014), we have recognized selection criteria to identify xA sources:
RFeII > 1
Aliiiλ1860/Siiii]λ1892 ≥ 0.5
Ciii]λ1909/Siiii]λ1892 ≤ 1.0
The optical criterion is commonly used in sources with low redshift (z < 1.0), while the UV one helps to identify xA sources at high redshift due to the limit of the detectors to observe the optical region. Both criteria are satisfied at the same time, they have been tested in a wide redshift range, z = 0.4–3.0 (Bachev et al., 2004; Negrete et al., 2013; Marziani and Sulentic, 2014).
Another important feature is the high Eddington ratio shown by the xA sources, L/LEdd > 0.2 (Marziani and Sulentic, 2014). The high Eddington ratio reached could be associated with a slim disk, with a geometrically and optically thick structure. It could be formed in an advection-dominated accretion flow and it could trigger the strong outflows observed in these objects (Abramowicz et al., 1988; Abramowicz and Straub, 2014). The strong relation between the high L/LEdd and strong asymmetries observed in the xA sources points out that probably L/LEdd is the driver of winds/outflows (Sulentic et al., 2017).
On the other hand, if the accretion rate is close the Eddington limit (L/LEdd = 1), the dependency of the Eddington rates with the black holes mass is weak and then these sources can be used as standard candles, and help possibly determine cosmological parameters (Marziani and Sulentic, 2014; Wang et al., 2014).
With the purpose to analyze the behavior of xA objects, we observe a sample of 19 quasars in the UV region at high redshift using the GTC telescope. They were analyzed performing multicomponent fits (Section 2). We find a different behavior between the intermediate and high-ionization lines, which reveals the different structures presented in the the broad line region and their relation with the accretion disk (Section 3). In the Section 4 are presented our main results.
2. The extreme accreting sample
2.1. Sample selection
With the purpose of analyzing the behavior of highly accreting sources, we observed a sample of 19 quasars with a redshift 2.05 < z < 2.98. Marziani and Sulentic (2014) extracted spectra for ~3,000 sources from SDSS DR6 with coverage of the 1900Å blend mainly composed by Aliiiλ1860, Siiii]λ1892 and Ciii]λ1909 (2.0 < z < 2.6). They performed a multicomponent analysis considering the selection criteria previously described to select xA candidates. Some of these objects did not have the appropriated S/N > 15 to be included in their analysis, then they were observed with the Gran Telescopio de Canarias (GTC). The 19 objects presented in this work belong to a sample of 49 quasar. In the right panel of Figure 1 is presented the distribution of our sample in the Ciii]λ1909/Siiii]λ1892 vs. Aliiiλ1860/Siiii]λ1892 UV plane computed from the GTC spectra. They gray region indicates the zone were xA objects are located. The GTC spectra have a good S/N and verify the results previously obtained from the SDSS spectra analyzed by Marziani and Sulentic (2014).
The xA source candidates were observed with the OSIRIS spectrograph (Sánchez et al., 2012) mounted on the GTC, located at the Observatorio del Roque de los Muchachos in La Palma, Canary Islands, Spain. We used a slit of 0.6″ and according to redshift of the source, we use a R1000B or R1000R grisms with a spectral dispersion of 2.1 and 2.6 Å per pixel, respectively. The UV spectral range covers by our source at rest-frame is from 1150 to 2400 Å.
2.2. Data reduction and redshift determination
The data reduction was done using the iraf routines. Spectra were corrected by biases and flats field taken every night. The wavelength calibration was done using Hg+Ar and Ne arc lamps and the flux calibration was carried out using spectrophotometric standard stars. The spectra were corrected by telluric absorption and atmospheric differential refraction.
We have estimated the reddening of the sources, parametrized by the color excess E(B-V), by fitting its UV continuum with the template corresponding to the composite FIRST Bright Quasar Survey spectrum (FBQS; Brotherton et al., 2001) and excluding the regions of broad emission lines. To redden the template we used a Small Magellanic Cloud (SMC) extinction law (Gordon and Clayton, 1998; Gordon et al., 2003) with a RV = 3.07, as it is normally used as an appropriate reddening law in QSOs (York et al., 2006).
To perform the redshift correction, we apply an iterative measurements using three different methods to get a good approximation. The first two were done using isolated emission lines observed in our spectra, Cii λ1335, Oi λ1305 and Siiiλ1816. In the first one we model independently the line profiles using the mk1dspec routine to get a first approximation. In the second one we repeat the process, but employing the splot task. In the third method we apply the last correction using the 1900Å blend lines: Aliiiλ1860 and Siiii]λ1892. Although these lines are blended with the Ciii]λ1909 and some Feiii transitions, their high intensity permits a good approximation to the redshift.
2.3. Multicomponent fits
In the UV range covered by our spectra we observe intermediate (IP ~ 20–40 eV) and high-ionization lines (IP > 40 eV), which gives us the opportunity to analyze the behavior of different ionic species at the same time. In order to analyze the lines emitted in the covered spectral range, we perform multicomponent fits using the specfit routine from iraf (Kriss, 1994). This routine fits at the same time different kind of continuum, and emission/absorption lines. The best model is the one with the minimum χ2 found for the global fit.
For the analysis we divided the observed spectral range in three zones, which are centered in the most important emission lines for our work:
Region 1: 1700–2200 Å, this range is dominated by the 1900Å blend which is composed by Aliiiλ1860, Siiii]λ1892, Ciii]λ1909 and some Feiii transitions, and in the blue side are detected Siiiλ1816 and Niii]λ1750.
Region 2: 1450–1700 Å, the Civλ1549 emission line dominates this zone and is accompanied by Heiiλ1640, Oiii]1664 and Alii]λ1670.
Region 3: 1300–1450 Å, in this region the dominated emission is Siivλ1397 + Oiv]λ1402, which is accompanied by Siiiλ1304, Oi λ1305 and Cii λ1335.
The left panel of the Figure 2 shows the spectrum of the quasar SDSSJ110022.53 + 484012.6 with z = 2.08 and log L Bol = 46.17 erg s−1, as an example of the sources in our sample.
Figure 2

(Left) SDSSJ110022.53+484012.6 spectrum before continuum subtraction. The vertical lines indicate the rest-frame of emission line in the observed spectral range. Small magenta vertical lines represent the Feiii contribution along the spectral range. (Top right) Civλ1549 spectrum after continuum subtraction. Dashed magenta line indicates the fit to the whole spectrum. The green and red lines indicate the broad component of the Civλ1549 and Heiiλ1640 respectively, while the blue ones represent the blueshifted component associated with each emission. The vertical lines mark the rest-frame of the Civ and Heii. The brown lines mark the absorption lines fitted. (Bottom right) Residual of the fit. In both panels, abscissae are rest-frame wavelength in Å and ordinates are rest-frame specific flux in units of 10−15 erg s−1 cm−2 Å−1.
The main continuum source in the UV region is coming from the accretion disk (Malkan and Sargent, 1982; Malkan, 1983). A single powerlaw should be useful to model the observed spectral range, however due to the presence of intergalactic gas the continuum form can be flattened. In some cases we can fit with a single powerlaw or a linear continuum all the spectra range (1300–2200 Å). In the rest of the cases, we fit local continuums in three zones previously described. Details of the components fitted are explained in the next lines.
Region 1. Aliiiλ1860, Siiii]λ1892 and Ciii]λ1909 are intermediate-ionization lines (IIL) and according to Negrete et al. (2012) they can be well-modeled by Lorentzian profiles. The flux of the three lines vary freely. The FWHM associated with Aliii and Siiii] was taken equal, while the one of Ciii] is free. The considerations about the FWHM of the lines are based on the physical properties where the lines are emitted, see Section 3.1. Siiiλ1816 and Niii]λ1750 were also modeled with Lorentzian profiles, and the flux and FWHM vary freely. All the Lorentzian profiles were fixed at the rest-frame.
The Feii has an important contribution around 1715 and 1785 Å. We tried to use the templates available in the literature (Bruhweiler and Verner, 2008; Mejía-Restrepo et al., 2016), however we can not reproduce the observed contribution. Therefore, we decided to fit isolated Gaussian profiles at 1715 and 1785 Å. The flux and FWHM vary freely.
The Feiii emission is an important contribution, mainly in the red side of the 1900Å blend. We modeled the emission of this ion with the Vestergaard and Wilkes (2001) template, and we include an extra component at 1914 Å such as Negrete et al. (2012) have done. However, around 2020 and 2080 Å we had to include extra gaussians to get a good fit. The flux and FWHM vary freely.
Region 2. This zone is dominated by the high ionization line Civλ1549. The broad component (BC) is modeled by a Lorentzian profile fixed at the rest-frame. The flux of the BC is free and the FWHM is the same that the shown by Aliiiλ1860 and Siiii]λ1892. In our sample all the Civλ1549 profiles present a blueshifted asymmetry, to model it we used one or two blueshifted asymmetric gaussian profiles. The flux, FWHM, asymmetry and shift vary freely. Some of our objects are strongly affected by absorption lines, they were modeled using gaussian profiles without any constrain. Four object are Broad Absorption Lines (BAL) and 6 of them are mini-BAL. A wide analysis about this topic will be present in an upcoming paper.
Heiiλ1640 was modeled in a similar form that Civλ1549, using a Lorentzian and skew Gaussians profiles for the BC and blueshifted components, respectively. The FWHM, shift and asymmetry were taken similar, but the flux varies freely. Oiii]λ1664 and Alii]λ1670 were also modeled with Lorentzian profiles at the rest-frame, and the flux and FWHM vary freely.
Region 3. This range is governed by the Siivλ1397 + Oiv]λ1402 blend. It is composed by two high-ionization lines. They are expected to shows a blueshifted, asymmetric profile. The broad component was modeled with the same conditions than Civλ1549, but the flux is varying freely. In some cases the shift of the blueshifted lines were taken similar, but in other sources is independent due to the presence of absorption lines that affect the Siv profile.
An example a multicomponent fit for the Civ spectral range is shown in the right panel of the Figure 2. In a upcoming paper we will present the rest of the sample and a full analysis.
3. Results
3.1. Intermediate-ionization lines
As the 4DE1 has found in previous samples, there is a significant change in properties shown by ionic species with different ionization potentials. We confirm this fact in the intermediate and high-ionization lines present in our sample. Intermediate-ionization lines Aliiiλ1860 and Siiii]λ1892 show symmetric profiles. Therefore the region where these lines are emitted is governed by virial motions. However, the quasar SDSSJ084036.16+235524.7 present a blueshifted component associated with the 1900Å blend with a centroid half maximum of c() ~ −1,778 km s−1. A similar behavior, but in a extreme case is also presented by HE0359-3959, a high luminosity and redshift quasar, who present a blueshifted component of c() ~ −6,000 km s−1 (Martínez-Aldama et al., 2017). Then, the emitter region where the IIL are produced could be affected by radiation forces (Marziani et al., 2017).
In ~35% of the sample the Ciii]λ1909 shows intensity less than 20% compared with the ones observed in the Aliiiλ1860 and Siiii]λ1892. It indicates that either Ciii] is not emitted by the same region or the ion is suppressed. The critical electronic density (ne) of this semi-forbidden line is ne = 1010 cm−3 (Osterbrock and Ferland, 2006) and according to the models done by Negrete et al. (2013) Aliiiλ1860 and Siiii]λ1892 are emitted by regions with nH > 1011 cm−3. It means that Ciii]λ1909 is suppressed in this zone. On the other hand, the FWHM of Ciii]λ1909 is lower than that shown by other lines, which points it out that the line is emitted in a external region than Aliiiλ1860 and Siiii]λ1892.
3.2. High-ionization lines
To measure the contribution of blueshifted components associated with high-ionization lines, we use the centroid at half intensity of the total profile, c(½). Left panel of Figure 3 shows the distribution of the centroid c(½) for the most representative high-ionization line in our sample, the Civλ1549 emission. We observe that ~90% of our sample has blueshifts larger than −1,000 km s−1, which reflects the presence of strong winds/outflows. A consistent trend is also found for blueshifted components of Heiiλ1640 and Siivλ1397.
Figure 3

(Left) Distribution of the centroid at half intensity, c(½), for the extreme radiating sample. Blue distribution indicates the sources that satisfied the criteria selection. Red distribution is the one associated with the borderline quasars. (Right) Relation between the centroid c(½) and the flux ratio of the blueshifted component respect to the total profile of Civλ1549, F(CIVBlue)/F(CIVTotal). The color of the squares are the same that the left panel. The blue dashed line indicates the least-squares (LSQ) best fit.
Two of the objects in the sample not satisfy the selection criteria, although these objects show xA properties. Therefore, they can be considered like borderline objects. These objects present a high contribution of Ciii]λ1909, which could be related with a change in physical properties (primarily gas density) of the broad line region, as further discussed below.
Right panel of Figure 3 shows the flux ratio between the flux associated with the blueshifted component and the total flux (Blue + BC) of the Civλ1549 emission; F(CIVBlue)/F(CIVTotal). A relationship between the flux ratios and the centroid c(½) is clearly observed. If the contribution of the blue component is high, the centroid c(½) value also is. This relation has been previously found by Sulentic et al. (2017). Adding the information from Hβ and Feii they conclude that the blueshifted component has an important contribution: it is responsible for the blueshift and the additional broadening of the Civλ1549 line to respect to the low-ionization line.
Sulentic et al. (2017) studied a sample of Population A and B sources. They clarify the different between the two populations. If we compared the behavior of their Population A object, we find only one xA source. There is a change from a spectroscopic behavior, which could be related with changes in the physical parameters of the broad line region as Negrete et al. (2012) and Martínez-Aldama et al. (2017) have found in these kind of objects high densities (nH~1011−13 cm−3) and low-ionization parameters (log U ~ −3), which enhanced the behavior of lines like Aliiiλ1860, and diminish the presence of lines like Ciii]λ1909.
3.3. xA sources and the eddington ratio
According to UV selection criteria at least 90% of our objects are highly accreting AGN. As we mentioned, one of the main important features is the presence of blueshifted components in all of our sources. In some cases the radiation forces reflected by prominent asymmetries are strong. In the Figure 4 is presented the behavior of the centroid c(½) as a function of Eddington ratios. The Eddington ratios were computed via the mass black hole relation reported by Vestergaard and Peterson (2006) considering the FWHM of Aliiiλ1860 (Negrete et al., 2012), and the luminosity at 1350 Å. We present the estimations before and after the reddening correction. We have included two other samples with population A and B sources to compare the behavior of our data (Sulentic et al., 2004, 2006, 2007; Marziani et al., 2009; Marziani and Sulentic, 2014). The red dots correspond to population B sources, while the blue ones are population A; the blue diamonds indicate the sample presented in this paper. As we observe, population B objects of high luminosity show c(½) > −1,000 km s−1 and L/LEdd < 0.2. Whereas the pop. A tends to have larger values and high L/LEdd; even some of them are supper-Eddington sources, L/LEdd > 1. Our sample covers very well the region described by the population A. It shows high asymmetries c(½) < −1,000 km s−1 and high Eddington ratios, L/LEdd > 0.2. This result is in agreement with previous results (see Sulentic et al., 2017 and references therein).
Figure 4
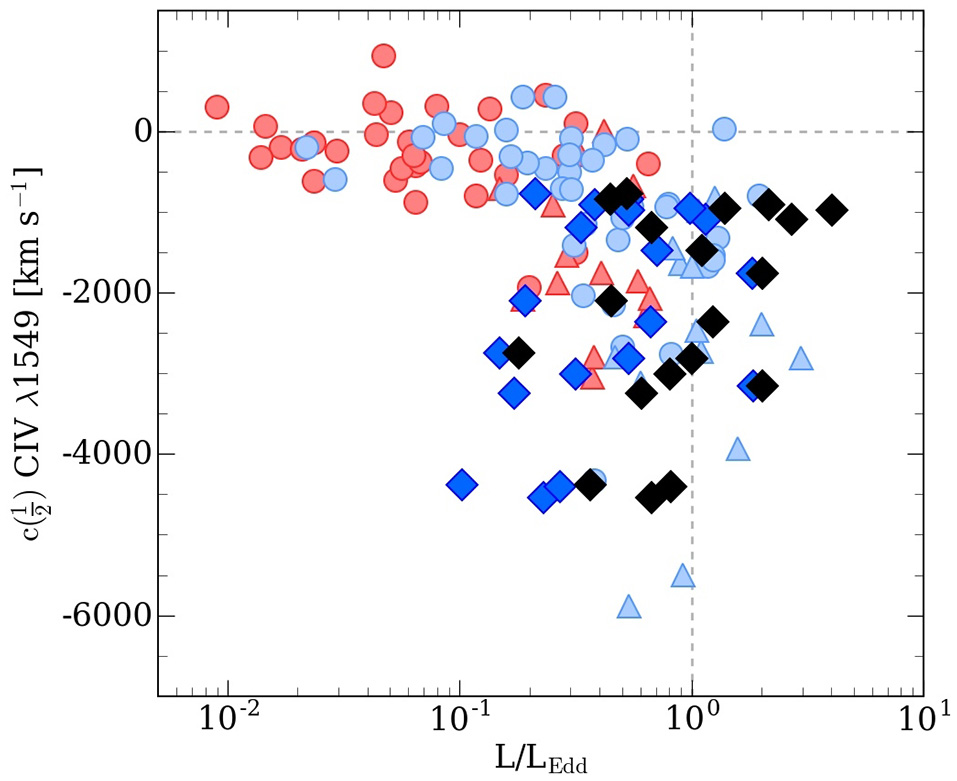
Centroid at half intensity, c(½), as function of the Eddington ratio, L/LEdd. The red dots correspond to the population B sources, while the blue ones indicate the population A sources. The highly accreting sample is indicated by blue and black diamonds, the first ones correspond before reddening correction, the second ones after. The origin of the rest of the data are indicated in the text. The black dashed horizontal line indicates c(½) = 0 km s−1 (any asymmetry), while the vertical corresponds to the L/LEdd = 1.0.
It has been proposed that highly accreting sources host a geometrically and optically thick accretion disk called “slim” (Abramowicz et al., 1988; Elvis, 2000; Proga, 2007; Abramowicz and Straub, 2014). This structure in the inner region contains a narrow funnel, which produces anisotropy radiation that increases as the accretion rate (Sądowski et al., 2014; Wang et al., 2014).
If the accretion rate is close to the Eddington limit (L/LEdd = 1), the dependency of the Eddington rates with the black holes mass is weak and then these sources could be used as standard candles to determine cosmological parameters (Marziani and Sulentic, 2014; Wang et al., 2014). From the observational point of view, our sample satisfies the conditions to host a slim disk, which could be associated with the observed behavior of the different ionic species in the BLR. In an upcoming paper we will discuss this issue in depth.
4. Conclusions
Based on the properties observed in our sample, like strong outflows in the high-ionization lines or high Eddington ratios, we proved that at least 90% of our sample is populated by highly accreting sources, which shows that the 4DE1 formalism is a good discriminator of the AGN class. In our sample we observe a different behavior for intermediate and high-ionization lines. The main features are observed in high-ionization lines, which are affected by strong outflow/winds. In some cases the intermediate-ionization lines, like Aliiiλ1860, are also affected by radiation forces. Centroid at half intensity values (c(½) < −1,000 km s−1) indicate the presence of strong blueshifted, which lead to consider our sample populated by xA sources. On the other hand, the sample tends to show high Eddington ratios, which are related with the strong asymmetries of the high ionization lines.
Statements
Author contributions
MM-A: data reduction, multicomponents fits, analysis, writing, revision. AD: data reduction, analysis, revision. PM: analysis, revision. CN: analysis, revision. DD: writing, revision. JP: analysis, revision. JS: revision. MD: revision.
Acknowledgments
MM-A acknowledge the postdoctoral grant from the CONACyT. MM-A and AD acknowledge financial support from Spanish Ministry for Economy and Competitiveness through grants AYA2013-42227-P and AYA2016-76682-C3-3-1-P.
Conflict of interest
The authors declare that the research was conducted in the absence of any commercial or financial relationships that could be construed as a potential conflict of interest.
References
1
AbramowiczM. A.CzernyB.LasotaJ. P.SzuszkiewiczE. (1988). Slim accretion disks. Astrophys. J.332, 646–658. 10.1086/166683
2
AbramowiczM. A.StraubO. (2014). Accretion discs. Scholarpedia9:2408. 10.4249/scholarpedia.2408
3
BachevR.MarzianiP.SulenticJ. W.ZamanovR.CalvaniM.Dultzin-HacyanD. (2004). Average ultraviolet quasar spectra in the context of eigenvector 1: a baldwin effect governed by the eddington ratio?Astrophys. J.617, 171–183. 10.1086/425210
4
BorosonT. A.GreenR. F. (1992). The emission-line properties of low-redshift quasi-stellar objects. Astrophys. J. Suppl.80, 109–135. 10.1086/191661
5
BrothertonM. S.TranH. D.BeckerR. H.GreggM. D.Laurent-MuehleisenS. A.WhiteR. L. (2001). Composite Spectra from the FIRST Bright Quasar Survey. Astrophys. J.546, 775–781. 10.1086/318309
6
BruhweilerF.VernerE. (2008). Modeling Fe II Emission and Revised Fe II (UV) empirical templates for the Seyfert 1 Galaxy I Zw 1. Astrophys. J.675, 83–95. 10.1086/525557
7
ElvisM. (2000). A Structure for Quasars. Astrophys. J.545, 63–76. 10.1086/317778
8
Fraix-BurnetD.MarzianiP.D'OnofrioM.DultzinD. (2017). The phylogeny of quasars and the ontogeny of their central black holes. Front. Astron. Space Sci.4:1. 10.3389/fspas.2017.00001
9
GordonK. D.ClaytonG. C. (1998). Starburst-like dust extinction in the small magellanic cloud. Astrophys. J.500, 816–824. 10.1086/305774
10
GordonK. D.ClaytonG. C.MisseltK. A.LandoltA. U.WolffM. J. (2003). A quantitative comparison of the small magellanic cloud, large magellanic cloud, and ilky way ultraviolet to near-infrared extinction curves. Astrophys. J.594, 279–293. 10.1086/376774
11
KrissG. (1994). Fitting odels to UV and optical spectral data, in Astronomical Data Analysis Software and Systems III, of Astronomical Society of the Pacific Conference Series, Vol. 61, eds CrabtreeD. R.HanischR. J.BarnesJ. (San Francisco, CA: Astronomical Society of the Pacific), 437.
12
MalkanM. A. (1983). The ultraviolet excess of luminous quasars. II - Evidence for massive accretion disks. Astrophys. J.268, 582–590. 10.1086/160981
13
MalkanM. A.SargentW. L. W. (1982). The ultraviolet excess of Seyfert 1 galaxies and quasars. Astrophys. J.254, 22–37. 10.1086/159701
14
Martínez-AldamaM.Del OlmoM.MarzianiP.NegreteC.DultzinD.Martínez-CarballoM. A. (2017). HE0359-3959: an extremely radiating Quasar. Front. Astron. Space Sci.4, 29–33. 10.3389/fspas.2017.00029
15
MarzianiP.Del OlmoA.Martínez-AldamaM. L.DultzinD.NegreteC.BonE.et al. (2017). Quasar black hole mass estimates from high-ionization lines: breaking a taboo?Atoms5, 33–47. 10.3390/atoms5030033
16
MarzianiP.SulenticJ. W. (2014). Highly accreting quasars: sample definition and possible cosmological implications. Mon. Not. Roy. Astron. Soc.442, 1211–1229. 10.1093/mnras/stu951
17
MarzianiP.SulenticJ. W.NegreteC. A.DultzinD.ZamfirS.BachevR. (2010). Broad-line region physical conditions along the quasar eigenvector 1 sequence. Mon. Not. Roy. Astron. Soc.409, 1033–1048. 10.1111/j.1365-2966.2010.17357.x
18
MarzianiP.SulenticJ. W.StirpeG. M.ZamfirS.CalvaniM. (2009). VLT/ISAAC spectra of the Hβ region in intermediate-redshift quasars. III. Hβ broad-line profile analysis and inferences about BLR structure. Astron. Astrophys.495, 83–112. 10.1051/0004-6361:200810764
19
MarzianiP.SulenticJ. W.ZwitterT.Dultzin-HacyanD.CalvaniM. (2001). Searching for the physical drivers of the eigenvector 1 correlation space. Astrophys. J.558, 553–560. 10.1086/322286
20
Mejía-RestrepoJ. E.TrakhtenbrotB.LiraP.NetzerH.CapellupoD. M. (2016). Active galactic nuclei at z 1.5 - II. Black hole mass estimation by means of broad emission lines. Mon. Not. Roy. Astron. Soc.460, 187–211. 10.1093/mnras/stw568
21
NegreteC. A.DultzinD.MarzianiP.SulenticJ. W. (2012). Broad-line egion physical conditions in extreme population A Quasars: a method to estimate central black hole mass at high redshift. Astrophys. J.757:62. 10.1088/0004-637X/757/1/62
22
NegreteC. A.DultzinD.MarzianiP.SulenticJ. W. (2013). Reverberation and photoionization Estimates of the Broad-line Region Radius in low-z Quasars. Astrophys. J.771:31. 10.1088/0004-637X/771/1/31
23
OsterbrockD. E.FerlandG. J. (2006). Astrophysics of Gaseous Nebulae and Active Galactic Nuclei. Sausalito, CA: University Science Books.
24
ProgaD. (2007). Dynamics of accretion flows irradiated by a Quasar. Astrophys. J.66, 693–702. 10.1086/515389
25
SądowskiA.NarayanR.McKinneyJ. C.TchekhovskoyA. (2014). Numerical simulations of super-critical black hole accretion flows in general relativity. Mon. Not. Roy. Astron. Soc.439, 503–520. 10.1093/mnras/stt2479
26
SánchezB.Aguiar-GonzálezM.BarretoR.BecerrilS.Bland-HawthornJ.BongiovanniA.et al. (2012). OSIRIS tunable imager and spectrograph for the GTC: from design to commissioning, in Proceedings of the SPIE Ground-based and Airborne Instrumentation for Astronomy IV, Vol. 8446 (Bellingham, WA; Washington, DC: SPIE, Society of Photographic Instrumentation Engineers), 84464T.
27
ShenY.HoL. C. (2014). The diversity of quasars unified by accretion and orientation. Nature513, 210–213. 10.1038/nature13712
28
ShenY.RichardsG. T.StraussM. A.HallP. B.SchneiderD. P.SneddenS.et al. (2011). A catalog of quasar properties from sloan digital sky survey data Release 7. Astrophys. J. Suppl.194:45. 10.1088/0067-0049/194/2/45
29
SulenticJ. W.BachevR.MarzianiP.NegreteC. A.DultzinD. (2007). CIV λ1549 as an eigenvector 1 parameter for active galactic nuclei. Astrophys. J.666, 757–777. 10.1086/519916
30
SulenticJ. W.Del OlmoA.MarzianiP.Martínez-CarballoM. A.D'OnofrioM.OyabuS.et al. (2017). What does CIV1549 tell us about the physical driver of the Eigenvector Quasar Sequence?Astron. Astrophys. arXiv:1708.03187
31
SulenticJ. W.MarzianiP.Dultzin-HacyanD. (2000). Phenomenology of broad emission ines in active galactic nuclei. Annu. Rev. Astron. Astrophys.38, 521–571. 10.1146/annurev.astro.38.1.521
32
SulenticJ. W.MarzianiP.ZamanovR.BachevR.CalvaniM.Dultzin-HacyanD. (2002). Average uasar spectra in the context of eigenvector 1. Astrophys. J.566, L71–L75. 10.1086/339594
33
SulenticJ. W.RepettoP.StirpeG. M.MarzianiP.Dultzin-HacyanD.CalvaniM. (2006). VLT/ISAAC spectra of the Hβ region in intermediate-redshift quasars. II. Black hole mass and Eddington ratio. Astron. Astrophys.456, 929–939. 10.1051/0004-6361:20054153
34
SulenticJ. W.StirpeG. M.MarzianiP.ZamanovR.CalvaniM.BraitoV. (2004). VLT/ISAAC spectra of the Hβ region in intermediate redshift quasars. Astron. Astrophys.423, 121–132. 10.1051/0004-6361:20035912
35
VestergaardM.PetersonB. M. (2006). Determining central black hole masses in distant active galaxies and Quasars. II. Improved optical and UV scaling relationships. Astrophys. J.641, 689–709. 10.1086/500572
36
VestergaardM.WilkesB. J. (2001). An empirical ultraviolet template for iron emission in quasars as derived from I Zwicky 1. Astrophys. J. Suppl.134, 1–33. 10.1086/320357
37
WangJ.-M.QiuJ.DuP.HoL. C. (2014). Self-shadowing effects of slim accretion disks in active galactic nuclei: the diverse appearance of the broad-line region. Astrophys. J.797:65. 10.1088/0004-637X/797/1/65
38
YorkD. G.KhareP.Vanden BerkD.KulkarniV. P.CrottsA. P. S.LauroeschJ. T.et al. (2006). Average extinction curves and relative abundances for quasi-stellar object absorption-line systems at 1 <zabs <2. Mon. Not. Roy. Astron. Soc.367, 945–978. 10.1111/j.1365-2966.2005.10018.x
39
ZamfirS.SulenticJ. W.MarzianiP.DultzinD. (2010). Detailed characterization of Hβ emission line profile in low-z SDSS quasars. Mon. Not. Roy. Astron. Soc.403, 1759–1786. 10.1111/j.1365-2966.2009.16236.x
Summary
Keywords
quasars: emission lines, quasar: UV spectrum, quasars: outflows, quasars: supermassive black holes, galaxy evolution: feedback
Citation
Martínez-Aldama ML, Del Olmo A, Marziani P, Sulentic JW, Negrete CA, Dultzin D, Perea J and D'Onofrio M (2018) Highly Accreting Quasars at High Redshift. Front. Astron. Space Sci. 4:65. doi: 10.3389/fspas.2017.00065
Received
27 September 2017
Accepted
12 December 2017
Published
19 January 2018
Volume
4 - 2017
Edited by
Fabio La Franca, Università degli Studi Roma Tre, Italy
Reviewed by
Alessandra De Rosa, Istituto Nazionale di Astrofisica (INAF), Italy; Michele Perna, Osservatorio Astrofisico di Arcetri (INAF), Italy
Updates
Copyright
© 2018 Martínez-Aldama, Del Olmo, Marziani, Sulentic, Negrete, Dultzin, Perea and D'Onofrio.
This is an open-access article distributed under the terms of the Creative Commons Attribution License (CC BY). The use, distribution or reproduction in other forums is permitted, provided the original author(s) or licensor are credited and that the original publication in this journal is cited, in accordance with accepted academic practice. No use, distribution or reproduction is permitted which does not comply with these terms.
*Correspondence: Mary L. Martínez-Aldama maryloli@iaa.es
This article was submitted to Milky Way and Galaxies, a section of the journal Frontiers in Astronomy and Space Sciences
Disclaimer
All claims expressed in this article are solely those of the authors and do not necessarily represent those of their affiliated organizations, or those of the publisher, the editors and the reviewers. Any product that may be evaluated in this article or claim that may be made by its manufacturer is not guaranteed or endorsed by the publisher.