 Paola Marziani1*
 Deborah Dultzin2
 Jack W. Sulentic3
 Ascensión Del Olmo3
 C. A. Negrete2
 Mary L. Martínez-Aldama3
 Mauro D'Onofrio4
 Edi Bon5
 Natasa Bon5
 Giovanna M. Stirpe6
- 1INAF, Osservatorio Astronomico di Padova, Padua, Italy
- 2Instituto de Astronomía, Universidad Nacional Autonoma de Mexico, Mexico City, Mexico
- 3Instituto de Astrofísica de Andalucía (CSIC), Granada, Spain
- 4Dipartimento di Fisica e Astronomia “Galileo Galilei”, Università di Padova, Padova, Italy
- 5Belgrade Astronomical Observatory, Belgrade, Serbia
- 6INAF, Osservatorio di Astrofisica e Scienza dello Spazio di Bologna, Bologna, Italy
The last 25 years saw a major step forward in the analysis of optical and UV spectroscopic data of large quasar samples. Multivariate statistical approaches have led to the definition of systematic trends in observational properties that are the basis of physical and dynamical modeling of quasar structure. We discuss the empirical correlates of the so-called “main sequence” associated with the quasar Eigenvector 1, its governing physical parameters and several implications on our view of the quasar structure, as well as some luminosity effects associated with the virialized component of the line emitting regions. We also briefly discuss quasars in a segment of the main sequence that includes the strongest FeII emitters. These sources show a small dispersion around a well-defined Eddington ratio value, a property which makes them potential Eddington standard candles.
1. Introduction
A defining property of type-1 quasars is the presence of broad and narrow optical and UV lines emitted by ionic species over a wide range of ionization potentials (IPs, Vanden Berk et al., 2001) which can be conveniently grouped in high-ionization lines (HILs) involving IP ≳ 50 eV, and low-ionization lines from ionic species with IP ≲ 20 eV (Table 1). Optical and UV lines do not all show the same profiles, and quasar redshifts measured on different lines often show significant differences. Internal line shifts (i.e., differences in redshift from different emission lines measured for the same object) involve both broad and narrow emission lines and have offered a powerful diagnostic tool of the quasar innermost structure and of the emitting region dynamics since a few years after the discovery of quasars (Burbidge and Burbidge, 1967). This is true even if the assumption that unobscured type-1 quasars have very similar properties has remained widespread until very recent times. This assumption has been, in our opinion, one of the most damaging prejudices in the development of quasar research. At a meeting in 1999 in Mexico City Deborah Dultzin half-jokingly suggested that “a thousand spectra are worth more than one average spectrum” as an extension of the aphorism “a spectrum is worth a thousand pictures” (Dultzin-Hacyan et al., 2000). The developments in the last 15+ years have proved that this is indeed the case, although the value of single-epoch observations may have gone under appreciated with respect to other lines of evidence. We will therefore focus the scope of this review mainly to the organization of single-epoch spectra of large samples of quasars, following the “bottom-up” approach developed by Jack Sulentic and by his collaborators.
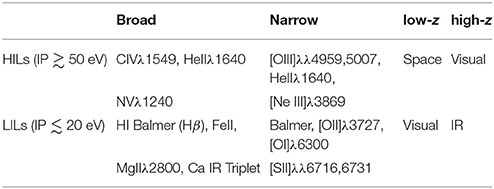
Table 1. Identification of high- and low-ionization lines.
Over the years, the UV resonance line CIVλ1549 was considered as representative of broad HILs, and [OIII]λ4959,5007 were employed as strong and easily accessible narrow HILs. Typical broad LILs include Balmer lines, FeII emission as well as MgIIλ2800. Their analysis requires an accurate measurement of the quasar redshift. Narrow LILs (Hβ and [OII]λ3727) have been found to be the best estimator of the quasar systemic redshift which defines the quasar “rest-frame” (e.g., Eracleous and Halpern, 2003; Hu et al., 2008; Bon et al., in preparation). The representative narrow and broad HILs [OIII]λλ4959,5007 and CIVλ1549 show systematic blueshifts with respect to LILs in a large fraction of type-1 AGN (see e.g., Gaskell 1982; Tytler and Fan 1992; Corbin and Boroson 1996; Marziani et al. 1996; Richards et al. 2002; Zamanov et al. 2002; Zhang et al. 2011; Marziani et al. 2016b, and Shen et al. 2016 for broad and narrow lines, respectively). Broad LILs could be used as a last resort especially in high-redshift quasars where the UV rest-frame is accessible from optical observations and no narrow lines are observable (Negrete et al., 2014). Even if broad LILs can show significant shifts with respect to rest frame, these are infrequent, and rarely as large as those found among HILs.
The interpretation of inter-line shifts in quasar spectra is mainly based on the Doppler effect due to gas motion with respect to the observer, along with selective obscuration. This explanation is almost universally accepted. For [OIII]λ4959,5007 blueshifts, it is consistent with a moderately dense outflow (logn~2−5 [cm−3]) of optically thin gas. For CIVλ1549, the explanation is not fully consistent if line emission occurs from optically thick clouds distributed, for example, symmetrically in a bicone whose axis is aligned with the spin of the black hole (e.g., Zheng et al., 1990). Such optically thick outflows might more easily give rise to a net redshift, if the receding part of the outflow remains visible. While it is no longer under discussion that large CIV blueshifts (amplitude ≳ 1,000 km/s) involve radial motion + obscuration, Gaskell and Goosmann (2013) suggested an alternative explanation involving infall and “reflection.” The observer does not see photons from the line emitting gas, but photons backscattered toward herself from a sea of hot electrons over the accretion disk. If the photons were originally emitted from infalling gas (i.e., approaching the disk), the observer should see a net blueshift. This explanation has some appeal for CIVλ1549, but sounds very unlikely for [OIII]λ4959,5007 because [OIII]λλ4959,5007 is emitted on spatial scales ranging from a few pc to thousands of pc, where a suitable “mirror” as the one potentially offered by hot electrons surrounding the accretion disk may not exist. In view of source commonality in terms of CIVλ1549 and [OIII]λ4959,5007 blueshifts (Marziani et al., 2016a,b), we will follow the most widely accepted interpretation that blueshifts involve outflow and obscuration for both CIVλ1549 and [OIII]λ4959,5007. The interpretation of LIL blue- and redshifts will follow the same assumption (with some caveats, section 8.1).
This review will be focused on the way internal line shifts and other quasar properties can be efficiently organized. A major step was an application to quasar spectra of the Principal Component Analysis (PCA) carried out in the early 1990s (Boroson and Green, 1992; Francis et al., 1992). Boroson and Green (1992) measured the most prominent emission features in the Hβ spectral region, and found the first hint of the quasar “main sequence” (MS; their Figure 9). The PCA and other statistical techniques require measurable parameters for a set of sources. The starting point is therefore the definition of a set of parameters (section 2) that may be conductive to the identification of fundamental correlations (the Eigenvectors) as well as to physics. The PCA of type-1 quasars (we remark in section 3 that we are dealing exclusively with type-1, unobscured quasars) yields a first eigenvector from which the MS is defined (section 4). After reviewing the MS correlates (section 5), we show how the “empirical” eigenvector 1 can be connected to the main physical parameters of quasars seen as accreting systems (sections 6 and 7). The most intriguing results point toward two different accretion structures in type-1 quasars (section 8), which are however largely self-similar over a wide range in luminosity. As an example of the power of the MS to identify sources that are physically similar, we consider quasars located at the extreme tip of the MS which are potential distance indicators (section 9).
2. Diagnostics From Single-Epoch Spectra: Internal Line Shifts and Intensity Ratios
Single-epoch spectroscopy of large quasar samples yields data defined by limits in multiplexing (i.e., by the ability to obtain a record of signals in different wavebands with the same observations): synoptical observations of the UV, visual, NIR rest frame have been challenging until a few years ago (and, in part, they are still challenging to-date). Given the limit in multiplexing, observations of low- and high-z quasars provide different information since different rest-frame wavelength ranges are covered: visual spectrometers provide the rest-frame Hβ range at low z but the rest-frame UV at z ≳ 1.5. To cover the rest-frame UV at low-z, space-based observations are needed. To cover Hβ at high z, NIR spectroscopy is needed. These limitations are being overcome by new generation instruments mounted at the focus of 8m-class telescopes which provide simultaneous coverage of visual and NIR, but these facilities were not available at the time most of the work reviewed in this paper was done. Synoptic observations of visual and UV at low-z still require coordinated ground and space-based observations which are especially hard to come by.
Table 1 provides an overview of the lines covered in the different domains. When we speak of intermediate to high-z objects (a population of behemoth quasars that is now extinguished), we are speaking of sources that are not anymore observed at z ≲ 1 (mainly for the “downsizing” of nuclear activity, see e.g. Springel et al., 2005; Sijacki et al., 2015; Fraix-Burnet et al., 2017, and references therein). On the other hand, at high-z, only relatively few quasars with luminosities comparable to those of low-z quasars are known since their apparent magnitude would be too faint. They aren't yet efficiently sampled by the major optical source of quasar discovery, the Sloan Digital Sky Survey (SDSS, Blanton et al. 2017, and references therein).
2.1. Analysis
A prerequisite for a meaningful analysis of internal line shifts and intensity is a spectral resolution R = λ/δλ ≳ 1, 000 and S/N ≳ 20. In addition, the quasar rest frame must be known with good precision. As mentioned in the Introduction, accurate redshifts can be obtained by limiting the measurements to narrow LILs (Hβ) and [OII]λ3727, the latter with some caveats (Bon et al., in preparation). Narrow HILs (e.g., [OIII]λλ4959,5007) show systematic blueshifts (Zamanov et al., 2002; Eracleous and Halpern, 2003; Rodríguez-Ardila et al., 2006; Hu et al., 2008) whose amplitude is a strong function of their location along the quasar main sequence (section 5).
Once the rest frame is known, quantitative measurements of emission line profiles centroids, line widths at different fractional heights become possible. Centroids are defined by: , ∀i = 1, …, 4, where the full width is FW.
In more recent times, we have applied a heuristic multicomponent decomposition whose rationale will be given in section 6.2, that is in part equivalent to a inter-percentile profile analysis (Shang et al., 2007; Marziani et al., 2010). This more model-dependent approach has been used along with centroids and width measurements on the full profile. Intensity ratios are computed separately for each profile component. The multicomponent fits have the advantage of isolating regions that are partly resolved in the radial velocity dimension and in different physical conditions (section 6.3).
An important element in the analysis of optical and UV lines is the measurement of the FeII emission contribution. As shown in Figure 1 of Marziani et al. (2006), FeII multiplets are strong in the optical and UV and even create a pseudo continuum in the range 2,100–3,000 Å. Contamination in the Hβ spectral range is also strong. Within the limits of the past analysis, it has proven appropriate to assume that the FeII multiplet ratios are always the same, even if the FeII features change equivalent width and FWHM from object to object (Boroson and Green, 1992). The trend shown in Figure 1 motivates this assumption. In practice, it has been possible to model the FeII emission using a scaled and broadened template obtained from the Narrow Line Seyfert 1 (NLSy1) galaxy I Zw 1, a strong FeII emitter with narrow broad lines. More sophisticated approaches varying multiplet ratios (e.g., Kovačević et al., 2010) are needed in the rare cases where FeII emission appears peculiar.
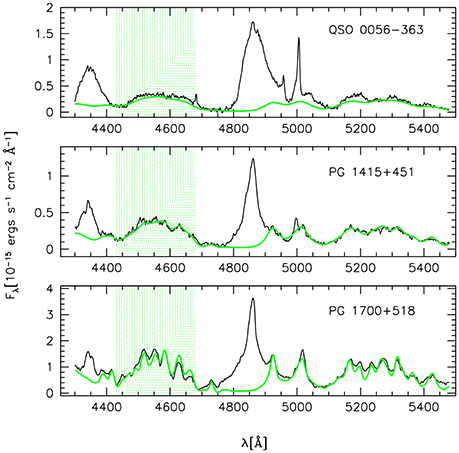
Figure 1. Three type-1 quasars. The green line represents the FeII emission template, scaled and broadened to fit the observed FeII emission. The shaded area between 4,340 and 4,680 Å covers the wavelength range used to compute the total intensity of the blended emission at 4,570 Å to estimate the relative intensity between FeII λ 4,570 and Hβ i.e., the RFeII parameter (Boroson and Green 1992, section 4). The three spectra show different RFeII: as the intensity ratio RFeII decreases (from bottom to top), the Hβ line width increases. Also notable is the change in profile shape of Hβ. The spectra of the three quasars are exemplary of general trends involving LILs observed along the quasar main sequence.
Given the quantitative measurements on line profile and line profile components, much of the past work has been inspired by the Baconian approach (Bacon, 1902), deriving inferences by induction from observations without (much) prior benefit of theory. In practice this translated into (1) classifying data in a systematic way, to avoid a mixup of sources which are empirically different; (2) applying a quantitative but phenomenological description of the data, (3) performing uni- and multivariate statistics with a quantitative treatment of errors (including, for example, also the analysis of censored data). Model inferences have been deduced from the data separating aspects that were strongly constrained (for example, physical conditions derived from nebular physics), from those that required more speculative assumptions.
3. Unification Models and Type-1 Quasars
Unification schemes have provided a powerful conceptual framework suitable for organizing the analysis of AGN. The precursor distinction between type 1 and 2 Seyfert (Khachikian and Weedman, 1974) gained a convincing interpretation when Antonucci and Miller (1985) reported the discovery of a broad line component visible in the polarized spectrum of Seyfert 2 nuclei but invisible in natural light: the broad line region is hidden from view and only photons scattered by hot electrons toward our line of sight are received by the observer. This explanation remains alive and widely accepted today (e.g., Eun et al., 2017), even if we now know that is only a part of the story: type-2 AGN differ for environmental properties (Dultzin-Hacyan et al., 1999; Koulouridis et al., 2006; Villarroel and Korn, 2014), may intrinsically lack a BLR (Laor, 2000) at very low accretion rates, or may even be unobscured normal type-1 under special conditions (Marinucci et al., 2012). The point here is that unification models of RQ AGN separate two types of quasars on the basis of the viewing angle between the line of sight and the symmetry axis of the system (i.e., the spin axis of the black hole or the angular momentum vector of the inner accretion disk) but make no prediction on unobscured type 1 AGN. Orientation effects are expected also for unobscured type-1s, as we should observe them in the range of viewing angles, 0 ≲ θ ≲ 45 − 60. There is little doubt that broad line width is affected by orientation, especially for RL sources (e.g., Wills and Browne, 1986; Rokaki et al., 2003; Sulentic et al., 2003; Jarvis and McLure, 2006; Runnoe et al., 2014): a comparison between RL sources that are core-dominated (believed to be oriented with the jet axis close to the line-of-sight) and lobe-dominated (misaligned) shows that the Hβ FWHM is larger in the latter class. This result strongly suggests a flattened, axisymmetric structure for the BLR. For RQ objects, the evidence is not obvious and an estimate of θ remains an unsolved problem at the time of writing. However, orientation effects are certainly not enough to explain the diversity of quasar spectral properties.
4. The Quasar Main Sequence
At the time the Boroson and Green (1992) paper appeared, studies based on moderately sized samples (20-30 objects) were common and often reached confusing results from correlation analysis. The best example is the Baldwin effect (an anti-correlation between equivalent width of HILs and luminosity) which was found in some and then not found in similar samples without apparent explanation.1 In this respect the sheer size of the Boroson and Green (1992) sample was a key improvement. A novel aspect was also the application of the PCA which considers each parameter as a dimension of a parameter space, and searches for a new parameter space with fewer dimensions (defined by linear combinations of the original parameters) as needed to explain most of the data variance (Murtagh and Heck, 1987; Marziani et al., 2006). The application of the PCA was not unprecedented in extragalactic astronomy (e.g., Diaz et al., 1989) but was well suited to quasar data that appeared weakly correlated among themselves without providing a clear insight of which correlations were the most relevant ones.
The quasar Eigenvector 1 was originally defined by a PCA of ≈ 80 Palomar-Green (PG) quasars and associated with an anti-correlation between strength of FeIIλ4570, RFeII (or [OIII] 5007 peak intensity) and FWHM of Hβ (Boroson and Green, 1992). The parameter RFeII is defined as the ratio between the integrated flux of FeIIλ4570 blend of multiplets, and that of the Hβ broad component:2 RFeII = I(FeIIλ4570)/I(Hβ). Since 1992, various aspects of the Eigenvector 1 (E1) of quasars involving widely different datasets as well multi-frequency parameters have been discussed in more than 400 papers, as found on NASA ADS in August 2017 (Boroson and Green, 1992; Dultzin-Hacyan et al., 1997; Sulentic et al., 2000a,b, 2007; Shang et al., 2003; Grupe, 2004; Kuraszkiewicz et al., 2009; Mao et al., 2009; Tang et al., 2012). Earlier analyses have been more recently confirmed by the exploitation of SDSS-based samples (Yip et al., 2004; Wang et al., 2006; Zamfir et al., 2008; Kruczek et al., 2011; Richards et al., 2011; Marziani et al., 2013b; Shen and Ho, 2014; Brotherton et al., 2015; Sun and Shen, 2015).
The second eigenvector – Eigenvector 2 – was found to be proportional to luminosity, and eventually associated with the HIL Baldwin effect(s) that are the most-widely discussed luminosity effects in quasar samples (Baldwin et al., 1978; Dietrich et al., 2002; Bian et al., 2012). The smaller fraction of variance carried by the Eigenvector 2 indicates that luminosity is not the major driver of quasar diversity, especially if samples are restricted to low-z. We will not further consider HIL luminosity effects3 but only discuss the influence of luminosity on the LIL FWHM (section 8.2).
The distribution of data points in the optical plane of the Eigenvector 1 FWHM(Hβ) vs. RFeII traces the quasar main sequence (MS, Figure 2), defined for quasars of luminosity logL ≲ 47 [erg s−1], and z < 0.7. The MS shape allows for the definition of a sequence of spectral types (Figure 2), and motivates subdividing the 4DE1 optical plane into a grid of bins of FWHM(Hβ) and FeII emission strength. Bins A1, A2, A3, A4 are defined in terms of increasing RFeII with bin size Δ RFeII = 0.5, while bins B1, B1+, B1++, etc. are defined in terms of increasing FWHM(Hβ) with Δ FWHM = 4,000 km s−1. Sources belonging to the same spectral type show similar spectroscopic measurements (e.g., line profiles and line flux ratios). Spectral types are assumed to isolate sources with similar broad line physics and geometry. Systematic changes are reduced within each spectral type. If so, an additional advantage is that an individual quasar can be taken as a bona fide representative of all sources within a spectral type. The binning adopted (see Figure 2) has been derived for low-z (< 0.7) quasars. Systematic changes may not be eliminated in full, if an interpretation scheme such as the one of Marziani et al. (2001) applies, who posited a continuous effect of Eddington ratio and viewing angle (at a fixed MBH) as the origin of the MS shape (section 7.5 provides further explanations).
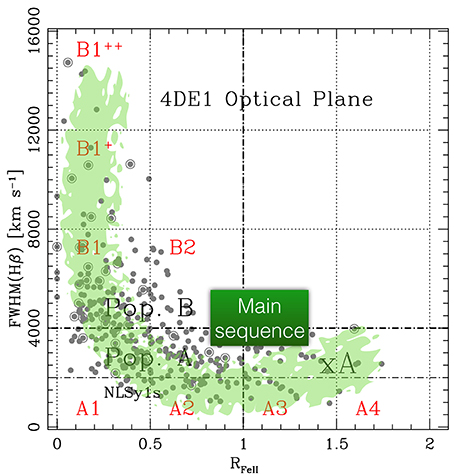
Figure 2. The optical plane of the Eigenvector 1, FWHM(Hβ) vs. RFeII. The green shaded area indicatively traces the distribution of a quasar sample from Zamfir et al. (2010), defining the quasar MS. The thick horizontal dot-dashed line separates populations A and B; the thin identifies the limit of NLSy1s. The vertical dot-dashed line marks the limit for extreme Population A (xA) sources with RFeII ≳ 1. Dotted lines separate spectral types, identified as explained in section 4.
Developments in the analysis before late 1999 of low-z quasar spectral properties are reviewed in Sulentic et al. (2000a). Data and ideas were in place as early as in year 2000 to introduce the idea of two quasar populations, A and B: Population A with FWHM(Hβ) ≤ 4,000 km s−1; Population B (broader) with FWHM(Hβ) > 4,000 km s−1 (Sulentic et al., 2000a,b). Later developments have confirmed that the two populations are two distinct quasar classes. Population A may be seen as the class that includes local NLSy1s as well as high accretors (Marziani and Sulentic, 2014), and Population B as a class capable of high-power radio-loudness (Zamfir et al., 2008, see section 5). It now seems unlikely that the two populations are just the opposite extremes of a single quasar “main sequence” defined in the plane FWHM(Hβ) vs. RFeII (Sulentic et al., 2011, section 5), although the subdivision at FWHM(Hβ) = 4,000 km s−1 is not widely considered in literature. It is therefore worth analyzing the issue in some more detail after considering the main correlates along the MS.
5. A Bird's Eye View of the MS Correlates
Several correlates have been proved as especially relevant in the definition of the MS multifrequency properties.
• Balmer emission line profile shape – Several past works found a clear distinction between Pop. A and B in terms of Balmer line profile shapes (Sulentic et al., 2002; Marziani et al., 2003b): Pop. A sources show Lorentzian Balmer line profiles, symmetric and unshifted; Pop. B, Double Gaussian (broad + very broad component, HβBC + HβVBC, section 6.2), most often redward asymmetric. While several authors described the Balmer line profiles of NLSy1s as Lorentzian (e.g., Véron-Cetty et al., 2001; Cracco et al., 2016), the transition between the profile types is apparently occurring at 4,000 km s−1 and not at 2,000 km s−1, the canonical limit of NLSy1. This early result (Sulentic et al., 2002) has been confirmed by several later analyses (e.g., Zamfir et al., 2010; Marziani et al., 2013b; Negrete et al., 2017). Figure 3 shows composite spectra in the FWHM range 2,000–4,000 and 0–2,000 km s−1: the profile shape remains the same as the line gets broader (Negrete et al., 2017). Mirroring Paolo Padovani's prescription as enunciated at the Padova meeting (Padovani 2017: no more RL, only jetted!), we would recommend to speak of Population A and B…and no more NLSy1s! In both cases, it is not just a matter of nomenclature: inter-sample comparison will be biased if the subdivision is inappropriate.
• UV diagnostic ratios – Major trends involve strong UV emission lines. Schematically, moving from spectral type B1++ to A4 we find: NVλ1240/Lyα: ↗; AlIIIλ1860/SiIII]λ1892: ↗ CIII]λ1909/SiIII]λ1892 ↘ W(NIII]1750) ↗ W(CIVλ1549) ↘. These trends can be interpreted as an increase in density and metallicity and decrease in ionization parameter of the LIL-emitting part of the BLR toward the strongest FeII emitters at the tip of the MS (Baldwin et al., 1996; Wills et al., 1999; Bachev et al., 2004; Nagao et al., 2006; Negrete et al., 2012, 2013).
• CIVλ1549 centroid shifts – The CIV1549 centroid blueshifts are a strong function of a source location along the E1 MS, reaching maximum values in correspondence of the extreme Pop. A (xA, spectral types A3 and A4). They can be accounted for by a scaled, almost symmetric and unshifted profile (such as the one of Hβ) plus an excess of blueshifted emission, corresponding to a “virialized” emitting region plus an outflow/wind component, respectively (Marziani et al., 2010). The relative prominence of the two components is a function of the location on the MS: the outflow component can dominate in xA sources, and be undetectable in sources at the other end of the MS (B1++) where the broader profiles are found. If we measure the centroid shift at half maximum , large blueshifts are found only in Pop. A (Sulentic et al., 2007). The blueshifted excess is at the origin of a correlation between centroid shifts of CIVλ1549 and FWHM CIV(Coatman et al., 2016; Sulentic et al., 2017). This has important implications for MBH estimates.
• [OIII] blueshifts – The [OIII]λλ4959,5007 doublet mimics the blueshift observed for CIVλ1549 with respect to the rest frame. The average blueshift amplitude increases toward the high RFeII end of the MS (Zamanov et al., 2002; Marziani et al., 2003a; Zhang et al., 2013; Cracco et al., 2016). This is emphasized by the distribution in the OP of the [OIII]λλ4959,5007 “blue outliers” (BOs) which show blueshift at peak of amplitude ≳ 250 km s−1. Large [OIII] shifts such as those of the BOs are found for FWHM(Hβ) < 4,000 km/s.
• LIL blueshifts – The profile of the resonance LIL MgIIλ2800 also suggests evidence of outflow (somewhat unexpectedly, Marziani et al. 2013b,a): low ionization outflows are detected in the xA spectral types, but lower radial velocities are involved in MgII λ2800 than in CIVλ 1549 (~ 100 vs. ~ 1,000 km/s).
• Radio loudness – The probability of being RL is much larger among Pop. B sources: 25%, among Pop. A ≈3−4%(Zamfir et al., 2008). Core-dominated RL sources are displaced toward Pop. A in the optical plane of the E1 because of orientation effects. Zamfir et al. (2008) suggest that RL sources should be considered as such only if very powerful with logPν>31.6 [erg s−1 Hz−1] at 20 cm, and Kellerman's logRK>1.8 (Kellermann et al., 1989), in line with the distinction of jetted and non-jetted suggested by Padovani (2016) which considers as jetted only sources for which there is evidence of powerful, relativistic ejections. On a broader perspective, radio-loudness may not be restricted to low Eddington ratio, once the basic prescriptions for explaining jet formation that involve extraction of the rotational energy of the black hole or of the accretion disk in the presence of a large-scale, well-ordered, and powerful magnetic field are satisfied (Blandford and Znajek, 1977; Blandford and Payne, 1982). Compact-steep spectrum (CSS) RL sources show high radio power (O'Dea, 1998) and properties that are of Pop. A, with relatively high L/LEdd(Wu, 2009). Formation of jetted sources may occur also at high Eddington ratio, although the physical mechanism leading to jet production and collimation is presently unclear (for a review, see Czerny and You, 2016), and the jet properties may also be different (Gu, 2017, and references therein). If relatively low power is considered (logPν ~ 31 [erg s−1 Hz−1]), the RL Pop. A sources include RL NSLy1s (Komossa et al., 2006). The γ-ray detection for some of them (Abdo et al., 2009; Foschini et al., 2010) may confirm their “jetted” nature. It has been suggested that RL NLSy1s have CSSs as a mis-aligned parent population (Berton et al., 2016). Therefore, the absence of luminous RL sources among Pop. A sources may be related to the absence of highly-accreting very massive black holes MBH () at relatively low-z (e.g., Cavaliere and Vittorini, 2000; Fraix-Burnet et al., 2017, and references therein).
• Soft X-ray slope – The steepness of the soft X-ray continuum measured by the photon index Γsoft is also dependent on the location along the MS. Γsoft is the measure of the soft-X excess (0.2–2 KeV) above a canonical power law with Γ ≈ 2. Values of Γsoft > 2 are mainly found for FWHM(Hβ) < 4,000 km/s (i.e., in Pop. A, Boller et al., 1996; Wang et al., 1996; Sulentic et al., 2000a; Grupe, 2004; Shen and Ho, 2014; Bensch et al., 2015).
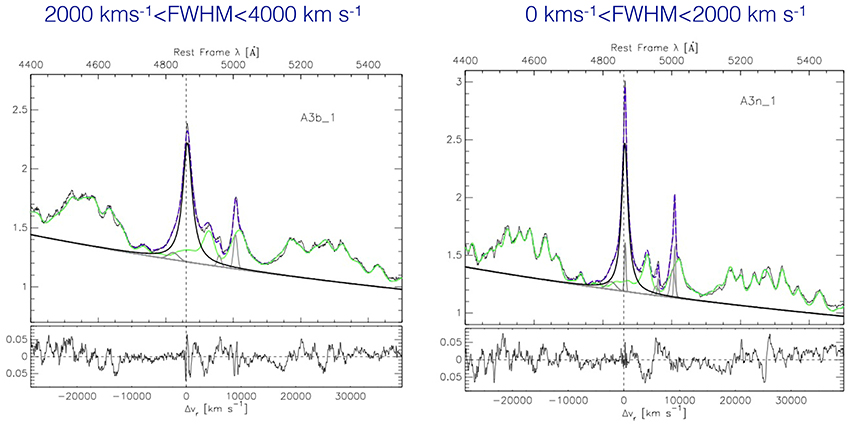
Figure 3. Fits of the A3 spectral type composites, obtained for the broader (A3b_1) and narrow (A3n_1) half of the spectral bin. The original spectrum (thin black line) is shown with FeII emission (pale green) superimposed to the continuum and the Hβ line with a Lorentzian profiles (thick black lines). Thin gray lines trace HβNC and [OIII]λλ4959,5007 emission and, on the blue side of Hβ, a faint excess emission that is not accounted for by the symmetric shape of Hβ.
Tables reporting main-sequence correlates are provided in several recent review and research papers (e.g., Sulentic et al., 2011; Fraix-Burnet et al., 2017), and in Chapter 3 and 6 of D'Onofrio et al. (2012). To restrict the attention of a subset of especially significant parameters, Sulentic et al. (2000a) introduced a 4DE1 parameter space. In addition to FWHM(Hβ) and RFeII, two more observationally “orthogonal” parameters, Γsoft and CIVλ1549 are meant to help establish a connection between observations and physical properties. The 4DE1 parameters clearly support the separation of Population A (FWHM Hβ < 4,000 km s−1) and Population B(broader) sources,4 although the non-optical parameters are not always useful since they are MS correlates and often unavailable. The immediate interpretation of the 4DE1 parameters is summarized in Table 2. In the simplest term, the FWHM Hβ is related to the velocity dispersion in the LIL emitting part of the BLR. On the converse, CIV yields a measurement affected by the high-ionization outflow detected in the HIL profile. The largest values indicate a decoupling between the strongest HIL and LIL features, with the latter remaining symmetric and unshifted (Marziani et al., 1996). The parameter RFeII is of more complex interpretation. RFeII is affected by the metallicity (obviously, if [Fe/H] = −10, RFeII ≈ 0) but metallicity is most likely not all of the story (Joly et al., 2008), since FeII strength tends to saturate for high metallicity values. The main dependence is probably on ionization conditions, density and column density (section 7.5). A Γsoft > 2 is usually ascribed to Compton thick soft X-ray emission from a hot corona above the disk, but may also be the high-energy tail of the spectral energy distribution of the disk itself, in case the inner disk is very hot (e.g., Done et al., 2012; Wang et al., 2014a).
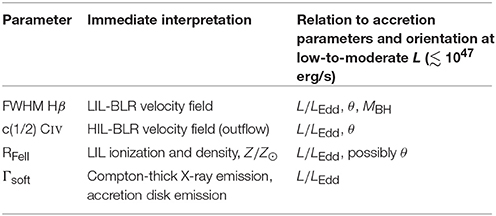
Table 2. Interpretation of the 4FE1 parameter space.
5.1. Pop. A and B: Really a Dichotomy?
Supporting evidence in favor of a dichotomy between Pop. A and B includes the change in the Hβ profile shape from Lorentzian-like to double Gaussian, with a redward asymmetry that is not detected in the narrower sources of Pop. A, not even in spectral type A1 where FeII emission is weak. Large CIVλ1549 centroid blueshifts are not observed in Pop. B unless sources of very high-luminosity are considered (Bischetti et al., 2017; Bisogni et al., 2017; Sulentic et al., 2017). Therefore, a dichotomy at ≈4,000 km s−1 for z ≲ 1 and logL ≲ 47 [erg s−1] is empirically supported by a sudden change in observations parameters. On the other hand, if RFeII is mainly affected by L/LEdd and the Hβ FWHM by the viewing angle, it is hard to justify a dichotomy (Shen and Ho, 2014). The analysis of Marziani et al. (2001) indicates that spectral type A1 may include sources which are intrinsically of Pop. B and observed almost pole on. However, the FWHM Hβ is also dependent on Eddington ratio (Nicastro, 2000, Figure 3 of Marziani et al. 2001). Most sources in bin A1 (RFeII ≤ 0.5) are true Pop. A with Lorentzian Hβ profiles. The Eddington ratio corresponding to the change in Hβ and CIVλ1549 properties has been estimated to be ≈ 0.2±0.1 in low-z, low-to-moderate L samples (Sulentic et al., 2000b; Marziani et al., 2003b). This is also the limit for the presence of a fully thin accretion disk (section 8.1; Abramowicz et al., 1988, 1997; Szuszkiewicz et al., 1996). At any rate, one should be aware that a fixed FWHM value only approximately corresponds to a well-defined Eddington ratio. The minimum FWHM for virialized systems (reached at maximum L/LEdd) is luminosity-dependent (section 8.2), and so is the FWHM corresponding to any fixed L/LEdd even if the luminosity dependence is weak up lo logL ≈ 47 [erg s−1] (Marziani et al., 2009).
6. From Empiricism to Physics
6.1. Synergy Between Reverberation Mapping and Single-Epoch Spectroscopy of Quasars
Reverberation mapping derived from the response of the emitting regions with respect to continuum changes resolves the radial stratification of the line emitting regions and helps assess their velocity field (e.g., Peterson, 1998; Peterson and Horne, 2006). The synergy with reverberation mapping helps to partially remove the spatial degeneracy of single-epoch spectra. The strongest evidence in support of virial motion for the line emitting gas comes from two lines of reverberation mapping investigation: (1) the anticorrelation between line broadening and the time lag of different lines in response to continuum variation (Peterson and Wandel, 1999; Peterson et al., 2004). This relation has been found for some nearby Seyfert-1 nuclei with a slope close to the one expected from the virial relation. (2) Velocity-resolved reverberation mapping (e.g., Gaskell, 1988; Koratkar and Gaskell, 1991; Grier et al., 2013) rules out outflow as the main broadening mechanism for LILs. A general assumption adopted in the interpretation of single-epoch spectra is that virial motion is indicated by almost symmetric and unshifted line profiles (within ≈100 km s−1 from rest frame, the typical rest frame uncertainty for moderate dispersion spectra).
6.2. Multi-Component Interpretation of Emission Lines
The broad profile of both LILs and HILs in each quasar spectrum can be modeled by changing the relative intensity of three main components, as shown schematically in Figure 4.
• The broad component (BC), which has been referred to by various authors as the broad component, the intermediate component, or the central broad component (e.g., Brotherton et al., 1994a; Popović et al., 2002; Kovačević-Dojčinović and Popović, 2015; Adhikari et al., 2016). As mentioned, the BC is represented by a symmetric and unshifted profile (Lorentzian for Pop. A or Gaussian for Pop. B) and is therefore assumed to be associated with a virialized BLR subsystem. The virialized BLR could be defined as the subregion that is in the condition to produce FeII emission.
• The blue shifted component (BLUE). A strong blue excess in Pop. A CIV profiles is not in doubt. In some CIV profiles like the extreme Population A prototype I Zw1 the blue excess is by far the dominant contributor to the total emission line flux (Marziani et al., 1996; Leighly and Moore, 2004). BLUE is modeled by one or more skew-normal distributions (Azzalini and Regoli, 2012). The “asymmetric Gaussian” use is, at present, motivated empirically by the often irregular appearance of the blueshifted excess in CIV and MgIIλ2800.
• The very broad component (VBC). The VBC was postulated because of typical Hβ profile of Pop. B sources, that can be (empirically) modeled with amazing fidelity (i.e., with no significant residuals above noise in the fit composite spectra), using the sum of two Gaussians, one narrower and almost unshifted (the BC) and one broader showing a significant redshift ~2, 000 km/s (Wills et al., 1993; Brotherton et al., 1994b; Zamfir et al., 2010). We expect a prominent CIV VBC associated with high ionization gas in the innermost BLR (Snedden and Gaskell, 2007; Marziani et al., 2010; Wang and Li, 2011; Goad and Korista, 2014). Past works indeed provided evidence of a VBC in CIV and Balmer lines (e.g., Marziani et al., 1996, 2010; Sulentic et al., 2000c; Punsly, 2010). Mirroring the definition of BLR, a VBLR may be defined as the region that is not able to emit significant FeII. Imposing significant FeII VBC emission in the multicomponent maximum likelihood fits of Population B Hβ produces unrealistic emission patterns in the FeII blend. Agreement is restored only when VBC emission is assumed negligible. At high L, BLUE can dominate in Pop. B CIVλ1549 profile, too, but the VBC remains well-visible, especially in Hβ.
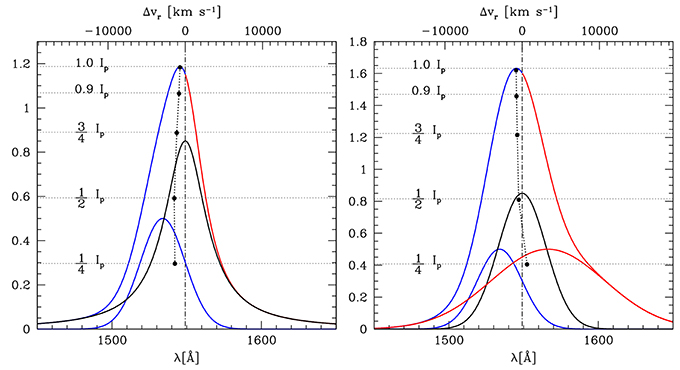
Figure 4. Interpretation of line profiles, for Pop A, and Pop. B (right). Fractional intensity levels where line centroids are measured are identified. Mock profiles are shown to represent the bare broad profile of any of the strongest emission lines of quasars. The left one is built on 2 components, as appropriate for Pop. A, which are the BC and a blue shifted excess BLUE. The blue shifted component is strong in HILs and weak in LILs. Pop. B profiles are accounted for by three components: in addition to the BC and BLUE, a redshifted VBC is needed to account for the prominent redward line profile asymmetry.
6.3. LIL- and HIL-Emitting Regions
The symmetric BC and the BLUE are consistent with a two-region model proposed since the late 1980s (Collin-Souffrin et al., 1988), where the BC is emitted in a flattened distribution of gas while BLUE is associated with an high ionization outflow. A two region model such as a disk + radiation dominated wind is also qualitatively consistent with the data (Elvis, 2000).
Considering intensity ratios using the full line profiles can be misleading and may yield to problematic inferences. For example, the explanation of the Lyα/Hβ ratio has been one of the most challenging problems in the interpretation of line formation within the BLR (Netzer et al., 1995). It is easier to account for the observed ratios if BLUE and BC are kept separated. In the BLUE case, the ratio Lyα/Hβ is very high, consistent with relatively low density and high ionization (≈30 close to the case A in the low-density limit, Osterbrock and Ferland 2006), while in the BC case Lyα/Hβ is low (≈5−10) which requires high density and low-ionization, following CLOUDY simulations (Marziani et al., 2010). It has proven possible to reproduce the profiles of the strongest broad emission lines along the MS changing the relative proportion of the three components, BLUE, BC, and VBC, but assuming consistent component shift, width and shape parameter for all lines. As a second example, it is interesting to consider the case of the CIVλ1549 profile in broad Pop. B RL and RQ sources. The centroid shifts to the blue are modest for both RQ and RL; however, redshifted are not unfrequent among RL but very rare among RQ (Sulentic et al., 2007; Richards et al., 2011). Comparing the CIV profile to Hβ offers a clue: Hβ can be accounted for by two Gaussians, one of them redshifted by ~ 1,000–2,000 km/s. With respect to the Hβ profile, the CIV lines shows a blueshifted excess (the BLUE component) that, even if not as strong as in Pop. A, has nonetheless the effect to symmetrize their profile. In some RL it may be completely absent, so that centroid measurements of CIV and Hβ agree (Marziani et al., 1996). This analysis allows us to infer two interesting facts: whenever BLUE is present we have CIV/Hβ ≫1 (if BLUE is not detected in Hβ, a lower limit to CIV/Hβ is measured from the noise); BLUE is apparently more prominent in Pop. B RQ than in RL, an effect that may be associated with the effect of the jet lateral expansion on the accretion disk wind (Sulentic et al., 2015).
The relative prominence of the three components can be accounted for in terms of balance of radiation and gravitation forces, at least in RQ quasars. If line emitting gas is optically thick to the Lyman continuum then the radiation will exert an outward acceleration that is inversely proportional to the column density Nc and directly proportional to the ionizing luminosity. The ratio between the radiative and gravitational acceleration for gas optically thick to the Lyman continuum is: where MBH is in units of 108 solar masses, and L44 the bolometric luminosity in units of 1044 erg/s, κ the fraction of the bolometric continuum that is ionizing HI (λ < 912Å), α ≈ 0.5(Marziani et al., 2010). The equation can take the form and shows that the net outward acceleration is proportional to L/LEdd, and inversely proportional to column density Nc. If ra≫1, radiative acceleration dominates, as it is apparently the case of the high ionization gas emitting the blueshifted excess (i.e., BLUE). If ra≪1, the emitting gas may be infalling toward the central black hole, yielding the observed redshifted VBC. This interpretation is compatible with large Nc values for the VBLR and would naturally explain why the VBC is observed in objects with low Eddington ratio, L/LEdd ≲ 0.1. Similar considerations have been made to explain the origin of an FeII redshift with respect to the broad FeII emission (Ferland et al., 2009; Hu et al., 2012). While the reality of FeII emission shifts is debatable (Sulentic et al., 2012), an infall scenario may well apply to inner BLR yielding a redshifted VBC, provided that column density is high enough to withstand radiation forces.
7. Connection to Accretion Parameters
Several physical parameters (black hole mass MBH, Eddington ratio, spin, and the aspect angle θ) are expected to affect the parameters of the E1 MS, even if in an indirect way as in the case of the spin. Establishing a connection between a physical and an observational set of parameters is precisely the aim of the 4DE1 parameter space. Table 2 lists the main physical parameters on which the empirical 4DE1 parameters are expected to be dependent. We still have a very incomplete view of the physics along the Eigenvector 1 sequence because we are able to make only coarse estimates of physical parameters. However, Eddington ratio and viewing angle θ are likely to be the main culprits affecting the location of a quasar along the MS, as discussed in the next sections.
7.1. Black Hole Mass
The virial black hole mass can be written as , where f is the emitting region structure or form factor, δv is a VBE (typically the line FWHM or its dispersion), and rBLR is a characteristic distance from the black hole of the line emitting gas (i.e., in practice the distance derived from reverberation mapping or from the photoionization method). There are two fundamental aspects to consider: evaluating MBH requires consistent estimates of rBLR and δv, for different lines; in addition, the parameters entering the virial expression of MBH (f, rBLR, δv) all depend on the location of the E1 sequence. It is an unfortunate circumstance that, to-date, this fact has not been taken into account in an exhaustive way. In the following we just mention how the applications of the E1 trends on the computation of MBH can improve the accuracy of its estimates.
7.1.1. The Virial Broadening Estimator (VBE)
There is a growing consensus that the line width of the strongest LILs (Hβ and Mgλ2800) provide a reliable VBE, up to the highest luminosities (e.g., Trakhtenbrot and Netzer, 2012; Mejía-Restrepo et al., 2016; Sulentic et al., 2017). UV intermediate emission lines – have been found suitable as well, at least for low-z quasars (Negrete et al., 2013), The HIL CIV has been considered as a sort of taboo, as it offers a highly biased VBE (Baskin and Laor, 2005; Netzer et al., 2007; Sulentic et al., 2007). The broadening of CIVλ1549 is affected by shear velocity in an outflow, and its FWHM is not immediately offering a reliable VBE (as recently discussed in the review of Marziani et al., 2017a). Figure 1 of Marziani et al. (2017a) shows the bias introduced into CIV MBH computations along the MS by using uncorrected FWHM CIV values. Actually, in Pop. A errors on MBH as large as factor of 100 are possible if the CIV FWHM is measured on the full CIV profile. Even if corrections can be derived, whether the CIV width may be a reliable VBE remains controversial (Denney et al., 2013; Coatman et al., 2017; Marziani et al., 2017a, and references therein). It is possible to identify corrections that would reduce the scatter between Hβ and CIV-based MBH estimates to ≈0.33 (Coatman et al., 2017; Marziani et al., 2017a). In other words, applying corrections to the CIV FWHM, the Hβ and CIV FWHM lines would become equivalent VBEs. While important conceptually, these corrections may be cumbersome to apply in practice: since they are based on measures of the CIV line shift [the nonparametric measure of Coatman et al. 2017 is equivalent to ], they still require the knowledge of the quasar rest frame which is not always straightforward to estimate (as pointed out in section 1; see also Hewett and Wild 2010 for a discussion of z-dependent biases). In addition, corrections are different for Pop. A and B, and considering the Eddington ratio bias implicit in flux limited samples (Sulentic et al., 2015), they may remain sample-dependent.
We are now able to analyze systematic trends for the virial broadening of low-ionization lines along the E1 MS leaving aside random orientation effects that are expected to influence δv estimates. We can define a parameter ξ yielding a correction to the observed profile: ξ = FWHMVBE/FWHMobs≈FWHMBC/FWHMobs, where the VBE FWHM can be considered best estimated by the FWHM of the broad component of any line, FWHMBC. The non-virial broadening affecting the integrated profiles of LILs along the E1 sequence is due to different mechanisms (as mentioned in section 5): the A3/A4 spectral types are affected by outflow, while the Hβ redward asymmetry may suggest an infall of the VBC emitting gas. However, the correction factor is modest (0.75 ≤ ξ ≤ 1.0) for both Hβ and MgIIλ2800, with ξ ≈ 1.0 in spectral types A1 and A2. In other words, a simple correction is sufficient to extract a VBE from the observed FWHM. The correction can be evaluated for each spectral type or by applying individual source corrections as described in Marziani et al. (2017a).
7.1.2. Estimates of rBLR
We can distinguish primary and secondary estimates of the radius of the BLR rBLR. Primary determinations come from reverberation mapping monitoring (Horne et al., 2004; Peterson, 2014, and references therein) and are measured from the time lag τ yielded by the peak or centroid of the cross-correlation function between continuum and line light curves. Primary estimates can be also obtained from rest-frame, single-epoch UV spectra using the so-called photoionization method, as summarized below. Secondary determinations are computed using the correlation between rBLR and luminosity that has been derived from reverberation-mapped sources (e.g., Kaspi et al., 2000, 2007; Bentz et al., 2009; Du et al., 2016): , a ≈ 0.5 – 0.65 (Kaspi et al., 2000; Bentz et al., 2006).
There are several caveats underlying the RM measure of rBLR and its scaling law with luminosity (Marziani and Sulentic, 2012). This correlation has a considerable scatter (Marziani and Sulentic, 2012) that is propagating itself on the mass scaling laws written in the form (e.g., Vestergaard and Peterson, 2006; Shen and Liu, 2012; Trakhtenbrot and Netzer, 2012). In addition, the rBLR – L scaling relation depends on dimensionless accretion rate (Du et al., 2016). Therefore the scaling laws should be redefined for at least Pop. A, extreme Pop. A (as actually done by Du et al. 2016) and Pop. B along the E1 sequence.
The ionization parameter U can be written as (Netzer, 2013), where Q(H) is the number of hydrogen ionizing photons. The radius of the BLR then can be recovered as , where dC is the comoving distance to the source (Hogg and Fruchter, 1999), and the integration is carried out to the Lyman limit λLy = 912 Å. Clearly, the ionizing photon flux UnH is a measurement of the exposure of the BLR to ionizing photons and hence has an intrinsic, strong dependence on rBLR. The first explorative estimates of MBH using the photoionization method were based on the rough similarity of AGN spectra, and on the consequent assumption of constant U or of constant product UnH(Padovani and Rafanelli, 1988; Wandel et al., 1999). The consideration of UV line ratios which can be used as diagnostics constraining ionizing photon flux, and, in some cases, nH(Verner et al., 2004; Negrete et al., 2013, 2014) yielded a major improvement. It is remarkable that the rBLR estimates from the UnH product and the Hβ rBLR = cτ from reverberation mapping are in very good agreement, at least for 12 low-L AGNs. In both cases (photoionization and reverberation) we are trying to give one number that should be representative of a very complex region, probably stratified, perhaps chaotic. Evidently, the 1,900 blend lines of AlIIIλ1860 and SiIII]λ1892 (but not CIIIλ1909!) trace the physical conditions of the Hβ emitting gas with maximum responsivity, which is not surprising since AlIIIλ1860 and SiIIλ1816 are lines emitted by ionic species with low-to-intermediate ionization potential, ≈ 15 − 20 eV (Negrete et al., 2012).
A second remarkable aspect emerges from the analysis of the 1,900 blend. Negrete et al. (2013) showed that the solutions yielding the UnH product differ significantly if the CIIIλ1909 is involved with other high ionization lines, or if CIVλ1549, AlIIIλ1860, SiIII]λ1892, SiIVλ1397,1402, SiIIλ1816 are considered. Their Figure 2 clearly shows that CIIIλ1909 involves a solution of lower density and higher ionization. This can be interpreted as evidence of stratification within the BLR. If extreme Population A sources are considered, CIIIλ1909 is weak in their spectra and only the low-ionization solution remains. The CIIIλ1909/SiIII]λ1892 ratio may be further lowered because of the relatively soft spectral energy distribution of xA sources (Casebeer et al., 2006). Apparently, the xA sources have their LIL/IIL emission dominated by dense, low-ionization gas (as lower density and column density gas is being pushed away from the BLR in a high ionization outflow with CIVλ1549/CIIIλ1909≫1).
The application of the photoionization method has been extended to high-L quasars where it remains basically untested: apart from the absence of systematic effects with scaling laws prediction, the precision and accuracy of individual photoionization estimates have nothing they can be compared with. Negrete et al. (2013) suggested a tentative correction on the basis of the equivalent width ratio between AlIII and CIII] (an E1 correlate) but the correction is highly uncertain. More objects are needed to better understand the behavior of the photoionization-derived rBLR along the E1 sequence. In principle, however, the photoionization method has the potential to reduce the intrinsic scatter in MBH determination, if it is really able to produce rBLR estimates in close agreement with the RM cτ.
7.2. Orientation Effects
There is no doubt that orientation effects influence the FWHM of Hβ in radio loud type-1 quasars (as mentioned in section 3): the line is systematically broader in FRII than in CD sources (e.g., Wills and Browne, 1986; Rokaki et al., 2003; Sulentic et al., 2003). It is reasonable to assume that similar amplitude effects are present also in RQ sources (Marziani et al., 2001) although defining a reliable orientation indicator has proved elusive. Recent results suggest that orientation is affecting the shifts of [OIII] (as well as the EW, Risaliti et al. 2011) and of FeII: face-on sources should show no FeII shifts and high amplitude blueshifts; more inclined sources should show FeII redshifts (associated with an equatorial inflow) and no net [OIII] blueshifts (Hu et al., 2008; Boroson, 2011). While [OIII] shifts and EWs are most likely affected by orientation, orientation does not appear to be the main parameter, if [OIII] emission is considered in different parts of the E1 sequence. Highly blueshifted sources (such as the BOs) are apparently associated exclusively with high Eddington ratio, more than those with a face-on orientation (Marziani et al., 2003b; Xu et al., 2012). The distribution of [OIII] blueshift amplitudes along the E1 sequence is qualitatively not consistent with orientation-only effects. As already mentioned, the reality of FeII high-amplitude redshifts that would serve as indicators has been questioned recently (Sulentic et al., 2012). Even if we have not yet identified an orientation indicator, orientation effects most likely account for a large part of the scatter in MBH determinations. The observed velocity can be parameterized as , and if viso/vKepl ≈ 0.1, where viso is an isotropic velocity component, and vKepl the Keplerian velocity. For a geometrically thin disk, it implies vobs ≈ vKepl/sinθ (if the FWHM is taken as the vobs, and vKepl = 0 i.e., in the case of isotropic velocity dispersion, ). If the VBE estimates are not corrected beforehand for orientation, the structure (or form) factor is f∝1/sin2θ(Jarvis and McLure, 2006). The structure factor is also expected to depend on physical parameters (Eddington ratio, metallicity, disk temperature etc.) apart from aspect effects.
7.3. The Structure Factor
The velocity resolved RM yields an amazing variety of velocity fields for different objects (e.g., Grier et al., 2013; Peterson, 2017). The evidence favoring a rotational component has been steadily growing, in part due to deep, single-epoch spectropolarimetric observations (e.g., Smith et al., 2005; Afanasiev et al., 2015) that revealed the polarization vector changes expected from the Keplerian velocity field as seen from an equatorial scatter. Systematic outflows have been made evident by the ubiquitous blueshifts of the CIVλ1549 emission line. A hint to the BLR structure is provided by the FWHM/σ ratio, where σ is the velocity dispersion of the profile. For Pop. A, the ratio is low, while it is close to the value expected for a Gaussian in Pop. B (Collin et al., 2006; Kollatschny and Zetzl, 2011). The implication drawn from this result by Kollatschny and Zetzl (2011) is that broader lines imply faster rotation, which is consistent with the inferences based on the 4DE1 context (section 8.1). The structures underlying the typical Pop. A and B broad profiles (section 8.1) are however still unclear.
In Pop. A the Lorentzian profiles are consistent with an extended accretion disk seen at moderate inclinations (Dumont and Collin-Souffrin, 1990), but in the context of AGN, several velocity fields can produce Lorentzian-like profiles (e.g., Mathews, 1993; Netzer and Marziani, 2010; Czerny et al., 2017). Recent works suggest a disk-core with wings produced in a region of enhanced vertical velocity dispersion with respect to the disk (Goad et al., 2012).
On the other hand the quasi-symmetric profiles of the Pop. B LILs imply virial/Keplerian motion with stratified physical properties (e.g., Fausnaugh et al., 2017). An intriguing possibility is that the VBC may be emitted by the inner accretion disk (Bon et al., 2009; Storchi-Bergmann et al., 2017), with the BC masking the double-peaked accretion disk profile expected if the disk external radius is not extremely large, .
Collin et al. (2006) derived different values for fS for Pop. A and B, 2.1 and 0.5 respectively, with a substantial scatter. The distinction between Pop. A and B therefore appears to be the minimal criterion to reduce scatter in MBH estimates, also because comparison of the same line width measure is not easy to understand if profile shapes are different. A more refined approach may consider individual spectral types along the quasar MS.
7.4. L/LEdd
The MBH scaling laws provide a simple recipe usable with single-epoch spectra of large samples of quasars. Estimates of the Eddington ratio are derived by applying a constant bolometric correction to the observed luminosity, typically a factor 10–13 from the flux at 5100 Å and 3.5–5 from the measured at 1450 Å(Elvis et al., 1994; Richards et al., 2006; Krawczyk et al., 2013). Bolometric corrections most likely depend on the source location along the MS: the anti correlation between UV luminosity and optical-to-X spectral index (between 2500 Å and 2 KeV) may go in the sense of softer continua in Pop. A (Laor et al., 1997; Steffen et al., 2006). In addition, bolometric corrections are most likely luminosity as well as orientation dependent (Runnoe et al., 2013). However, our group did not carry out a systematic study as yet, and applied almost always constant corrections.
7.5. Why Does Ionization Level Decrease With Increasing L/LEdd?
As early as in the 2000s, a puzzling but remarkable aspect appeared to be the decrease in ionization degree at high Eddington ratio: Pop. A spectra show strong FeII, low [OIII] and CIVλ1549, while Pop. B sources with L/LEdd≲ 0.2 show prominent (high EW) HILs.
The ionization parameter U can be rewritten in terms of L/MBH and MBH, under several assumptions. The number of ionizing photons is Q(H) ≈ κL/ < hν >. A typical AGN continuum as parameterized by Mathews and Ferland (1987) yields < ν >≈ 1 × 10¹⁶ Hz and κ ≈ 0.5. The velocity field for the LIL-emitting gas is mainly virial, so that we can write: FWHM ∝M1/2r−1/2. We can consider that the ratio I(AlIIIλ1860)/I(SiIII]λ1892) is a density-dependent diagnostics (almost independent of the ionization parameter)5, and that I(Al III)/I(Si III]λ1892) and I(Si III]λ1892)/I(C III]) are inversely correlated with FWHM. Using the trend found by Wills et al. (1999), n∝ FWHM−4/3. At this point it is possible to write RFeII as a function of L/LEdd and MBH using two approaches (Marziani et al., 2001).
• Considering that L/MBH∝ FWHM−2, with MBH estimated from X-ray variability, not from the virial relation, to avoid circularity. The expression for follows from n∝ FWHM−4/3 and r∝M/FWHM2.
• Adopting the r ∝ La scaling law, and considering again that n ∝ FWHM−4/3 and FWHM , . With a = 1, the first expression is recovered. For a = 0.5 there is a weaker dependence on (L/MBH) to the power of .6
The grid shown in Marziani et al. (2001) obtained using the first approach does not make it possible to derive orientation angle θ and L/LEdd for individual quasars, as it was computed for a fixed MBH. These considerations provide a first account of why sources at the high-L/MBH tip are associated with a lower ionization degree. Other explanations are possible as well: the line emitting gas is shielded from the most intense UV radiation, for example by an optically and geometrically thick slim disk (Wang et al., 2014b) or by an inner, over-ionized failed wind (Leighly, 2004) but the intensity ratios of I(Al III)/I(Si III]λ1892) and I(Si III]λ1892)/I(C III]) point toward an increase of the emissivity-weighted density values of the line emitting gas. This alone yields a decrease in U at high L/LEdd, all other parameters left unchanged.
8. Self-Similarity of the Accretion Process
The accretion process is apparently largely self-similar over several order of magnitudes in black hole mass and luminosity. The general fundamental plane of accreting black holes emphasizes the invariance of the accretion disk-jet scaling phenomena (Merloni et al., 2003). The Eigenvector 1 scheme is also emphasizing a scale invariance, albeit more oriented toward the radiatively-efficient domain and, in the quasar context, limited to unobscured type-1 quasars. As far as the radiatively efficient accretion mode is concerned, the invariance may hold over a factor of almost ~1010 in solar mass (Zamanov and Marziani, 2002). Restricting the attention to RQ quasars, very large blueshifts are observed over at least four orders of magnitude in luminosity. The distribution of data points in Figure 5 is clearly affected by selection effects; however, it shows that large CIV km s−1 do occur also at relatively low luminosity. Outflow velocities are apparently more related to Eddington ratio than to L or MBH: large blueshifts may occur only above a threshold at about L/LEdd ≈ 0.2 − 0.3 which may in turn correspond to a change in accretion disk structure (Abramowicz and Straub, 2014, and references therein). Intriguingly, the threshold matches the FWHM(Hβ)≈ 4, 000 km s−1 limit separating Population A from Population B (if L ≲ 1047 erg s−1). At this limiting FWHM we observe also a change in Hβ profile shape, from Lorentzian-like to double Gaussian (Sulentic et al., 2002; Zamfir et al., 2010).
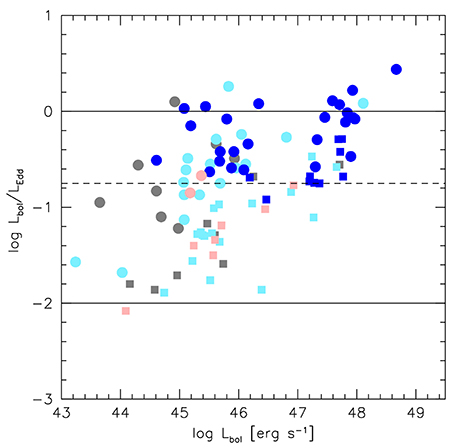
Figure 5. Behavior of CIV shifts in the plane Eddington ratio versus bolometric luminosity. Circles indicate Pop. A, squares Pop. B. Color coding is as follows: blue, km s−1; pale blue: km s−1; gray km s−1; pale red: km s−1; red km s−1. The sample sources correspond to the Hamburg-ESO sample (all above L ≳ 1047 erg s−1) and FOS-based control sample of Sulentic et al. (2017).
8.1. Pop. A and B: A Different Accretion Structure
We propose the two panels with the sketches shown in Figure 6 as a pictorial view of quasars accreting at high (left) and low rate respectively (c.f. Marinucci et al., 2012; Marziani et al., 2014; Luo et al., 2015). The main theoretical prediction is that we expect an inner accretion disk region assimilable to a slim disk (Abramowicz et al., 1988; Szuszkiewicz et al., 1996; Frank et al., 2002). Apart from this, the structure of the BLR and its relation to the accretion disk structure remains unclear.
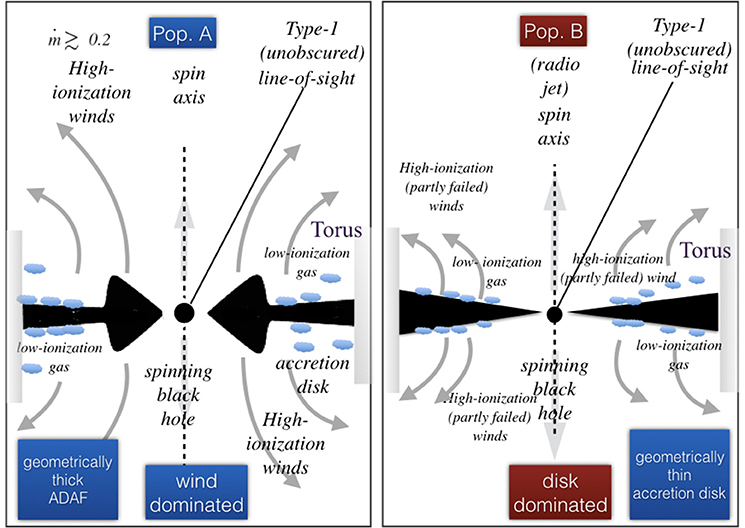
Figure 6. Different structure for Pop. A (left) and B (right), with a slim and a flat disk respectively. The sketch is not drawn to scale and the relation between line emitting regions (shown here as clouds) and accretion disk structure is still debated. See section 8.1 for a more detailed explanation.
In Pop. A sources, as mentioned before (section 7.5), it is tempting to speculate that LILs may be favored with respect to HILs by the shielding of the hottest continuum due to the slim disk geometry. However, the question remains whether the ionized outflow we see in CIVλ1549 is associated with the central cone defined by the walls of the slim disk (which may be much steeper than the ones deducted in the cartoon, Sa̧dowski et al. 2014). In Pop. A, the CIV shifts are largest but the CIV EW is lowest (Pop. A includes weak lined quasars, Diamond-Stanic et al. 2009; Shemmer et al. 2010), which may imply that the gas is over-ionized or, alternatively, that the FUV continuum is absorbed/weakened, as in the case of emission from the shielded part of the disk between the slim structure and the torus (Luo et al., 2015). Against the latter interpretation goes the higher ratio of radiation-to-gravitation forces of Pop. A which yields a higher terminal velocity and hence systematically large blueshifts in the HILs: continuum seen by the gas should at least roughly correspond to the continuum seen by us.
In the case of a flat-disk (Pop. B right-panel), the problem of disk wind over-ionization may be solved by the failed wind scenario (Murray et al., 1995): inner gas may offer an effective screen and only shielded gas is efficiently accelerated (Leighly, 2004). Models of disk-wind systems are successful in reproducing the profiles of Balmer lines (Flohic et al., 2012). To explain the redward asymmetries often observed in Pop. B, either Balmer lines are emitted in an infall scenario (which require large column density to withstand radiation forces) or the accretion disk itself could be emitter. In the latter case the redward asymmetry could be ascribed in full to transverse and gravitational redshift (Bon et al., 2009, 2015).
Apart from these considerations, the sketch of Figure 6 raises more questions than it provides answers. For example, can the inner part of the torus contribute to the velocity dispersion and yield a Lorentzian profile (Goad et al., 2012)? This question raises a conflict with the virial assumption for Pop. A sources, whereas the line wings are expected to be emitted closer to the black hole. Electron scattering may also produce extended line wings in the Balmer lines (Laor, 2006). Roles of magnetic fields and of black hole spin are not considered although presumably important, black hole spin because of its effect on the inner accretion disk temperature, and magnetic fields because they may provide an acceleration mechanism for disk wind (Emmering et al., 1992).
8.2. The Quasar Main Sequence at High Luminosity
We still lack a comprehensive view of the MS at high L (we consider high-luminosity sources the quasars with bolometric logL ≳ 47 [erg/s]), not last because the Hβ spectral range is accessible only with IR spectrometers, and high-luminosity quasars are exceedingly rare at z ≲ 1. The main effect that we expect in the optical plane of the 4DE1 space is related to their systematic increase in mass: if the motion in the LIL-BLR is predominantly virial () and the BLR radius follows a scaling power-law with luminosity (r∝La), then FWHM . Assuming that L/LEdd saturates toward values (Mineshige et al., 2000), the minimum FWHM should show a clear trend with luminosity. This prediction has been confirmed by joining samples covering more than 4dex in logL, from 44 to 48 (Marziani et al., 2009). At each L there is a large spread of value that reflect the dependence of FWHM by Eddington ratio and mass.
At high L, the MS becomes displaced toward higher FWHM values in the OP of the E1, as schematically represented in the diagram of Figure 7. At present, we cannot say whether there is also a luminosity effect on FeII prominence: relatively few sources are available to map the broad distribution of RFeII. Reports of an FeII Baldwin effect appear unconvincing and contradicted by the best available observations of the Hβ range at high luminosity. In addition, observations of high-L quasars from flux-limited surveys are subject to a strong Eddington ratio bias (Sulentic et al., 2014) which may instead suggest an anti-Baldwin effect in FeII (Kovačević et al., 2010). The Eddington ratio bias involves the preferential selection of higher L/LEdd sources at higher z. Since RFeII strongly depends on L/LEdd (section 7.5), low RFeII might be preferentially lost at high-z.
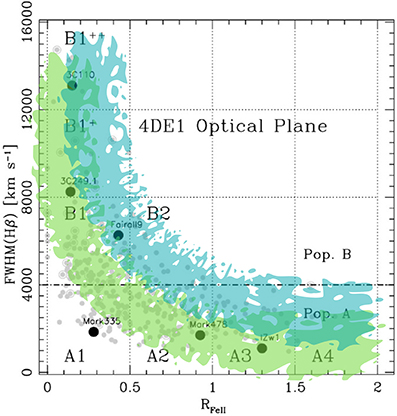
Figure 7. Schematic representation of the E1 MS displacement in high luminosity samples. The dark green shaded area represents a high luminosity log L ≳ 47 sample. In that case, NLSy1s are not anymore possible, if the virial assumption holds up to the Eddington limit.
The comparison between low- and high-ionization lines has provided insightful constraints on the BLR at low-z(Marziani et al., 1996). The comparison of Hβ and CIVλ1549 is yielding interesting clues also at high L (Shen, 2016; Bisogni et al., 2017; Sulentic et al., 2017). Perhaps the most remarkable fact is that a LIL-BLR appears to remain basically virialized (Marziani et al., 2009; Sulentic et al., 2017). The CIVλ1549 blueshift depends on luminosity (the median is ≈ 2,600 km s−1 and 1,800 km s−1 for Pop. A and B RQ at high-L against < 1,000 km s−1 at low-L), but the dependence is not strong, and can be accounted for in the framework of a radiation driven winds. Assuming L/LEdd ≈ const. (as is the case if a strong Eddington bias yields to a narrow range of L/LEdd as in high-z, present-day flux-limited samples), a luminosity dependence for arises in the form ∝L1/4. If L is restricted to a narrow range, the L/LEdd dependence dominates. If L/LEdd and L both span significant ranges, a multivariate analysis confirms the concomitant dependence on both parameters (Sulentic et al., 2017).
9. Extreme Population A Sources: Extreme Radiators and Potential Distance Indicators
Sources belonging to spectral types A3 and A4 (i.e., satisfying the criterion RFeII> 1) are found to be radiating at the highest Eddington ratio. They show a relatively small dispersion along a well-defined, extreme value of order (1)7 (Marziani and Sulentic, 2014). The xA selection criterion is consistent with the parameter ∝ FWHM/σ+RFeII used to identify super-massive extremely accreting BHs (SEAMBHs Wang et al., 2013; Du et al., 2016). Since xA sources show Lorentzian profiles, the criterion based on RFeII should be sufficient unless relatively broad profiles with FWHM≳4,000 km s−1 are considered, a case still under scrutiny.
If L/MBH ≈ const., then the luminosity can be retrieved once the mass is known. xA sources show very similar spectra over a broad range of luminosity. The self-similarity in terms of diagnostic line ratios justifies the use of the scaling law that implies spectral invariance. The luminosity can then be written as L∝(δv)4, where δv is a suitable VBE. It is interesting to note that this relation is in the same form of the Faber-Jackson law as originally defined (Faber and Jackson, 1976). Assuming that spheroidal galaxies are virialized systems, radiating at a constant L/MBH ratio implies that their luminosity is , where μB is the surface brightness within the effective radius. Later developments yielded a different exponent for the dependence on σ (e.g., D'Onofrio et al., 2017, and references theerin), as the assumption of a constant surface brightness proved untenable. There should be no similar difficulties for quasars, although statistical and systematic sources of error should be carefully assessed (Marziani and Sulentic, 2014). The distance modulus computed from the virial equation, μ = 2.5[logL(δv)−BC]−2.5log(fλλ)−const.+5·log(1+z), where fλλ is the flux at 5100 Å, and BC the bolometric correction, is in agreement with the expectation of the concordance ΛCDM cosmology, providing a proof of the conceptual validity of the virial luminosity L∝(δv)4 estimates (a plot of μ for several quasar samples is provided by Marziani et al., 2017b, and by Negrete et al. 2017).
10. Conclusion
The quasar MS provides a tool to systematically organize quasar multifrequency properties. It allows the identification of spectral types with fairly well-defined spectral properties. In this paper, we have described a simple parameterization that is able to describe the quasar emission line profiles, as well as a heuristic technique motivated by the internal line shifts yielding the separation of components in different physical conditions.
We then considered the MS defined in the so-called optical plane of the 4D eigenvector 1 parameter space, and analyzed several correlates involving the profile of Hβ and MgIIλ2800 (the representative LILs), of the CIVλ1549 (the representative HIL), broad-line UV diagnostic ratios that provide trends in density and ionization level, [OIII]λλ4959,5007 shifts, the prevalence of radio-loudness, and the soft X-ray spectral slope.
The trends defined in this paper offer a consistent, empirical systematization of quasar properties for z ≲ 1, low-to moderate luminosity quasars. The difference between Pop. A and B is evident at the extremes: spectral type A4 sources typically show very strong FeII (RFeII ≳ 1.5), blueward asymmetry in Hβ, large CIVλ1549 blueshift, weak and blue shifted [OIII]λλ4959,5007(Negrete et al., 2017). Extreme Pop. B show undetectable FeII, very broad red-ward asymmetric Hβ profiles, small-amplitude CIVλ1549 shifts, prominent [OIII]λλ4959,5007. There is evidence that the two populations represent structurally different objects. The blue shifted excess (BLUE) is interpreted as due to outflowing gas dominating HIL emission only in Pop. A (unless sources at very high L are considered). A redshifted VBC is present only in Pop. B, for values of FWHM Hβ above 4,000 km s−1, and has been interpreted as due to gas close to the central continuum source. The relative balance between gravitational and radiation forces (i.e., L/LEdd) appears as a major factor influencing both the dynamics and the physical conditions of the line emitting gas (Sect. 8.2), and an accretion mode change may be associated with a critical L/LEdd ~0.2±0.1, leading to the two quasar populations: A (wind-dominated, following Richards et al. 2011), and B (virial or disk-dominated).
Luminosity trends are weak as they become significant only over a wide luminosity range ~1043−1048 erg/s. They involve an overall increase in virial line broadening (LILs) and an increase of blueshift frequency and amplitude consistent with the dominance of radiation forces (HILs).
The presence of a virialized subregion identified along the MS at low-L as well as at high-L has important consequences. xA quasars at the high RFeII end (spectral type A3 and A4) may be suitable as Eddington standard candles since their Eddington ratio scatters around a well-defined value (e.g., Negrete et al., 2017).
The contextualization offered by the MS is instrumental to the development of better-focused physical models along the quasar main sequence. As examples of the advantages offered by the E1 MS, we just mention the possibility of contextualizing orientation effects in RQ quasars, and of performing a meaningful comparison between RL and RQ samples with similar optical properties. An aspect still to clarify is the connection between disk structure and the dynamics of the line emitting gas.
Author Contributions
PM wrote the paper; DD, MD, GS, EB, and NB contributed with a critical reading and suggestions; AD, CN, MM-A, and JS contributed with a critical reading.
Funding
AD and MM-A acknowledge financial support from the Spanish Ministry for Economy and Competitiveness through grants AYA2013-42227-P and AYA2016-76682-C3-1-P. DD and CN acknowledge support from grants PAPIIT108716, UNAM, and CONACyT221398. EB and NB acknowledge grants 176003 Gravitation and the large scale structure of the Universe and 176001 Astrophysical spectroscopy of extragalactic objects supported by the Ministry of Education and Science of the Republic of Serbia.
Conflict of Interest Statement
The authors declare that the research was conducted in the absence of any commercial or financial relationships that could be construed as a potential conflict of interest.
Acknowledgments
It is a pleasure to thank the SOC of the meeting Quasar at all cosmic epoch for inviting a talk on the quasar main sequence.
Footnotes
1. ^The Baldwin effect was originally described by Baldwin et al. (1978) and later detected in several samples (Laor et al., 1995; Wills et al., 1999); negative results were concurrently obtained (Wu et al., 1983; Wilkes et al., 1999). Sulentic et al. (2000a) discuss early works, and the main reason of this apparent contradiction.
2. ^The term broad component without the suffix BC is used here to identify the full broad profile excluding the Hβ narrow component. In more recent times, we have distinguished between two components, the broad component HβBC and the very broad component HβVBC. The HβBC is associated with the core of the Hβ broad line, and the HβVBC with its broader base (see section 6.2).
3. ^HIL luminosity effects are subject to strong biases. It is as yet unclear whether such biases can entirely account for the weak luminosity effects observed in large samples.
4. ^The 4,000 km s−1 limit is appropriate at low redshift and moderate luminosity logL ≲ 47 [erg s−1]; see the discussion in section 8.2.
5. ^While the ratio I(SiIII]λ1892)/I(CIIIλ1909) may depend on the spectral energy distribution (Casebeer et al., 2006), the ratio I(AlIIIλ1860)/I(SiIII]λ1892) is unlikely to show a strong dependence because the involved ionic species have similar ionization potential, and the transition upper levels are close in energy above ground level.
6. ^Note that, in this case, it is not necessary that a = 0.5 to recover spectral similarity. Different spectral types are likely to be associated with different scaling with luminosity.
7. ^The exact values depend on the normalization assumed for MBH estimates and for the bolometric correction.
References
Abdo, A. A., Ackermann, M., Ajello, M., Axelsson, M., Baldini, L., Ballet, J., et al. (2009). Fermi/large area telescope discovery of gamma-ray emission from a relativistic jet in the narrow-line quasar PMN J0948+0022. Astrophys. J 699, 976–984. doi: 10.1088/0004-637X/699/2/976
Abramowicz, M. A., Czerny, B., Lasota, J. P., and Szuszkiewicz, E. (1988). Slim accretion disks. Astrophys. J 332, 646–658. doi: 10.1086/166683
Abramowicz, M. A., Lanza, A., and Percival, M. J. (1997). Accretion disks around kerr black holes: vertical equilibrium revisited. Astrophys. J 479:179. doi: 10.1086/303869
Abramowicz, M. A., and Straub, O. (2014). Accretion discs. Scholarpedia 9:2408. doi: 10.4249/scholarpedia.2408
Adhikari, T. P., Różańska, A., Czerny, B., Hryniewicz, K., and Ferland, G. J. (2016). The Intermediate-line region in active galactic nuclei. Astrophys. J 831:68. doi: 10.3847/0004-637X/831/1/68
Afanasiev, V. L., Shapovalova, A. I., Popović, L. Č., and Borisov, N. V. (2015). Spectropolarimetric monitoring of active galaxy 3C 390.3 with 6-m telescope SAO RAS in the period 2009-2014. Mon. Not. R. Astron. Soc. 448, 2879–2889. doi: 10.1093/mnras/stv210
Antonucci, R. R. J., and Miller, J. S. (1985). Spectropolarimetry and the nature of NGC 1068. Astrophys. J 297, 621–632. doi: 10.1086/163559
Azzalini, A., and Regoli, G. (2012). Some properties of skew-symmetric distributions. Ann. Inst. Statist. Math. 64, 857–879. doi: 10.1007/s10463-011-0338-5
Bachev, R., Marziani, P., Sulentic, J. W., Zamanov, R., Calvani, M., and Dultzin-Hacyan, D. (2004). Average ultraviolet quasar spectra in the context of eigenvector 1: a baldwin effect governed by the eddington ratio? Astrophys.J 617, 171–183. doi: 10.1086/425210
Baldwin, J. A., Burke, W. L., Gaskell, C. M., and Wampler, E. J. (1978). Relative quasar luminosities determined from emission line strengths. Nature 273, 431–435. doi: 10.1038/273431a0
Baldwin, J. A., Ferland, G. J., Korista, K. T., Carswell, R. F., Hamann, F., Phillips, M. M., et al. (1996). Very high density clumps and outflowing winds in QSO broad-line regions. Astrophys. J 461, 664–682. doi: 10.1086/177093
Baskin, A., and Laor, A. (2005). What controls the CIV line profile in active galactic nuclei? Mon. Not. Roy. Astron. Soc. 356, 1029–1044. doi: 10.1111/j.1365-2966.2004.08525.x
Bensch, K., del Olmo, A., Sulentic, J., Perea, J., and Marziani, P. (2015). Measures of the Soft X-ray excess as an eigenvector 1 parameter for active galactic nuclei. J. Astrophys. Astron. 36, 467–474. doi: 10.1007/s12036-015-9355-8
Bentz, M. C., Peterson, B. M., Pogge, R. W., and Vestergaard, M. (2009). The black hole mass-bulge luminosity relationship for active galactic nuclei from reverberation mapping and hubble space telescope imaging. Astrophys. J. Lett. 694, L166–L170. doi: 10.1088/0004-637X/694/2/L166
Bentz, M. C., Peterson, B. M., Pogge, R. W., Vestergaard, M., and Onken, C. A. (2006). The radius-luminosity relationship for active galactic nuclei: the effect of host-galaxy starlight on luminosity measurements. Astrophys. J. 644, 133–142. doi: 10.1086/503537
Berton, M., Caccianiga, A., Foschini, L., Peterson, B. M., Mathur, S., Terreran, G., et al. (2016). Compact steep-spectrum sources as the parent population of flat-spectrum radio-loud narrow-line Seyfert 1 galaxies. Astron. Astrophys. 591:A98. doi: 10.1051/0004-6361/201628171
Bian, W.-H., Fang, L.-L., Huang, K.-L., and Wang, J.-M. (2012). The C IV baldwin effect in quasi-stellar objects from seventh data release of the sloan digital sky survey. Month. Notices R. Astron. Soc. 427, 2881–2888. doi: 10.1111/j.1365-2966.2012.22123.x
Bischetti, M., Piconcelli, E., Vietri, G., Bongiorno, A., Fiore, F., Sani, E., et al. (2017). The WISSH quasars project. I. Powerful ionised outflows in hyper-luminous quasars. Astron. Astrophys. 598:A122. doi: 10.1051/0004-6361/201629301
Bisogni, S., di Serego Alighieri, S., Goldoni, P., Ho, L. C., Marconi, A., Ponti, G., et al. (2017). Simultaneous detection and analysis of optical and ultraviolet broad emission lines in quasars at z ~ 2.2. Astron. Astrophys. 603:A1. doi: 10.1051/0004-6361/201630143
Blandford, R. D., and Payne, D. G. (1982). Hydromagnetic flows from accretion discs and the production of radio jets. Month. Notices R. Astron. Soc. 199, 883–903. doi: 10.1093/mnras/199.4.883
Blandford, R. D., and Znajek, R. L. (1977). Electromagnetic extraction of energy from Kerr black holes. Month. Notices R. Astron. Soc. 179, 433–456.
Blanton, M. R., Bershady, M. A., Abolfathi, B., Albareti, F. D., Allende Prieto, C., Almeida, A., et al. (2017). Sloan digital sky survey IV: mapping the milky way, nearby galaxies, and the distant universe. Astron. J. 154:28. doi: 10.3847/1538-3881/aa7567
Boller, T., Brandt, W. N., and Fink, H. (1996). Soft X-ray properties of narrow-line Seyfert 1 galaxies. Astron. Astrophys. 305:53.
Bon, E., Popović, L. Č., Gavrilović, N., Mura, G. L., and Mediavilla, E. (2009). Contribution of a disc component to single-peaked broad lines of active galactic nuclei. Month. Notices R. Astron. Soc. 400, 924–936. doi: 10.1111/j.1365-2966.2009.15511.x
Bon, N., Bon, E., Marziani, P., and Jovanović, P. (2015). Gravitational redshift of emission lines in the AGN spectra. Astrophys. Space Sci. 360:7. doi: 10.1007/s10509-015-2555-5
Boroson, T. A. (2011). A new orientation indicator for radio-quiet quasars. Astrophys. J. Lett. 735:L14+. doi: 10.1088/2041-8205/735/1/L14
Boroson, T. A., and Green, R. F. (1992). The emission-line properties of low-redshift quasi-stellar objects. Astrophys. J. Suppl. 80, 109–135. doi: 10.1086/191661
Brotherton, M. S., Runnoe, J. C., Shang, Z., and DiPompeo, M. A. (2015). Bias in C IV-based quasar black hole mass scaling relationships from reverberation mapped samples. Month. Notices R. Astron. Soc. 451, 1290–1298. doi: 10.1093/mnras/stv767
Brotherton, M. S., Wills, B. J., Francis, P. J., and Steidel, C. C. (1994a). The intermediate line region of QSOs. Astrophys. J. 430, 495–504. doi: 10.1086/174425
Brotherton, M. S., Wills, B. J., Steidel, C. C., and Sargent, W. L. W. (1994b). Statistics of QSO broad emission-line profiles. 2: the C IV wavelength 1549, C III) wavelength 1909, and MG II wavelength 2798 lines. Astrophys. J. 423, 131–142. doi: 10.1086/1737194
Casebeer, D. A., Leighly, K. M., and Baron, E. (2006). FUSE observation of the narrow-Line seyfert 1 galaxy RE 1034+39: dependence of broad emission line strengths on the shape of the photoionizing spectrum. Astrophys. J. 637, 157–182. doi: 10.1086/498125
Cavaliere, A., and Vittorini, V. (2000). The fall of the quasar population. Astrophys. J. 543, 599–610. doi: 10.1086/317155
Coatman, L., Hewett, P. C., Banerji, M., and Richards, G. T. (2016). C iv emission-line properties and systematic trends in quasar black hole mass estimates. Month. Notices R. Astron. Soc. 461, 647–665. doi: 10.1093/mnras/stw1360
Coatman, L., Hewett, P. C., Banerji, M., Richards, G. T., Hennawi, J. F., and Prochaska, J. X. (2017). Correcting C IV-based virial black hole masses. Month. Notices R. Astron. Soc. 465, 2120–2142. doi: 10.1093/mnras/stw2797
Collin, S., Kawaguchi, T., Peterson, B. M., and Vestergaard, M. (2006). Systematic effects in measurement of black hole masses by emission-line reverberation of active galactic nuclei: eddington ratio and inclination. Astron. Astrophys. 456, 75–90. doi: 10.1051/0004-6361:20064878
Collin-Souffrin, S., Dyson, J. E., McDowell, J. C., and Perry, J. J. (1988). The environment of active galactic nuclei. I - A two-component broad emission line model. Month. Notices R. Astron. Soc. 232, 539–550.
Corbin, M. R., and Boroson, T. A. (1996). Combined ultraviolet and optical spectra of 48 low-redshift QSOs and the relation of the continuum and emission-line properties. Astrophys. J. Suppl. 107:69. doi: 10.1086/192355
Cracco, V., Ciroi, S., Berton, M., Di Mille, F., Foschini, L., La Mura, G., et al. (2016). A spectroscopic analysis of a sample of narrow-line Seyfert 1 galaxies selected from the Sloan Digital Sky Survey. Month. Notices R. Astron. Soc. 462, 1256–1280. doi: 10.1093/mnras/stw1689
Czerny, B., Li, Y.-R., Sredzinska, J., Hryniewicz, K., Panda, S., Wildy, C., et al. (2017). Self-consistent dynamical model of the broad line region. Front. Astron. Space Sci. 4:5 doi: 10.3389/fspas.2017.00005
Czerny, B., and You, B. (2016). Accretion in active galactic nuclei and disk-jet coupling. Astron. Nachr. 337:73. doi: 10.1002/asna.201512268
Denney, K. D., Pogge, R. W., Assef, R. J., Kochanek, C. S., Peterson, B. M., and Vestergaard, M. (2013). C IV line-width anomalies: the perils of low signal-to-noise spectra. Astrophys. J. 775:60. doi: 10.1088/0004-637X/775/1/60
Diamond-Stanic, A. M., Fan, X., Brandt, W. N., Shemmer, O., Strauss, M. A., Anderson, S. F., et al. (2009). High-redshift SDSS Quasars with weak emission lines. Astrophys. J. 699, 782–799. doi: 10.1088/0004-637X/699/1/782
Diaz, A. I., Terlevich, E., and Terlevich, R. (1989). Near-IR features in late type stars - Their relation with stellar atmosphere parameters. Month. Notices R. Astron. Soc. 239, 325–345. doi: 10.1093/mnras/239.2.325
Dietrich, M., Hamann, F., Shields, J. C., Constantin, A., Vestergaard, M., Chaffee, F., et al. (2002). Continuum and emission-Line strength relations For a large active galactic nuclei sample. Astrophys. J. 581, 912–924. doi: 10.1086/344410
Done, C., Davis, S. W., Jin, C., Blaes, O., and Ward, M. (2012). Intrinsic disc emission and the soft X-ray excess in active galactic nuclei. Month. Notices R. Astron. Soc. 420, 1848–1860. doi: 10.1111/j.1365-2966.2011.19779.x
D'Onofrio, M., Cariddi, S., Chiosi, C., Chiosi, E., and Marziani, P. (2017). On the origin of the fundamental plane and faber-jackson relations: implications for the star formation problem. Astrophys. J. 838:163. doi: 10.3847/1538-4357/aa6540
D'Onofrio, M., Marziani, P., and Sulentic, J. W. (eds.) (2012). Fifty Years of Quasars From Early Observations and Ideas to Future Research, Vol. 386, Astrophysics and Space Science Library. Berlin; Heidelberg: Springer Verlag.
Du, P., Lu, K.-X., Hu, C., Qiu, J., Li, Y.-R., Huang, Y.-K., et al. (2016). Supermassive black holes with high accretion rates in active galactic nuclei. VI. velocity-resolved reverberation mapping of the Hβ line. Astrophys. J. 820:27. doi: 10.3847/0004-637X/820/1/27
Dultzin-Hacyan, D., Krongold, Y., Fuentes-Guridi, I., and Marziani, P. (1999). The close environment of seyfert galaxies and its implication for unification models. Astrophys. J. 513, L111–L114. doi: 10.1086/311925
Dultzin-Hacyan, D., Marziani, P., and Sulentic, J. W. (2000). “The Broad Line Region in Active Galactic Nuclei,” in Revista Mexicana de Astronomia y Astrofisica Conference Series, Vol. 9, eds S. J. Arthur, N. S. Brickhouse, and J. Franco (Mexico City), 308–315.
Dultzin-Hacyan, D., Sulentic, J., Marziani, P., Calvani, M., and Moles, M. (1997). “A Correlation Analysis for Emission Lines in 52 AGN,” in IAU Colloq. 159: Emission Lines in Active Galaxies: New Methods and Techniques, Vol 113, Astronomical Society of the Pacific Conference Series, eds B. M. Peterson, F.-Z. Cheng, and A. S. Wilson (San Francisco, CA), 262.
Dumont, A. M., and Collin-Souffrin, S. (1990). Line and continuum emission from the outer regions of accretion discs in Active Galactic Nuclei. V - Detailed computational results. Astron. Astrophys. 83, 71–89.
Elvis, M., Wilkes, B. J., McDowell, J. C., Green, R. F., Bechtold, J., Willner, S. P., et al. (1994). Atlas of quasar energy distributions. Astroph. J. Supp 95, 1–68. doi: 10.1086/192093
Emmering, R. T., Blandford, R. D., and Shlosman, I. (1992). Magnetic acceleration of broad emission-line clouds in active galactic nuclei. Astrophys. J. 385, 460–477. doi: 10.1086/170955
Eracleous, M., and Halpern, J. P. (2003). Completion of a survey and detailed study of double-peaked emission lines in radio-loud active galactic nuclei. Astrophys. J. 599, 886–908. doi: 10.1086/379540
Eun, D.-I., Woo, J.-H., and Bae, H.-J. (2017). A systematic Search for hidden type 1 AGNs: gas kinematics and scaling relations. Astrophys. J. 842:5. doi: 10.3847/1538-4357/aa6daf
Faber, S. M., and Jackson, R. E. (1976). Velocity dispersions and mass-to-light ratios for elliptical galaxies. Astrophys. J. 204, 668–683. doi: 10.1086/154215
Fausnaugh, M. M., Grier, C. J., Bentz, M. C., Denney, K. D., De Rosa, G., Peterson, B. M., et al. (2017). Reverberation mapping of optical emission lines in five active galaxies. Astrophys. J. 840:97. doi: 10.3847/1538-4357/aa6d52
Ferland, G. J., Hu, C., Wang, J., Baldwin, J. A., Porter, R. L., van Hoof, P. A. M., et al. (2009). Implications of infalling fe II-emitting clouds in active galactic nuclei: anisotropic properties. Astrophys. J. Lett. 707, L82–L86. doi: 10.1088/0004-637X/707/1/L82
Flohic, H. M. L. G., Eracleous, M., and Bogdanović, T. (2012). Effects of an accretion disk wind on the profile Of the balmer emission lines from active galactic nucle. Astrophys. J. 753:133. doi: 10.1088/0004-637X/753/2/133
Foschini, L., Fermi/Lat Collaboration, Ghisellini, G., Maraschi, L., Tavecchio, F., and Angelakis, E. (2010). “Fermi/lAT discovery of gamma-ray emission from a relativistic jet in the narrow-line seyfert 1 quasar PMN J0948+0022,” in Accretion and Ejection in AGN: a Global View, Vol. 427, Astronomical Society of the Pacific Conference Series, eds L. Maraschi, G. Ghisellini, R. Della Ceca, and F. Tavecchio (San Francisco, CA), 243–248.
Fraix-Burnet, D., Marziani, P., D'Onofrio, M., and Dultzin, D. (2017). The phylogeny of quasars and the ontogeny of their central black holes. Front. Astron. Space Sci. 4:1. doi: 10.3389/fspas.2017.00001
Francis, P. J., Hewett, P. C., Foltz, C. B., and Chaffee, F. H. (1992). An objective classification scheme for QSO spectra. Astrophys. J. 398, 476–490. doi: 10.1086/171870
Frank, J., King, A., and Raine, D. J. (2002). Accretion Power in Astrophysics: 3rd Edn. Cambridge: Cambridge University Press.
Gaskell, C. M. (1982). A redshift difference between high and low ionization emission-line regions in QSOs - evidence for radial motions. Strophys. J. 263, 79–86. doi: 10.1086/160481
Gaskell, C. M. (1988). Direct evidence for gravitational domination of the motion of gas within one light-week of the central object in NGC 4151 and the determination of the mass of the probable black hole. Astrophys. J. 325, 114–118. doi: 10.1086/165986
Gaskell, C. M., and Goosmann, R. W. (2013). Line Shifts, Broad-line Region Inflow, and the Feeding of Active Galactic Nuclei. Astrophys. J. 769:30. doi: 10.1088/0004-637X/769/1/30
Goad, M. R., and Korista, K. T. (2014). Interpreting broad emission-line variations-I. Factors influencing the emission-line response. Month. Notices R. Astron. Soc. 444, 43–61. doi: 10.1093/mnras/stu1456
Goad, M. R., Korista, K. T., and Ruff, A. J. (2012). The broad emission-line region: the confluence of the outer accretion disc with the inner edge of the dusty torus. Month. Notices R. Astron. Soc. 426, 3086–3111. doi: 10.1111/j.1365-2966.2012.21808.x
Grier, C. J., Peterson, B. M., Horne, K., Bentz, M. C., Pogge, R. W., Denney, K. D., et al. (2013). The structure of the broad-line region in active galactic nuclei. I. reconstructed velocity-delay maps. Astrophys. J. 764:47. doi: 10.1088/0004-637X/764/1/47
Grupe, D. (2004). A complete sample of soft X-ray-selected AGNs. II. statistical analysis. Astron. J. 127, 1799–1810. doi: 10.1086/382516
Gu, M. (2017). “The jet detection in radio-loud narrow-line Seyfert 1 galaxies,” in New Frontiers in Black Hole Astrophysics, Vol. 324, IAU Symposium, ed A. Gomboc (Cambridge), 188–191. doi: 10.1017/S1743921317001740
Hewett, P. C., and Wild, V. (2010). Improved redshifts for SDSS quasar spectra. Month. Notices R. Astron. Soc. 405, 2302–2316. doi: 10.1111/j.1365-2966.2010.16648.x
Hogg, D. W., and Fruchter, A. S. (1999). The faint-galaxy hosts of gamma-ray bursts. Astrophys. J. 520, 54–58. doi: 10.1086/307457
Horne, K., Peterson, B. M., Collier, S. J., and Netzer, H. (2004). Observational requirements for high-fidelity reverberation mapping. Publicat. Astron. Soc. Pac. 116, 465–476. doi: 10.1086/420755
Hu, C., Wang, J.-M., Ho, L. C., Chen, Y.-M., Bian, W.-H., and Xue, S.-J. (2008). Hβ profiles in quasars: evidence for an intermediate-line region. Astrophys. J. Lett. 683, L115–L118. doi: 10.1086/591848
Hu, C., Wang, J.-M., Ho, L. C., Ferland, G. J., Baldwin, J. A., and Wang, Y. (2012). Two-component structure of the Hβ broad-line region in quasars. I. evidence from spectral principal component analysis. Astrophys. J. 760:126. doi: 10.1088/0004-637X/760/2/126
Jarvis, M. J., and McLure, R. J. (2006). Orientation dependency of broad-line widths in quasars and consequences for black hole mass estimation. Month. Notices R. Astron. Soc. 369, 182–188. doi: 10.1111/j.1365-2966.2006.10295.x
Joly, M., Véron-Cetty, M., and Véron, P. (2008). “Fe II emission in AGN,” in Revista Mexicana de Astronomia y Astrofisica Conference Series, Vol. 32 (Mexico City), 59–61.
Kaspi, S., Brandt, W. N., Maoz, D., Netzer, H., Schneider, D. P., and Shemmer, O. (2007). Reverberation mapping of high-luminosity quasars: first results. Astrophys. J. 659, 997–1007. doi: 10.1086/512094
Kaspi, S., Smith, P. S., Netzer, H., Maoz, D., Jannuzi, B. T., and Giveon, U. (2000). Reverberation measurements for 17 quasars and the size-mass-luminosity relations in active galactic nuclei. Astrophys. J. 533, 631–649. doi: 10.1086/308704
Kellermann, K. I., Sramek, R., Schmidt, M., Shaffer, D. B., and Green, R. (1989). VLA observations of objects in the palomar bright quasar survey. Astron. J. 98, 1195–1207. doi: 10.1086/115207
Khachikian, E. Y., and Weedman, D. W. (1974). An atlas of Seyfert galaxies. Astrophys. J. 192, 581–589. doi: 10.1086/153093
Kollatschny, W., and Zetzl, M. (2011). Broad-line active galactic nuclei rotate faster than narrow-line ones. Nature 470, 366–368. doi: 10.1038/nature09761
Komossa, S., Voges, W., Xu, D., Mathur, S., Adorf, H.-M., Lemson, G., et al. (2006). Radio-loud narrow-line type 1 quasars. Astron. J. 132, 531–545. doi: 10.1086/505043
Koratkar, A. P., and Gaskell, C. M. (1991). Structure and kinematics of the broad-line regions in active galaxies from IUE variability data. Astrophys. J. Suppl. 75, 719–750. doi: 10.1086/191547
Koulouridis, E., Plionis, M., Chavushyan, V., Dultzin-Hacyan, D., Krongold, Y., and Goudis, C. (2006). Local and large-scale environment of seyfert galaxies. Astrophys. J. 639, 37–45. doi: 10.1086/498421
Kovačević, J., Popović, L. Č., and Dimitrijević, M. S. (2010). Analysis of optical Fe II emission in a sample of active galactic nucleus spectra. Astrophys. J. Suppl. 189, 15–36. doi: 10.1088/0067-0049/189/1/15
Kovačević-Dojčinović, J., and Popović, L. Č. (2015). The connections between the UV and optical Fe II emission lines in type 1 AGNs. Astrophys. J. Suppl. 221:35. doi: 10.1088/0067-0049/221/2/35
Krawczyk, C. M., Richards, G. T., Mehta, S. S., Vogeley, M. S., Gallagher, S. C., Leighly, K. M., et al. (2013). Mean spectral energy distributions and bolometric corrections for luminous quasars. Astrophys. J. Suppl. 206:4. doi: 10.1088/0067-0049/206/1/4
Kruczek, N. E., Richards, G. T., Gallagher, S. C., Deo, R. P., Hall, P. B., Hewett, P. C., et al. (2011). C IV emission and the ultraviolet through X-Ray spectral energy distribution of radio-quiet quasars. Astron. J. 142:130. doi: 10.1088/0004-6256/142/4/130
Kuraszkiewicz, J., Wilkes, B. J., Schmidt, G., Smith, P. S., Cutri, R., and Czerny, B. (2009). Principal component analysis of the spectral energy distribution and emission line properties of red 2MASS active galactic nuclei. Astrophys. J. 692, 1180–1189. doi: 10.1088/0004-637X/692/2/1180
Laor, A. (2000). On black hole masses and radio loudness in active galactic nuclei. Astrophys. J. Lett. 543, L111–L114. doi: 10.1086/317280
Laor, A. (2006). Evidence for line broadening by electron scattering in the broad-line region of NGC 4395. Astrophys. J. 643, 112–119. doi: 10.1086/502798
Laor, A., Bahcall, J. N., Jannuzi, B. T., Schneider, D. P., and Green, R. F. (1995). The Ultraviolet Emission properties of 13 quasars. Astrophys. J. Suppl. 99:1. doi: 10.1086/192177
Laor, A., Fiore, F., Elvis, M., Wilkes, B. J., and McDowell, J. C. (1997). The soft X-ray properties of a complete sample of optically selected quasars. II. final results. Astrophys. J. 477:93. doi: 10.1086/303696
Leighly, K. M. (2004). Hubble space telescope STIS ultraviolet spectral evidence of outflow in extreme narrow-line seyfert 1 galaxies. II. Modeling and interpretation. Astrophys. J. 611:125. doi: 10.1086/422089
Leighly, K. M., and Moore, J. R. (2004). Hubble space telescope stis ultraviolet spectral evidence of outflow in extreme narrow-line seyfert 1 galaxies. I. Data and analysis. Astrophys. J. 611, 107–124. doi: 10.1086/422088
Luo, B., Brandt, W. N., Hall, P. B., Wu, J., Anderson, S. F., Garmire, G. P., et al. (2015). X-ray Insights into the Nature of PHL 1811 analogs and weak emission-line quasars: unification with a geometrically thick accretion disk? Astrophys. J. 805:122. doi: 10.1088/0004-637X/805/2/122
Mao, Y.-F., Wang, J., and Wei, J.-Y. (2009). Extending the Eigenvector 1 space to the optical variability of quasars. Res. Astron. Astrophys. 9, 529–537. doi: 10.1088/1674-4527/9/5/004
Marinucci, A., Bianchi, S., Nicastro, F., Matt, G., and Goulding, A. D. (2012). The link between the hidden broad line region and the accretion rate in seyfert 2 galaxies. Astrophys. J. 748:130. doi: 10.1088/0004-637X/748/2/130
Marziani, P., Bon, E., Bon, N., Dultzin, D., Del Olmo, A., et al. (2017a). Quasar black hole mass estimates from high-ionization lines: breaking a taboo? Atoms 5:33. doi: 10.3390/atoms5030033
Marziani, P., Dultzin-Hacyan, D., D'Onofrio, M., and Sulentic, J. W. (2003a). Arp 194: evidence of tidal stripping of gas and cross-fueling. Astron. J. 125, 1897–1907. doi: 10.1086/368142
Marziani, P., Dultzin-Hacyan, D., and Sulentic, J. W. (2006). “Accretion onto supermassive black holes in quasars: learning from optical/UV observations,” in New Developments in Black Hole Research, ed P. V. Kreitler (New York, NY: Nova Press). 123.
Marziani, P., Martínez Carballo, M. A., Sulentic, J. W., Del Olmo, A., Stirpe, G. M., and Dultzin, D. (2016a). The most powerful quasar outflows as revealed by the Civ λ1549 resonance line. Astrophys. Space Sci. 361:29. doi: 10.1007/s10509-015-2611-1
Marziani, P., Negrete, C. A., Dultzin, D., Martinez-Aldama, M. L., Del Olmo, A., Esparza, D., et al. (2017b). “Highly accreting quasars: a tool for cosmology?,” in IAU Symposium. Vol. 324, 245–246.
Marziani, P., and Sulentic, J. W. (2012). Estimating black hole masses in quasars using broad optical and UV emission lines. New Astron. Rev. 56, 49–63. doi: 10.1016/j.newar.2011.09.001
Marziani, P., and Sulentic, J. W. (2014). Highly accreting quasars: sample definition and possible cosmological implications. Month. Notices R. Astron. Soc. 442, 1211–1229. doi: 10.1093/mnras/stu951
Marziani, P., Sulentic, J. W., Dultzin-Hacyan, D., Calvani, M., and Moles, M. (1996). Comparative analysis of the high- and low-ionization lines in the broad-line region of active galactic nuclei. Astrophys. J. Suppl. 104:37. doi: 10.1086/192291
Marziani, P., Sulentic, J. W., Negrete, C. A., Dultzin, D., D'Onofrio, M., Del Olmo, A., et al. (2014). Low- and high-z highly accreting quasars in the 4D Eigenvector 1 context. Astron. Rev. 9, 1–20. doi: 10.1080/21672857.2014.11519739
Marziani, P., Sulentic, J. W., Negrete, C. A., Dultzin, D., Zamfir, S., and Bachev, R. (2010). Broad-line region physical conditions along the quasar eigenvector 1 sequence. Month. Notices R. Astron. Soc. 409, 1033–1048. doi: 10.1111/j.1365-2966.2010.17357.x
Marziani, P., Sulentic, J. W., Plauchu-Frayn, I., and del Olmo, A. (2013a). Is Mg II 2800 a reliable virial broadening estimator for quasars? Astron. Astrophys. 555:16. doi: 10.1051/0004-6361/201321374
Marziani, P., Sulentic, J. W., Plauchu-Frayn, I., and del Olmo, A. (2013b). Low-Ionization Outflows in High Eddington Ratio Quasars. Astrophys. J. 764:150. doi: 10.1088/0004-637X/764/2/150
Marziani, P., Sulentic, J. W., Stirpe, G. M., Dultzin, D., Del Olmo, A., and Martínez-Carballo, M. A. (2016b). Blue outliers among intermediate redshift quasars. Astrophys. Space Sci. 361:3. doi: 10.1007/s10509-015-2590-2
Marziani, P., Sulentic, J. W., Stirpe, G. M., Zamfir, S., and Calvani, M. (2009). VLT/ISAAC spectra of the Hβ region in intermediate-redshift quasars. III. Hβ broad-line profile analysis and inferences about BLR structure. Astron. Astrophys. 495, 83–112. doi: 10.1051/0004-6361:200810764
Marziani, P., Sulentic, J. W., Zwitter, T., Dultzin-Hacyan, D., and Calvani, M. (2001). Searching for the physical drivers of the eigenvector 1 correlation space. Astrophys. J. 558, 553–560. doi: 10.1086/322286
Marziani, P., Zamanov, R. K., Sulentic, J. W., and Calvani, M. (2003b). Searching for the physical drivers of eigenvector 1: influence of black hole mass and Eddington ratio. Month. Notices R. Astron. Soc. 345, 1133–1144. doi: 10.1046/j.1365-2966.2003.07033.x
Mathews, W. G. (1993). Bouncing clouds-A model for the quasar broad-line region. Astrophys. J. Lett. 412, L17–L20. doi: 10.1086/186929
Mathews, W. G., and Ferland, G. J. (1987). What heats the hot phase in active nuclei? Astrophys. J. 323, 456–467. doi: 10.1086/165843
Mejía-Restrepo, J. E., Trakhtenbrot, B., Lira, P., Netzer, H., and Capellupo, D. M. (2016). Active galactic nuclei at z˜1.5: II. Black hole mass estimation by means of broad emission lines. Month. Notices R. Astron. Soc. 460, 187–211.
Merloni, A., Heinz, S., and di Matteo, T. (2003). A fundamental plane of black hole activity. Month. Notices R. Astron. Soc. 345, 1057–1076. doi: 10.1046/j.1365-2966.2003.07017.x
Mineshige, S., Kawaguchi, T., Takeuchi, M., and Hayashida, K. (2000). Slim-disk model for soft X-Ray excess and variability of narrow-line seyfert 1 galaxies. Public. Astron. Soc. Jpn 52, 499–508. doi: 10.1093/pasj/52.3.499
Murray, N., Chiang, J., Grossman, S. A., and Voit, G. M. (1995). Accretion disk winds from active galactic nuclei. Astrophys. J. 451:498. doi: 10.1086/176238
Murtagh, F., and Heck, A. (eds.) (1987). Multivariate Data Analysis, Vol. 131, Astrophysics and Space Science Library. Berlin: Springer.
Nagao, T., Marconi, A., and Maiolino, R. (2006). The evolution of the broad-line region among SDSS quasars. Astron. Astrophys. 447, 157–172. doi: 10.1051/0004-6361:20054024
Negrete, A., Dultzin, D., Marziani, P., and Sulentic, J. (2012). BLR physical conditions in extreme population a quasars: a method to estimate central black hole mass at high redshift. Astrophys. J. 757:62. doi: 10.1088/0004-637X/757/1/62
Negrete, C. A., Dultzin, D., Marziani, P., and Sulentic, J. W. (2013). Reverberation and photoionization estimates of the broad-line region radius in low-z quasars. Astrophys. J. 771:31. doi: 10.1088/0004-637X/771/1/31
Negrete, C. A., Dultzin, D., Marziani, P., and Sulentic, J. W. (2014). A new method to obtain the broad line region size of high redshift quasars. Astrophys. J. 794:95. doi: 10.1088/0004-637X/794/1/95
Negrete, C. A., Dultzin, D., Marziani, P., Sulentic, J. W., Esparza-Arredondo, D., Martínez-Aldama, M. L., et al. (2017). Quasars as cosmological standard candles. Front. Astron. Space Sci. 4:59. doi: 10.3389/fspas.2017.00059
Netzer, H. (2013). The Physics and Evolution of Active Galactic Nuclei (Cambridge: Cambridge University Press).
Netzer, H., Brotherton, M. S., Wills, B. J., Han, M., Wills, D., Baldwin, J. A., et al. (1995). The hubble space telescope sample of radio-loud quasars: the LY alpha /H beta ratio. Astrophys. J. 448:27. doi: 10.1086/175939
Netzer, H., Lira, P., Trakhtenbrot, B., Shemmer, O., and Cury, I. (2007). Black hole mass and growth rate at high redshift. Astrophys. J. 671, 1256–1263. doi: 10.1086/523035
Netzer, H., and Marziani, P. (2010). The effect of radiation pressure on emission-line profiles and black hole mass determination in active galactic nuclei. Astrophys. J. 724, 318–328. doi: 10.1088/0004-637X/724/1/318
Nicastro, F. (2000). Broad emission line regions in active galactic nuclei: the link with the accretion power. Astrophys. J. Lett. 530, L65–L68. doi: 10.1086/312491
O'Dea, C. P. (1998). The compact steep-spectrum and gigahertz peaked-spectrum radio sources. Public. Astron. Soc. Pac. 110, 493–532. doi: 10.1086/316162
Osterbrock, D. E., and Ferland, G. J. (2006). Astrophysics of Gaseous Nebulae and Active Galactic Nuclei (Mill Valley, CA: University Science Books).
Padovani, P. (2016). The faint radio sky: radio astronomy becomes mainstream. Astron. Astrophys. Rev. 24:13. doi: 10.1007/s00159-016-0098-6
Padovani, P. (2017). Active galactic nuclei at all wavelengths and from all angles. Front. Space Sci. 4:35. doi: 10.3389/fspas.2017.00035
Padovani, P., and Rafanelli, P. (1988). Mass-luminosity relationships and accretion rates for Seyfert 1 galaxies and quasars. Astron. Astrophys. 205, 53–70.
Peterson, B. M. (1998). Reverberation mapping of active nuclei. Adv. Space Res. 21, 57–66. doi: 10.1016/S0273-1177(97)00614-5
Peterson, B. M. (2014). Measuring the masses of supermassive black holes. Space Sci. Rev. 183, 253–275. doi: 10.1007/s11214-013-9987-4
Peterson, B. M. (2017). “Space telescope and Optical reverberation mapping project: a leap forward in reverberation mapping,” in IAU Symposium. Vol. 324, IAU Symposium (Cambridge), 215–218.
Peterson, B. M., Ferrarese, L., Gilbert, K. M., Kaspi, S., Malkan, M. A., Maoz, D., et al. (2004). Central masses and broad-line region sizes of active galactic nuclei. II. A homogeneous analysis of a large reverberation-mapping database. Astrophys. J. 613, 682–699. doi: 10.1086/423269
Peterson, B. M., and Horne, K. (2006). “Reverberation mapping of active galactic nuclei,” in Planets to Cosmology: Essential Science in the Final Years of the Hubble Space Telescope, ed M. Livio & S. Casertano (Cambridge, UK: Cambridge University Press). 89.
Peterson, B. M., and Wandel, A. (1999). Keplerian motion of broad-line region gas as evidence for supermassive black holes in active galactic nuclei. Astrophys. J. Lett. 521, L95–L98. doi: 10.1086/312190
Popović, L. Č., Mediavilla, E. G., Kubičela, A., and Jovanović, P. (2002). Balmer lines emission region in NGC 3516: Kinematical and physical properties. Astron. Astrophys. 390, 473–480. doi: 10.1051/0004-6361:20020724
Punsly, B. (2010). The redshifted excess in quasar C IV broad emission lines. Astrophys. J. 713, 232–238. doi: 10.1088/0004-637X/713/1/232
Richards, G. T., Kruczek, N. E., Gallagher, S. C., Hall, P. B., Hewett, P. C., Leighly, K. M., et al. (2011). Unification of luminous type 1 quasars through C IV emission. Astron. J. 141:167. doi: 10.1088/0004-6256/141/5/167
Richards, G. T., Lacy, M., Storrie-Lombardi, L. J., Hall, P. B., Gallagher, S. C., Hines, D. C., et al. (2006). Spectral energy distributions and multiwavelength selection of type 1 quasars. Astrophys. J. Suppl. 166:162. doi: 10.1086/506525
Richards, G. T., Vanden Berk, D. E., Reichard, T. A., Hall, P. B., Schneider, D. P., SubbaRao, M., et al. (2002). Broad emission-line shifts in quasars: an orientation measure for radio-quiet quasars? Astron. J. 124, 1–17. doi: 10.1086/341167
Risaliti, G., Salvati, M., and Marconi, A. (2011). [O III] equivalent width and orientation effects in quasars. Month. Notices R. Astron. Soc. 411, 2223–2229. doi: 10.1111/j.1365-2966.2010.17843.x
Rodríguez-Ardila, A., Prieto, M. A., Viegas, S., and Gruenwald, R. (2006). Outflows of very ionized gas in the centers of seyfert galaxies: kinematics and physical conditions. Astrophys. J. 653, 1098–1114. doi: 10.1086/508864
Rokaki, E., Lawrence, A., Economou, F., and Mastichiadis, A. (2003). Is there a disc in the superluminal quasars? Month. Notices R. Astron. Soc. 340, 1298–1308. doi: 10.1046/j.1365-8711.2003.06414.x
Runnoe, J. C., Brotherton, M. S., DiPompeo, M. A., and Shang, Z. (2014). The behaviour of quasar C IV emission-line properties with orientation. Month. Notices R. Astron. Soc. 438, 3263–3274. doi: 10.1093/mnras/stt2429
Runnoe, J. C., Shang, Z., and Brotherton, M. S. (2013). The orientation dependence of quasar spectral energy distributions. Month. Notices R. Astron. Soc. 435, 3251–3261. doi: 10.1093/mnras/stt1528
Sa̧dowski, A., Narayan, R., McKinney, J. C., and Tchekhovskoy, A. (2014). Numerical simulations of super-critical black hole accretion flows in general relativity. Month. Notices R. Astron. Soc. 439, 503–520. doi: 10.1093/mnras/stt2479
Shang, Z., Wills, B. J., Robinson, E. L., Wills, D., Laor, A., Xie, B., et al. (2003). The baldwin effect and black hole accretion: a spectral principal component analysis of a complete quasar sample. Astrophys. J. 586, 52–71. doi: 10.1086/367638
Shang, Z., Wills, B. J., Wills, D., and Brotherton, M. S. (2007). Spectral Properties from Lyα to Hα for an Essentially Complete sample of quasars. I. Data. Astron. J. 134, 294–393. doi: 10.1086/518505
Shemmer, O., Trakhtenbrot, B., Anderson, S. F., Brandt, W. N., Diamond-Stanic, A. M., Fan, X., et al. (2010). Weak line quasars at high redshift: extremely high accretion rates or anemic broad-line regions? Astrophys. J. Lett. 722, L152–L156. doi: 10.1088/2041-8205/722/2/L152
Shen, Y. (2016). Rest-frame optical properties of luminous 1.5 < z < 3.5 quasars: the Hβ-[O iii] region. Astrophys. J. 817:55. doi: 10.3847/0004-637X/817/1/55
Shen, Y., Brandt, W. N., Richards, G. T., Denney, K. D., Greene, J. E., Grier, C. J., et al. (2016). The sloan digital sky survey reverberation mapping project: velocity shifts of quasar emission lines. Astrophys. J. 831:7. doi: 10.3847/0004-637X/831/1/7
Shen, Y., and Ho, L. C. (2014). The diversity of quasars unified by accretion and orientation. Nature 513, 210–213. doi: 10.1038/nature13712
Shen, Y., and Liu, X. (2012). Comparing single-epoch virial black hole mass estimators for luminous quasars. Astrophys. J. 753:125. doi: 10.1088/0004-637X/753/2/125
Sijacki, D., Vogelsberger, M., Genel, S., Springel, V., Torrey, P., Snyder, G. F., et al. (2015). The Illustris simulation: the evolving population of black holes across cosmic time. Month. Notices R. Astron. Soc. 452, 575–596. doi: 10.1093/mnras/stv1340
Smith, J. E., Robinson, A., Young, S., Axon, D. J., and Corbett, E. A. (2005). Equatorial scattering and the structure of the broad-line region in Seyfert nuclei: evidence for a rotating disc. Month. Notices R. Astron. Soc. 359, 846–864. doi: 10.1111/j.1365-2966.2005.08895.x
Snedden, S. A., and Gaskell, C. M. (2007). The case for optically thick high-velocity broad-line region gas in active galactic nuclei. Astrophys. J. 669, 126–134. doi: 10.1086/521290
Springel, V., Di Matteo, T., and Hernquist, L. (2005). Modelling feedback from stars and black holes in galaxy mergers. Month. Notices R. Astron. Soc. 361, 776–794. doi: 10.1111/j.1365-2966.2005.09238.x
Steffen, A. T., Strateva, I., Brandt, W. N., Alexander, D. M., Koekemoer, A. M., Lehmer, B. D., et al. (2006). The X-ray-to-optical properties of optically selected active galaxies over wide luminosity and redshift ranges. Astron. J. 131, 2826–2842. doi: 10.1086/503627
Storchi-Bergmann, T., Schimoia, J. S., Peterson, B. M., Elvis, M., Denney, K. D., Eracleous, M., et al. (2017). Double-peaked profiles: ubiquitous signatures of disks in the broad emission lines of active galactic nuclei. Astrophys. J. 835:236. doi: 10.3847/1538-4357/835/2/236
Sulentic, J., Marziani, P., and Zamfir, S. (2011). The case for two quasar populations. Baltic Astron. 20, 427–434.
Sulentic, J. W., Bachev, R., Marziani, P., Negrete, C. A., and Dultzin, D. (2007). C IV λ1549 as an eigenvector 1 parameter for active galactic nuclei. Astrophys. J. 666, 757–777. doi: 10.1086/519916
Sulentic, J. W., del Olmo, A., Marziani, P., Martínez-Carballo, M. A., D'Onofrio, M., Dultzin, D., et al. (2017). What does Civλ1549 tell us about the physical driver of the eigenvector quasar sequence? Astron. Astroph. 608:A122. doi: 10.1051/0004-6361/201630309
Sulentic, J. W., Martínez-Carballo, M. A., Marziani, P., del Olmo, A., Stirpe, G. M., Zamfir, S., et al. (2015). 3C 57 as an atypical radio-loud quasar: implications for the radio-loud/radio-quiet dichotomy. ArXiv e-prints. doi: 10.1093/mnras/stv710
Sulentic, J. W., Marziani, P., del Olmo, A., Dultzin, D., Perea, J., and Alenka Negrete, C. (2014). GTC spectra of z ≈ 2.3 quasars: comparison with local luminosity analogs. Astron. Astrophys. 570:A96. doi: 10.1051/0004-6361/201423975
Sulentic, J. W., Marziani, P., and Dultzin-Hacyan, D. (2000a). Phenomenology of broad emission lines in active galactic nuclei. Ann. Rev. Astron. Astrophys. 38, 521–571. doi: 10.1146/annurev.astro.38.1.521
Sulentic, J. W., Marziani, P., Zamanov, R., Bachev, R., Calvani, M., and Dultzin-Hacyan, D. (2002). Average quasar spectra in the context of eigenvector 1. Astrophys. J. Lett. 566, L71–L75. doi: 10.1086/339594
Sulentic, J. W., Marziani, P., Zamfir, S., and Meadows, Z. A. (2012). No evidence for a systematic Fe II emission line redshift in type 1 active galactic nuclei. Astrophys. J. Lett. 752:L7. doi: 10.1088/2041-8205/752/1/L7
Sulentic, J. W., Marziani, P., Zwitter, T., Dultzin-Hacyan, D., and Calvani, M. (2000b). The demise of the classical broad-line region in the luminous quasar PG 1416-129. Astrophys. J. Lett. 545, L15–L18. doi: 10.1086/317330
Sulentic, J. W., Zamfir, S., Marziani, P., Bachev, R., Calvani, M., and Dultzin-Hacyan, D. (2003). Radio-loud active galactic nuclei in the context of the eigenvector 1 parameter space. Astrophys. J. Lett. 597, L17–L20. doi: 10.1086/379754
Sulentic, J. W., Zwitter, T., Marziani, P., and Dultzin-Hacyan, D. (2000c). Eigenvector 1: an optimal correlation space for active galactic nuclei. Astrophys. J. Lett. 536, L5–L9. doi: 10.1086/312717
Sun, J., and Shen, Y. (2015). Dissecting the quasar main sequence: insight from host galaxy properties. Astrophys. J. Lett. 804:L15. doi: 10.1088/2041-8205/804/1/L15
Szuszkiewicz, E., Malkan, M. A., and Abramowicz, M. A. (1996). The observational appearance of slim accretion disks. Astrophys. J. 458:474. doi: 10.1086/176830
Tang, B., Shang, Z., Gu, Q., Brotherton, M. S., and Runnoe, J. C. (2012). The optical and ultraviolet emission-line properties of bright quasars with detailed spectral energy distributions. Astrophys. J. Suppl. 201:38. doi: 10.1088/0067-0049/201/2/38
Trakhtenbrot, B., and Netzer, H. (2012). Black hole growth to z = 2 - I. Improved virial methods for measuring MBH and L/LEdd. Month. Notices R. Astron. Soc. 427, 3081–3102. doi: 10.1111/j.1365-2966.2012.22056.x
Tytler, D., and Fan, X.-M. (1992). Systematic QSO emission-line velocity shifts and new unbiased redshifts. Astrophys. J. Suppl. 79, 1–36. doi: 10.1086/191642
Vanden Berk, D. E., Richards, G. T., Bauer, A., Strauss, M. A., Schneider, D. P., Heckman, T. M., et al. (2001). Composite quasar spectra from the sloan digital sky survey. Astron. J. 122, 549–564. doi: 10.1086/321167
Verner, E., Bruhweiler, F., Verner, D., Johansson, S., Kallman, T., and Gull, T. (2004). Fe II diagnostic tools for quasars. Astrophys. J. 611, 780–785. doi: 10.1086/422303
Véron-Cetty, M.-P., Véron, P., and Gonçalves, A. C. (2001). A spectrophotometric atlas of narrow-line seyfert 1 galaxies. Astron. Astrophys. 372, 730–754. doi: 10.1051/0004-6361:20010489
Vestergaard, M., and Peterson, B. M. (2006). Determining central black hole masses in distant active galaxies and quasars. II. Improved optical and UV scaling relationships. Astrophys. J. 641, 689–709. doi: 10.1086/500572
Villarroel, B., and Korn, A. J. (2014). The different neighbours around Type-1 and Type-2 active galactic nuclei. Nat. Phys. 10, 417–420. doi: 10.1038/nphys2951
Wandel, A., Peterson, B. M., and Malkan, M. A. (1999). Central masses and broad-line region sizes of active galactic nuclei. I. Comparing the photoionization and reverberation techniques. Astrophys. J. 526, 579–591. doi: 10.1086/308017
Wang, J., and Li, Y. (2011). Strong response of the very broad Hβ emission line in the luminous radio-quiet quasar PG 1416-129. Astrophys. J. Lett. 742:L12. doi: 10.1088/2041-8205/742/1/L12
Wang, J., Wei, J. Y., and He, X. T. (2006). A sample of IRAS infrared-selected seyfert 1.5 galaxies: infrared color α(60, 25)-dominated eigenvector 1. Astrophys. J. 638, 106–119. doi: 10.1086/498667
Wang, J.-M., Du, P., Li, Y.-R., Ho, L. C., Hu, C., and Bai, J.-M. (2014a). A new approach to constrain black hole spins in active galaxies using optical reverberation mapping. Astrophys. J. Lett. 792:L13. doi: 10.1088/2041-8205/792/1/L13
Wang, J.-M., Du, P., Valls-Gabaud, D., Hu, C., and Netzer, H. (2013). Super-eddington accreting massive black holes as long-lived cosmological standards. Phys. Rev. Lett. 110:081301. doi: 10.1103/PhysRevLett.110.081301
Wang, J.-M., Qiu, J., Du, P., and Ho, L. C. (2014b). Self-shadowing effects of slim accretion disks in active galactic nuclei: the diverse appearance of the broad-line region. Astrophys. J. 797:65. doi: 10.1088/0004-637X/797/1/65
Wang, T., Brinkmann, W., and Bergeron, J. (1996). X-ray properties of active galactic nuclei with optical FeII emission. Astron. Astrophys. 309, 81–96.
Wilkes, B. J., Kuraszkiewicz, J., Green, P. J., Mathur, S., and McDowell, J. C. (1999). Investigation of the relation between the spectral energy distributions and the emission lines in low-redshift quasars. Astrophys. J. 513, 76–107. doi: 10.1086/306828
Wills, B. J., Brotherton, M. S., Fang, D., Steidel, C. C., and Sargent, W. L. W. (1993). Statistics of QSO broad emission-line profiles. I. The C IV lambda 1549 line and the lambda 1400 feature. Astrophys. J. 415:563–+. doi: 10.1086/173186
Wills, B. J., and Browne, I. W. A. (1986). Relativistic beaming and quasar emission lines. Astrophys. J. 302, 56–63. doi: 10.1086/163973
Wills, B. J., Laor, A., Brotherton, M. S., Wills, D., Wilkes, B. J., Ferland, G. J., et al. (1999). The PG X-ray QSO sample: links between the ultraviolet-x-ray continuum and emission lines. Astrophys. J. Lett. 515, L53–L56. doi: 10.1086/311980
Wu, C.-C., Boggess, A., and Gull, T. R. (1983). Prominent ultraviolet emission lines from Type 1 seyfert galaxies. Astrophys. J. 266, 28–40. doi: 10.1086/160756
Wu, Q. (2009). The black hole mass, Eddington ratio and MBH-σ[OIII] relation in young radio galaxies. Month. Notices R. Astron. Soc. 398, 1905–1914. doi: 10.1111/j.1365-2966.2009.15127.x
Xu, D., Komossa, S., Zhou, H., Lu, H., Li, C., Grupe, D., et al. (2012). Correlation analysis of a large sample of narrow-line seyfert 1 galaxies: linking central engine and host properties. Astron. J. 143:83. doi: 10.1088/0004-6256/143/4/83
Yip, C. W., Connolly, A. J., Vanden Berk, D. E., Ma, Z., Frieman, J. A., SubbaRao, M., et al. (2004). Spectral classification of quasars in the sloan digital sky survey: eigenspectra, redshift, and luminosity effects. Astron. J. 128, 2603–2630. doi: 10.1086/425626
Zamanov, R., and Marziani, P. (2002). Searching for the physical drivers of eigenvector 1: from quasars to nanoquasars. Astrophys. J. 571, L77–L80. doi: 10.1086/341367
Zamanov, R., Marziani, P., Sulentic, J. W., Calvani, M., Dultzin-Hacyan, D., and Bachev, R. (2002). Kinematic linkage between the broad- and narrow-line-emitting gas in active galactic nuclei. Astrophys. J. Lett. 576, L9–L13. doi: 10.1086/342783
Zamfir, S., Sulentic, J. W., and Marziani, P. (2008). New insights on the QSO radio-loud/radio-quiet dichotomy: SDSS spectra in the context of the 4D eigenvector1 parameter space. Month. Notices R. Astron. Soc. 387, 856–870. doi: 10.1111/j.1365-2966.2008.13290.x
Zamfir, S., Sulentic, J. W., Marziani, P., and Dultzin, D. (2010). Detailed characterization of Hβ emission line profile in low-z SDSS quasars. Month. Notices R. Astron. Soc. 403:1759. doi: 10.1111/j.1365-2966.2009.16236.x
Zhang, K., Dong, X.-B., Wang, T.-G., and Gaskell, C. M. (2011). The blueshifting and baldwin effects for the [O III] λ5007 emission line in Type 1 active galactic nuclei. Astrophys. J. 737:71. doi: 10.1088/0004-637X/737/2/71
Zhang, K., Wang, T.-G., Gaskell, C. M., and Dong, X.-B. (2013). The baldwin effect in the narrow emission lines of active galactic nuclei. Astrophys. J. 762:51. doi: 10.1088/0004-637X/762/1/51
Keywords: galaxy evolution, quasars, eigenvector 1, outflows, emission lines, supermassive black holes, black hole physics
Citation: Marziani P, Dultzin D, Sulentic JW, Del Olmo A, Negrete CA, Martínez-Aldama ML, D'Onofrio M, Bon E, Bon N and Stirpe GM (2018) A Main Sequence for Quasars. Front. Astron. Space Sci. 5:6. doi: 10.3389/fspas.2018.00006
Received: 17 October 2017; Accepted: 07 February 2018;
Published: 01 March 2018.
Edited by:
Sandor Mihaly Molnar, National Taiwan University, TaiwanReviewed by:
Shai Kaspi, Tel Aviv University, IsraelGordon Richards, Drexel University, United States
Copyright © 2018 Marziani, Dultzin, Sulentic, Del Olmo, Negrete, Martínez-Aldama, D'Onofrio, Bon, Bon and Stirpe. This is an open-access article distributed under the terms of the Creative Commons Attribution License (CC BY). The use, distribution or reproduction in other forums is permitted, provided the original author(s) and the copyright owner are credited and that the original publication in this journal is cited, in accordance with accepted academic practice. No use, distribution or reproduction is permitted which does not comply with these terms.
*Correspondence: Paola Marziani, cGFvbGEubWFyemlhbmlAb2FwZC5pbmFmLml0