 Syun-Ichi Akasofu
- International Arctic Research Center, University of Alaska Fairbanks, Fairbanks, AK, United States
The aurora shows explosive activities a few times in 24 h on a moderately active day. This specific phenomenon is called the auroral substorm, which consists of the growth, expansion, and recovery phases; the explosive activities occur during the expansion phase. As an introduction, the explosive activities of the aurora are morphologically described on the basis of ground-based all-sky and satellite images. In terms of theoretical understanding, the processes for the explosive activities have been considered almost exclusively in terms of “the magnetic field line approach” in the past, including the process of magnetic reconnection. Instead, in this paper, we consider the substorm processes in terms of “the electric current line approach.” This approach requires that the whole process of auroral substorms should be considered as a chain of processes, which consists of power supply (dynamo), transmission (currents/circuits), and dissipation (auroral substorms). An increased power of the solar wind-magnetosphere dynamo intensifies (to the level of 1011w = 5 × 10¹⁸ erg/s), the electric current mainly in the main body (just outside of the ring current) of the magnetosphere increases, resulting in accumulating energy in its inductive circuit (≈6 Re), and inflation of the magnetosphere. When the accumulated energy reaches about 5 × 10¹⁵ J (= 5 × 10²² ergs), the magnetosphere tends to become unstable (because of current instabilities). As the current intensity is reduced as a result, the magnetosphere is deflated. It is suggested that it is in this deflation process, during which the accumulated energy is unloaded, and an earthward electric field (5–50 mV/m) is produced on the equatorial plane, establishing the unloading current system (the UL current system), which is responsible for the unloading expansion phase, including the most characteristic features of the expansion phase, such as the poleward advance of the aurora and the development of the auroral electrojet. The electric current approach is rather new and needs much more effort to develop.
Introduction: Solar- Terrestrial Relationship
When we consider auroral phenomena and the accompanying geomagnetic storms, it is worthwhile to consider first the whole solar-terrestrial relationship, since these phenomena are the last part of the solar-terrestrial relationship, in which the solar (wind) energy is dissipated mainly in the ionosphere as the Joule heating. Figure 1 illustrates how the solar energy carried by the solar wind becomes the auroral energy in the magnetosphere.
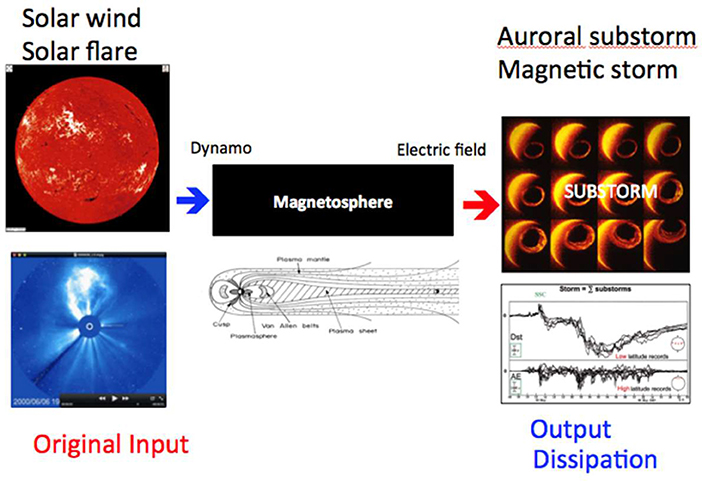
Figure 1. The figure shows the overall solar-terrestrial relationship. The initial energy from the sun is carried by the solar wind to the magnetosphere. Auroral substorms and geomagnetic storms are two different aspects of the same phenomenon, which are end products (manifestations) of energy dissipation mainly in the ionosphere. This subject is treated as a chain of processes, which consists of power supply (dynamo), transmission (currents/circuit) an dissipations (auroral substorms and magnetic storms).
It is emphasized in this paper that the auroral substorm is a manifestation of electromagnetic dissipative processes, namely an end product of a chain of processes, which consist of power supply (dynamo), transmission (electric currents/circuits), and dissipation (auroral substorms and geomagnetic storms). This approach is called the electric current approach.
In considering the electric current line approach, it is important to note that Alfven (1967) stated: “—we can illustrate essential properties of the electromagnetic state of space either by depicting the magnetic field lines or by depicting the electric current lines,” and further “Almost always the first picture associated with magnetic reconnection is used exclusively;” this situation has remained today. Furthermore, he continued : “It is important to note that in many cases the physical basis of the phenomena is better understood if the discussion is centered on the picture of the current lines.” In this paper, it is emphasized that the electric current approach is the basic way in dealing with electromagnetic dissipative phenomena, such as auroral substorms.
Thus, in this paper, we attempt to describe auroral substorms and the accompanying processes in terms of the electric current approach as the whole chain of processes, not in parts individually. This attempt is rather new, because the magnetic field line approach associated with magnetic reconnection has been treated solely as the traditional approach in the past, and has further, instead of the electric current approach, long been studied by a number of authors (cf. Vasyliunas, 1975).
For these reasons, the electric current approach must further be developed by new generations, particularly because it is the basic way in dealing with electromagnetic dissipative processes and can provide a new and different way of understanding auroral substorms; for a detailed first review of the electric current approach, see Akasofu (2017).
Explosive Nature of the Aurora
A curtain-like structure, called “auroral arc” or “arc,” of the aurora, located at the southern (equatorward) boundary of the auroral belt (≈65° geomagnetic latitude [gm. lat.]) around the geomagnetic pole (called the “auroral oval”) becomes suddenly bright in a matter of a few minutes in the midnight sector, and then advances rapidly poleward with the average speed of about 200 m/s; it can advance as much as 500 km or even more; other arcs in the oval become active at the same time. Figure 2a shows a sequence of all-sky images of the sudden brightening of an arc at substorm onset; Figure 2b shows an example of the poleward advance recorded by an all-sky camera; Figure 2c shows a satellite image of the expanded auroral oval in the dark sector by the poleward advance of arcs. Figure 2d illustrates schematically the auroral activities over the entire auroral oval during the expansion phase; auroral arcs are shown by lines.
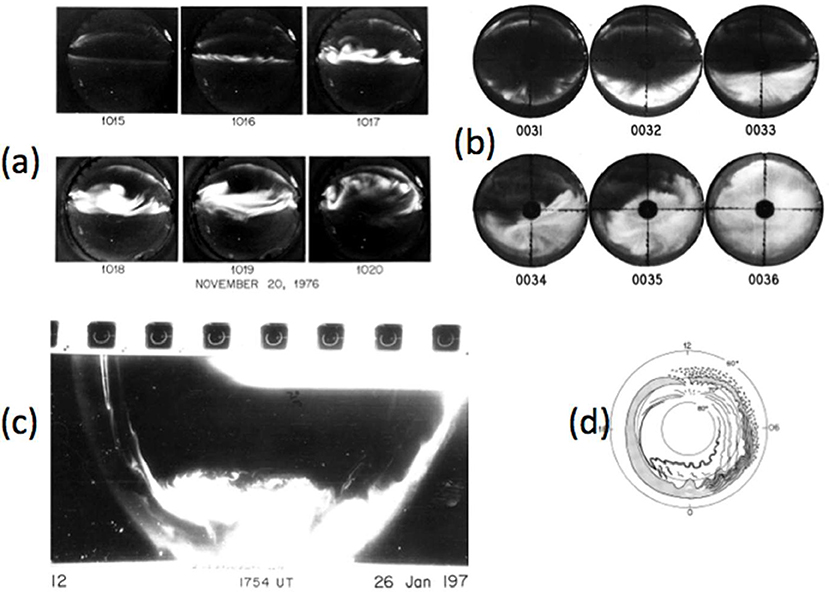
Figure 2. (a) A series of all-sky images, showing the initial brightening of an arc and indicating the onset of an auroral substorm over Fairbanks, Alaska (gm. lat. 65°N); the circular images cover the whole sky, the top is oriented toward the geomagnetic north. (b) A series of all-sky images, showing the poleward advance of arcs. (c) A satellite (DMSP) image of dark side of the polar region, showing the maximum stage of the expansion phase. (d) A schematic global illustration of auroral activity during a typical substorm; the top of the circle points 12 h and the bottom 0 h, and the ground-projection of auroral arcs are shown by lines.
Figure 3 shows one of the most spectacular poleward advances of the auroras during the last century, which occurred during the great geomagnetic storm of February 11, 1958. During the expansion phase, the auroras advanced poleward from about 48°gm. lat. (corresponding to L = 2.4) to at least 68°gm. lat. with a speed of 1.2 km/s, six times faster than the average speed. Figure 3A shows an all-sky image taken in Fairbanks (65° gm. lat.) at that time (the last part of this particular expansion phase), and Figure 3B shows the extent of the expansion in the North American sector on the basis of the IGY network of all-sky cameras. Similar expansions were repeated several times during the geomagnetic storm like large waves along seashore.
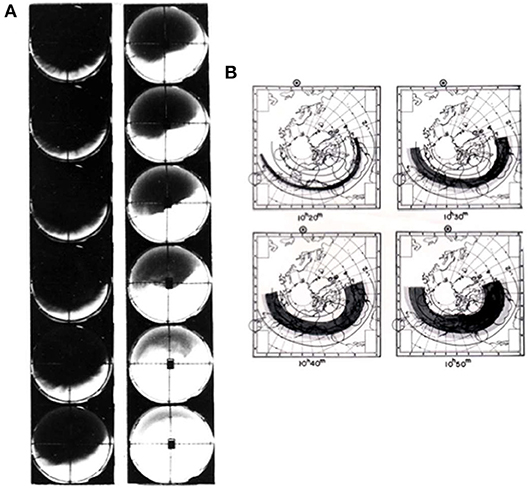
Figure 3. (A) a series of all-sky images during an intense substorm (AE ≈ 2,000 nT) recorded in Fairbanks, Alaska, during the great geomagnetic storm of February 11, 1958; it shows the last part of the great expansion phase observed in Fairbanks (65°gm. lat.). (B) the expansion phase over the North American Continent on the same day. Similar expansion occurred several times during the storm.
This particular type of auroral activities was analyzed and described as the expansion phase of auroral substorms (Akasofu, 1964). Figure 4 shows schematically how the expansion and recovery phases develop in time. There have been many series of satellite images, which are generally consistent with Figure 4 (cf. Frank and Craven, 1988). During the growth phase, it is known that the auroral oval expands and arcs shift equatorward.
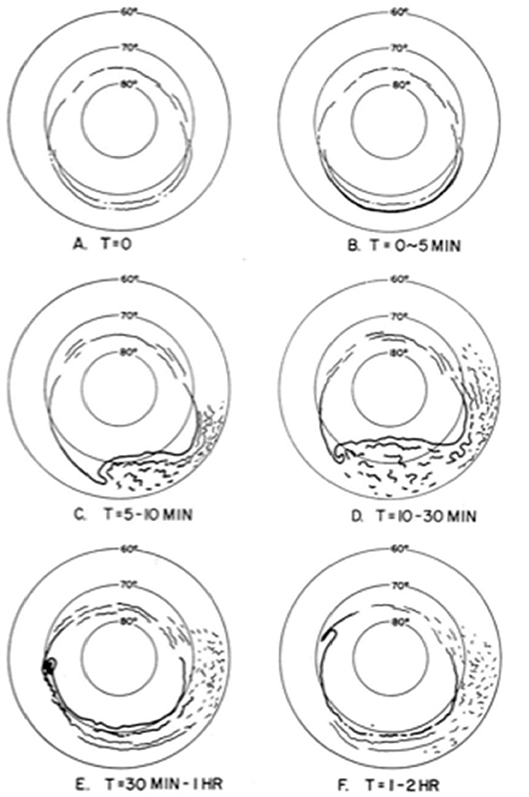
Figure 4. A schematic illustration of the expansion phase of an auroral substorm (Akasofu, 1964); the top of the circle is 12 h (geomagnetic time) and the bottom is 0 h, auroral arcs are shown by lines.
Explosive Nature of the Aurora
The cause of the expansion phase has been one of the major topics in magnetospheric physics and space physics, and is thus one of the most controversial subjects, namely the question is “why does the aurora tend to flare up from time to time ?”
As the first indication of the cause of substorms, (Fairfield and Cahill, 1966) found that polar magnetic disturbances associated with auroral substorms occur when the interplanetary magnetic field (IMF) has its southward component (-Bz). It was then generally agreed that the southward component of IMF (-Bz) plays a major role in causing auroral substorms.
Following their finding, earlier discussions on the topic were whether the magnetosphere acts like a tippy pitcher (Figure 5A), representing the suddenness of the occurrence of the expansion phase or a bucket-like, considering the suddenness as a result of variability of the solar wind (particularly IMF Bz); Figure 5B.
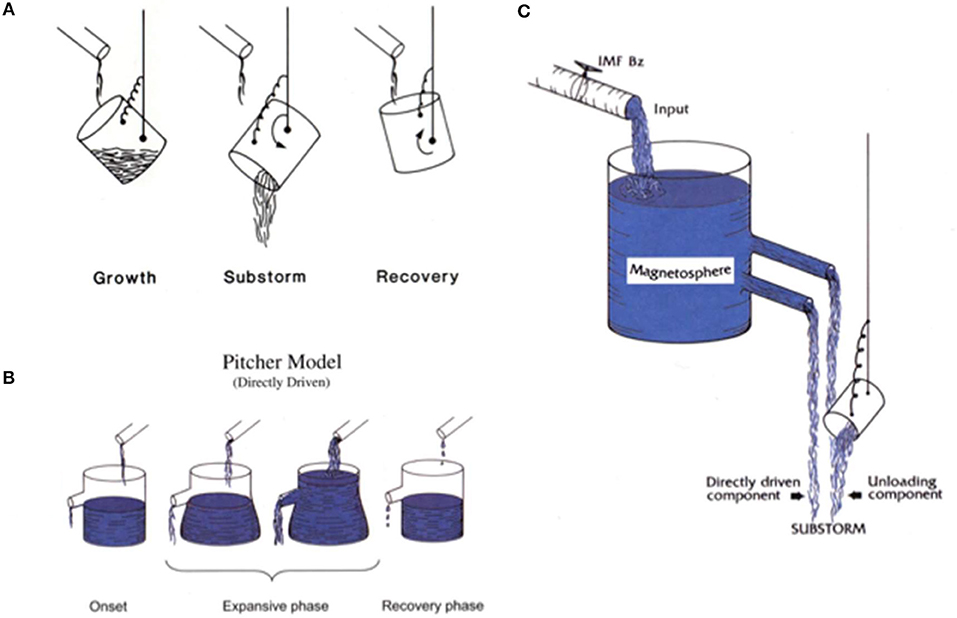
Figure 5. (A) a tippy pitcher model of substorms. (B) a bucket model of substorms. (C) after much discussions among researchers, it was agreed that the magnetosphere has both components.
However, the discussions were finally settled in terms of a bucket with a tippy pitcher (Rostoker et al., 1987); Figure 5C. This conclusion implies that the direct cause of the expansion phase (flaring) is mainly internal to the magnetosphere after the so-called “southward turning” of the IMF and thus that a part of the power of the solar wind-magnetosphere dynamo must once be accumulated in the tippy pitcher (in the inductive circuit of the magnetosphere) before the explosive activities, and is then suddenly unloaded for the expansion phase.
In the same year, when the concept of auroral substorms was published by Akasofu (1964), the magnetotail was discovered (Ness et al., 1964). Also in the same year, Petschek (1964) proposed a theory of magnetic reconnection on solar flares, in which he suggested that an anti-parallel magnetic field configuration reconnects explosively. Since the magnetic configuration is nearly anti-parallel in the magnetotail, most auroral researchers have considered that the magnetotail accumulates the magnetic energy, and magnetic reconnection in the magnetotail is the process of the converting the magnetic energy for the expansion phase, namely the magnetic field line approach (cf. Vasyliunas, 1975); for this reason, the “magnetic field line approach” has almost exclusively considered until today.
Electric Current Approach
The Solar Wind-Magnetosphere Dynamo and the Current Circuits
After the finding of the importance of the IMF (-Bz) component, there were a number of studies in determining the relationship between solar wind parameters and geomagnetic indices, AE and Dst. There are summarized in Table 1 in Akasofu (1981). Since the electric current approach considers the power (w) in this attempt, the first choice was to examine the relationship between the kinetic energy flux K (w) of the solar wind and the geomagnetic indices. However, it was found that there is no definite relationship between them; see Figure 4A in Akasofu (1981). The second choice of the power (w) is proportional to VB2; this choice was found by Perrault and Akasofu (1978), and was confirmed later by Vasyliunas et al. (1982). Since the power of electromagnetic processes must be provided by a dynamo, this finding confirmed that the solar wind-magnetosphere interaction constitutes a dynamo in terms of the electric current approach. In the magnetic field line approach, this interaction is expressed in terms of the transfer of magnetic field lines from dayside to night side.
The role of the southward component of the IMF (-Bz) was further studied and is now understood that the solar wind- magnetosphere interaction constitutes a dynamo (cf. Akasofu, 1977). Its power is given by the Poynting flux P (w):
where V and B are the solar wind speed and the intensity of magnetic field of the interplanetary magnetic field (IMF) respectively, and S = sin4(θ/2)l 2 where θ is the polar angle of the IMF, and l is tentatively set as 5 Re (Re = the earth's radius). It may also be useful to consider that the magnetic energy (B2/8π) is carried by the solar wind with a speed of V, and S is the cross-section of the magnetosphere; note that in the past, the power has been observationally (empirically) discussed in terms of ε (= P/8π). A typical power during a substorm is 5 × 10¹¹ w.
After the power is generated near the magnetopause, the resulting power is mainly transmitted to the direction of (E × B), namely toward the inner magnetosphere (because the magnetic configuration is basically dipolar within 10 Re), so that the energy is accumulated deep in the magnetosphere, much less in the magnetotail.
Electric Currents Directly Generated by the Dynamo (DD)
In the electric current line approach, it is crucial to know that the dynamo generates two currents, the directly driven (DD) current and the unloading current (UL). The DD current has two parts, the first is the solenoidal currents and the second is the ionospheric current, which is connected to the terminals of the dynamo by field-aligned currents.
Solenoidal Currents
There are two solenoidal currents, one is in the northern hemisphere and the other in the southern hemisphere, as shown in the vertical cross-section of the magnetosphere (Figure 6A); their equatorial parts are shown Figure 6B (Olson, 1984).
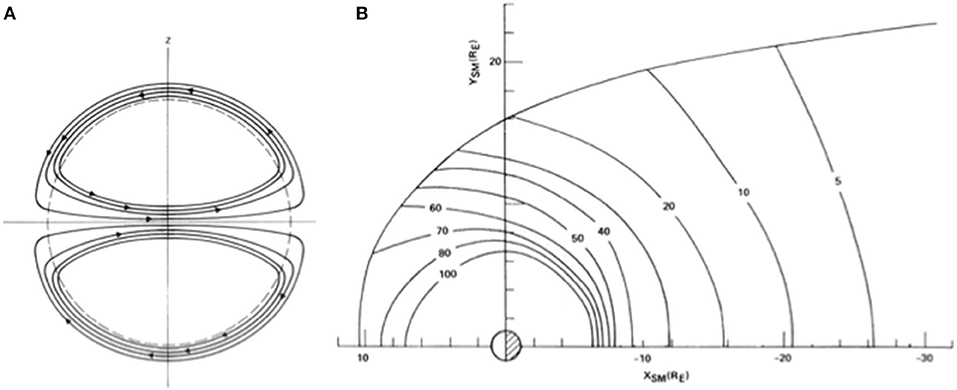
Figure 6. One of the directly driven (DD) current systems generated by the solar wind-magnetosphere dynamo; (A) in the vertical cross-section of the magnetosphere, there are two solenoidal currents. (B) the equatorial part of the solenoidal currents (Olson, 1984). As we discuss later, the current crossing the magnetosphere just outside the closed or circular current [ring current] plays a crucial role in producing auroral substorms (section A possible process for generating the earthward electric field).
Ionospheric Current
In describing the other DD current system in the ionosphere, the terminals of the solar wind-magnetosphere dynamo, the positive (+) terminal in the morning side and the negative (–) terminal in the evening side of the magnetopause, are connected to the auroral oval in the polar ionosphere by the magnetic field lines. The magnetic field lines are nearly equi-potential, so that the morning half of the auroral oval becomes positive (+), and negative (–) in the evening half, establishing an electric field across the polar cap.
Another way to describe this situation is that the dawn-to-dusk electric field across the magnetosphere drives an earthward plasma convection in the equatorial plane (Figure 7A) and induces the convection of the ionospherc plasma; the equi-potential contour (along which the convection occurs) thus produced in the ionosphere is shown in Figure 7B (Sun et al., 2002); the accuracy of this current distribution is confirmed by (Bristow and Jensen, 2007). Figure 7B is further explained in Figure 9A. Because of various complications (including the anisotropic conductivity of the ionosphere), the actual ionospheric equi-potential contours are greatly distorted from an ideal one considered by Chapman (1935), although Chapman's current system (SD) became the foundation of studies of the convection of magnetospheric and ionospheric plasmas byAxford and Hines (1961) and Dungey (1961).
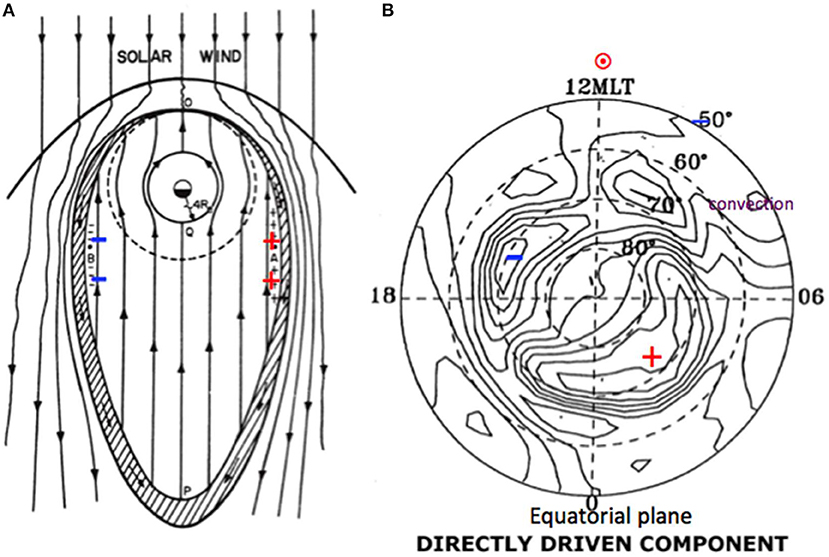
Figure 7. (A) the morning (+) and evening (–) boundaries (the terminals of the solar wind-magnetosphere dynamo) of the magnetosphere are connected with auroral oval in the polar ionosphere. The dawn-to-dusk directed electric field causes the earthward flow of plasma on the equatorial plane (Axford and Hines, 1961). (B) the observed equi-potental contours in the ionosphere (Sun et al., 2002).
The Current System Caused by Unloading (UL) and the Accumulated Magnetic Energy
Figure 8 shows the electric currents in the ionosphere during the maximum epoch of an auroral substorm which are deduced from a network of ground-based magnetic records. It shows also the simultaneous auroral image (Craven et al., 1984). The strong westward current (called the ‘auroral electrojet’) flows along the expanded auroral oval, particularly in the night sector. It should be noted in Figure 8 that and both the auroral arcs and the electrojet advanced to as far as 68°-70° in gm. lat. from about 65° gm. lat. in this substorm. This feature and its possible cause are discussed in sections. A possible process for generating the earthward electric field and The poleward advance of arcs
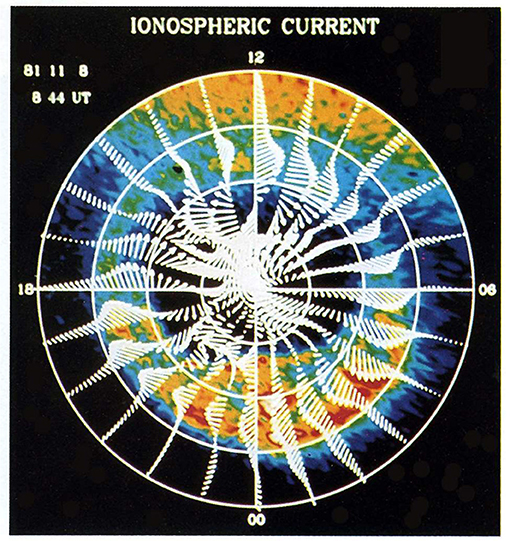
Figure 8. The ionspheric current distribution deduced from ground-based magnetometer network. The simultaneous auroral image obtained by a satellite is superposed (Craven et al., 1984). A strong current, called the “auroral electrojet,” flows along the oval. Both the electrojet and the aurora advanced poleward as far as 78° gm. lat. during this expansion phase.
During the expansion phase, a new current system, the unloading (UL) current system develops (corresponding to the tippy pitcher), in addition to an enhanced DD current (because of an enhanced conductivity during the expansion phase). However, magnetometers record both the dynamo-driven current (the directly-driven component, DD) and the current associated with the expansion phase (the unloading component, UL) together, namely (DD + UL). In order to determine the current component associated with the expansion phase (UL), it is necessary to isolate the UL component from the directly driven (DD) component.
It should be noted that the westward auroral electrojet current is mainly the Hall current, which is driven by a south (equatorward) electric field. It is very unlikely that the auroral electrojet is a diversion of the electric current on the equatorial plane (namely, the so-called “wedge current”); in such a case, the auroral electojet must be the Pedersen current, which is driven by the dawn-to-dusk electric field across the magnetotail. As observed in the ionosphere, the electric field in the auroral electrojet points southward, as Figure 7B shows (the electric field is perpendicular the equi-potential contours).
This effort of separating the DD and UL components was accomplished by Sun et al. (2002) as shown in Figure 9A; this separation was possible, because the DD component is a two-cell current, while the UL component has a single cell current (a two-dimensional Fourier analysis).
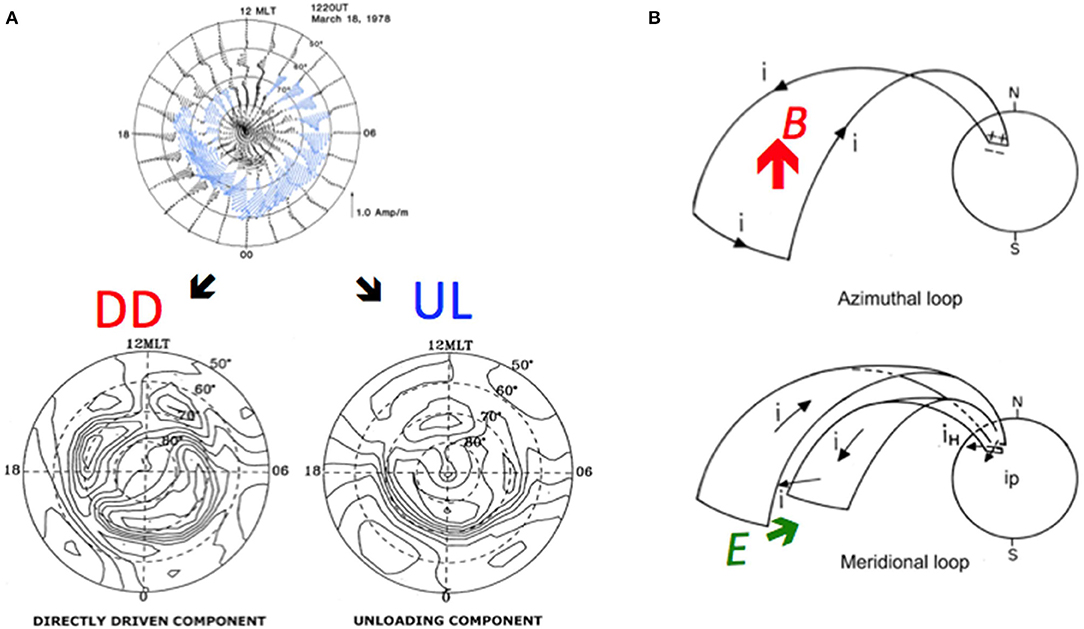
Figure 9. (A) the polar current deduced from the ground-based magnetometers is separated into two components, the directly driven (DD) by the solar wind-magnetosphere dynamo and the current generated by the unloading (UL) for the expansion phase (the same as Figure 7B). (B) the 3-D UL current system of the expansion phase was proposed by Bostrom (1964); the UL current in Figure 9A is the ionospheric part of the equivalent 3-D current system, which is produced by an earthward electric field (the green arrow E) as shown here (section A possible process for generating the earthward electric field). The red arrow (B) indicates the magnetic field produced by the azimuthal component of the 3-D current system which will be responsible for the poleward advance of the aurora and the auroral electrojet (section The Poleward Advance of Arcs).
In Figure 9A, the observed current distribution deduced by the ground-based magnetometer network (the top of Figure 9A) is separated into the DD component and UL component. The analytical accuracy of separating the DD and UL current is confirmed by the fact that the convection contour of the DD current in Figure 9A is very close to the observed contour (Bristow and Jensen, 2007); for the other confirmation, see Akasofu (2017).
The DD component described so far is the ionospheric part of the 3-D UL current system. Figure 9B is the 3-D configuration of the UL current system, which has two components, consisting of azimuthal and meridional components (Bostrom, 1964).
As will be discussed later, this current system is produced by an earthward electric current (E) on the equatorial plane (the green E in Figure 9B). Since the 3-D UL current system is the main cause of the expansion phase (the explosive activities), the search for the ultimate cause of the expansion phase is narrowed down to finding the cause of this electric field E. Since E•J is negative only in the equatorial part of the circuit, the location where E is generated must be mainly on and near the equatorial plane.
In this consideration, it is crucial to confirm that the UL current system is indeed the current system responsible for the expansion phase, Figure 10A shows time variations of the DD and UL components, together with the power (expressed in terms of ε).
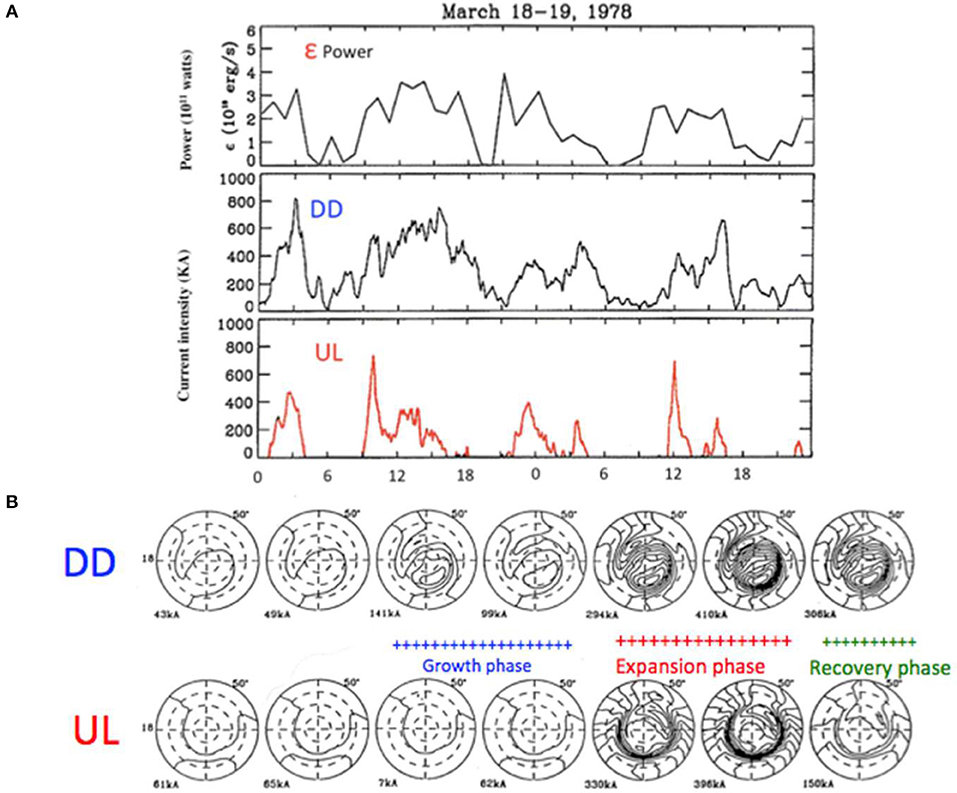
Figure 10. (A) from the top, the dynamo power (ε), the current intensity of the directly driven component (DD), and the current intensity generated by the unloading process (UL); the current intensity is proportional to the Joule heating production rate in the ionosphere. (B) the current distribution of both the DD and UL components during the last subtorm in Figure 10A. Note that the DD current was weak during the growth phase, so that the ionosphere could not dissipate the incoming power. Because of this situation, the dynamo power is accumulated in the inductive circuit in the main body of the magnetosphere. Note also that the DD component is intensified during and after the expansion phase, because the conductivity is greatly enhanced during the expansion phase.
Figure 10A shows their time variations of the DD and UL components during three auroral substorms. It can be seen that the DD component follows reasonably well the power ε (= P/8π), within the accuracy of the observation and analysis, confirming that the DD current is directly generated by the dynamo; note that in the ionosphere, the current intensity is proportional to the Joule heating dissipation rate δ (because the ionization and a high conductivity are proportional to the field-aligned current intensity (which is connected to the main part of the ionospheric current (the dissipation rate δ = current J2/σ = J(J/σ) ∞ J, where σ is the conductivity). On the other hand, the UL component shows impulsive (unrelated to the power ε) variations during the expansion phase, which are the main characteristics of the sudden explosive occurrence and duration the expansion phase. Figure 10B shows the current distribution during one of the expansion phases (the last substorm in Figure 10A). After the expansion phase, the recovery phase lasts for a long time until the power becomes <1011 w.
Figure 10B shows one of the most important aspects of auroral substorms, which can tell why the magnetosphere can accumulate the energy in its inductive circuit for the explosive activities of the aurora. The DD component is very weak during the growth phase, indicating that the ionosphere cannot dissipate the incoming power ε, in spite of the fact that the power is high (≈2.5 × 10¹¹ w in the last substorm in Figure 10A). This is because the ionosphere is not conductive enough to dissipate the input power during the growth phase. Thus, the power must be accumulated in the inductive circuit of the magnetosphere.
It is in this course of analysis that the energy dissipated during a substorm is accurately determined for the first time (Ahn et al., 1983). In fact, it can be shown also that the total magnetic energy accumulated during the growth phase is about the same as the energy dissipated as the Joule heating, namely ∫P(t)dt ≈ ∫ δ(t)dt within the accuracy of the analysis. In supporting this conclusion, it may be noted that the duration of the growth phase is about 1 h and that the duration of the expansion phase is also 1 h, and further, the power and the dissipation rate are about the same. In the electric current approach, the power and energy are given by the dynamo. The above conclusion indicates that auroral substorms do not require any major energy supply.
Thus, it is unlikely that magnetic reconnection in the magnetotail provides a substantial extra energy; this is confirmed by a satellite observation, which shows no sufficient energy flows from the magnetotail, which is needed for a substorm (Miyashita et al., 2012).
A Possible Process for Generating the Earthward Electric Field
The process of the explosive activities is a matter of great controversy today and has so far been not settled yet. The first problem is where the magnetic energy is accumulated. The magnetic field line approach considers that the magnetic energy is accumulated in the magnetotail and is then unloaded by the process of magnetic reconnection. However, Akasofu (2017) showed that the magnetotail between 10 and 20 Re (where magnetic reconnection has been observed) does not contain enough magnetic energy for a substorm; as confirmed by a satellite observation (Miyashita et al., 2012).
The electric current line approach considers that the energy is accumulated within the main body of the magnetoshere between 4 and 10 Re, depending on the intensity of substorms, which ranges from 100 to 2,000 nT in terms of the AE index; this point will be further discussed in section The Poleward Advance of Arcs. As mentioned earlier, the 3-D UL current system (Bostrom's current system) is driven by an earthward electric field (E), which becomes a southward (equatorward) electric field in the ionosphere (Figure 9B), driving the westward auroral electrojet (because of the Hall conductivity). Further, it is unlikely that the equatorial part of the UL current is located in the magnetotail, since the initial brightening of an arc at the expansion phase onset is most often located at 65°gm. lat. and there is no particular auroral motions in the midnight sector prior to the growth phase, except an equatorward expansion of the auroral oval as a whole.
Thus, it is emphasized that in terms of the electric current approach, the search for the cause of the expansion phase is narrowed down to finding the process of generating earthward electric field E for the 3-D UL current system as a result of unloading the accumulated energy, not by magnetic reconnection in the magnetotail (cf. Akasofu, 2013, 2017).
In terms of the electric current approach, one of possible causes of the earthward electric field for the average substorms is thus as follows. When the dynamo power increases, the solenoidal currents grow near the earth (say, 6 Re), just outside the circular current [the ring current] around the earth in Figure 6B. This current causes “inflation” of the main body of the magnetosphere (Figure 11A). When the accumulated energy reaches about 5 × 10¹⁵ J or at most 1016 J as a result of the growth of the current, the magnetosphere becomes unstable and unloads the accumulated energy (produced by the current just outside of the ring current) in order to stabilize itself; this instability is likely to be caused by current instabilities and reduces the current intensity (cf.Lui and Kamide, 2003). As a result, the current intensity is reduced, and thus “deflation” occurs (Figure 11A). The deflation will produce the needed earthward electric field E = [-(∂Bz/∂t)∫∂y]≈ 5–50 mV/m. Microscopically, electrons (closely tied to magnetic field lines) move toward the earth during the deflation, while protons do not (because almost untied); Figure 11B.
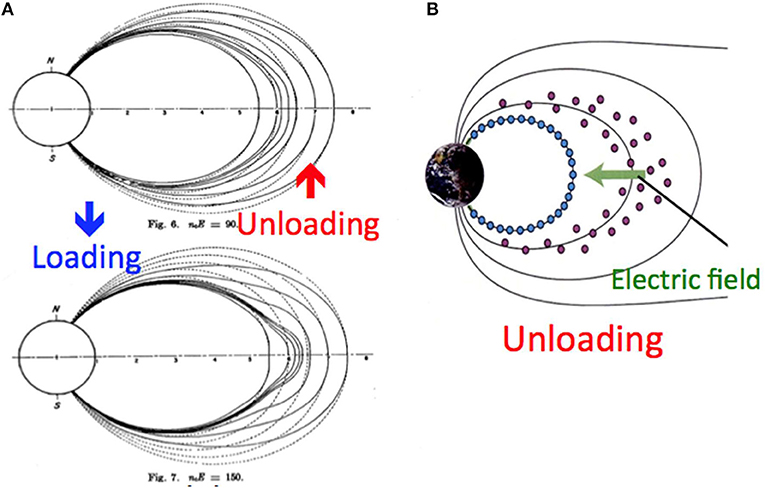
Figure 11. (A) when the dynamo power is increased (in the case of the average substorm), the current loaded around 6 Re (Figure 6B) is increased. As a result, the magnetosphere is inflated as shown. The magnetic configuration changes from the above (pre-substrom condition to below (just before the expansion phase onset). At the expansion onset, the magnetosphere is deflated and return back to the pre-substorm condition. (B) during this returning back to the pre-substorm condition, electrons tend to follow the contracting field lines, not proton, generating an earthward electric field.
This charge separation process can set up the desired earthward electric field E (Figure 9B, Figure 11B), which drives the Bostrom's 3-D UL current system (Figure 9B). The separated electrons are discharged toward the ionosphere, causing the initial brightening of the arc (Figure 2a), signaling the onset of the expansion phase; this is expected to occur along a large azimuthal range (Figure 9B). In the ionosphere, this electric field E is directed southward (equatorward) and drives the westward auroral electrojet. The field-aligned current in the 3-D UL current is responsible for the ionization of the ionosphere, further brightening auroral arcs and increasing the conductivity of the ionosphere, which enhances the DD current as well. As described in section The poleward advance of arcs, the magnetic field of the 3-D UL current (the red arrow B in Figure 9B) causes the poleward shift of its earthward end, causing the poleward expansion of both auroral arcs and the auroral electrojet.
Thus, as discussed earlier, from the point of view of the electric current approach, the cause of the expansion phase is directly related to the question as to how the earthward electric field is set up, resulting in the 3-D UL current system; it is hoped that the magnetic field line approach will arrive at the same conclusion in spite of the different approach.
There are a few crucial observations to support the above chain of processes. Figures 12, 13 show two substorms observed at 6 and 8.1 Re (both are within 10 Re), respectively. In Figure 12, there occurred a depression or deformation of the dipolar field (the blue arrow) of the field as a result of the increasing current intensity around 6 Re before the expansion phase, namely during the growth phase (DeForest and McIlwain, 1971). This results in the inflation of the magnetosphere during the growth phase (Figure 11A). At the expansion phase onset, the current intensity is reduced (as a result of current instabilities) and thus the magnetic field configuration is rapidly “recovered” from the inflated situation, indicating the deflation. This phenomenon has been often described as “dipolarization.” From the point of view of the electric current approach, the increased observed field is mainly caused by the 3-D UL current system (the red B in Figure 9B), not by reconnection; often, the increased field exceeds the pre-onset field dipolar field (often more than the “dipolarzation”).
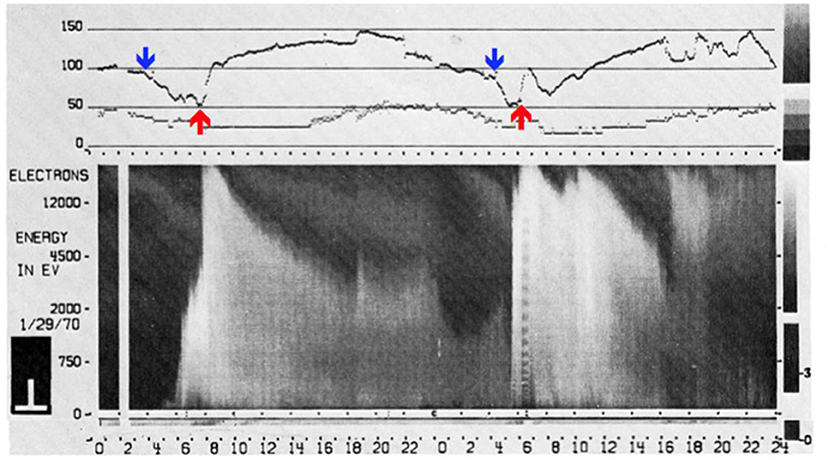
Figure 12. The magnetic field observation at 6 Re during two substorms, showing a decrease of the field intensity (blue arrow) during the growth phase and subsequent sudden increase (red arrow) at the expansion onset (DeForest and McIlwain, 1971); the increase is called the dipolarization, but the field increase is often more than the depolarization.
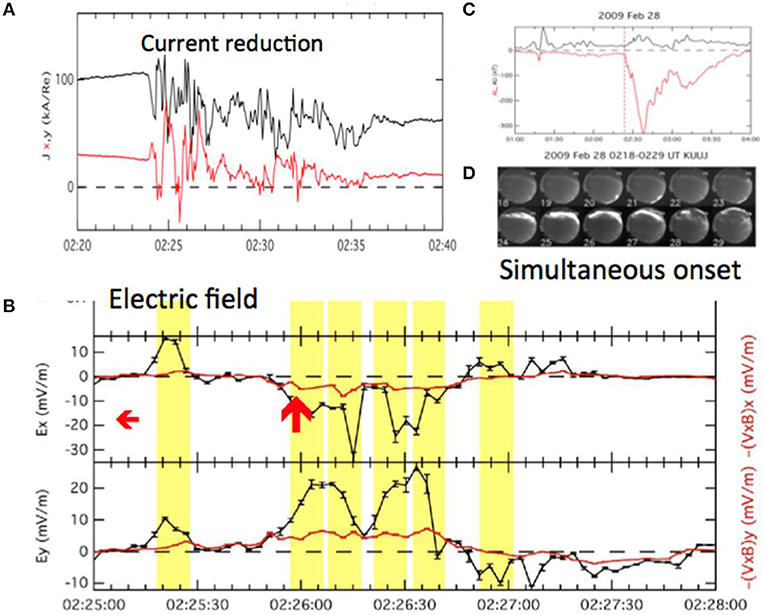
Figure 13. (A,C,D) the current at 8.1 Re was decreased when an auroral substorm occurred as shown by a series of all-sky images and by the occurrence of a negative change of the field (the development of the auroral electrojet). (B) a satellite observation at 8.1 Re, showing the growth an earthward electric field (Ex) of 30 mV/m. The figure shows also that the condition of (E + Vx B = 0) (the frozen-in field condition) broke down; the difference between the black and red lines indicates how much the frozen-in field condition is broken down.
Another crucial observation was made at 8.1 Re at a substorm onset (Lui, 2012). This observation confirms the chain of processes proposed in this paper. Figure 13 shows that the current at 8.1 Re decreased by the occurrence of current instabilities, exactly when an auroral arc brightened in the midnight sector. At about the same time an earthward electric field was generated for the 3-D UL current system as proposed. Further, the condition of (E + VxB = 0) is broken down as observed, so that the frozen-in field condition is also broke down, allowing the charge separation and the earthward electric field E to occur.
These two observations support the chain of processes discussed in terms of the electric current approach. However, more similar observations are needed to confirm the results.
The Poleward Advance of Arcs
In Figure 9B, the red arrow (B) is shown to indicate the magnetic field produced by the azimuthal component of the 3-D UL current system. The intensity of this field is about 25–50 nT in the equatorial area covered by the current (including “positive bays” on the ground). The magnetic flux in the area (2 × 10⁹ km2) corresponding to the advanced range of 600 km of the arcs is about the same as the total magnetic flux (1011 nT km2) of B (= 50 nT) of the circuit.
It is suggested that it is this magnetic field B, which advances the earthward end (the ionosphere) of the circuit (auroral electrojet) toward higher latitudes, resulting in the poleward advance of the auroral arcs and the auroral electrojet, causing the explosive feature. In fact, it is established that the arcs and the electrojet advance poleward together (Figure 8).
Successive Occurrence of Auroral Substorms
Auroral substorms occur often successively. Figure 14A shows an example of three successive occurrence of substorms. It is of interest to see what would happen when the solar wind-magnetosphere dynamo power is continuously high for 10 or more. In such a case, auroral substorms occur successively, as Figure 14B shows (not continuous one substorm during the whole storm period), suggesting that the magnetosphere can accumulate only a limited amount of magnetic energy, and thus unloads successively the accumulated energy, when the limited amount is reached (at most 1016 J), as the idea of the tippy pitcher suggests (illustrated at the bottom of Figure 14B). This observation confirms the concept of “tippy pitcher” and further confirm that that the magnetosphere can accumulate only a limited amount of energy.
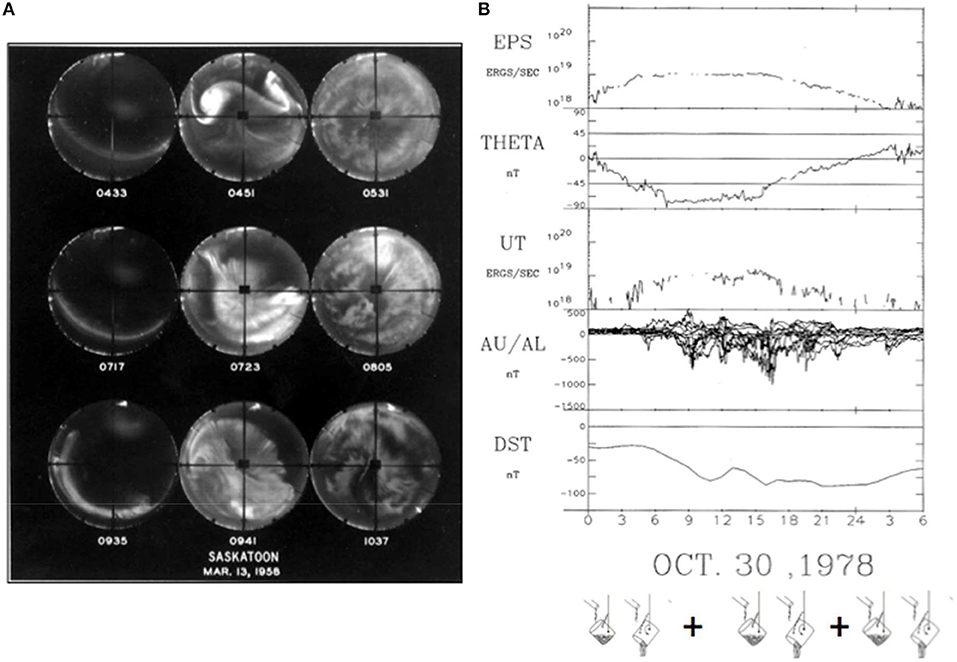
Figure 14. (A) an example of three successive substorms, repeating the poleward expansions during a single night. (B) when the dynamo power is continuously high (1019 erg/s), substorms occur successively (not continuously); the tippy pitchers are shown to indicate such a situation. This example occurred during a intense geomagnetic storm of October 30, 1978.
From the point of view of the electric current approach, the location where the magnetic energy is accumulated depends on the power of the dynamo and magnetospheric conditions (4 to 10 Re), not in the magnetotail. When the solar wind-magnetosphere dynamo power and the resulting electric field across the magnetosphere are high (AE index > 1,000 nT), the generated earthward plasma flow is expected to be strong, suggesting the ring current and the current just out side the ring current shifts closer to the earth; such a shift has been observed during intense geomagnetic storms. In fact, in the case of Figure 3, the latitude of the initial brightening arc was located as low as at 48°gm. lat. (corresponding to L = 2.4); note that the auroral oval was expanded, too. Because of a great distortion of the magnetic field of the magnetosphere during the great storm, the arc location may be connected to about 4 Re in the equatorial plane, instead of 2.4 Re; it is expected that the magnetosphere can accumulate more energy at closer distances to the earth, because of higher B (accommodating more intense currents). On the other hand, it is likely that the energy is accumulated at about 10 Re cause weakest substorms (AE index ≈ 100 nT). As a supporting observation of the above assumption, it is interesting to observe that during the period when the dynamo power is gradually decreasing during the recovery phase of intense geomagnetic storms, the intensity of successive substorms becomes weaker, and the auroral oval contracts poleward, indicating the shift (away from the earth) of the location of the accumulated energy.
Summary
It may be useful to summarize the results obtained by the electric current approach after establishing the six meridian chains of magnetic observatories in the 1970s.
(1) It is shown that the solar wind-magnetosphere interaction constitutes a dynamo.
(2) The typical power of the dynamo is about 5 × l011 w (= 5 × 10¹⁸ erg/s).
(3) The resulting power is transmitted largely to the magnetosphere at a distance of 4–10 Re.
(4) Substorms occur when the dynamo power becomes greater than about 1011 w (= 1018 erg/s).
(5) The substorm current system consists of two components, the directly driven (DD) component and the unloading (UL) component. Their characteristics (the current distribution and time variation) are determined.
(6) It is shown quantitatively why the magnetosphere can accumulate the energy for the expansion phase during the growth phase.
(7) The UL current system (Bostrom, 1964) is identified as the cause of the expansion phase.
(8) The dissipation rate (about 5 × 10¹¹ w or 5 × 10¹⁸ erg/s) and the amount (at most 1015 J or1023 erg) of a single substorm are accurately determined.
(9) It is shown that the maximum amount of energy which the magnetosphere can accumulate is at most 1015 w or 1023 erg, beyond which the magnetosphere becomes unstable.
(10) It is shown that ∫ P(t)dt ≈ ∫ δ(t)dt, so that the input from the magnetotail is not significant.
(11) It is shown that the UL current system is generated by an earthward electric field.
(12) It is tentatively suggested that the cause of the earthward electric field is caused by the deflation of the magnetosphere after the inflation caused by the accumulated energy; the concept of the frozen-in field breaks down at this crucial time.
(13) It is shown quantitatively that the poleward expansion of arcs is caused by the magnetic field of the UL current system.
It is emphasized that each of the above statements can be debated, since the electric current approach is in its initial stage. It is for this reason that young generations are encouraged to explore the secrets of auroral substorms.
Conclusions
The electric current approach provides a different view on the processes of auroral substorms from that of the magnetic field line approach. The successful separation of the DD and UL current components has allowed us to understand the basic physics associated with the response of the magnetosphere to an increased power of the solar wind-magnetosphere dynamo, in addition to the total energy involved in substorm processes. Thus, it is important that auroral substorms should be studied by both the electric current approach and the magnetic field line approach.
So far, the electric current line approach as a whole has been taken up only by a few groups. Because of this situation, the electric current approach has not developed satisfactorily yet and thus is very incomplete. It is hoped that many more groups will join in this effort. As Alfven pointed out, the physics of auroral substorms becomes more clear in the electric current approach.
Author Contributions
The author confirms being the sole contributor of this work and has approved it for publication.
Conflict of Interest Statement
The author declares that the research was conducted in the absence of any commercial or financial relationships that could be construed as a potential conflict of interest.
Acknowledgments
The author would like to thank Dr. C.-I. Meng, Dr. Y. Kamide, Dr. Sun Wei, Dr. B.-H. Ahn, and Dr. A. T. Y. Lui for participating in the electric current line approach of auroral substorms. In the electric current aopproach, the author was guided by Dr. Sydney Chapman and Dr. Hannes Alfven. The author would like to thank also all substorm researchers, advancing so much substorm research.
References
Ahn, B. H., Akasofu, S. I., and Kamide, Y. (1983). The Joule heat production rate and the particle energy injection rate as a function of geomagnetic indices AE andAL. J. Geophys. Res. 88, 6275–6287.
Akasofu, S. I. (1981). Energy coupling between the solar wind and the magnetosphere. Space Sci. Rev. 28, 121–190.
Akasofu, S. I. (2013). Where is the magnetic energy for the expansion phase of auroral substorms accumulated? J. Geophys. Res. 118, 7219–7225. doi: 10.1002/2013JA019042
Akasofu, S. I. (2017). Auroral substorms: Search for processes causing the expansion phase in terms of the electric current approach. Space Sci. Rev. 212, 341–381. doi: 10.1007/s11214-017-0363-7
Alfven, H. (1967). “The second approach to cosmical electrodynamics,” in The Birkeland Symposium on Aurora and Magnetic Storms, eds A. Egeland and J. Holtet (Sandefjord: Centre Natinal de la Recherche Scientifique), 439–444.
Axford, W. I., and Hines, C. O. (1961). A unifying theory of high-latitude geophysical phenomena and geomagnetic storms. Can. J. Phys. 39, 1433–1464.
Bristow, W. A., and Jensen, P. A. (2007). superposedepoch study of superDARN convection observations during substorms. J. Geophys. Res. 112:A06232. doi: 10.1029/2006JA012049
Chapman, S. (1935). The electric current-systems of magnetic storms. Terr. Mag. Atmos. Elect. 40:349
Craven, J. D., Kamide, Y., Frank, L.A , Akasofu, S. I., and Sugiura, M. (1984). “Distribution of aurora and ionospheric currents observed simultaneously on a global scale,” in Magnetospheric Currents, AGU Monograph, Vol. 28, ed T. A. Potemura (Washington, DC: AGU), 137–146.
DeForest, S. E., and McIlwain, C. E. (1971). Plasma clouds in the magnetosphere. J. Geophys. Res. 76, 3587–3611.
Dungey, J. M. (1961). Interplanetary magnetic field and the auroral zones. Phys. Rev. Lett. 6, 47–48.
Fairfield, D. H., and Cahill, L. J. (1966). Transitionn region magnetic field and polar magnetic disturbancvs. J. Geophys. Res. 71, 155–169.
Frank, L. A., and Craven, J. D. (1988). Imaging results from dynamic explorer 1. Rev. Geophys. 26, 249–283.
Lui, A. T. Y. (2012). Reduction of the cross-tail current during near-Earth depolarization with multisatellite observations. J. Geophys. Res. 116:A12239. doi: 10.1029/2011JA017107
Lui, A. T. Y., and Kamide, Y. (2003). A fresh perspective of the substorm current system and its dynamo. Geophys. Res. Lett. 30, 12-1–12-4. doi: 10.1029/2003GL017835
Miyashita, Y., Machida, S., Nose, K., Liou, K., Saito, Y., and Peterson, A. (2012). A statistical study of energy release and transport midway between the magneticvreconnection and intialdipolarization regions in the near-earth magnetotail associated with sudden expansion onse. J. Geophys. Res. 117:A11214. doi: 10.1029/2012JA017925
Ness, N. F., Scearce, C. S., and Seek, J.B (1964). Initial results of the Imp 1 magnetic field experiment. J. Geophys. Res. 69, 3531–3569.
Olson, W. P. (1984). “Introduction to the topology of the magnetospheric current systems,” in Magnetospheric Currents, AGU Monograph vol. 28, ed T. A. Potemra (Washington DC: AGU), 49–62.
Perrault, P., and Akasofu, S. I. (1978). A study of geomagnetic storms. Geophys. J. R. Astron. Soc. 54, 547–573.
Petschek, H. E. (1964). “Magnetic field annihilation, 425-439,” in The Physics of Solar Flares, Proceedings of the AAS-NASA Symposium held 28-30 October, 1963 attghe Goddard Space Flight Center, Greenblt, MD, eds W. H. Hess (Washington, DC: NASA, Science and Technical Division)
Rostoker, G, Akasofu, I., Baumjohann, W., Kamide, Y., and McPherron, R. L. (1987). The roles of direct input of energy from the solar wind and unloading of stored magnetotail energy in driving magnetospheric substorms. Space Sci. Rev. 46, 93–111.
Sun, W, Xu, S. Y., and Akasofu, S. I. (2002). Matgematical separationof directly –driven and unloading components in the ionospheric equivalent current during substorms. J. Geophys. Res. 103, 11695–11700. doi: 10.1029/97JA03458
Keywords: auroral substorms, solar wind-magnetoshere interaction, interplanetary magnetic field, magnetic reconnection, magnetic field line approach
Citation: Akasofu S-I (2019) The Explosive Characteristics of the Aurora: The Electric Current Line Approach. Front. Astron. Space Sci. 6:1. doi: 10.3389/fspas.2019.00001
Received: 12 September 2018; Accepted: 10 January 2019;
Published: 31 January 2019.
Edited by:
Ioannis A. Daglis, National and Kapodistrian University of Athens, GreeceReviewed by:
Romain Maggiolo, The Royal Belgian Institute for Space Aeronomy (BIRA-IASB), BelgiumHarald Uwe Frey, University of California, Berkeley, United States
Copyright © 2019 Akasofu. This is an open-access article distributed under the terms of the Creative Commons Attribution License (CC BY). The use, distribution or reproduction in other forums is permitted, provided the original author(s) and the copyright owner(s) are credited and that the original publication in this journal is cited, in accordance with accepted academic practice. No use, distribution or reproduction is permitted which does not comply with these terms.
*Correspondence: Syun-Ichi Akasofu, c2FrYXNvZnVAYWxhc2thLmVkdQ==