 S. Krishna Prasad
 David B. Jess
 Tom Van Doorsselaere
- 1Astrophysics Research Centre, School of Mathematics and Physics, Queen's University Belfast, Belfast, United Kingdom
- 2Department of Physics and Astronomy, California State University Northridge, Northridge, CA, United States
- 3Centre for Mathematical Plasma Astrophysics, KU Leuven, Leuven, Belgium
The rapid damping of slow magnetoacoustic waves in the solar corona has been extensively studied in previous years. Most studies suggest that thermal conduction is a dominant contributor to this damping, albeit with a few exceptions. Employing extreme-ultraviolet (EUV) imaging data from SDO/AIA, we measure the damping lengths of propagating slow magnetoacoustic waves observed in several fan-like loop structures using two independent methods. The dependence of the damping length on temperature has been studied for the first time. The results do not indicate any apparent decrease in damping length with temperature, which is in contrast to the existing viewpoint. Comparing with the corresponding theoretical values calculated from damping due to thermal conduction, it is inferred that thermal conduction is suppressed in hotter loops. An alternative interpretation that suggests thermal conduction is not the dominant damping mechanism, even for short period waves in warm active region loops, is also presented.
1. Introduction
Propagating waves along fan-like active region loops have been a common observational feature since their initial discovery in the solar corona (Ofman et al., 1997; Deforest and Gurman, 1998; Berghmans and Clette, 1999; De Moortel et al., 2000). Recent multi-wavelength observations have established the origin of these waves in the photosphere (Jess et al., 2012; Krishna Prasad et al., 2015), from where they could be channeled by magnetic fields into the corona (De Pontieu et al., 2005; Erdélyi, 2006; Khomenko et al., 2008). It is believed that these waves are a manifestation of propagating slow magnetoacoustic oscillations that are generated via mode conversion (Spruit, 1991; Cally et al., 1994) in the lower atmospheric layers. Their physical properties found in a variety of coronal structures have been extensively studied both from theoretical and observational vantage points (De Moortel, 2009; Wang, 2011; Krishna Prasad et al., 2012b; Banerjee and Krishna Prasad, 2016). In the solar corona, the slow magnetoacoustic waves undergo rapid damping and are consequently visible only over a small fraction of the loop length. A number of physical mechanisms such as thermal conduction, compressive viscosity, optically thin radiation, gravitational stratification, divergence of the magnetic field, etc., are known to affect the amplitude of slow magnetoacoustic waves. Thermal conduction, however, has been put forward as the dominant contributor for their damping (De Moortel and Hood, 2003, 2004). It must be noted that slow magnetoacoustic waves also exhibit frequency-dependent damping, with stronger dissipation at higher frequencies (Krishna Prasad et al., 2014, 2017) which, as well, is shown to be consistent with generalized damping via thermal conduction (Mandal et al., 2016).
Marsh et al. (2011) studied slow magnetoacoustic waves propagating within a coronal loop using stereoscopic images from STEREO/EUVI (Wuelser et al., 2004) and simultaneous spectroscopic data from Hinode/EIS (Culhane et al., 2007). It was found that thermal conduction was insufficient to explain the observed damping, and instead magnetic field divergence appeared to be the dominant factor. Marsh et al. (2011) explained that the discrepancy was due to the relatively longer oscillation periods (~10 min) and colder temperatures (~0.84 MK) observed within the loop. Following a method developed by Van Doorsselaere et al. (2011); Wang et al. (2015) estimated the polytropic index from the temperature and density perturbations corresponding to a standing slow magnetoacoustic wave observed in a hot flare loop. Based upon the value of the polytropic index (γ = 1.64±0.08) they obtained, Wang et al. (2015) inferred that thermal conduction is suppressed and that the observed damping could be explained by a slightly enhanced compressive viscosity term, which was later validated through magnetohydrodynamic (MHD) simulations (Wang et al., 2018). Krishna Prasad et al. (2018) investigated propagating slow magnetoacoustic waves in a number of active region fan-like loops and found a temperature dependency of the polytropic indices, whereby hotter loops corresponded to larger polytropic index values. However, the authors concluded that the polytropic index could be, in fact, affected by a range of physical processes, including an unknown heating mechanism, radiative losses, plasma flows, turbulence, etc., suggesting that a direct association between the polytropic index and thermal conduction cannot be unequivocally deduced. Indeed, Zavershinskii et al. (2019, private communication) found that an imbalance in the embedded plasma heating and cooling processes can actually cause temperature-dependent variations in the polytropic index. Here, we study the damping of short period (~3 min) oscillations in quiescent active region fan-like loop structures, which was previously suggested to be the result of thermal conduction. The temperature dependency of the damping length is also investigated to find whether there are signatures of thermal conduction being suppressed in hotter loops. Details on the observational data used, the analysis methods employed, and the results obtained are presented in the subsequent sections, followed by a discussion of the obtained results and their implications for future studies of the solar corona.
2. Observations
Extreme-ultraviolet (EUV) imaging observations of solar coronal fan loops taken by the Atmospheric imaging assembly (AIA; Lemen et al., 2012) on-board the Solar Dynamics Observatory (SDO; Pesnell et al., 2012) are utilized for the present study. AIA captures the entire Sun in 10 different wavelength channels, from which 6 are mainly dedicated to coronal observations. Using online data browsing tools, such as Helioviewer1, we selected 30 different active regions (ARs) with fan-like loop structures, where propagating oscillation signatures are clearly observed. The observations of these ARs span from 2011 to 2016, although a majority of them were taken between 2012 and 2014 (i.e., during the last solar maximum). For each active region, a 1-h-long image sequence, comprising of a small subfield (≈180″×180″) surrounding the desired loop structures, is extracted for all 6 dedicated SDO/AIA coronal channels (94 Å, 131 Å, 171 Å, 193 Å, 211 Å, and 335 Å). The spatial sampling and the cadence of the data are 0.6″ per pixel and 12 s, respectively. All of the data were processed using the aia_prep routine, which is available within the Solar SoftWare (SSW) environment, to perform the roll angle and plate scale corrections required for subsequent scientific analysis. To achieve accurate alignment between the data from multiple channels, and to successfully implement some of the above processing steps, we employed the robust pipeline developed by Rob Rutten2. This dataset was previously used in the study by Krishna Prasad et al. (2018), where complete observational details, including the locations, start times, active region numbers, etc., of the individual image sequences are listed.
3. Analysis and Results
The fan-like loop structures within a sample active region (NOAA AR 12553) from the selected dataset are displayed in Figure 1a. Compressive oscillations, with a periodicity of ≈180 s, are found propagating outwards along these loop structures. In order to identify the oscillations and understand their propagation behavior, a time-distance map (De Moortel et al., 2000) is constructed from one of the loop segments bounded by the two solid blue lines marked in Figure 1a. The specific details of the method employed here are described in Krishna Prasad et al. (2012a), but in general, the intensities corresponding to the pixels across a selected loop segment are averaged to build a one-dimensional intensity profile along the loop, with similar profiles from successive images stacked together to generate a time-distance map. The final map obtained is shown in Figure 1b, with the x-axis displaying time in minutes and the y-axis displaying distance along the loop in megameters (Mm). Slanted ridges of alternating brightness, visible in this map, reveal the propagating waves along the selected loop. Previous studies of such oscillations, especially those propagating along similar fan-like loop structures that are usually rooted in sunspots, confirm their nature as propagating slow magnetoacoustic waves (e.g., Kiddie et al., 2012; Krishna Prasad et al., 2012b). To enhance the visibility of the ridges, the time series at each spatial position was filtered to allow only a narrow band of frequencies around the dominant oscillation period to remain. The filtered time-distance map is displayed in Figure 1c. It is clear that the amplitude of the oscillations is not constant, but instead varies with time and, in particular, decreases with distance along the loop from the corresponding foot point. The temporal modulation of the oscillation amplitude has been linked to the characteristics of the wave driver, with closely-spaced frequencies causing a beat-like phenomenon (e.g., Krishna Prasad et al., 2015), whereas the spatial damping is mainly due to physical wave dissipation and some geometrical factors. As discussed in section 1, thermal conduction is believed to play a key role in the observed spatial damping.
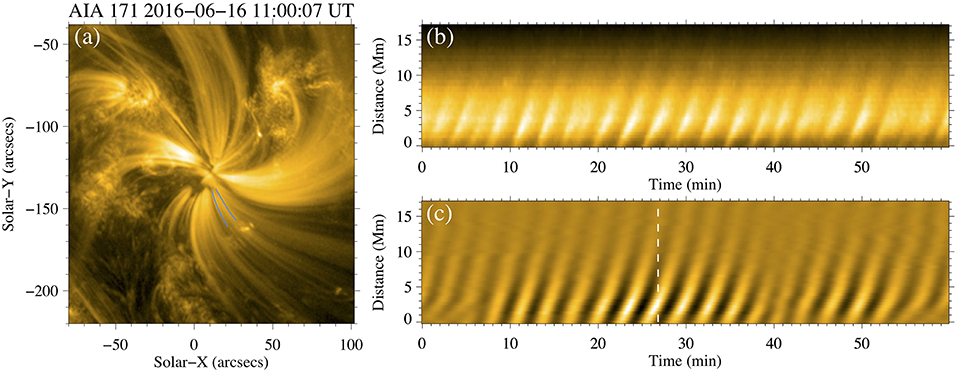
Figure 1. (a) A snapshot of the fan-like loop structures from NOAA AR 12553 captured in the SDO/AIA 171 Å channel. The blue solid lines mark the boundaries of a chosen loop segment. (b) Time-distance map depicting the evolution of the loop segment shown in (a). The alternating slanted bands of brightness apparent in this map indicate the presence of propagating compressive oscillations due to slow magnetoacoustic waves. (c) Same as (b), but processed to enhance the visibility of the brightness ridges by filtering the time series at each spatial position to allow only a narrow band of frequencies around the dominant oscillation period. The white dashed line marks the temporal location chosen to study the spatial damping characteristics shown in Figure 2.
We identify a total of 35 loop structures from the 30 active regions, where signatures of propagating slow magnetoacoustic waves are prominent. The prominence of oscillations is determined through a visual inspection of time-distance maps constructed from multiple loop structures within each active region. It may be noted that these loop structures are the same as those studied by Krishna Prasad et al. (2018), where the periodicity of the oscillations observed, the temperature and density of the plasma within the loop structures, the polytropic index, among other parameters, are discussed. The temperature, in particular, was derived from the peak location in the corresponding differential emission measure (DEM) curve, which was extracted by employing a regularized inversion method (Hannah and Kontar, 2012) on the near-simultaneously observed intensities across all 6 SDO/AIA coronal channels. However, the main focus in the present study is on the damping characteristics of the oscillations. In order to study the damping properties of slow magnetoacoustic waves across the different loop structures selected, we estimate a characteristic damping length employing two independent methods, namely, a phase tracking method and an amplitude tracking method, as described in the following sections.
3.1. Phase Tracking Method
A temporal location (marked by a white-dashed line in Figure 1c), where the oscillation amplitude is relatively strong, is initially chosen to investigate the spatial variation of the oscillation phase. Note that the selection of this location is purely based on the strength of the oscillations as may be seen from Figure 1c. Same criterion is applied to all the other loop structures studied. The filtered intensities from three consecutive frames (i.e., ±12 s) around the selected temporal location are averaged to improve the signal-to-noise, then normalized by the corresponding background to construct a representative spatial intensity profile such as that shown in Figure 2A. The background is constructed from the intensities obtained by smoothing the original observed values to remove any oscillations with periodicities below 10 min. The spatial profile clearly demonstrates a rapid decrease in the oscillation amplitude with distance along the loop. The vertical bars indicate respective uncertainties in the imaging intensities that are estimated from noise contributions in the SDO/AIA 171 Å channel (following the methodology of Yuan and Nakariakov, 2012), which includes noise from various sources besides the dominant photon and readout components (Jess et al., 2019). An exponentially decaying sine wave function of the form,
is fitted to the spatial profile. Here, I is the normalized pixel intensity, x is the distance along the loop, B0 and B1 are appropriate constants, and A0, Ld, λ, and ϕ are the amplitude, damping length, wavelength and phase of the oscillation, respectively. Applying the Levenberg-Marquardt least-squares minimization technique (Markwardt, 2009), the best fitment to the data is shown as a black solid curve in Figure 2A. The damping length of the oscillation, as estimated from the fitted curve, is 3.7±0.4 Mm. The orange diamond symbols in Figure 2B display the damping lengths obtained from all 35 selected loop structures, plotted as a function of the corresponding localized temperature on a log-log scale. The vertical bars denote the respective uncertainties on damping length derived from the fit whereas the horizontal bars highlight the associated uncertainties on temperature propagated from the respective errors given by the regularized inversion method (Hannah and Kontar, 2012). Since the temperature is determined from a double-Gaussian fit to the individual DEMs (Krishna Prasad et al., 2018), the uncertainty on peak location is estimated by scaling the corresponding error on the nearest point by a factor of , where, N is the number of data points involved in the fit. Subsequently, to get a representative temperature value for each loop, a weighted mean across all spatio-temporal locations near the foot point is considered. The associated uncertainty is then estimated from the weighted standard deviation of values across the same locations. It may be noted that the uncertainties on loop temperature reported by Krishna Prasad et al. (2018) are fairly small compared to those shown here (Figure 2B) which is because the authors did not incorporate the temperature errors given by the DEM inversion method but simply quoted the errors obtained from the Gaussian fit alone. The actual temperature values might also marginally differ because of the weighted averages employed here. Another important aspect to note here is that in about 5 cases, the damping lengths are measured from pairs of loops from the same active region some of which exhibit distinct values. The differences in values obtained in such cases reflect the different physical conditions of the loop structures despite belonging to the same active region.
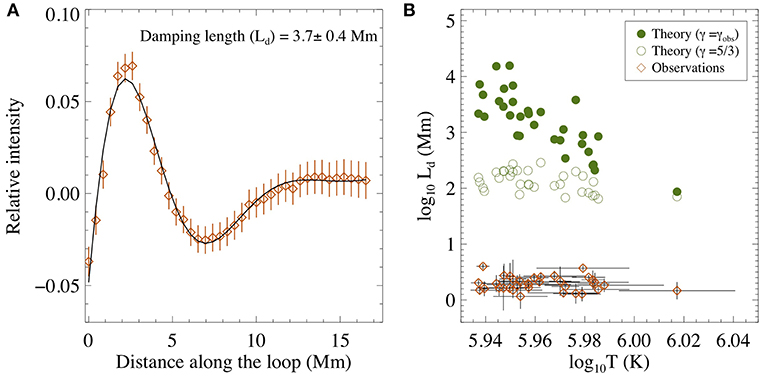
Figure 2. (A) Spatial variation of the relative intensity at the temporal location marked by the white dashed line in Figure 1c. The vertical bars denote the respective uncertainties. The solid curve represents the best fit to the data for an exponentially decaying sine wave model following Equation (1). The obtained damping length value from the fitted curve is listed in the upper-right corner of the plot. (B) Damping lengths extracted from all of the selected loop structures, plotted as a function of the localized temperature on a log-log scale. The orange diamonds represent the values obtained following the phase tracking method shown in (A), whereas the green circles represent the theoretical values estimated from damping due to thermal conduction. The open and filled circles, respectively, highlight the values computed from a constant γ (= 5/3) and those computed using γ values extracted from observations (Krishna Prasad et al., 2018). The vertical and horizontal bars on the observed values denote the corresponding propagated uncertainties.
3.2. Amplitude Tracking Method
Since the phase tracking method involves manually choosing a specific temporal location from each of the time-distance maps, it is possible that such human intervention naturally biases the obtained results. Also, it is not trivial to apply this technique to all temporal locations since the signal-to-noise at a large number of locations is low due to aspects of amplitude modulation. To circumvent this problem and verify the reliability of our results, we estimate the damping lengths using the alternative technique of amplitude tracking. In this method, the amplitude of the oscillation, A, at each spatial position is directly measured in relation to the standard deviation, σ, of the respective filtered time series using . This formula assumes that the observed oscillations can be represented by a pure sinusoidal signal. The time-averaged intensities from the original time series (i.e., collapsing the time domain in Figure 1b) are used as the background for normalization to obtain relative amplitudes as a function of distance along the loop. Since the amplitude at each spatial position is derived from the full time series, the median error on respective pixel intensities is used to estimate the corresponding uncertainty. The diamond symbols in Figure 3A show the spatial dependence of amplitude values thus obtained for the fan-like loop structure highlighted in Figure 1a. The vertical bars represent the associated uncertainties. These data were then fit with a decaying exponential model satisfying the functional form,
where x is the distance along the loop, A0 and C are appropriate constants, and Ld is the damping length.
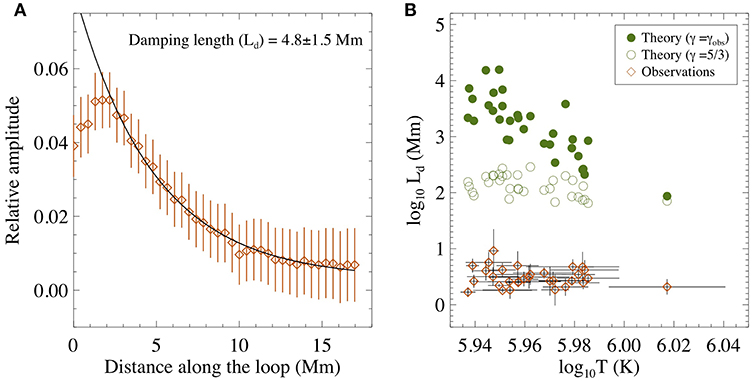
Figure 3. (A) Relative amplitudes of the oscillations as a function of distance along the loop segment marked by the solid blue lines in Figure 1a. The vertical bars denote the respective uncertainties. The black solid line represents an exponential fit to the decaying phase of the data following Equation (2). The obtained damping length value from the fitted curve is listed in the plot. (B) Damping lengths extracted from all the selected loop structures plotted as a function of the local temperature on a log-log scale. The orange diamonds represent the observational values following the amplitude tracking method shown in (A), whereas the green circles represent the theoretical values estimated from the damping due to thermal conduction. The open and filled circles, respectively, highlight the values computed from a constant γ (= 5/3) and those computed using γ values extracted from observations (Krishna Prasad et al., 2018). The vertical and horizontal bars on the observed values denote the corresponding uncertainties.
The initial few locations where the wave amplitude is found to increase are ignored in order to isolate the purely decaying phase of the oscillation for fitment. The black solid line in Figure 3A represents the best exponential fit obtained. The corresponding damping length is 4.8±1.5 Mm, which is on the same order as that obtained using the phase tracking method outlined in section 3.1. Following the same procedure, the damping lengths for the oscillations observed in all 35 selected loop structures have been estimated. For a handful of loop structures, it is found that the model does not converge properly, producing damping lengths either far greater than the loop length itself (> 1000 Mm) or far less than one pixel (< 0.1 Mm). Upon inspection of the time-distance maps corresponding to these individual cases, we found that there are unusual brightenings, perhaps in the form of transient events manifesting in the loop background, at certain spatio-temporal locations, which naturally contaminate the amplitude extraction process and thereby prevent a robust fitment of the data. While this could be avoided by manually restricting the time series for each particular case, the main strength of this method was in the alleviation of human intervention. As such, we chose to ignore specific loop structures where the model fitting did not converge to commonly expected values. The orange diamond symbols in Figure 3B represent the damping lengths obtained from the remaining 31 cases, plotted as a function of the loop temperature on a log-log scale. The vertical bars highlight the corresponding uncertainties on damping length whereas the horizontal bars denote the respective uncertainties on temperature. The loop temperature and the associated uncertainties are estimated in the same way as that described in section 3.1.
3.3. Theoretical Calculations
Theoretical and numerical calculations in the past have suggested that thermal conduction is the dominant physical mechanism responsible for the damping of slow magnetoacoustic waves in the solar corona (De Moortel and Hood, 2003; Klimchuk et al., 2004). Considering one-dimensional linear wave theory for slow magnetoacoustic waves with thermal conduction as the damping mechanism (e.g., De Moortel and Hood, 2003; Krishna Prasad et al., 2012b), the dispersion relation between the wave number, k, and the angular frequency, ω, can be shown to be,
Here, cs is the sound speed, is the thermal conduction parameter, is the parallel thermal conduction, and p0 = 2n0kBT0 is the gas pressure, where κ0 is the thermal conduction coefficient, T0 is the equilibrium temperature, and n0 is the number density. For propagating waves, the frequency, ω, is constant and in the limit of weak thermal conduction (i.e., when dω≪1), the solutions for wave number, k, may be found as , where is the damping length. The interested reader is referred to Mandal et al. (2016) for a detailed derivation.
As described in section 3, Krishna Prasad et al. (2018) studied the same set of loop structures that are presented here. They applied a regularized inversion method (Hannah and Kontar, 2012) on observed intensities in 6 coronal channels of SDO/AIA to compute corresponding DEM. Subsequently, by employing a double-Gaussian fit to the DEM curve, the temperature and the density of the plasma are calculated from the peak location and the area under the curve, respectively. The density is estimated by assuming the apparent width of the loop as equivalent to the emission depth along the line of sight effectively ignoring any background/foreground emission although a contribution to the latter from hot plasma is carefully discarded from the double-Gaussian fit. Using the theoretical relation between the relative oscillation amplitudes in temperature and density associated with a slow wave, the polytropic index of the plasma is determined after eliminating the corresponding phase shifts. The periodicity of the oscillations is also calculated through a simple Fourier analysis on the intensity fluctuations. Utilizing the respective values of these parameters computed by Krishna Prasad et al. (2018) for each loop, we estimate the expected damping lengths from the above theory.
The filled green circle symbols shown in Figures 2B, 3B represent the theoretically computed values. It may be noted that the respective dω values were found to reside in the interval 0.01−0.16, so the assumption of weak thermal conduction (i.e., dω≪1) is inherently valid across our range of coronal datasets. The classical Spitzer values for thermal conduction, following ergs cm−1 s−1 K−1, are employed in our calculations. As can be seen from the figures, the damping lengths are expected to be considerably shorter for hotter loops. Since it is very common to assume the polytropic index, γ, is equal to 5/3 in the solar corona, we additionally compute damping lengths arising from a constant (5/3) value for γ. The open green circles shown in Figures 2B, 3B represent these values which suggest a similar but much shallower dependence on temperature. Moreover, the damping lengths in this case are shorter by up to an order of magnitude or more which clearly divulges the effect of polytropic index on the damping length. It is worth noting here that the scatter in the theoretically computed damping lengths is mainly due to the different physical conditions of the loop structures studied.
4. Discussion and Concluding Remarks
The spatial damping characteristics of propagating slow magnetoacoustic waves, observed in 35 fan-like loop structures selected from 30 different active regions, have been studied. The damping length, in particular, is measured using two independent methods: a phase tracking method and an amplitude tracking method. Employing the temperature information acquired from DEM analysis, the temperature dependence of the damping length has been investigated for the first time (Figures 2B, 3B). These results do not indicate any apparent decrease in damping length with temperature as would be expected by the stronger thermal conduction in that case. It may be noted that the results from previous studies (e.g., Krishna Prasad et al., 2012b), who based their conclusions on the measurement of damping lengths for a single loop structure observed in multiple temperature channels, are inconsistent with the current findings. However, those studies are purely qualitative and the results are often based on just two temperature channels. Furthermore, the sensitivities of the measured damping lengths from the intensity perturbations to the filter/instrument used (e.g., Klimchuk et al., 2004) are also not taken into consideration in previous studies. In the present case, we employ damping length measurements from multiple loop structures observed in the same filter (SDO/AIA 171 Å). Hence, we naturally consider the current results more reliable due to the conservation of instrument characteristics across all independent measurements.
Utilizing the temperatures, densities, polytropic indices, and oscillation periods that have previously been derived for the same set of loop structures (Krishna Prasad et al., 2018), we calculated the theoretical damping lengths expected from the dissipation due to thermal conduction. In contrast to the observations, the theoretical calculations show a steep decrease in the damping length with temperature. Damping lengths were also computed assuming a fixed value, 5/3, for the polytropic index, in line with the previous studies. These values display a similar but shallower dependence. The discrepancy between the observational and theoretical dependences perhaps indicates that thermal conduction is suppressed in hotter loop structures. In fact, the increase in the polytropic indices of these loops with temperature, as reported by Krishna Prasad et al. (2018), also implies the suppression of thermal conduction in hotter loops (e.g., in accordance with Wang et al., 2015), although a direct conclusion could not be drawn from these results alone since the polytropic index of the coronal plasma is dependent on several other physical processes besides thermal conduction. The current results, on the other hand, appear to show direct evidence for the suppression of thermal conduction with increasing temperature.
Alternatively, one could argue that thermal conduction is perhaps not the dominant damping mechanism for slow magnetoacoustic waves, as previously reported by Marsh et al. (2011) and Wang et al. (2015). Indeed, as can be seen from Figures 2B, 3B, the theoretical damping lengths are 2−3 orders of magnitude higher than those obtained from the observations. One may also note that a simple visual inspection of oscillation amplitudes, in Figures 1b,c for example, reveals significant damping within 10 Mm scales whereas the expected damping lengths due to thermal conduction are at least 100 Mm or more which clearly demonstrates the extent of mismatch between the observations and the theory. The differences in the temperature dependence would further add to this discrepancy. We note, however, that the incongruity between the theory and observations is less if we consider the calculations for γ = 5/3. Also, the distances measured along the observed loop structures are projected onto the image plane, meaning the obtained damping lengths are only lower limits. Nevertheless, the difference between the theoretical and the observed scales is too large to ignore, and would not likely be accounted for even if a fractional contribution from the other damping mechanisms (e.g., compressive viscosity and optically thin radiation) is included.
Lastly, we would like to bring out some of the major caveats of our results. The temperature range of the loops investigated is limited especially considering the large uncertainties on temperature. While the magnitude of change in the expected damping lengths over the same temperature range and the extent of mismatch between the observed and theoretical values still make our results valid, it is imperative to state that a larger temperature range would make the results more reliable. Additionally, it should be noted that different DEM inversion methods can result in different peak temperatures although the difference can be marginal depending on the temperature range investigated. Also, it can be argued whether the peak emission in a DEM sufficiently represents the plasma within the loop. Keeping these limitations in mind, we believe further investigations, both theoretical and observational, are necessary to understand the damping of slow magnetoacoustic waves in the solar corona. In particular, the impetus is on increasing the temperature range studied to include hotter loop structures to examine whether these traits are consistent across the full spectrum of coronal magnetism.
Data Availability
The data analyzed in this study was obtained by the Atmospheric Imaging Assembly onboard NASA's Solar Dynamics Observatory. The data are not restricted, and requests to access these datasets should be directed to the Joint Science Operations Center (http://jsoc.stanford.edu/ajax/lookdata.html).
Author Contributions
SK and DJ planned and designed the study. SK processed the data, performed the analysis and wrote the first draft of the manuscript. TV assisted in theoretical calculations. DJ and TV contributed to the interpretation of the results. All authors took part in the manuscript revision, read and approved the submitted version.
Funding
The authors gratefully acknowledge the financial support from the following research grants: STFC—ST/K004220/1, ST/L002744/1, ST/R000891/1, Randox Laboratories Ltd.—059RDEN-1, European Research Council (ERC)—724326, and KU Leuven—GOA-2015-014.
Conflict of Interest Statement
The authors declare that the research was conducted in the absence of any commercial or financial relationships that could be construed as a potential conflict of interest.
Acknowledgments
The authors thank all the referees for their valuable comments/suggestions. SK would like to thank the UK Science and Technology Facilities Council (STFC) for support. DJ gratefully acknowledges STFC for the award of an Ernest Rutherford Fellowship, in addition to Invest NI and Randox Laboratories Ltd. for the award of a Research & Development Grant (059RDEN-1). This project has received funding from the European Research Council (ERC) under the European Union's Horizon 2020 research and innovation programme and KU Leuven. The SDO/AIA imaging data employed in this work are courtesy of NASA/SDO and the AIA science team. We acknowledge the use of pipeline developed by Rob Rutten to extract, process, and co-align AIA cutout data.
Footnotes
References
Banerjee, D., and Krishna Prasad, S. (2016). “MHD waves in coronal holes,” in Low-Frequency Waves in Space Plasmas, eds A. Keiling, D.-H. Lee, and V. Nakariakov, 419–430. doi: 10.1002/9781119055006.ch24
Berghmans, D., and Clette, F. (1999). Active region EUV transient brightenings - First Results by EIT of SOHO JOP80. Solar Phys. 186, 207–229.
Cally, P. S., Bogdan, T. J., and Zweibel, E. G. (1994). Umbral oscillations in sunspots: absorption of p-modes and active region heating by mode conversion. Astrophys. J. 437, 505–521. doi: 10.1086/175014
Culhane, J. L., Harra, L. K., James, A. M., Al-Janabi, K., Bradley, L. J., Chaudry, R. A., et al. (2007). The EUV imaging spectrometer for Hinode. Solar Phys. 243, 19–61. doi: 10.1007/s01007-007-0293-1
De Moortel, I. (2009). Longitudinal Waves in Coronal Loops. Space Sci. Rev. 149, 65–81. doi: 10.1007/s11214-009-9526-5
De Moortel, I., and Hood, A. W. (2003). The damping of slow MHD waves in solar coronal magnetic fields. Astron. Astrophys. 408, 755–765. doi: 10.1051/0004-6361:20030984
De Moortel, I., and Hood, A. W. (2004). The damping of slow MHD waves in solar coronal magnetic fields. II. The effect of gravitational stratification and field line divergence. Astron. Astrophys. 415, 705–715. doi: 10.1051/0004-6361:20034233
De Moortel, I., Ireland, J., and Walsh, R. W. (2000). Observation of oscillations in coronal loops. Astron. Astrophys. 355, L23–L26. Available online at: https://ui.adsabs.harvard.edu/abs/2000A%26A…355L.23D/abstract
De Pontieu, B., Erdélyi, R., and De Moortel, I. (2005). How to channel photospheric oscillations into the corona. Astrophys. J. Lett. 624, L61–L64. doi: 10.1086/430345
Deforest, C. E., and Gurman, J. B. (1998). Observation of quasi-periodic compressive waves in solar polar plumes. Astrophys. J. Lett. 501:L217. doi: 10.1086/311460
Erdélyi, R. (2006). “Magnetic seismology of the lower solar atmosphere,” in Proceedings of SOHO 18/GONG 2006/HELAS I, Beyond the Spherical Sun, Vol. 624 (Noordwijk: ESA Special Publication), 15.1
Hannah, I. G., and Kontar, E. P. (2012). Differential emission measures from the regularized inversion of Hinode and SDO data. Astron. Astrophys. 539:A146. doi: 10.1051/0004-6361/201117576
Jess, D. B., De Moortel, I., Mathioudakis, M., Christian, D. J., Reardon, K. P., Keys, P. H., et al. (2012). The source of 3 minute magnetoacoustic oscillations in coronal fans. Astrophys. J. 757:160. doi: 10.1088/0004-637X/757/2/160
Jess, D. B., Dillon, C. J., Kirk, M. S., Reale, F., Mathioudakis, M., Grant, S. D. T., et al. (2019). Statistical signatures of nanoflare activity. I. Monte Carlo simulations and parameter-space exploration. Astrophys. J. 871:133. doi: 10.3847/1538-4357/aaf8ae
Khomenko, E., Centeno, R., Collados, M., and Trujillo Bueno, J. (2008). Channeling 5 minute photospheric oscillations into the solar outer atmosphere through small-scale vertical magnetic flux tubes. Astrophys. J. Lett. 676:L85. doi: 10.1086/587057
Kiddie, G., De Moortel, I., Del Zanna, G., McIntosh, S. W., and Whittaker, I. (2012). Propagating disturbances in coronal loops: a detailed analysis of propagation speeds. Solar Phys. 279, 427–452. doi: 10.1007/s11207-012-0042-5
Klimchuk, J. A., Tanner, S. E. M., and De Moortel, I. (2004). Coronal seismology and the propagation of acoustic waves along coronal loops. Astrophys. J. 616, 1232–1241. doi: 10.1086/425122
Krishna Prasad, S., Banerjee, D., and Singh, J. (2012a). Oscillations in active region fan loops: observations from EIS/ hinode and AIA/SDO. Solar Phys. 281, 67–85. doi: 10.1007/s11207-012-0098-2
Krishna Prasad, S., Banerjee, D., and Van Doorsselaere, T. (2014). Frequency-dependent damping in propagating slow magneto-acoustic waves. Astrophys. J. 789:118. doi: 10.1088/0004-637X/789/2/118
Krishna Prasad, S., Banerjee, D., Van Doorsselaere, T., and Singh, J. (2012b). Omnipresent long-period intensity oscillations in open coronal structures. Astron. Astrophys. 546:A50. doi: 10.1051/0004-6361/201219885
Krishna Prasad, S., Jess, D. B., and Khomenko, E. (2015). On the source of propagating slow magnetoacoustic waves in sunspots. Astrophys. J. Lett. 812:L15. doi: 10.1088/2041-8205/812/1/L15
Krishna Prasad, S., Jess, D. B., Van Doorsselaere, T., Verth, G., Morton, R. J., Fedun, V., et al. (2017). The frequency-dependent Damping of Slow Magnetoacoustic Waves in a Sunspot Umbral Atmosphere. Astrophys. J. 847:5. doi: 10.3847/1538-4357/aa86b5
Krishna Prasad, S., Raes, J. O., Van Doorsselaere, T., Magyar, N., and Jess, D. B. (2018). The polytropic index of solar coronal plasma in sunspot fan loops and its temperature dependence. Astrophys. J. 868:149. doi: 10.3847/1538-4357/aae9f5
Lemen, J. R., Title, A. M., Akin, D. J., Boerner, P. F., Chou, C., Drake, J. F., et al. (2012). The atmospheric imaging assembly (AIA) on the solar dynamics observatory (SDO). Solar Phys. 275, 17–40. doi: 10.1007/s11207-011-9776-8
Mandal, S., Magyar, N., Yuan, D., Van Doorsselaere, T., and Banerjee, D. (2016). Forward modeling of propagating slow waves in coronal loops and their frequency-dependent damping. Astrophys. J. 820:13. doi: 10.3847/0004-637X/820/1/13
Markwardt, C. B. (2009). “Non-linear least-squares fitting in IDL with MPFIT,” in Astronomical Data Analysis Software and Systems XVIII, Astronomical Society of the Pacific Conference Series, Vol. 411, eds D. A. Bohlender, D. Durand, and P. Dowler (Quebec City, QC), 251.
Marsh, M. S., De Moortel, I., and Walsh, R. W. (2011). Observed damping of the slow magnetoacoustic mode. Astrophys. J. 734:81. doi: 10.1088/0004-637X/734/2/81
Ofman, L., Romoli, M., Poletto, G., Noci, G., and Kohl, J. L. (1997). Ultraviolet coronagraph spectrometer observations of density fluctuations in the solar wind. Astrophys. J. Lett. 491:L111. doi: 10.1086/311067
Pesnell, W. D., Thompson, B. J., and Chamberlin, P. C. (2012). The solar dynamics observatory (SDO). Solar Phys. 275, 3–15. doi: 10.1007/s11207-011-9841-3
Spruit, H. C. (1991). “Absorption of p-mode waves by magnetic fields. in Challenges to Theories of the Structure of Moderate-Mass Stars, Lecture Notes in Physics, Vol. 388, eds D. Gough and J. Toomre (Berlin: Springer Verlag), 121–134.
Van Doorsselaere, T., Wardle, N., Del Zanna, G., Jansari, K., Verwichte, E., and Nakariakov, V. M. (2011). The first measurement of the adiabatic index in the solar corona using time-dependent spectroscopy of hinode/EIS observations. Astrophys. J. Lett. 727:L32. doi: 10.1088/2041-8205/727/2/L32
Wang, T. (2011). Standing slow-mode waves in hot coronal loops: observations, modeling, and coronal seismology. Space Sci. Rev. 158, 397–419. doi: 10.1007/s11214-010-9716-1
Wang, T., Ofman, L., Sun, X., Provornikova, E., and Davila, J. M. (2015). Evidence of thermal conduction suppression in a solar flaring loop by coronal seismology of slow-mode waves. Astrophys. J. Lett. 811:L13. doi: 10.1088/2041-8205/811/1/L13
Wang, T., Ofman, L., Sun, X., Solanki, S. K., and Davila, J. M. (2018). Effect of transport coefficients on excitation of flare-induced standing slow-mode waves in coronal loops. Astrophys. J. 860:107. doi: 10.3847/1538-4357/aac38a
Wuelser, J.-P., Lemen, J. R., Tarbell, T. D., Wolfson, C. J., Cannon, J. C., Carpenter, B. A., et al. (2004). “EUVI: the STEREO-SECCHI extreme ultraviolet imager,” in Proceedings of the SPIE Telescopes and Instrumentation for Solar Astrophysics, Vol. 5171, eds S. Fineschi and M. A. Gummin, 111–122. doi: 10.1117/12.506877
Yuan, D., and Nakariakov, V. M. (2012). Measuring the apparent phase speed of propagating EUV disturbances. Astron. Astrophys. 543:A9. doi: 10.1051/0004-6361/201218848
Keywords: magnetohydrodynamics (MHD), methods: observational, sun: atmosphere, sun: corona, sun: oscillations
Citation: Krishna Prasad S, Jess DB and Van Doorsselaere T (2019) The Temperature-Dependent Damping of Propagating Slow Magnetoacoustic Waves. Front. Astron. Space Sci. 6:57. doi: 10.3389/fspas.2019.00057
Received: 27 February 2019; Accepted: 29 July 2019;
Published: 13 August 2019.
Edited by:
Alina Catalina Donea, Monash University, AustraliaReviewed by:
Keiji Hayashi, Northwest Research Associates, United StatesRui Liu, University of Science and Technology of China, China
Sergey Anfinogentov, Institute of Solar-Terrestrial Physics (RAS), Russia
Copyright © 2019 Krishna Prasad, Jess and Van Doorsselaere. This is an open-access article distributed under the terms of the Creative Commons Attribution License (CC BY). The use, distribution or reproduction in other forums is permitted, provided the original author(s) and the copyright owner(s) are credited and that the original publication in this journal is cited, in accordance with accepted academic practice. No use, distribution or reproduction is permitted which does not comply with these terms.
*Correspondence: S. Krishna Prasad, a3Jpc2huYS5wcmFzYWRAcXViLmFjLnVr