 Li Lu
Li Lu Qing-Long Yu
 Qi Lu
Qi Lu- Laboratory of Space Environment Exploration, National Space Science Center of the Chinese Academy of Sciences, Beijing, China
We simulate a 2-D ENA coded modulation imager on board a polar orbit satellite. An imaging measurement, which can realize continuous monitoring of low-altitude ENA emission sources, is applied to the evolution process of energetic ion events. The present simulation results show that: (1) Low earth polar orbit satellites can approach ENA emission sources from inside and outside the inner radiation belt. At low altitude, ENA images can be collected with a time resolution of only 5 s, enabling for the first time observation of the evolution process of energetic ion events, on top of determining a global distribution pattern of energetic ions; (2) For tracing energetic particle trigger source of substorm, the propagation distance of energetic particles can be calculated by using time difference of ENA energy spectrum response of different energy channels; (3) Due to the proximity of the ENA emission source, the ENA imager will respond to medium and small-magnitude signals of substorms, which will help sample continuous collection and statistical analysis of massive data under various geomagnetic activities, and provide important data support for space weather forecasts.
Introduction
Energetic ions (from tens to hundreds of KeV) are the main carriers of energy transport during high levels of geomagnetic activity, and most of the energetic ions gather in the ring current area. The disturbances in the solar wind and magnetotail can cause remarkable temporal and spatial variations of ring current ions (Fok et al., 2001; Cao et al., 2011; Zhang et al., 2015; Yu et al., 2017). Therefore, real-time monitoring of the ion flux distribution in the ring current area is an effective way to study geomagnetic activity. The transport process of ring current ions during strong geomagnetic activity is controversial and inconclusive due to the lack of effective measurements. NASA's TWINS mission was designed to address this issue (McComas et al., 2009).
Previous space explorations have been affected by the uncertainty of spatial or temporal changes of measurements, so it is difficult to draw a clear conclusion. Recently, the 2D telemetry function of the ENA imager has solved the above problems. However, considering the time scale of geomagnetic activity, the temporal and spatial resolution under certain statistical requirements becomes the main obstacle to the function of the instrument. In other words, the ENA imaging measurement can only obtain the global distribution pattern of energetic ions currently (Brandt et al., 2002a,b; DeMajistre et al., 2004; Perez et al., 2004).
The TC-2 satellite of DSP is in a polar orbit of 560 × 38,000 km altitude (Liu et al., 2005a,b) and carries an ENA imager NUADU (McKenna-Lawlor et al., 2004, 2005). The perigee measurements of NUADU on board TC-2 on November 12, 2004, show that the close-up imaging of low-altitude ENA emission sources can greatly improve the temporal and spatial resolutions of ENA imaging (Lu et al., 2019). Therefore, the near-Earth polar orbit satellites can be used to realize real-time monitoring of ring current energetic ions during geomagnetic activities with high spatial and temporal resolution. In the present work, we attempt to apply this imaging measurement to the evolution process of energetic ion events (Lu et al., 2016, 2019). The main scientific objective of this work is to use the ENA imager on a polar orbit satellite to monitor the distribution and evolution of energetic particles in the inner and outer radiation belts, especially for small-substorm events; serving space weather forecasting with mass data statistics; to explore the causality of energetic ion precipitation, injection, and other transport processes, as well as the electromagnetic field environmental evolution.
Low-Altitude ENA Emissions
The first ENA map was detected by ISEE-1/ MEPI (Roelof, 1987); the main conclusion of the work is that the neutral atom distribution reflects the ion distribution information of the ring current. Roelof (1987) repeatedly adjusted the ion flux distribution in the equatorial ring current region to simulate the ENA distribution which is similar to the detected results. According to the Earth contour and characteristic magnetic field lines projection in his simulated map, it can be found that the ENA flux maximum is near the high-latitude polar region. Brandt et al. (2001) reported an actual ENA imaging at low altitudes by the Swedish micro-satellite Astrid and extracted the equatorial ion distribution from this measurement. Goldstein et al. (2016) formulated an analytical model for ENA emissivity that partially corrects for the global viewing geometry dependence of low-altitude emissions observed by TWINS (McComas et al., 2009).
Based on TC-2 /NUADU's ENA measurements on November 7, 2004, and inversion of ion flux distribution, a set of 3-D maps of ENA emission source in different magnetic shells was derived (Lu et al., 2008b). The maps reveal that the ENA emission source is located in the low altitude polar region.
On November 6, 2006, STEREO/STE also collected ENA images near perigee on the night side of Earth at altitudes between 510 and 840 km (L < 1.15) during a small substorm (Dst −8 nt; AE 200 nt) (Wang et al., 2010).
Therefore, the location of ENA emission source is jointly determined by the energetic ion distribution in the radiation belt and the low-energy neutral atom density evaporated from the exosphere involved in ionic charge exchange, and it is not located in the equatorial ring current region where the energetic ion flux is the largest. In other words, the detected ENA image of the ENA imager contains the spatial distribution information of both the ring current energetic ions and the exosphere low-energy neutral atoms.
Low Altitude ENA Emission Simulation Model
Simulated Orbit Design
An elliptical polar orbit with a 1,500 km apogee, a 500 km perigee, and 90° inclination is assumed. A 2-D ENA imager on board this polar orbit satellite is shown in Figure 1. The instrument space angular resolution is 6° x 6°, and the FOV of the instrument can be designed by 4π solid Angle simulation.
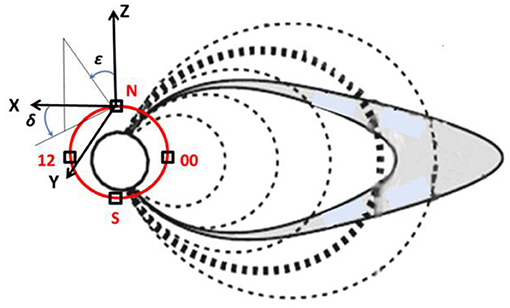
Figure 1. Schematic diagram of polar orbit simulation test. The red curve in the figure is the polar orbit, and the black box is marked as telemetry simulation positions.
Simulation Equation
The simulation equation can be written as
where (δ, ε) is the counts recorded in each pixel of an ENA image with elevation δ and azimuth ε, ΔE is the energy range within, ΔT is the integration time for each pixel, ΔΩ is the solid angle of the volume element pointing to the pixel, jion is ion differential flux of the Integral volume element (see below), A(δ, ε) is the response function of the detector (Lu et al., 2014), σ(E) is the charge exchange cross sections (Smith and Bewtra, 1987), n (r, φ, θ) is the exospheric neutral atomic density, where r, φ, and θ are the geocentric distance, magnetic longitude, and latitude, respectively (see below), and dV is the volume element integral along the line of sight of the detector.
Ring Current Ion Flux
The ion flux in the ring current region is written in the following form (Lu et al., 2008a):
with e = (1 + 1/κ)κ+1 ≈ 2.962 (κ = 5.5) and h(φ) = exp[−ξ(1 − cos(φ − φs))]
where φs = 180° and ξ = 0.75 are for azimuth asymmetry of ring current ion flux, θ is the magnetic latitude, L is the magnetic shell index, φ is the magnetic longitude, E is the proton's energy, E0 (7 KeV) is the typical ion-energy of the maximum ion-flux, and L0= 7.3 is the outer boundary of the ion injection region of the ring current (RC). The pitch angle (α) of the particles within the volume element is expressed in terms of θ and αeq (equatorial pitch angle) by
Density of Exospheric Neutral Atoms
The ENA imager has a minimum energy channel of more than 10 keV, so it cannot directly record the neutral atom evaporated from the exosphere. The ENA map recorded by the ENA imager is the energetic neutral atom produced after the charge exchange of neutral atom evaporated from the exosphere and energetic ions precipitated from the ring current region. On the other hand, the neutral hydrogen densities provided by Chamberlain's model (Rairden et al., 1986) are too low to be applicable in the ring current region. However, if conservation of the radial flux of neutral atoms during a major geomagnetic storm is assumed, we introduce an additional term to the Chamberlain model so that the density can be represented by
where r is the geocentric distance in RE with a0 = 1.78, RE representing the height of the exosphere, while n0 = 1600 cm−3 is the neutral density constant. This model is better fitted by the yearly average of hydrogen density measured around solar maximum (Tinsley et al., 1986) and should also be suitable in a major storm period.
ENA Imaging Simulations in a Low Earth Polar Orbit
ENA Image Simulations for Protons
The orbit of the polar satellite is shown in Figure 2 (red ellipse). The blue dots and labels mark the four characteristic positions of the simulation, and the north and south poles and magnetic local time are also marked with red characters in the figure.
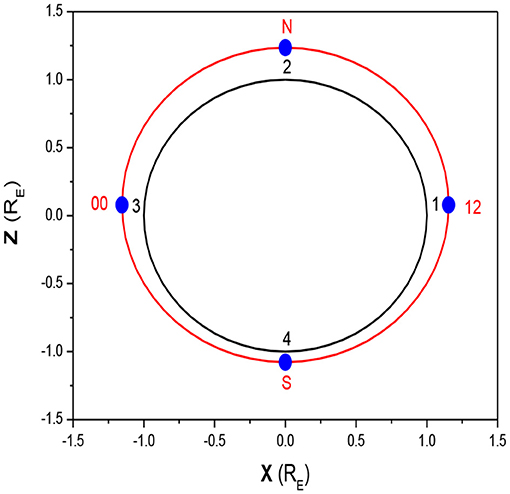
Figure 2. Polar orbit in the x-z plane.
The energy spectrum width of proton (H+) is set in the 10–30 keV range and the equatorial ion flux is: JH = 8 × 105 cm−2 s−1 sr−1 kev−1. The distribution of ion fluxes in the equatorial plane is shown in Figure 3.
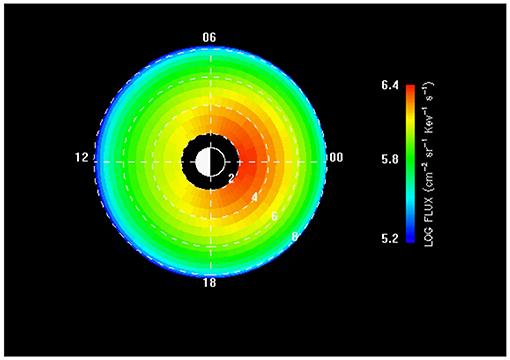
Figure 3. Ion flux distribution on the equatorial plane.
By simulation, the 1-min integral 2-D ENA image at four different positions on the orbit (Table 1) was obtained, as shown in Figure 4.
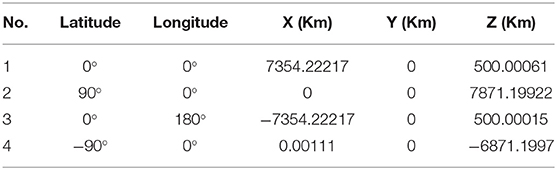
Table 1. Parameters of 4 simulation positions.
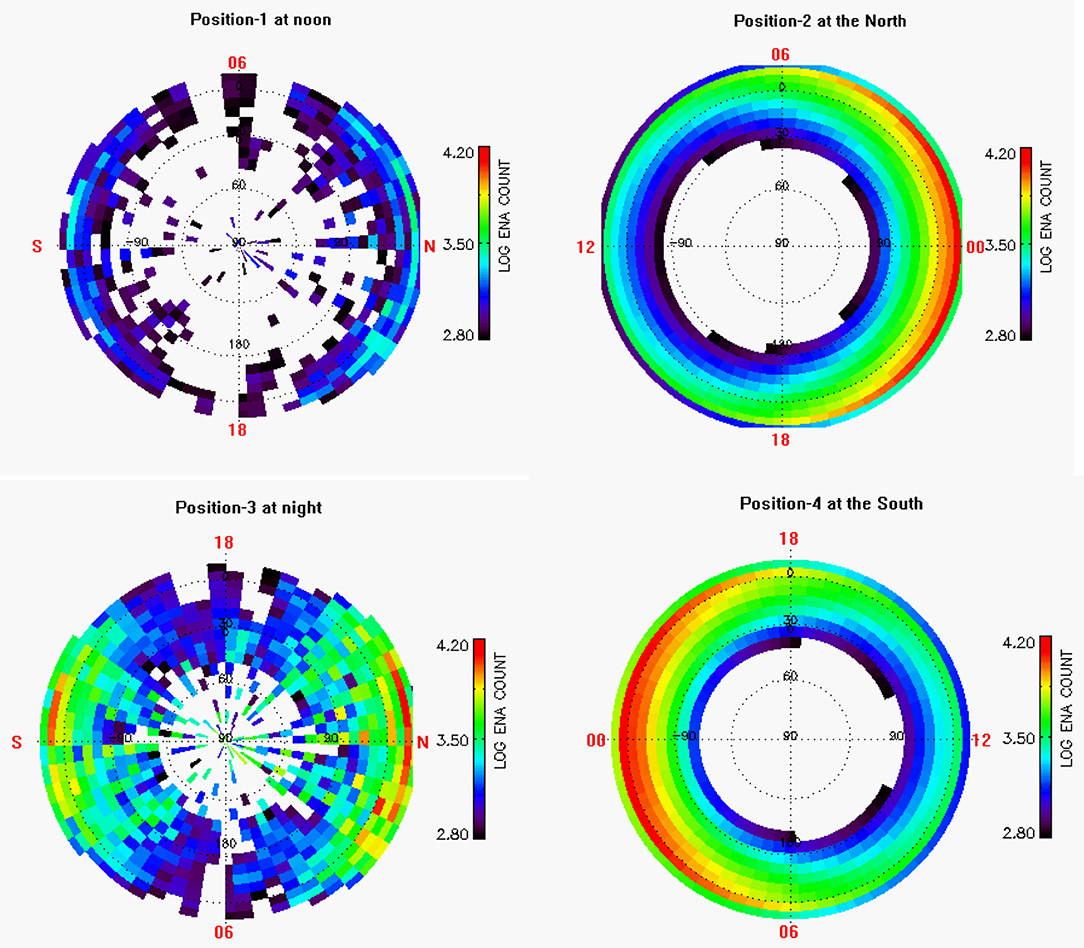
Figure 4. ENA images for 1 min integration time, 10–30 KeV.
The polar angle of 90° (center of the circle in each plane in Figure 4) is oriented toward the sky. Local time, north and south poles, are marked with red characters on each plane. The simulation model adopts pixel settings of 6° × 6°. In order to compare the intensity of ENA counts at different locations, the same logarithmic color scale was used for the simulation of the four positions.
The simulation results of position 1 (top left of Figure 4) and 3 (bottom left of Figure 4) show that the satellite can realize the north-south conjugate observation near the equator inside the inner radiation belt. The ENA flux signals generated by the radiation belt in the north and south hemispheres are labeled with red letters S and N, respectively. Because the Z coordinate of the characteristic position is 500 km north (see Table 1), ENA emission counts from the northern hemisphere (red N) of positions 1 and 3 is larger than that from the southern hemisphere (red S) in Figure 4. FOV range of outer radiation belt is −12° < θ < 42° and 0° < ϕ < 360°. The polar Angle (θ) from 42° to 90° Faces to the inner radiation belt. Since the model does not include the inner radiation belt, the ENA simulation map draws the boundary between the inner and outer radiation belts.
Location of the ENA Emission Source
Due to the north-south symmetry of positions 2 and 4 in Figure 4, we projected position 4 into the northern hemisphere and calculated the center location of ENA emission sources by using the parallax between the two simulated ENA images. At position 2 (apogee at the North Pole, altitude: 1,500 km), the ENA maximum counts is located at polar angles between −12° and −18°, with a center at −15°. At position 4 (perigee at the South Pole, altitude: 500 km), the ENA maximum counts is located at polar angles between 0° and−6°, with a center at −3°. Hence, the latitude and altitude of the center of the ENA maximum emission source can be calculated with Equation (5); see Figure 5A.
Obviously, the ENA maximum emission center is located at an altitude of 1,719.3 km and latitude of 55°.
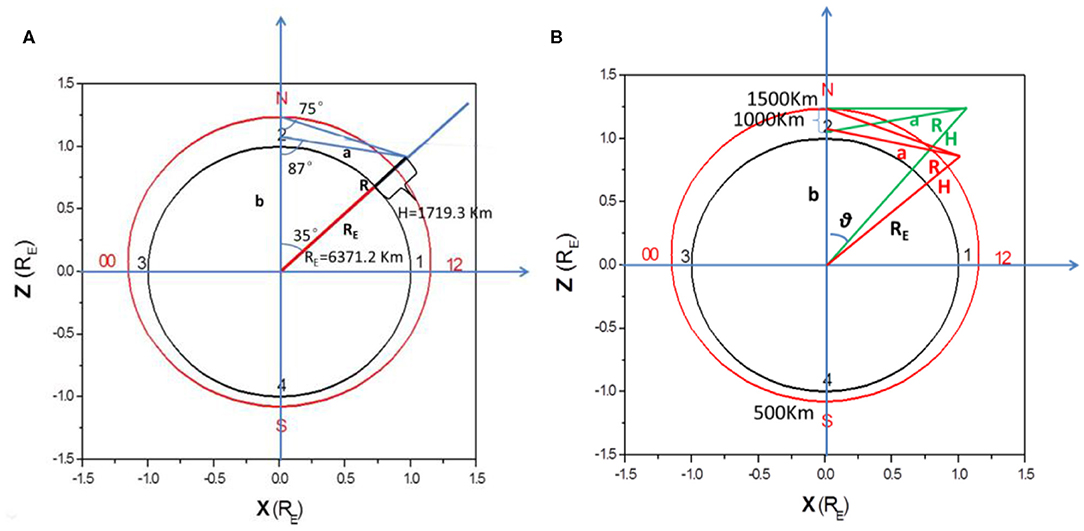
Figure 5. Calculation schematic diagram of ENA radiation maxima center (A) and distribution range (B).
In a similar way, the distribution range of the ENA emission source is calculated by 3 polar-angle pixels (18°), as shown in Figure 5B.
The low-altitude ENA emission source is located between 1,500 and 2,800 km altitude, and 54°-60° latitude range.
Simulation of the Minimum Temporal Resolution for ENA Image Measurement
Under the same conditions as above, the 5-s integration ENA maps are shown in Figure 6. We can see that the ENA counts have reached 3 digits, which basically meets the statistical requirements of data inversion.
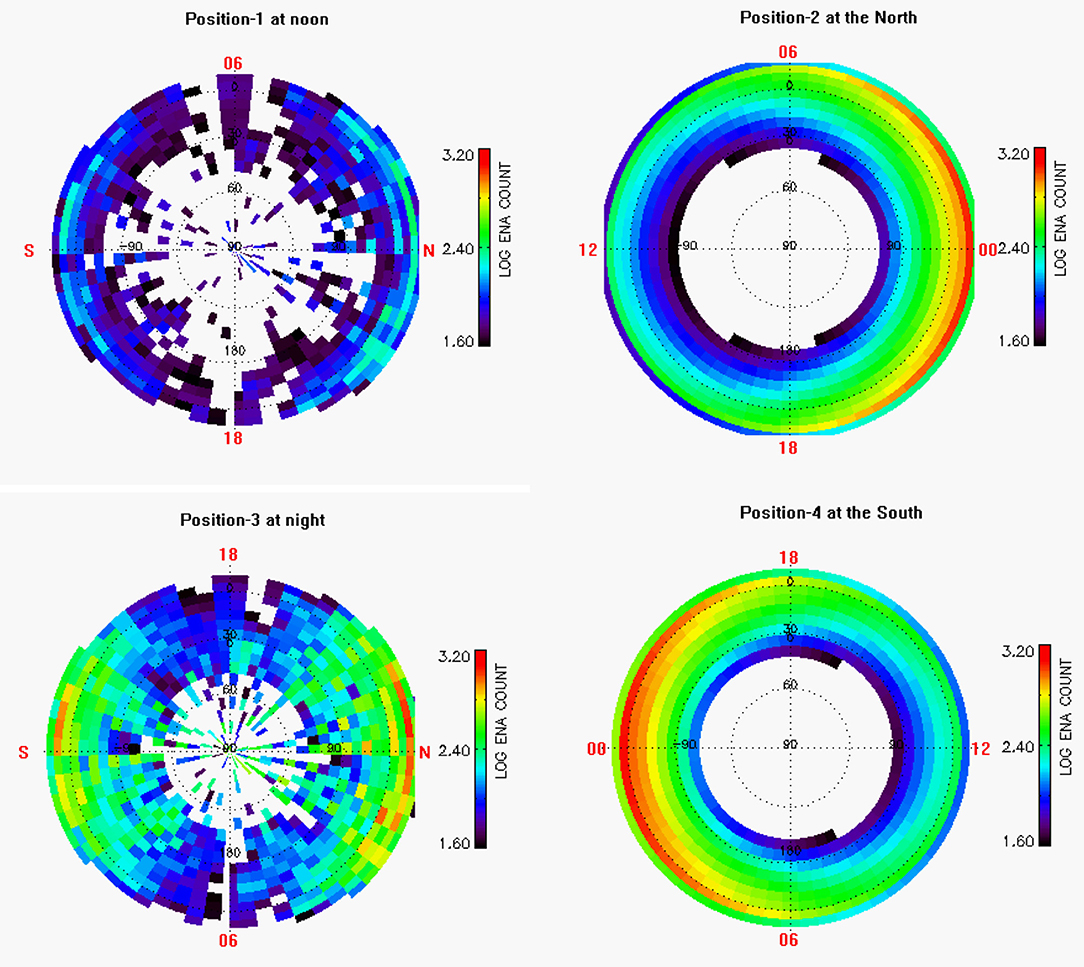
Figure 6. ENA images for 5 s integral, 10~30 KeV.
The Energetic Particle Distribution and Emission Tracking in Radiation Belts
The inner radiation belt is relatively close to the ground, on average located between 1.2RE to 2RE, with a central location about 1.5RE away from the center of the earth. It is mainly composed of high-energy protons (10–100 MeV), energetic protons (in keV order), electrons, and a small amount of tritium and helium. The energetic proton flux can reach 105/ (cm2s), mainly from galactic cosmic rays (Wang, 2003). Unlike the outer radiation belt, the inner radiation belt is closer to the Earth. Energetic ions and neutral atoms evaporated from the exosphere can directly exchange charges in the region where energetic ions are distributed. This means that the ENA images acquired from the direction of the inner radiation belt may directly reflect the configuration of the energetic ion distribution in the inner radiation belt.
The outer radiation belt is far from the ground, its distribution ranges from 2.6 to 6 Re, and the center is located between 3 and 4 Re. Its main component is energetic electrons (e.g., Fu et al., 2012), and the maximum energetic ion (5–300 kev) flux can also reach about 109/(cm2 s) during magnetic storms. These energetic electrons and ions are generally believed to be injected from the magnetotail (Fu et al., 2011) or be accelerated magnetospheric plasmas.
The present ENA images simulation of a polar satellite shows that the exploration range of the orbital above ±60° latitude is focused on the low-altitude ENA emission source generated by the energetic ions precipitated from the ring current. This exploration segment, about 1/3 of the satellite's orbit, allows the acquisition of high spatio-temporal resolution ENA images (top right and bottom right of Figures 4, 6) used to extract ring current ion flux distributions. The satellite's orbital period between ±54° latitude, accounting for about 2/3 of the satellite's orbit, is located inside the inner radiation belt. The instrument can thus monitor both the inner and outer radiation belts and achieve conjugated imaging detection of the northern and southern hemispheres (as shown in top left and bottom left of Figures 4, 6). This type of orbit provides the opportunity to traverse the edge of the inner radiation belt over the south Atlantic anomaly zone and to conduct in-situ particle measurement of the radiation environment in the south Atlantic anomaly zone.
We note that the ENA signals recorded by the ENA imager are always associated with geomagnetic activity. This event characteristics of ENA images can be used to trace the energetic particles trigger source. The present 2-D coding modulation imager improves the time resolution of recording a single ENA event, Pi (t, x, y, E), to less than 1 ms. Different energy ions transport at different speeds. For the same transport distance, the shorter the transport time, the higher the energy (see Table 2). According to the response time difference of energy spectrum curves of different energy channels, the emission source location of energetic ions can be inferred: the less the time difference of energy spectrum response is, the shorter the transport distance of energetic ions causing charge exchange is. It is generally believed that there are two possible sources of energetic ions: one is the entry of energetic ions directly from the solar wind in the polar cusps, and the other is the precipitating energetic ions accelerated along the magnetic field line from the magnetotail. The time difference of ENA spectrum generated above can be calculated according to different propagation distances. For 1RE propagation distance, the response time difference of 10 and 100 keV protons is about 3.16 s. However, the response time difference between 100 keV and 1 MeV protons at 1RE is only about 1 s. This problem had not been solved before due to the poor temporal resolution of the ENA images. The present 2-D coding modulation imager allows collection of ENA from remote sources as well as in situ. This provides a new technique for tracking energetic ions that produce ENA emission intensification during geomagnetic activity intensification.
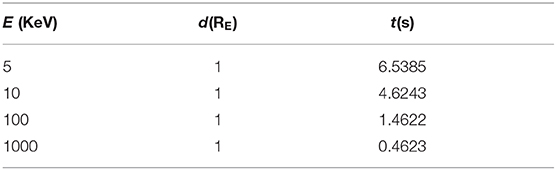
Table 2. Time and distance for different energy of hydrogen atoms.
Conclusions
The neutral atom imaging packet contains real-time information about the spatial distribution of ring current ions (Roelof, 1987). The present simulation shows that the temporal resolution of ENA imaging measurements can be as low as 5 s on a 1,500 km × 500 km polar orbit, compare to the 1 to 10 min time resolution of actual and past measurements, i.e., about 10 to 100 times better. Therefore, ENA imaging measurement is an effective means to monitor geomagnetic activity, especially in the ring current region.
There are two ways to improve the temporal and spatial resolution of ENA imager. One is to improve the performance of the basic ENA imager itself, which might be difficult and expensive. The other is to design the spacecraft orbit in order to perform measurements close to the ENA emission sources. Of the two, the latter is more practical than the former.
Generally, the sense of distance can come from parallax, or time difference. We use parallax concepts to identify the location of ENA sources and time differences concepts to trace the location of energetic particles triggered by a substorm.
Those improved temporal and spatial resolutions could enable monitoring not only the global energetic ion flux distribution but also to obtain the causal sequence analysis of the transport process of energetic ions during periods of high geomagnetic activity period (Lu et al., 2016).
Due to its proximity to the ENA source, the ENA imager will respond to moderate or even lower intensity substorms. This will lead to a unique set of data collected under various geomagnetic activities that could improve space weather forecasts.
It is generally believed that the inner radiation belt is relatively stable, and the source of particles mainly comes from cosmic rays and solar proton events. In this region, the loss of particles is mainly due to particle collisions, curvature scattering by magnetic field lines, and the interaction of high-energy protons with inner radiation belt fluctuations. Recent studies have found that there is a one-to-one correspondence between the changes of high-energy proton flux in the inner radiation belt and the Dst index of magnetic storms (Chen et al., 2016; Li et al., 2017). Therefore, monitoring the evolution of high-energy proton flux in the inner radiation belt during magnetic storms can provide us more insights into the physical processes at stake.
Data Availability Statement
The datasets generated for this study are available on request to the corresponding author.
Author Contributions
All authors listed have made a substantial, direct and intellectual contribution to the work, and approved it for publication.
Funding
This study was supported by the National Natural Science Foundation of China (Grant No. 41574152) and the Strategic Priority Program (SPP) on Space Science Advanced Research of Space Science Missions and Payloads (Nos. XDA15017100 and XDA15017104).
Conflict of Interest
The authors declare that the research was conducted in the absence of any commercial or financial relationships that could be construed as a potential conflict of interest.
References
Brandt, P. C., Barabash, S., Roelof, E. C., and Chase, C. J. (2001). Energetic neutral atom imaging at low altitudes from the Swedish micro-satellite Astrid: extraction of the equatorial ion distribution. J. Gephys. Res. 105, 25731–25744. doi: 10.1029/2000JA900023
Brandt, P. C., Demajistre, R., Roelof, E. C., Ohtani, S., and Mitchell, D. G. (2002a). IMAGE/high-energy energetic neutral atom: global energeticneutral atom imaging of the plasma sheet and ring current during substorms. J. Gephys. Res. 107:1454. doi: 10.1029/2002JA009307
Brandt, P. C., Roelof, E. C., Ohtani, S., Mitchell, D. G., and Anderson, B. (2002b). IMAGE/HENA: pressure and current distributions during the 1 October 2002 storm. Adv. Space Res. 33, 719–722.
Cao, J. B., Ding, W. Z., Reme, H., Dandouras, I., Dunlop, M., Liu, Z. X., et al. (2011). The statistical studies of the inner boundary of plasma sheet. Ann. Geophys. 29, 289–298. doi: 10.5194/angeo-29-289-2011
Chen, Y., Zou, H., Chen, H. F., Yu, X. Q., and Shi, W. H. (2016). Study on the loss and recovery mechanisms of high-energy protons in the inner radiation belt during geomagnetic storms (in Chinese). Chinese J. Geophys. 59, 2344–2355. doi: 10.6038/cjg20160702
DeMajistre, R., Roelof, E. C., Brandt, P. C., and Mitchell, D. G. (2004). Retrieval of global magnetospheric ion distributions from high-energy neutral atom measurements made by the IMAGE/HENA instrument. J. Geophys. Res. 109:A04214. doi: 10.1029/2003JA010322
Fok, M.-C., Wolf, R. A., Spiro, R. W., and Moore, T. E. (2001). Comprehensive computational model of Earth's ring current. J. Geophys. Res. 106, 8417–8424. doi: 10.1029/2000JA000235
Fu, H. S., Cao, J. B., Mozer, F. S., Lu, H. Y., and Yang, B. (2012). Chorus intensification in response to interplanetary shock. J. Geophys. Res. 117:A01203. doi: 10.1029/2011JA016913
Fu, H. S., Khotyaintsev, Y. V., Andreé, M., and Vaivads, A. (2011). Fermi and betatron acceleration of suprathermal electrons behind dipolarization fronts. Geophys. Res. Lett. 38:L16104. doi: 10.1029/2011GL048528
Goldstein, J., Bisikalo, D. V., Shematovich, V. I., Gérard, J.-C., Søraas, F., McComas, D. J., et al. (2016). Analytical estimate for low-altitude ENA emissivity. J. Geophys. Res. Space Phys. 121, 1167–1191. doi: 10.1002/2015JA021773
Li, X., Selesnick, R., Schiller, Q., Zhang, K., Zhao, H., Baker, D. N., et al. (2017). Measurement of electrons from albedo neutron decay and neutron density in near-Earth space. Nature 552, 382–385. doi: 10.1038/nature24642
Liu, Z. X., Escoubet, P., and Cao, J. B. (2005b). A Chinese European Multiscale Mission: The Double Star Program, Multiscale Coupling of Sun-Earth Processes. eds A. T. Y. Lui, Y. Kamide, and G. Consolini (Amsterdam: ELSEVIER), 509–514.
Liu, Z. X., Escoupet, C. P., Pu, Z. Y., Laakso, H., Shi, J. K., and Hapgood, M. (2005a). The Double Star mission. Ann. Geophys. 23, 2707–2712.
Lu, L., McKenna-Lawlor, S., and Balaz, J. (2019). Close up observation and inversion of low-altitude ENA emissions during a substorm event. Sci. China Earth Sci. 62, 1024–1032. doi: 10.1007/s11430-018-9307-x
Lu, L., McKenna-Lawlor, S., Balaz, J., Shi, J., Yang, C., and Luo, J. (2014). Technical configuration and simulation of the NAIS-H for the MIT mission (in Chinese). Chin. J. Space Sci. 34, 341–351. doi: 10.11728/cjss2014.03.341
Lu, L., McKenna-Lawlor, S., Barabash, S., et al. (2008a). Iterative inversion of global magnetospheric ion distributions using energetic neutral atom (ENA) images recorded by the NUADU/TC 2 instrument. Ann. Geophys. 26, 1–12.
Lu, L., Mckenna-Lawlor, S., Barabash, S., Balaz, J., Liu, Z., Shen, C., et al. (2008b). Iterative inversion of global magnetospheric information from energy neutral atom (ENA) images recorded by the TC-2/NUADU instrument. Sci. China Technol. Sci. 51, 1731–1744. doi: 10.1007/s11431-008-0264-9
Lu, L., McKenna-Lawlor, S., Cao, J. B., Kudela, K., and Balaz, J. (2016). The causal sequence investigation of the ring current ion-flux increasing and the magnetotail ion injection during a major storm. Sci. China Earth Sci. 59, 129–144. doi: 10.1007/s11430-015-5121-7
McComas, D. J., Allegrini, F., Baldonado, J., Blake, B., Brandt, P. C., Burch, J., et al. (2009). The two wide-angle imaging neutral-atom spectrometers (TWINS)NASA mission-of- opportunity. Space Sci. Rev. 142, 157. doi: 10.1007/s11214-008-9467-4
McKenna-Lawlor, S., Balaz, J., Barabash, S., Johnsson, K., Lu, L., Shen, C., et al. (2004). The energetic NeUtral Atom Detector Unit (NUADU) for China's Double Star Mission and its calibration. Nucl. Inst. Methods A 503, 311–322.
McKenna-Lawlor, S., Li, L., Barabash, S., Kudela, K., Balaz, J., Strharsky, I., et al. (2005). The NUADU experiment on TC-2 and the first Energetic Neutral Atom (ENA) images recorded by this instrument. Ann. Geophys. 23, 2825–2849.
Perez, J. D., Zhang, X. X., Brandt, P. C., Mitchell, D. G., Jahn, J.-M., and Pollock, C. J. (2004). Dynamics of ring current ions as obtained from IMAGE HENA and MENA ENA images. J. Geophys. Res. 109:A05208. doi: 10.1029/2003JA010164
Rairden, R. L., Frank, L. A., and Craven, J. D. (1986). Geocoronal imaging with dynamics explorer. J. Geophys. Res. 91, 13613–13630.
Roelof, E. C. (1987). Energetic neutral atom image of a storm-time ring current. Geophys. Res. Lett. 14, 652–655. doi: 10.1029/GL014i006p00652
Smith, P. H., and Bewtra, N. K. (1987). Charge exchange lifetimes for ring current ions. Space Sci. Rev. 22, 301–318.
Tinsley, B. A., Hodges, R. R. Jr., and Rhorbaugh, R. P. (1986). Monte carlo models for the terrestrial exosphere over a solar cycle. J. Geophys. Res. 91, 13631–13647.
Wang, L., Lin, R. P., Parks, G. K., Brandt, P. C., Roelof, E. C., Sample, J. G., et al. (2010). Energetic, ~5–90 keV neutral atom imaging of a weak substorm with STEREO/STE. Geophys. Res. Lett. 37:L08107. doi: 10.1029/2010GL042964
Wang, Y. (2003). “Pitch angle distribution of high-energy particles in the inner radiation belt,” in The 16th Academic Conference of Space Exploration Committee of Chinese Space Science Society (in Chinese) (Corpus) (Beihai: Corpus).
Yu, Y., Cao, J., Fu, H., Lu, H., and Yao, Z. (2017). The effects of bursty bulk flows on global-scale current systems. J. Geophys. Res. 122, 6139–6149. doi: 10.1002/2017JA024168
Keywords: magnetosphere, radiation belts, neutral atom imaging, South Atlantic anomaly, space weather forecast
Citation: Lu L, Yu Q-L and Lu Q (2020) Near-Approach Imaging Simulation of Low-Altitude ENA Emissions by a LEO Satellite. Front. Astron. Space Sci. 7:35. doi: 10.3389/fspas.2020.00035
Received: 13 November 2019; Accepted: 27 May 2020;
Published: 21 July 2020.
Edited by:
Christophe Philippe Escoubet, European Space Research and Technology Centre (ESTEC), NetherlandsReviewed by:
Huishan Fu, Beihang University, ChinaArnaud Masson, European Space Astronomy Centre (ESAC), Spain
Copyright © 2020 Lu, Yu and Lu. This is an open-access article distributed under the terms of the Creative Commons Attribution License (CC BY). The use, distribution or reproduction in other forums is permitted, provided the original author(s) and the copyright owner(s) are credited and that the original publication in this journal is cited, in accordance with accepted academic practice. No use, distribution or reproduction is permitted which does not comply with these terms.
*Correspondence: Li Lu, bHVsaUBuc3NjLmFjLmNu