 A. M. Mickaelian
 H. V. Abrahamyan
- Byurakan Astrophysical Observatory (BAO), Byurakan, Armenia
Using the SDSS spectroscopy, we have carried out fine optical spectral classification for activity types for 710 AGN candidates. These objects come from a larger sample of some 2,500 candidate AGN using pre-selection by various samples; bright objects of the Catalog of Quasars and Active Galactic Nuclei, AGN candidates among X-ray sources, optically variable radio sources, IRAS extragalactic objects, etc. A number of papers have been published with the results of this spectral classification. More than 800 QSOs have been identified and classified, including 710 QSOs, Seyferts and Composites. The fine classification shows that many QSOs show the same features as Seyferts, i.e., subtypes between S1 and S2 (S1.2, S1.5, S1.8 and S1.9). We have introduced subtypes for the QSOs: QSO1.2, QSO1.5, QSO1.8, QSO1.9, though the last subtype does not appear in SDSS wavelength range due to mostly highly redshifted Hα (the main line for identification of the 1.9 subtype). Thus, independent of the luminosity (which serves as a separator between QSOs and Seyferts), AGN show the same features. We also have classified many objects as Composites, spectra having composite characteristics between Sy and LINERs, Sy and HII or LINERs and HII; in some cases all three characteristics appear together resulting as Sy/LINER/HII subtype. The QSOs subtypes together with Seyfert ones allow to follow AGN properties along larger redshift range expanding our knowledge on the evolution of AGN to more distant Universe represented by QSOs.
1 Introduction
Active Galaxies, including both Active Galactic Nuclei (AGN) and Starbursts (SB) are the most interesting objects in extragalactic astronomy and they are especially crucial for evolution of galaxies, as well as for understanding radiation mechanisms. Their studies are connected to galaxy evolution, understanding of energy sources, galaxy morphology, interactions and merging, binary and multiple structure and clustering. According to modern theory, AGN is a compact region at the centre of a galaxy which is able to outshine its host over the whole, or at least part, of the electromagnetic spectrum. Such excess emission has been observed in gamma-ray, X-ray, UV, optical, IR, microwave (submm/mm) and radio wavelengths. Therefore, it is so important to have multi-wavelength (MW) Spectral Energy Distribution (SED) to compare the behavior of these objects at various ranges. There is a number of observational signatures to distinguish an AGN or SB:
• Optical spectra, namely emission lines. They can show broad or narrow-line profiles, depending on the Broad-Line Region producing them (BLR, closer to the nucleus) or Narrow-Line Region (NLR, relatively farther from the nucleus), respectively. In addition, optical continuum emission comes from the nucleus and is visible whenever there is a direct view of the accretion disc. Relativistic jets can also contribute to this component;
• Nuclear IR emission (at least most of it) is detectable if the accretion disc and its environment are obscured by gas and dust close to the nucleus. They re-emit UV and optical radiation into IR;
• X-ray emission; the continuum one comes both from the jet and from the hot corona of the accretion disc through the scattering process and show power-law spectrum.
• Other manifestations of activity. These may be jets, compact components, interactions, merging, etc., including those not directly related to the nucleus, but somehow resulting from its activity, so-called AGN feedback.
Classifications based on optical emission-line spectra began as early as in 1943, when Carl Seyfert (Seyfert, 1943) observed emission-lines in the spectra of some spiral galaxies (“extragalactic nebulae”), including presently well-known AGN like: NGC 4151, NGC 4051, NGC 1068 (also known as M77), NGC 1275 (also known as Perseus A radio galaxy), NGC 3516, NGC 5548, and NGC 7469. Especially surprising was the presence of broad emission lines (or broad wings of lines) that were not observed in the spectra of the galactic nebulae. These objects were called Seyfert (Sy or S) galaxies. Using an optical spectrum obtained with the 200-inch Hale Telescope on Mt. Palomar, Maarten Schmidt was the first to interpret the spectrum of the radio source 3C 273 as having very largely redshifted (z = 0.158) broad emission Balmer lines corresponding to recession velocity of 47,000 km/s (Schmidt, 1963). This discovery allowed other astronomers to measure redshifts from emission lines of other radio sources thus extending our knowledge to much farther extragalactic universe. These point-like extragalactic radio sources were called quasi-stellar radio sources (quasars) or quasi-stellar objects (QSOs). Later on, based on the presence or absence of broad emission lines, Seyferts were classified into S1 and S2, respectively (Khachikian and Weedman, 1974).
The variety of observational manifestations has led to the classification of a variety AGN types, especially taking into account historical classifications, when any classification was made based on the incomplete knowledge of the given epoch. Unified models (or unified schemes; Antonucci and Miller, 1984; Antonucci, 1993; Urry and Padovani, 1995) propose that different observational classes of AGN are a single type of physical object observed under different conditions. This concerns in fact, their different orientations in the space and hence, angles of view to the observer, as well as the presence of a relativistic jet results in different types of AGN. However, to understand AGN we must study all their observable features, and one of the most important ones is their optical emission-line spectrum.
AGN spectra contain numerous iron (FeI, FeII and FeIII) lines. They appear around Hβ (from both sides) and elsewhere and interfere accurate line identification and measurements. Fe templates have been built to be fitted and subtracted from a given spectrum. Especially numerous and intense are Fe lines in Narrow-Line Seyfert 1 Galaxies (NLS1; Osterbrock and Pogge, 1985).
On the other hand, Osterbrock (1981) introduced intermediate Seyfert subtypes based on the presence and significance of broad and narrow lines.
S1.0 (Broad-line Seyfert 1): Have broad permitted Balmer HI lines and narrow forbidden lines. Physically, they are the same objects as QSOs but having smaller luminosities (
S1.2: Spectra of AGN, which share parameters that are intermediate between those of classical S1 and S2 galaxies, i.e., both broad and narrow components are present for permitted lines (in our case Hα and Hβ lines display such profiles, Osterbrock, 1980), however, broad lines are stronger, and 2.0 < Hβ/[OIII]5007 < 5.0 (Winkler, 1992).
S1.5: Spectra of AGN which that share parameters that are intermediate between those of classical S1 and S2 galaxies; they have easily discernible narrow HI profile superposed on broad wings (Osterbrock, 1980), but 0.333 < Hβ/[OIII]5007 < 2.0 (Winkler, 1992). Broad and narrow components are approximately equal in intensity.
S1.8: AGN that share parameters that are intermediate between those of classical S1 and S2 galaxies; they have relatively weak broad Hα and Hβ components superposed on strong narrow lines, and Hβ/[OIII]5007 < 0.333 (Winkler, 1992).
S1.9: Spectra of AGN that share parameters that are intermediate between those of classical S1 and S2 galaxies; they have relatively weak broad Hβ component superposed on a strong narrow line. The broad component of Hβ is not seen (Osterbrock, 1980), and Hβ/[OIII]5007 < 0.333 (Winkler, 1992).
S2.0: Spectra of AGN that show relatively narrow (compared to S1) emission in both permitted Ballmer and forbidden lines, with almost the same FWHM, typically in the range of 300–1,000 km/s. No broad component is visible. A secondary classification criterion is [OIII]5007/Hβ ≥ 3, to distinguish from S1n (Veilleux and Osterbrock, 1987).
NLS1.0 (Narrow-line Seyfert 1): Defined by Osterbrock and Pogge (1985) as NLS1, as soft X-ray sources, having narrow permitted lines only slightly broader than the forbidden ones; many FeI, FeII, FeIII, and often strong [FeVII] and [FeX] emission lines are present.
NLS1.2 (Narrow-line Seyfert 1.2): These are soft X-ray sources having narrow permitted lines only slightly broader than the forbidden ones; many FeI, FeII, FeIII, and often strong [FeVII] and [FeX] emission lines present.
NLS1.5 (Narrow-line Seyfert 1.5): These are soft X-ray sources having narrow permitted lines only slightly broader than the forbidden ones; many FeI, FeII, FeIII, and often strong [FeVII] and [FeX] emission lines present.
NLS1.8 (Narrow-line Seyfert 1.8): These are soft X-ray sources having narrow permitted lines only slightly broader than the forbidden ones; many FeI, FeII, FeIII, and often strong [FeVII] and [FeX] emission lines present.
NLS1.9 (Narrow-line Seyfert 1.9): There are soft X-ray sources having narrow permitted lines only slightly broader than the forbidden ones; many FeI, FeII, FeIII, and often strong [FeVII] and [FeX] emission lines present.
Composite (mixture of HII/LINER, HII/Seyfert or LINER/Seyfert features). Composite spectrum objects with the presence of both HII and LINER or both HII and Sy spectral features (Véron et al., 1997).
Surprisingly, QSOs have not been classified in detail and only some subtypes have been introduced based on some peculiar features. Broad Absorption Line (BAL) QSOs’ some emission lines show P Cygni profiles, with very broad (10,000–30,000 km/s) and blueshifted absorption components (Hazard et al., 1984). BAL QSOs tend to be more polarized than non-BAL QSOs. Damped Ly-alpha (DLA) QSOs show unresolved absorption lines even on very high-resolution spectra with typical widths of 10–12 ÅÅ. Optically-Violently Variable (OVV) QSOs are similar to BL Lac but with normal QSO spectrum (Kellermann et al., 1989). They have been detected in radio. Highly Polarized Quasars (HPQ or HP) have polarization typically >34%. They are typically combined with OVV quasars as a single class. The parent population of HPQs is made of Fanaroff-Riley type II (FR II, radio sources exhibiting increasing luminosity in the lobes, Fanaroff and Riley, 1974) radio galaxies. Impossibility of detailed classification of QSOs is also because the diagnostic diagrams are based on narrow-line ratios and are useful for S2, LINER and HII, but not for broad-line objects. Therefore, QSOs have never been classified by any common scheme and the vast majority is given just as QSO without any subclass (Massaro et al., 2009).
2 Sloan Digital Sky Survey and Possibilities for Accurate and Homogeneous Classifications
The Sloan Digital Sky Survey (SDSS) is an unprecedented extragalactic survey providing vast amount of photometric and spectroscopic data. SDSS Data Release 15 (DR15; Aguado et al., 2019) has been used in the present work. The photometry covers five bands: u, g, r, i and z. The medium resolution spectroscopy (with a range 3,600–10,400 ÅÅ) has provided spectra for 2,541,424 galaxies and 680,843 QSOs. None of the previous spectroscopic surveys provide such number of spectra for homogeneous classifications. Most of the active galaxies had relatively poor spectra from older observations, however homogeneous re-classification may provide new possibilities for better studies of the same objects and/or samples having objects grouped in genuine types/subtypes. The larger spectral range has given new possibilities for classifications, particularly for galaxies with higher redshifts (to be able to detect their strongest Balmer lines as well). Done, info on the SDSS is shortened.
However, SDSS spectra also have some constraints, namely related to application of decomposition software, due to their moderate resolution and very often, poor signal-to-noise ratio. This software may be applied to relatively bright objects having better quality spectra. A limitation of samples by magnitudes (example 16.5m or 17m) may significantly improve the classification. There are several decomposition software, including one in IRAF. Typically, we have used the software SPECTRAI (Véron et al., 1980).
3 The Sample of Studied Objects
In our recent papers (Abrahamyan et al., 2018a; Abrahamyan et al., 2018b; Mikayelyan et al., 2018; Paronyan et al., 2018; Abrahamyan et al., 2019a; Paronyan et al., 2019) we have introduced and developed fine classification of active galaxies to have better understanding of the detailed spectral features between the subclasses. In this paper we use objects provided by Abrahamyan et al. (2018b), where 6,301 sources are listed extracted from the comparison of NRAO VLA Sky Survey (NVSS) (Condon et al., 1998) and Faint Images of the Radio Sky at Twenty cm (FIRST) (Helfand et al., 2015) radio catalogues. All of them are characterized by radio variability, and 25.5% of them also show optical variability. Cross-correlating this sample with SDSS DR15 we have ended up with 1,864 variable radio sources having SDSS optical spectra and then used those with significantly high signal-to-noise ratio to be classified in detail.
SDSS provides homogeneous spectroscopic material for standard classification of numerous objects, including our samples. Therefore, we give preference to SDSS spectra when available. We of course select higher signal-to-noise spectra (brighter objects) to distinguish the detailed features for our introduced subclasses.
4 Fine Classification for Activity Types
We have carried out classification for activity types both by eye examination and using diagnostic diagrams (Abrahamyan et al., in preparation). 710 objects turned to be QSOs, Seyferts or Composites, which were used to refine our classification scheme having all details of subclasses. We have used those SDSS spectra that have enough high signal-to-noise to distinguish the detailed features that we used for the classification of subclasses. That is why the final useful number of the sample objects is 710.
To take into account all details of spectra, we first of all start the classification with identifying broad lines, which are typically neglected in diagnostic diagrams. If they exist, the object is Type 1 AGN or at least composite between Type 1 and 2. This feature cannot be identified on diagnostic diagrams. It may be revealed by decomposition software (separating broad and narrow emission lines), however, very little spectra have been analyzed like this and the broad lines are not always obvious due to the moderate resolution of the SDSS spectra.
We have introduced four new groups of detailed classifications (at least in much larger numbers compared to previous classifications):
• Narrow-Line Seyfert 1 (NLS1) galaxiessubtypes: NLS1.0-1.2-1.5-1.8-1.9
• Broad-Line BQSOs subtypes: QSO1.0-1.2-1.5-1.8-1.9
• Narrow-Line QSOs with subtypes: NLQSO1.0-1.2-1.5-1.8-1.9
• Composite spectrum objects: Sy/LINER, Sy/HII, LINER/HII, sometimes Sy/LINER/HII
Here we give examples of our fine classification of SDSS spectra for active galaxies with their newly introduced subtypes (Figures 1–5), namely Seyfert subclasses, Narrow-Line Seyfert subclasses, QSO subclasses, Narrow-Line QSO subclasses, and a few examples of Composite spectrum objects.
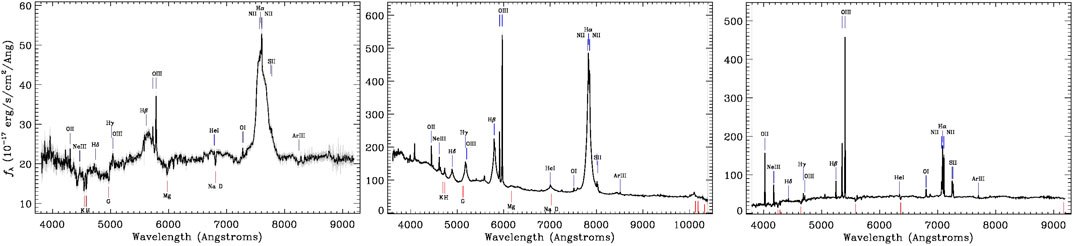
FIGURE 1. Examples of subclasses of active galaxies: S1.0, S1.2, and S2.0.
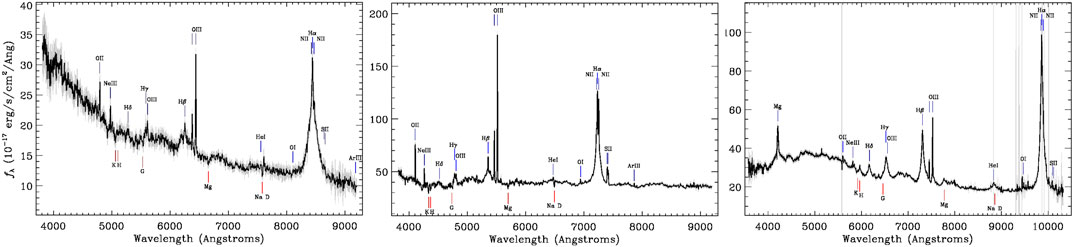
FIGURE 2. Examples of subclasses of active galaxies: NLS1.2, NLS1.5 and NLS1.8.
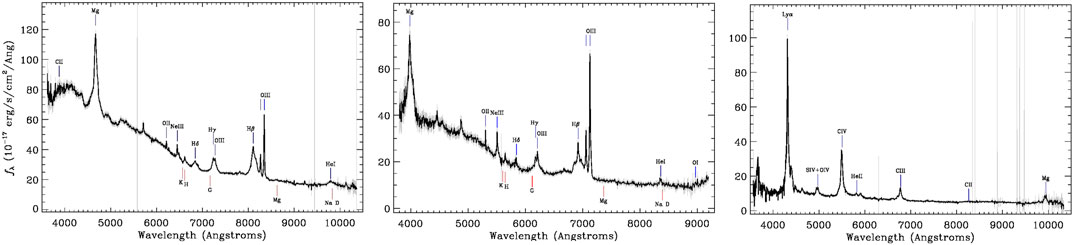
FIGURE 3. Examples of subclasses of active galaxies: QSO1.2, QSO1.5 and QSO1.8.
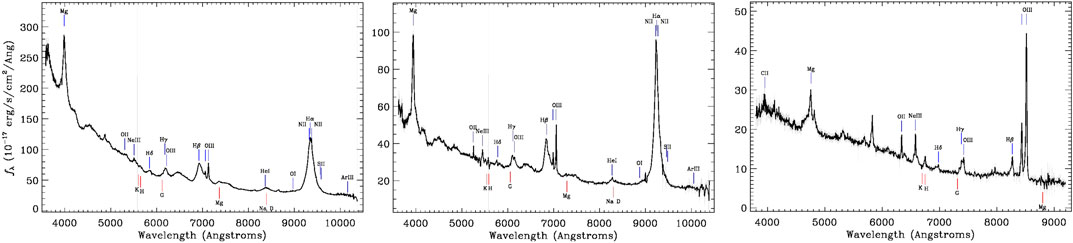
FIGURE 4. Examples of subclasses of active galaxies: NLQSO1.0, NLQSO1.2 and NLQSO1.5.
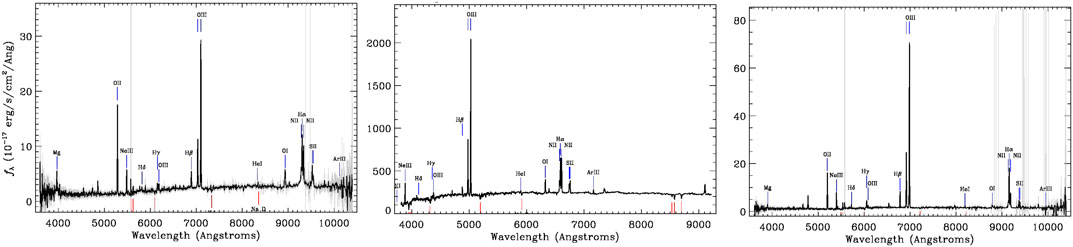
FIGURE 5. Examples of subclasses of active galaxies: Composite S1.9/LINER, Composite S2.0/LINER and Composite S2.0/HII.
In Figure 1 (examples of subclasses of active galaxies): S1.0 (only broad emission lines are present), S1.2 (both broad and narrow emission lines are present, overlapped to each other), and S2.0 (only narrow emission lines are present). In Figure 2 (examples of subclasses of active galaxies): NLS1.2 (broad and narrow emission line ratios are typical to S1.2, but the broad lines are narrower and FeII lines from both sides of Hβ are present), NLS1.5 (broad and narrow emission line ratios are typical to S1.5, but the broad lines are narrower and FeII lines from both sides of Hβ are present) and NLS1.8 (broad and narrow emission line ratios are typical to S1.8, but the broad lines are narrower and FeII lines from both sides of Hβ are present). In Figure 3 (examples of subclasses of active galaxies): QSO1.2 (QSO also having narrow lines with typical to S1.2 broad/narrow line ratios), QSO1.5 (QSO also having narrow lines with typical to S1.5 broad/narrow line ratios) and QSO1.8 (QSO also having narrow lines with typical to S1.8 broad/narrow line ratios). In Figure 4 (examples of subclasses of active galaxies): NLQSO1.0 (QSO having only broad lines but narrower than for classical QSOs and also FeII lines from both sides of Hβ are present), NLQSO1.2 (QSO having both broad and narrow lines with typical to S1.2 ratios but the broad lines are narrower than for classical QSOs and also FeII lines from both sides of Hβ are present) and NLQSO1.5 (QSO having both broad and narrow lines with typical to S1.5 ratios but the broad lines are narrower than for classical QSOs and also FeII lines from both sides of Hβ are present). In Figure 5 (examples of subclasses of active galaxies): Composite S1.9/LINER (both S1.9 and LINER features are present, namely some line ratios show Seyfert (Hα having also a broad component) and some, LINER), Composite S2.0/LINER (both S2.0 and LINER features are present, namely some line ratios show S2.0 and some, LINER) and Composite S2.0/HII (both S2.0 and HII features are present, namely some line ratios show S2.0 and some, HII).
The SDSS spectral classification of 710 objects by activity types led to the following distribution by subtypes (Table 1).
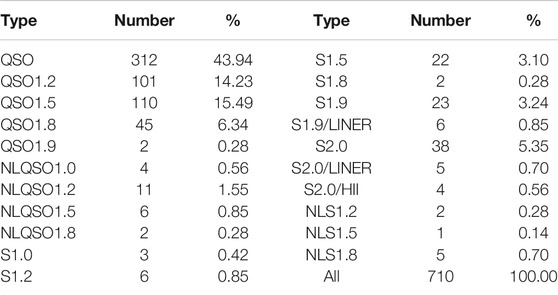
TABLE 1. Distribution of the classified objects by activity types.
5 Average Characteristics of Objects by Subtypes
Having our fine classification, it is possible to investigatehow the physical parameters of the objects depend on their subclass. We give in Figure 6 SDSS color-magnitude diagrams; u-g vs. r(abs) and g-r vs. r(abs). There is quantified distinct separation of type 1 and type 2 AGN, as well as one can notice gradual transition from brighter AGN to faint ones (more detailed division by subtypes is still impossible due to uncertainties and errors in measurements). In Figure 7, we give SDSS colors-color (u-g vs. g-r) diagram by activity subtypes. Again, QSOs are the bluer objects, followed by Seyfert 1s, while Seyfert 2s have typically redder colors. More details on the behavior of the newly defined subclasses are not possible so far. The distribution of the luminosity vs. redshift by activity subtypes is given in Figure 8. Such diagrams may also verify the classifications, as in average we should expect an increase of luminosity from S2.0 to brighter Seyferts and then to QSOs (QSO1.9-QSO1.8-QSO1.5-QSO1.2-QSO1.0).
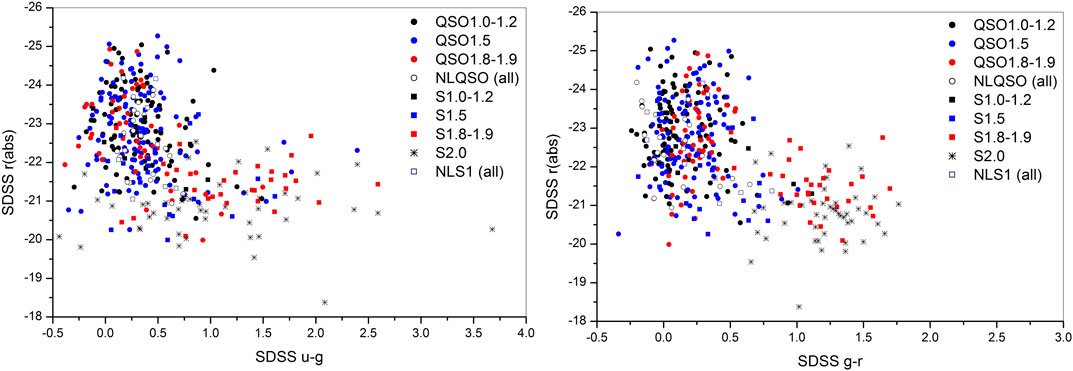
FIGURE 6. SDSS color-magnitude [u-g vs. r(abs) and g-r vs. r(abs)] diagrams by activity subtypes. Objects of different subtypes are given in different colors.
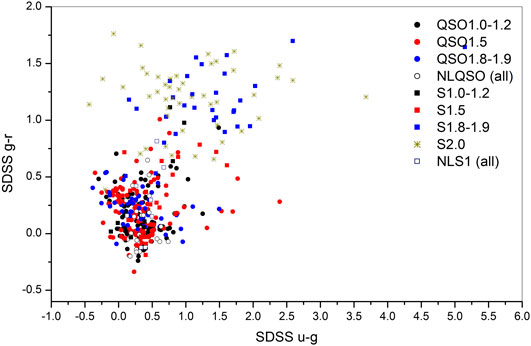
FIGURE 7. SDSS colors-color (u-g vs. g-r) diagram by activity subtypes. Objects of different subtypes are given in different colors.
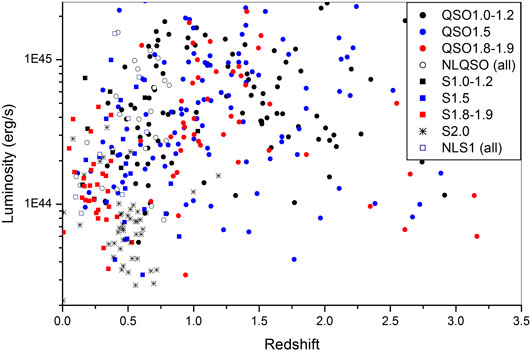
FIGURE 8. Distribution of the SDSS r luminosity vs. SDSS redshift by activity subtypes. Objects of different subtypes are given in different colors.
In Table 2 we give the average characteristics of the classified objects by activity types combined in larger groups given that in some cases the number of objects is not very high to have reliable statistics. In average we see an increase of colors (from blue to red) in both cases (SDSS u-g and g-r) for objects from QSO1.0-1.2 to QSO 1.8-1.9 and the same for S1.0-1.2 to S1.8-1.9. However, Narrow-Line objects (both QSOs and Seyferts) are blue enough as broad-line ones and in case of Seyferts (NLS1.0, NLS1.2 and NLS1.5), they correspond to S1.0-1.2-1.5 colors (probably because most of them have such subtypes). Objects classified as “QSO” will probably be refined in the future and turn to one of the subtypes, as at present they are mixture of all subtypes. As expected, redshifts are higher for QSOs (z = 1.2–1.3) and lower for Seyferts (0.4–0.5). In addition, Narrow-Line QSOs have lower redshifts which comes from the impossibility of their fine classifications at higher redshifts (z > 1), which is not the case of Seyferts. The absolute magnitudes and luminosities follow the rule that Type 1 AGN are brighter and Type 2 ones are relatively fainter.
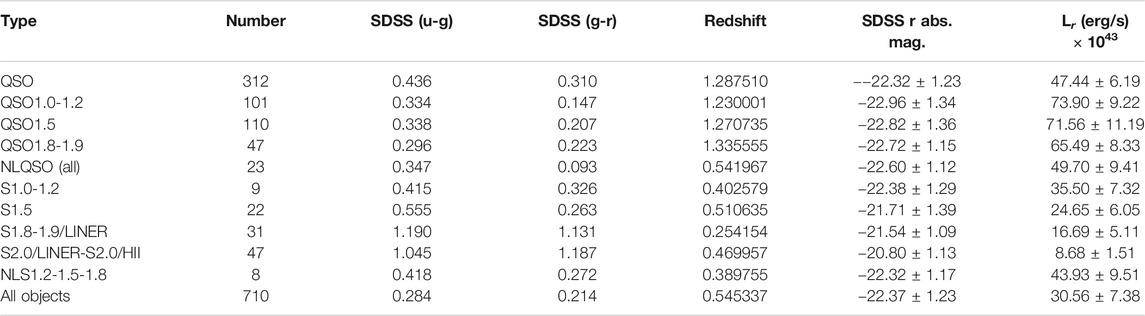
TABLE 2. Distribution of the classified objects by activity types.
The differences in luminosities come from the fact that more energy is being escaped in the optical range from objects of types and subtypes having smaller angle between their jets and the line of sight. The same is true for the colors; the nuclei are blue and hence higher luminosity AGN have bluer colors compared to lower ones.
We counted absolute magnitudes for our active galaxy using Eq. 1 (Véron-Cetty and Véron, 2010).
where D (Eq. 2) is the luminosity distance as defined by Riess et al. (2004):
z is the redshift, f(z) = −2.5 × log(1 + z)1−α the f(z) correction, Δm(z) is a correction to f(z) considering that the spectrum of quasars is not strictly a power law of the form S ∼ ϑ−α (α = −0.3, Véron-Cetty and Véron, 2010).
The following values were taken for the cosmological constants in the calculations:
Having the absolute magnitude, we calculated luminosities for blazars using Eq. 3 (Abrahamyan et al., 2019b).
where
6 Summary and Conclusion
Using the SDSS spectroscopy, we have carried out optical spectral classification for activity types for 710 candidate AGN using the sample of objects selected as radio variable sources by NVSS and FIRST catalogs analysis. We have published a number of papers using spectral classifications with more details and giving new subtypes. Many QSOs have been identified and classified in more details. The fine classification shows that many QSOs show the same features as Seyferts, i.e., subtypes between S1 and S2 (S1.2, S1.5, S1.8 and S1.9). We have introduced subtypes for the QSOs: QSO1.2, QSO1.5, QSO1.8, QSO1.9, though the last subtype does not appear in SDSS wavelength range due to mostly highly redshifted Hα (the main line for identification of the 1.9 subtype).
Thus, independent of the luminosity (which serves as a separator between QSOs and Seyferts), AGN subtypes show the same fine features (presence and different ratios of broad and narrow emission lines). The QSOs subtypes together with Seyfert ones allow to follow AGN properties along larger redshift range expanding our knowledge on the evolution of AGN to more distant Universe represented by QSOs.
We have introduced four new features in the classification scheme:
• Narrow-Line Seyfert 1 (NLS1) galaxies subtypes: NLS1.0-1.2-1.5-1.8-1.9 (before, typically only NLS1 was used with mixture of all possible subtypes),
• Broad-Line BQSOs subtypes: QSO1.0-1.2-1.5-1.8-1.9 (analogous to Seyferts but having higher luminosities),
• Narrow-Line QSOs with subtypes: NLQSO1.0-1.2-1.5-1.8-1.9 (again analogous to Seyferts but having higher luminosities),
• Composite spectrum objects: Sy/LINER, Sy/HII, LINER/HII, sometimes Sy/LINER/HII (objects having characteristics between two types, namely having classification to one type by one feature (ex. line ratio) and to another type by the second feature).
The fine classification of AGN activity types may strongly contribute to the analysis of observed and physical characteristics of objects to follow their changes and relations by activity types and subtypes. Of course, big numbers are important and useful to have better statistics. For this, an automated classification system and software are necessary that will take into account possible broad lines, carry out decomposition (to separate broad lines from narrow ones and better measure their intensities and widths), then measure the narrow lines to put on diagnostic diagrams. Thus, narrow-line objects will be classified correctly, as well as objects having also broad components may contribute to Composite spectrum classes (Seyfert and QSO subtypes 1.0–1.9). If using only diagnostic diagrams, the result will be irrelevant, as only narrow lines are being taken into account. Decomposition methods distinguish the broad and narrow line profiles, but diagnostic diagrams giving separation between the narrow line ratios are still necessary for further classification.
Our conclusion is that both software (decomposition and calculation of line ratios) or a combination of both methods should be used for the full classification and our scheme should be incorporated in these methods having possibly the best description of all features of various subtypes of the AGN zoo.
Data Availability Statement
The datasets generated for this study are available on request to the corresponding author.
Author Contributions
All authors listed have made a substantial, direct, and intellectual contribution to the work and approved it for publication.
Conflict of Interest
The authors declare that the research was conducted in the absence of any commercial or financial relationships that could be construed as a potential conflict of interest.
Acknowledgments
Funding for the Sloan Digital Sky Survey IV has been provided by the Alfred P. Sloan Foundation, the United States Department of Energy Office of Science, and the Participating Institutions. SDSS-IV acknowledges support and resources from the Center for High-Performance Computing at the University of Utah. The SDSS web site is www.sdss.org. SDSS-IV is managed by the Astrophysical Research Consortium for the Participating Institutions of the SDSS Collaboration including the Brazilian Participation Group, the Carnegie Institution for Science, Carnegie Mellon University, the Chilean Participation Group, the French Participation Group, Harvard-Smithsonian Center for Astrophysics, Instituto de Astrofísica de Canarias, The Johns Hopkins University, Kavli Institute for the Physics and Mathematics of the Universe (IPMU)/University of Tokyo, the Korean Participation Group, Lawrence Berkeley National Laboratory, Leibniz Institut für Astrophysik Potsdam (AIP), Max-Planck-Institut für Astronomie (MPIA Heidelberg), Max-Planck-Institut für Astrophysik (MPA Garching), Max-Planck-Institut für Extraterrestrische Physik (MPE), National Astronomical Observatories of China, New Mexico State University, New York University, University of Notre Dame, Observatário Nacional/MCTI, The Ohio State University, Pennsylvania State University, Shanghai Astronomical Observatory, United Kingdom Participation Group, Universidad Nacional Autónoma de México, University of Arizona, University of Colorado Boulder, University of Oxford, University of Portsmouth, University of Utah, University of Virginia, University of Washington, University of Wisconsin, Vanderbilt University, and Yale University.
References
Abrahamyan, H. V., Mickaelian, A. M., Mikayelyan, G. A., and Paronyan, G. M. (2018a). Revised optical classification of “LINERs”. Commun. BAO 65, 1–12.
Abrahamyan, H. V., Mickaelian, A. M., Paronyan, G. M., Mikayelyan, G. A., and Gyulzadyan, M. V. (2018b). Radio variable sources at 1400 MHz and their optical variability. Astron. Comput. 25, 176–182. doi:10.1016/j.ascom.2018.09.012
Abrahamyan, H. V., Mickaelian, A. M., Paronyan, G. M., Mikayelyan, G. A., and Gyulzadyan, M. V. (2019a). Classification of BZCAT objects having uncertain types. Commun. BAO 66, 1–7.
Abrahamyan, H. V., Mickaelian, A. M., Paronyan, G. M., and Mikayelyan, G. A. (2019b). Optical variability of blazars. Astron. Nachr. 340, 437–444. doi:10.1002/asna.201913603
Aguado, D. S., Ahumada, R., Almeida, A., Anderson, S. F., Andrews, B. H., Anguiano, B., et al. (2019). The fifteenth data release of the sloan digital sky surveys: first release of MaNGA-derived quantities, data visualization tools, and stellar library. Astrophys. J. Supplement Ser. 240, 23. doi:10.3847/1538-4365/aaf651
Antonucci, R. R. J., and Miller, J. S. (1984). Spectropolarimetry and the nature of NGC 1068. Astrophys. J. 297, 621–632. doi:10.1086/163559
Antonucci, R. (1993). Unified models for active galactic nuclei and quasars. Annu. Rev. Astron. Astrophys. 31, 473–521. doi:10.1146/annurev.aa.31.090193.002353
Condon, J. J., Cotton, W. D., Greisen, E. W., Yin, Q. F., Perley, R. A., Taylor, G. B., et al. (1998). The NRAO VLA sky survey. Astron. J. 115, 1693–1716. doi:10.1086/300337
Fanaroff, B. L., and Riley, J. M. (1974). The morphology of extragalactic radio sources of high and low luminosity. Mon. Not. R. Astron. Soc. 167, 31P–36P. doi:10.1093/mnras/167.1.31p
Hazard, C., Morton, D. C., Terlevich, R., and McMahon, R. (1984). Nine new quasi-stellar objects with broad absorption lines. Astrophys. J. 282, 33–52. doi:10.1086/162174
Helfand, D. J., White, R. L., and Becker, R. H. (2015). The last of FIRST: the final catalog and source identifications. Astrophys. J. 801, 17. doi:10.1088/0004-637x/801/1/26
Kellermann, K. I., Sramek, R., Schmidt, M., Shaffer, D. B., and Green, R. (1989). VLA observations of objects in the palomar bright quasar survey. Astron. J. 98, 1195. doi:10.1086/115207
Khachikian, E. Y., and Weedman, D. W. (1974). An atlas of Seyfert galaxies. Astrophys. J. 192, 581–589. doi:10.1086/153093
Massaro, E., Giommi, P., Leto, C., Marchegiani, P., Maselli, A., Perri, M., et al. (2009). Roma-BZCAT: a multifrequency catalogue of blazars. Astron. Astrophys. 495, 691–696. doi:10.1051/0004-6361:200810161
Mikayelyan, G. A., Mickaelian, A. M., Abrahamyan, H. V., and Paronyan, G. M. (2018). Discovery of new bright ULIRGs from the IRAS PSC/FSC combined catalogue. Commun. BAO 65, 13–20.
Osterbrock, D. E. (1980). “Emission-line spectra of active galactic nuclei and quasars,” in Texas symposium on relativistic astrophysics, 9th, Munich, West Germany, December 14–19, 1978 (New York: New York Academy of Sciences), 22–38. doi:10.1111/j.1749-6632.1980.tb15916.x
Osterbrock, D. E. (1981). Seyfert galaxies with weak broad H alpha emission lines. Astrophys. J. 249, 462–470. doi:10.1086/159306
Osterbrock, D. E., and Pogge, R. W. (1985). The spectra of narrow-line Seyfert 1 galaxies. Astrophys. J. 297, 166–176. doi:10.1086/163513
Paronyan, G. M., Mickaelian, A. M., Abrahamyan, H. V., and Mikayelyan, G. A. (2018). Activity types of galaxies selected from HRC/BHRC sample. Commun. BAO 65, 412–416.
Paronyan, G. M., Mickaelian, A. M., Harutyunyan, G. S., Abrahamyan, H. V., and Mikayelyan, G. A. (2019). Activity types of galaxies selected from HRC/BHRC sample. Astrophysics 62, 147–162. doi:10.1007/s10511-019-09570-x
Riess, A. G., Strolger, L. G., Tonry, J., Casertano, S., Ferguson, H. C., Mobasher, B., et al. (2004). Type Ia supernova discoveries at z > 1 from the hubble space telescope: evidence for past deceleration and constraints on dark energy evolution. Astrophys. J. 607, 665–687. doi:10.1086/383612
Schmidt, M. (1963). 3C 273: a star-like object with large red-shift. Nature 197, 1040. doi:10.1038/1971040a0
Urry, C. M., and Padovani, P. (1995). Unified schemes for radio-loud active galactic nuclei. Publ. Astron. Soc. Pac. 107, 803–845. doi:10.1086/133630
Veilleux, S., and Osterbrock, D. E. (1987). Spectral classification of emission-line galaxies. Astrophys. J. Suppl. 63, 295–310. doi:10.1086/191166
Véron, P., Gonçalves, A. C., and Véron-Cetty, M.-P. (1997). AGNs with composite spectra. Astron. Astrophys. 319, 52–66.
Véron, P., Lindblad, P. O., Zuiderwijk, E. J., Véron, M. P., and Adam, G. (1980). On the nature of the so-called narrow-line X-ray galaxies. Astron. Astrophys. 87, 245–249.
Véron-Cetty, M. P., and Véron, P. (2010). A catalogue of quasars and active nuclei. Astron. Astrophys. 518, A10. doi:10.1051/0004-6361/201014188
Keywords: active galactic nuclei, quasars, Seyfert galaxies, starburst galaxies, narrow-line quasars, narrow-line Seyfert 1 galaxies, LINERs
Citation: Mickaelian AM, Abrahamyan HV, Paronyan GM and Mikayelyan GA (2021) Fine Classification of QSOs and Seyferts for Activity Types Based on SDSS Spectroscopy. Front. Astron. Space Sci. 7:505043. doi: 10.3389/fspas.2020.505043
Received: 20 December 2019; Accepted: 22 September 2020;
Published: 30 March 2021.
Edited by:
Paola Marziani, Osservatorio Astronomico di Padova (INAF), ItalyReviewed by:
Enrico Congiu, Las Campanas Observatory, ChileMarco Berton, Univeristy of Turku, Finland
Copyright © 2021 Mickaelian, Abrahamyan, Paronyan and Mikayelyan. This is an open-access article distributed under the terms of the Creative Commons Attribution License (CC BY). The use, distribution or reproduction in other forums is permitted, provided the original author(s) and the copyright owner(s) are credited and that the original publication in this journal is cited, in accordance with accepted academic practice. No use, distribution or reproduction is permitted which does not comply with these terms.
*Correspondence: A. M. Mickaelian, YXJlZ21pY2tAeWFob28uY29t