 Luis A. Balona
- South African Astronomical Observatory, Cape Town, South Africa
Kepler short-cadence photometry of 2,347 stars with effective temperatures in the range 6,000–10,000 K was used to search for the presence of solar-like oscillations. The aim is to establish the location of the hot end of the stochastic convective excitation mechanism and to what extent it may overlap the δ Scuti/γ Doradus instability region. A simple but effective autocorrelation method is described which is capable of detecting low-amplitude solar-like oscillations, but with significant risk of a false detection. The location of the frequency of maximum oscillation power,
Introduction
Convective eddies in the outermost layers of a star have characteristic turn-over time scales. If the turn-over time scale matches a global pulsational period, energy is transferred from convective cell motion to drive the global pulsation mode at that period; destructive interference filters out all but the resonant frequencies. Thus random convective noise is transformed into distinct p-mode pulsations with a wide range of spherical harmonics. Stochastic oscillations driven in this way are called solar-like oscillations. Such oscillations were first detected in the Sun by Leighton et al. (1962) as quasi-periodic intensity and radial velocity variations with a period of about 5 min.
Owing to their very small amplitudes, detection from the ground of solar-like oscillations in other stars had to await advances in spectroscopic detectors. The first unambiguous detection may perhaps be attributed to Kjeldsen et al. (1995) for the G0IV star η Boo. The advent of space photometry, first with the CoRoT (Fridlund et al., 2006) and later the Kepler spacecrafts (Borucki et al., 2010), led to the discovery of solar-like oscillations in thousands of stars. Most of these are red giants where the oscillations have the highest amplitudes.
The individual modes in solar-like oscillations form a distinctive frequency pattern which is well-described by the asymptotic relation for p modes (Tassoul, 1980). Successive radial overtones, n, of modes with the same spherical harmonic number, l, are spaced at a nearly constant frequency interval,
The δ Scuti stars are A and early F dwarfs and giants with multiple frequencies higher than 5 days−1 while γ Doradus stars are F dwarfs and giants pulsating in multiple frequencies in the range 0.3–3 days−1. It was originally thought that the δ Sct stars do not pulsate with frequencies lower than about 5 days−1, but photometry from the Kepler satellite has shown that low frequencies occur in practically all δ Sct stars (Balona, 2018). Furthermore, the γ Dor stars should probably not be considered as a separate class of variable (Xiong et al., 2016; Balona, 2018). There are, in fact, more δ Sct stars than γ Dor stars in the γ Dor instability region. It seems that the γ Dor stars are δ Sct stars in which the high frequencies are damped for some unknown reason.
Samadi et al. (2002) computed models of δ Sct stars located in the vicinity of the cool edge of the classical instability strip and suggested that the amplitudes of solar-like oscillations in these stars may be detectable even with ground-based instruments, provided they can be distinguished from the large-amplitude pulsations. This is an interesting prospect because it would allow the stellar parameters to be determined and greatly simplify mode identification. Antoci et al. (2011) reported detection of solar-like oscillations in the δ Sct star HD 187547 observed by Kepler, but further data failed to confirm this identification (see Antoci et al., 2014; Bedding et al., 2020). Another attempt to search for solar-like oscillations, this time on the δ Sct star ρ Pup, also failed (Antoci et al., 2013). Since then, no further searches have been published.
Huber et al. (2011) discussed the location in the H–R diagram of stars with solar-like oscillations relative to the observed and theoretical cool edges of the δ Sct instability strip. They do not arrive at any conclusion as to whether stars with solar-like oscillations are present within the δ Sct instability strip.
The main purpose of this investigation is to determine the location of the hot edge of solar-like oscillations. This is important because it places a constraint on any theory seeking to explain these oscillations and because it gives information on convection at the interface between radiative and convective atmospheres. For this purpose, all stars with short-cadence Kepler observations in the temperature range
The Data
Kepler observations consist of almost continuous photometry of many thousands of stars over a four-year period with micromagnitude precision. The vast majority of stars were observed in long-cadence mode with a sampling cadence of 29.4 min. A few thousand stars were also observed in short-cadence mode (sampling cadence of 1 min), but typically only for a few months. The Kepler light curves used here are those with pre-search data conditioning in which instrumental effects are removed (Smith et al., 2012; Stumpe et al., 2012). In main sequence stars with solar-like oscillations, the frequency of maximum amplitude,
Most stars in the Kepler field have been observed by multicolour photometry, from which effective temperatures, surface gravities, metal abundances and stellar radii can be estimated. These stellar parameters are listed in the Kepler Input Catalog (KIC, Brown et al., 2011). The effective temperatures,
Huber et al. (2017) lists 2,236 Kepler stars with solar-like oscillations compiled from various catalogs giving
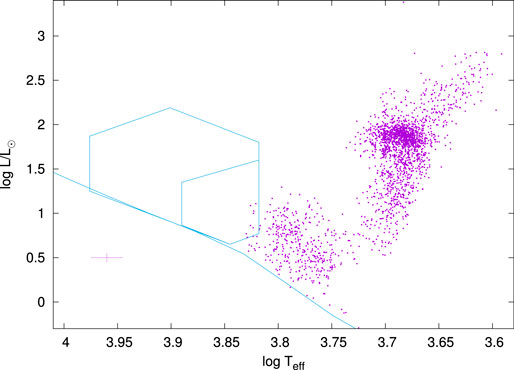
FIGURE 1. The location of stars with solar-like oscillations from Huber et al. (2017) in the H-R diagram. The zero-age main sequence for models of solar abundance from Bertelli et al. (2008) is shown (solid line). The large polygonal region shows the location of δ Sct stars from Balona (2018). The smaller polygon shows the location of the γ Dor stars. The cross at bottom left indicates 1 − σ error bars in effective temperature and luminosity.
It is intriguing that the hot edge of solar-like oscillations seems to coincide with the cool edge of the δ Sct/γ Dor instability regions. Very few stars having solar-like oscillations are hotter than 6,500 K and none exceed 7,000 K.
Detection Method
Solar-like oscillations are usually detected by searching for the typical bell-shaped amplitude envelope in the power spectrum of the light curve. Most methods use a smoothed power spectrum to obtain the global parameters of the Gaussian envelope. A model consisting of the background, which includes a contribution from granulation, and a Gaussian is then fitted to the data and tested for significance. The peak of the Gaussian gives
All methods make use of the well-known asymptotic formula for p modes (Tassoul, 1980):
where l is the spherical harmonic number of the mode and n is its radial order. The constant
Rotation will introduce splitting of each mode into
The detection of a regular frequency spacing is commonly achieved using the power spectrum of the power spectrum of the light curve or by autocorrelation. The autocorrelation,
The method used here most closely resembles that of Mathur et al. (2010) in that the presence of equally-spaced frequencies in some region of the power spectrum of the light curve is detected. A suitably small region of the power spectrum of the light curve is selected and the autocorrelation function is calculated. If a pattern of equally-spaced frequencies exists in this region, the autocorrelation function will display a periodic variation with period equal to the frequency separation. The amplitude of the periodic variation depends on the strength of the correlation and follows the bell shape seen in the amplitude envelope of the solar-like oscillations in the power spectrum of the light curve.
The frequency range,
To measure the period of the autocorrelation function, it is convenient to calculate the power spectrum of the autocorrelation. This is actually the same as the power spectrum of the power spectrum of the light curve. However, it was found that removing the large maximum at zero lag, which is always present in the autocorrelation, leads to a cleaner power spectrum. The period of variation in the autocorrelation, if any exists, is given by the inverse of the frequency of the highest peak in the power spectrum of the modified autocorrelation. Its amplitude measures the significance of the period.
In the method used here, the autocorrelation is calculated at equal frequency steps in the power spectrum of the light curve. Let ν be the central frequency at which the autocorrelation is calculated. The power spectrum of the autocorrelation function is plotted at this frequency. If a solar-like oscillation is present, a significant peak will occur in this power spectrum at a period given by
The value of
After a suitable list of candidate stars is compiled and the Lomb-Scargle power spectra calculated, the power spectrum of the modified correlation is plotted as a function of
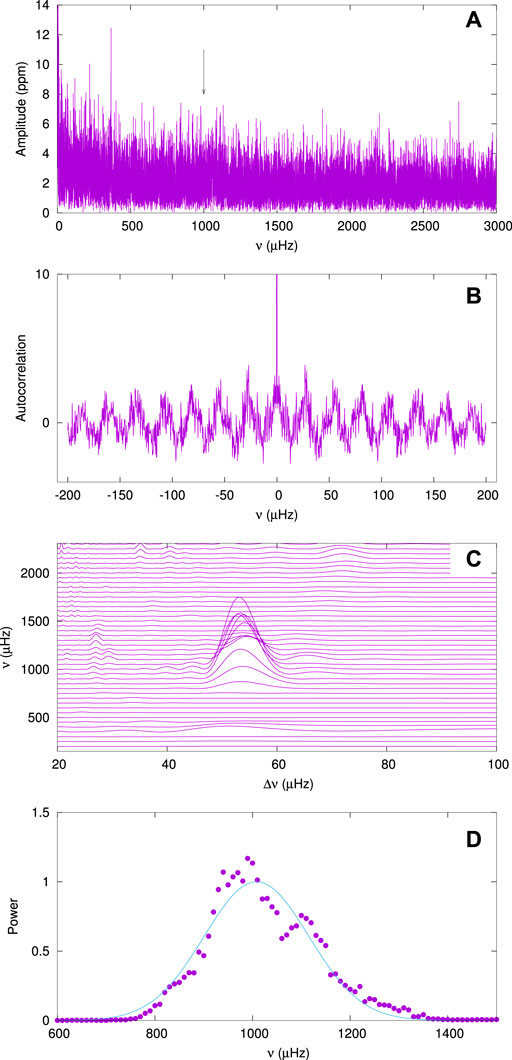
FIGURE 2. Panel (A) shows the amplitude periodogram for KIC 3219634, the arrow indicating
The detection of the “humps” which represent a region of high autocorrelation is never a problem as they always have high signal-to-noise. The example of Figure 2C is fairly typical. The main problem is that for some stars many similar humps and/or ridges are visible. For example, eclipsing binaries have significant power at large harmonics which appear as ridges in the ν–
Results
Of the 2,347 stars with
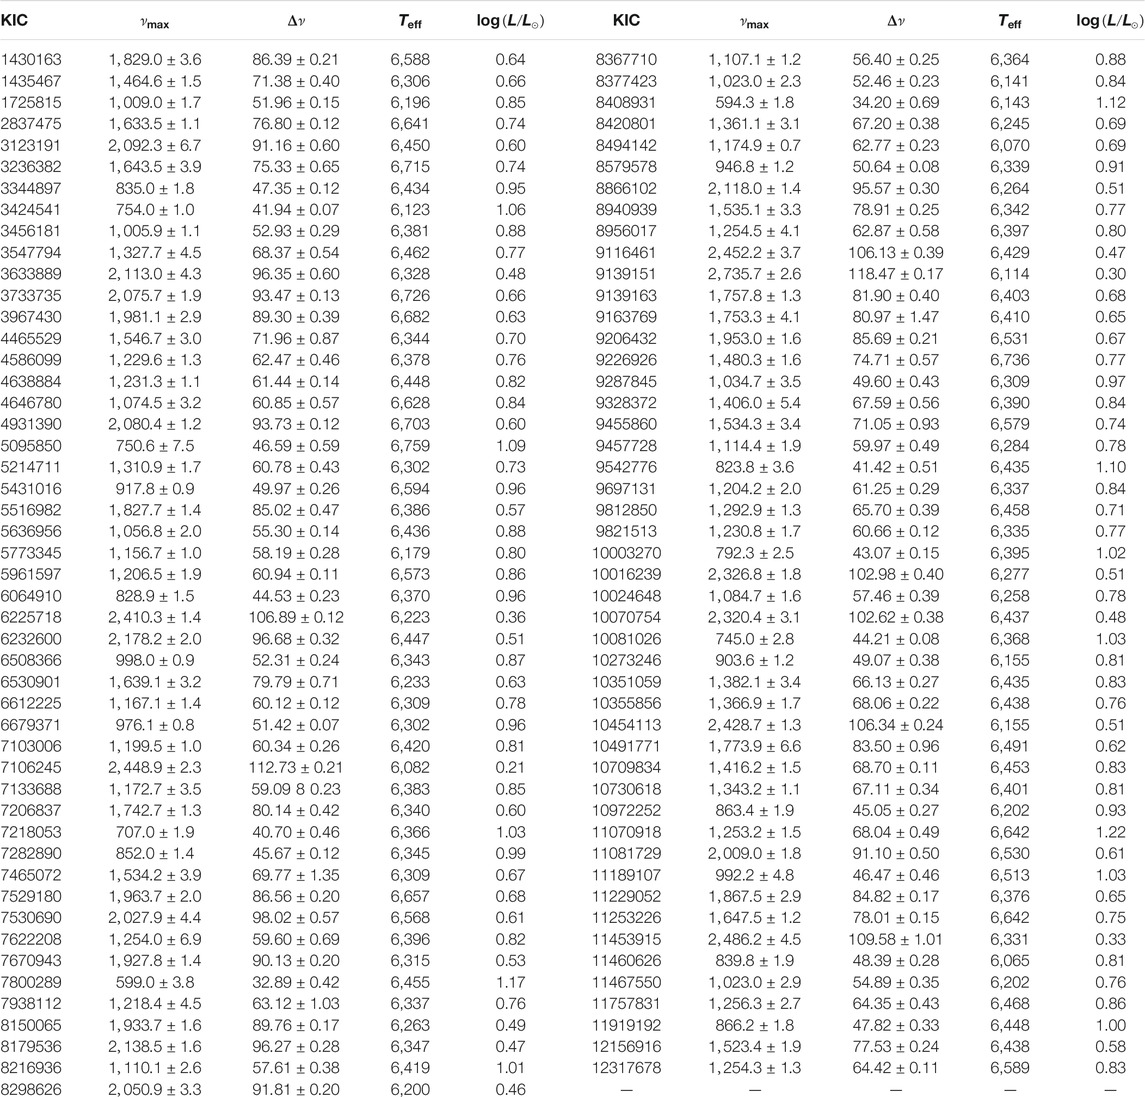
TABLE 1. Table of known stars with solar-like oscillations. The first column is the KIC number. The values of
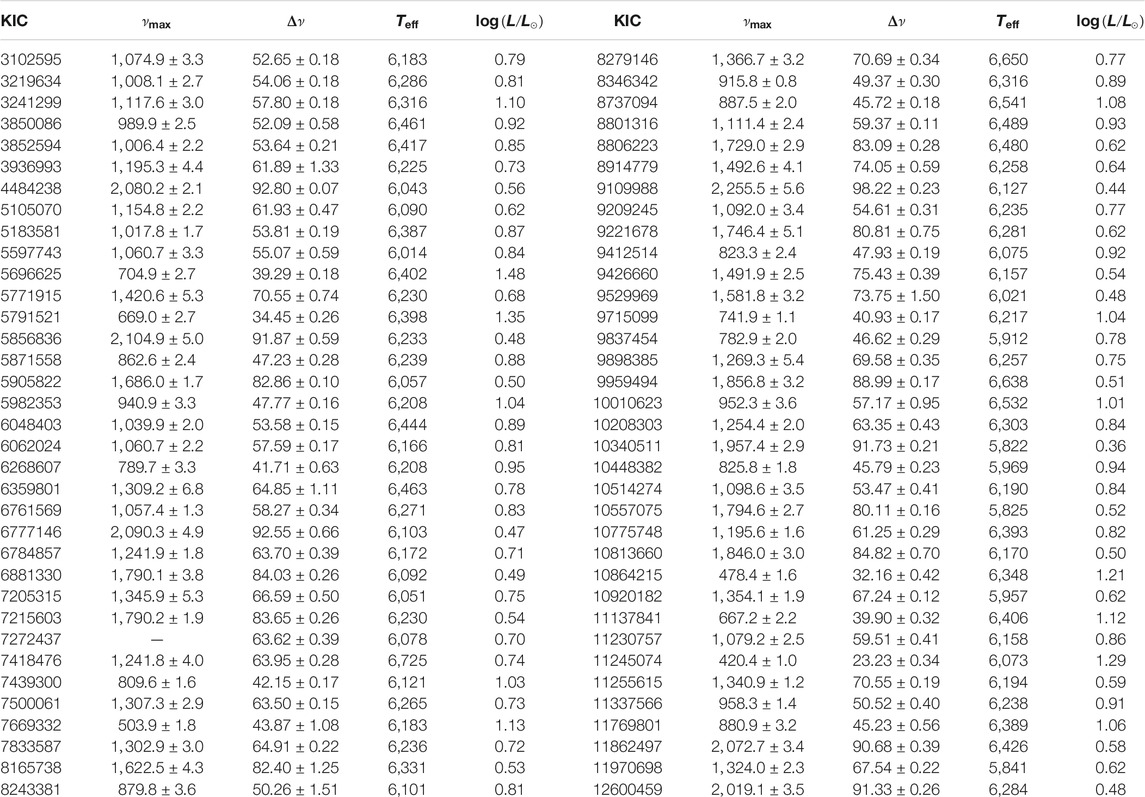
TABLE 2. Newly-discovered stars with solar-like oscillations. The columns are the same as Table 1.
Figure 3 shows the large separation,
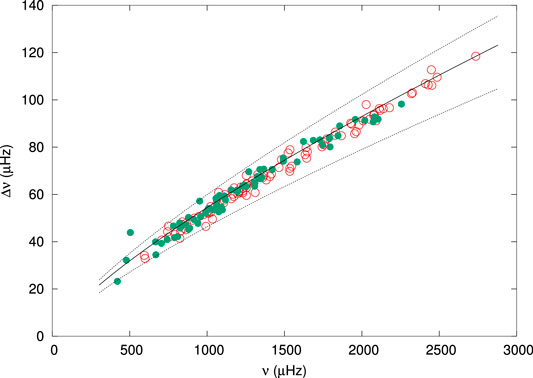
FIGURE 3. The large separation,
Figure 4 compares the values of
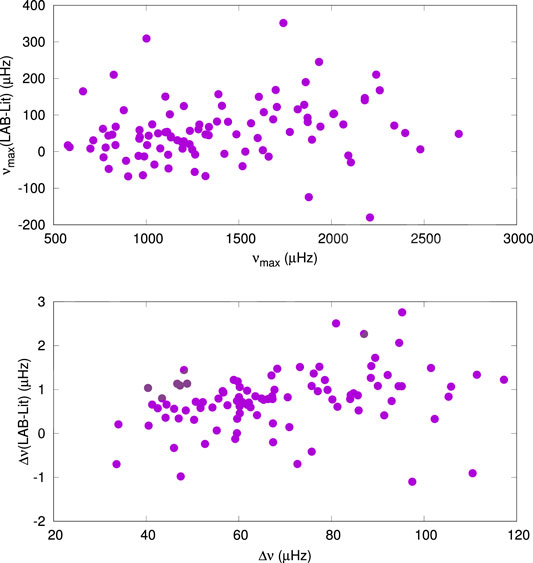
FIGURE 4. Comparison of
The top panel in Figure 5 shows the location of the 167 stars with solar-like oscillations in the H-R diagram as well as the δ Sct and γ Dor region of instability from Balona (2018). The bottom panel shows the location of the 2,347 stars in our sample. This is to show that there is a uniform decrease of density of stars with increasing
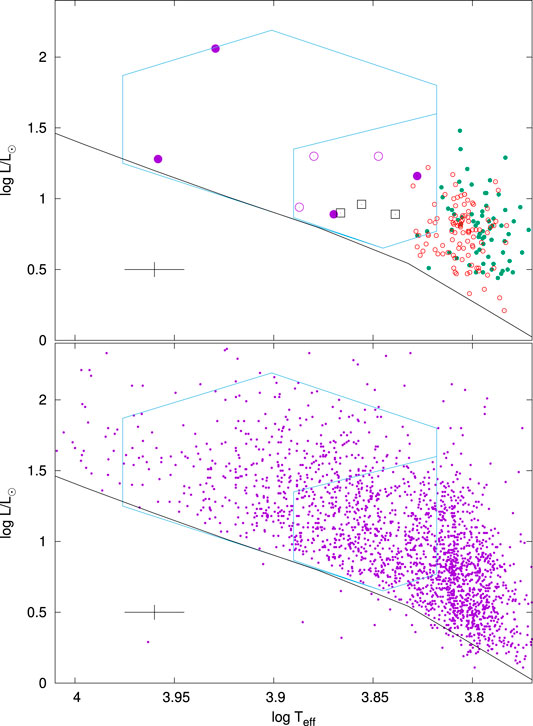
FIGURE 5. Top panel: the location in the H–R diagram of stars in Tables 1–3. Newly detected stars are shown by the small filled green circles and known stars by small open red circles. The large symbols are stars with possible solar-like oscillations: violet filled circles—non-variable stars; violet open circles: δ Sct; black squares—γ Dor stars. Bottom panel: the small filled circles are from the sample of 2,347 stars used to search for solar-like oscillations. The zero-age main sequence for models of solar abundance from Bertelli et al. (2008) is shown (black solid line). The large polygonal region shows the location of δ Sct stars from Balona (2018). The smaller polygon shows the location of the γ Dor stars. The cross at bottom left shows 1 − σ error bars.
Two apparently non-pulsating stars KIC 6448112 (
The ν–
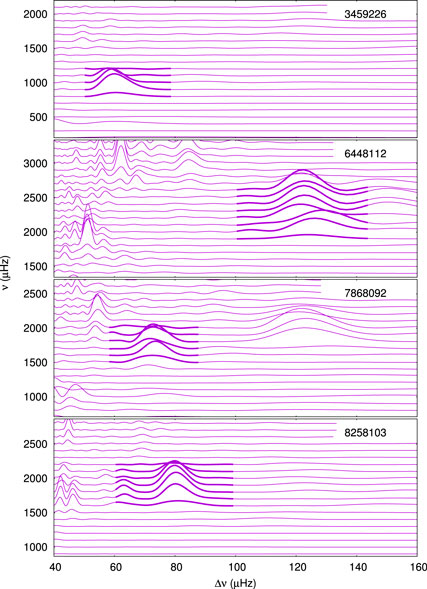
FIGURE 6. The ν–
Indications of solar like oscillations were also detected in three δ Sct stars (KIC 7212040, KIC5̇476495, KIC 9347095), and three γ Dor stars (KIC 9696853, KIC 8264254, KIC 5608334). Once again, many other hump-like features are present as well as ridges in the ν–
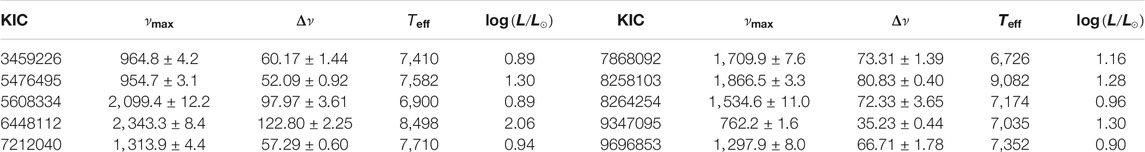
TABLE 3. Stars discussed in the text with possible solar-like oscillations. The columns are the same as in Table 1.
Discussion and Conclusion
In this study an attempt is made to detect solar-like oscillating stars hotter than 6,000 K in order to determine the hot edge of the excitation of solar-like oscillations in main sequence stars. The temperature region examined includes the δ Sct/γ Dor instability strip. Discovery of solar-like oscillations in δ Sct stars would, of course, be of great interest. There are also large numbers of non-pulsating stars within the δ Sct/γ Dor instability strip. Detecting solar-like oscillations in these stars would be much easier than in δ Sct or γ Dor stars because the low-amplitude of solar-like oscillations is likely to be swamped by the much higher amplitudes of self-driven modes.
In order to improve the detection probability, a simple method of detecting solar-like oscillations of low amplitudes (well below the level of detection by inspection of the periodogram) was devised. However, the method does have a significant risk of a false detection. The method does not require smoothing of the periodogram or fitting of a granulation model. In this method, a search is made for equal frequency spacings using autocorrelation. It is found that the power spectrum of the autocorrelation is a powerful tool which easily allows detection of very low-amplitude solar-like oscillations. This is accomplished by inspecting a plot of the power spectrum as a function of frequency (the ν–
Application of this method to stars with
Some uncertain indication of solar like oscillations were detected in four non-variable stars and six pulsating stars inside the δ Sct instability strip. However, the detections are not sufficiently convincing. None of these ten stars constitute sufficient proof that the hot edge of solar-like oscillations extends to within the δ Sct/γ Dor instability strip.
It should be noted that the line-widths in the periodogram of main sequence stars with solar-like oscillations increases with effective temperature (White et al., 2012; Lund et al., 2017; Compton et al., 2019). This is a consequence of the shorter stochastic mode lifetimes. Increase of line broadening results in a decrease of line amplitude for oscillations of the same energy. In addition, the rotation rate increases with
Results presented in the present paper demonstrate, as is already well-known, and as Antoci (2014)Figure 1 nicely illustrates, that the hot edge of solar-like oscillations probably coincides with the cool edge of the δ Sct/γ Dor instability strip. The question arises as to whether physical factors giving rise to self-driven pulsations also act to damp solar-like oscillations. Further study of this problem would require the precision and time span matching that of the Kepler photometry. Hopefully, this may be attained in the not too distant future.
Data Availability Statement
All datasets generated for this study are included in the article.
Author Contributions
The author confirms being the sole contributor of this work and has approved it for publication.
Conflict of Interest
The author declares that the research was conducted in the absence of any commercial or financial relationships that could be construed as a potential conflict of interest.
Acknowledgments
LB wishes to thank the National Research Foundation of South Africa for financial support. This paper includes data collected by the Kepler mission. Funding for the Kepler mission is provided by the NASA Science Mission directorate. This work also used data from the European Space Agency (ESA) mission Gaia (https://www.cosmos.esa.int/gaia), processed by the Gaia Data Processing and Analysis Consortium (DPAC, https://www.cosmos.esa.int/web/gaia/dpac/consortium). Funding for the DPAC has been provided by national institutions, in particular the institutions participating in the Gaia Multilateral Agreement.
References
Aerts, C. (2019). Probing the interior physics of stars through asteroseismology. arXiv e-prints, arXiv:1912.12300
Antoci, V., Cunha, M., Houdek, G., Kjeldsen, H., Trampedach, R., Handler, G., et al. (2014). The role of turbulent pressure as a coherent pulsational driving mechanism: the case of the δ Scuti star HD 187547. Astrophys. J. 796, 118. doi: 10.1088/0004-637X/796/2/118
Antoci, V., Handler, G., Campante, T. L., Thygesen, A. O., Moya, A., and Kallinger, T.et al. (2011). The excitation of solar-like oscillations in a δ sct star by efficient envelope convection. Nature 477, 570–573. doi: 10.1038/nature10389
Antoci, V., Handler, G., Grundahl, F., Carrier, F., Brugamyer, E. J., Robertson, P., et al. (2013). Searching for solar-like oscillations in the δ Scuti star ρ Puppis. Mon. Not. R. Astron. Soc. 435, 1563–1575. doi: 10.1093/mnras/stt1397
Antoci, V. (2014). “Stochastically excited oscillations in the upper main sequence,” in IAU symposium, Wroclaw, Poland, August 19–23, 2013 Precision asteroseismology (Cambridge University Press). Editors J. A. Guzik, W. J. Chaplin, G. Handler, and A. Pigulski, Vol. 301, 333–340. doi: 10.1017/S1743921313014543
Balona, L. A. (2018). Gaia luminosities of pulsating A-F stars in the Kepler field. Mon. Not. R. Astron. Soc. 479, 183–191. doi: 10.1093/mnras/sty1511
Balona, L. A., Daszyńska-Daszkiewicz, J., and Pamyatnykh, A. A. (2015). Pulsation frequency distribution in δ Scuti stars. Mon. Not. R. Astron. Soc. 452, 3073–3084. doi: 10.1093/mnras/stv1513
Bedding, T. R., Murphy, S. J., Hey, D. R., Huber, D., Li, T., Smalley, B., et al. (2020). Very regular high-frequency pulsation modes in young intermediate-mass stars. Nature 581, 147–151. doi: 10.1038/s41586-020-2226-8
Benomar, O., Baudin, F., Chaplin, W. J., Elsworth, Y., and Appourchaux, T. (2012). Acoustic spectrum fitting for a large set of solar-like pulsators. Mon. Not. R. Astron. Soc. 420, 2178–2189. doi: 10.1111/j.1365-2966.2011.20184.x
Bertelli, G., Girardi, L., Marigo, P., and Nasi, E. (2008). Scaled solar tracks and isochrones in a large region of the Z–Y plane. Astron. Astrophys. 484, 815–830. doi: 10.1051/0004-6361:20079165
Borucki, W. J., Koch, D., Basri, G., Batalha, N., Brown, T., Caldwell, D., et al. (2010). Kepler planet-detection mission: introduction and first results. Science 327, 977. doi: 10.1126/science.1185402
Brown, T. M., Gilliland, R. L., Noyes, R. W., and Ramsey, L. W. (1991). Detection of possible p-mode oscillations on Procyon. Astrophys. J. 368, 599. doi: 10.1086/169725
Brown, T. M., Latham, D. W., Everett, M. E., and Esquerdo, G. A. (2011). Keplerinput catalog: photometric calibration and stellar classification. Astron. J. 142, 112. doi: 10.1088/0004-6256/142/4/112
Castelli, F., and Kurucz, R. L. (2003). “New grids of ATLAS9 model atmospheres,” in Modelling of stellar atmospheres, IAU symposium. Editors N. Piskunov, W. W. Weiss, and D. F. Gray, Vol. 210, A20.
Chaplin, W. J., Basu, S., Huber, D., Serenelli, A., Casagrande, L., Silva Aguirre, V., et al. (2014). Asteroseismic fundamental properties of solar-type stars observed by the NASA kepler mission. Astrophys. J. Suppl. Ser. 210, 1. doi: 10.1088/0067-0049/210/1/1
Chaplin, W. J., and Miglio, A. (2013). Asteroseismology of solar-type and red-giant stars. Annu. Rev. Astron. Astrophys. 51, 353–392. doi: 10.1146/annurev-astro-082812-140938
Compton, D. L., Bedding, T. R., and Stello, D. (2019). Asteroseismology of main-sequence F stars with Kepler: overcoming short mode lifetimes. Mon. Not. R. Astron. Soc. 485, 560–569. doi: 10.1093/mnras/stz432
Fridlund, M., Roxburgh, I., Favata, F., and Volonté, S. (2006). “The European space agency’s science program and CoRoT,” in The CoRoT mission pre-launch status—stellar seismology and planet finding. Editors M. Fridlund, A. Baglin, J. Lochard, and L. Conroy, Noordwijk, The Netherlands (New York City, NY: ESA Special Publication), Vol. 1306, 135
Gaia Collaboration Brown, A. G. A., Vallenari, A., Prusti, T., de Bruijne, J. H. J., Babusiaux, C., et al. (2018). Gaia data release 2. Summary of the contents and survey properties. Astron. Astrophys. 616, 22. doi: 10.1051/0004-6361/201833051
Gaia Collaboration Prusti, T., de Bruijne, J. H. J., Brown, A. G. A., Vallenari, A., Babusiaux, C., et al. (2016). The Gaia mission. Astron. Astrophys. 595, A1. doi: 10.1051/0004-6361/201629272
García, R. A., and Ballot, J. (2019). Asteroseismology of solar-type stars. Living Rev. Sol. Phys. 16, 4. doi: 10.1007/s41116-019-0020-1
Gilliland, R. L., Brown, T. M., Kjeldsen, H., McCarthy, J. K., Peri, M. L., Belmonte, J. A., et al. (1993). A search for solar-like oscillations in the stars of M67 with CCD ensemble photometry on a network of 4 M telescopes. Astron. J. 106, 2441–2476. doi: 10.1086/116814
Gontcharov, G. A. (2017). 3D stellar reddening map from 2MASS photometry: an improved version. Astron. Lett. 43, 472–488. doi: 10.1134/S1063773717070039
Huber, D., Bedding, T. R., Stello, D., Hekker, S., Mathur, S., Mosser, B., et al. (2011). Testing scaling relations for solar-like oscillations from the main sequence to red giants usingkeplerdata. Astrophys. J. 743, 143. doi: 10.1088/0004-637X/743/2/143
Huber, D., Stello, D., Bedding, T. R., Chaplin, W. J., Arentoft, T., Quirion, P.-O., et al. (2009). Automated extraction of oscillation parameters for Kepler observations of solar-type stars. Commun. Asteroseismol. 160, 74
Huber, D., Zinn, J., Bojsen-Hansen, M., Pinsonneault, M., Sahlholdt, C., Serenelli, A., et al. (2017). Asteroseismology and Gaia: testing scaling relations using 2200KeplerStars with TGAS parallaxes. Astrophys. J. 844, 102. doi: 10.3847/1538-4357/aa75ca
Kallinger, T., Mosser, B., Hekker, S., Huber, D., Stello, D., Mathur, S., et al. (2010). Asteroseismology of red giants from the first four months of Keplerdata: fundamental stellar parameters. Astron. Astrophys. 522, A1. doi: 10.1051/0004-6361/201015263
Kjeldsen, H., Bedding, T. R., Viskum, M., and Frandsen, S. (1995). Solarlike oscillations in eta Boo. Astron. J. 109, 1313–1319. doi: 10.1086/117363
Leighton, R. B., Noyes, R. W., and Simon, G. W. (1962). Velocity fields in the solar atmosphere. I. Preliminary report. Astrophys. J. 135, 474. doi: 10.1086/147285
Lund, M. N., Aguirre, V. S., Davies, G. R., Chaplin, W. J., Christensen-Dalsgaard, J., Houdek, G., et al. (2017). Standing on the shoulders of dwarfs: the Kepler Asteroseismic LEGACY sample. I. Oscillation mode parameters. Astrophys. J. 835, 172. doi: 10.3847/1538-4357/835/2/172
Lund, M. N., Chaplin, W. J., and Kjeldsen, H. (2012). A new method to detect solar-like oscillations at very low S/N using statistical significance testing. Mon. Not. R. Astron. Soc. 427, 1784–1792. doi: 10.1111/j.1365-2966.2012.22098.x
Mathur, S., García, R. A., Régulo, C., Creevey, O. L., Ballot, J., Salabert, D., et al. (2010). Determining global parameters of the oscillations of solar-like stars. Astron. Astrophys. 511, A46. doi: 10.1051/0004-6361/200913266
Mathur, S., Huber, D., Batalha, N. M., Ciardi, D. R., Bastien, F. A., Bieryla, A., et al. (2017). Revised stellar properties of kepler targets for the Q1-17 (DR25) transit detection run. Astrophys. J. Suppl. Ser. 229, 30. doi: 10.3847/1538-4365/229/2/30
Mosser, B., and Appourchaux, T. (2009). On detecting the large separation in the autocorrelation of stellar oscillation times series. Astron. Astrophys. 508, 877–887. doi: 10.1051/0004-6361/200912944
Samadi, R., Goupil, M.-J., and Houdek, G. (2002). Solar-like oscillations inδ Scuti stars. Astron. Astrophys. 395, 563–571. doi: 10.1051/0004-6361:20021322
Serenelli, A., Johnson, J., Huber, D., Pinsonneault, M., Ball, W. H., Tayar, J., et al. (2017). The first APOKASC catalog of kepler dwarf and subgiant stars. Astrophys. J. Suppl. Ser. 233, 23. doi: 10.3847/1538-4365/aa97df
Smith, J. C., Stumpe, M. C., Van Cleve, J. E., Jenkins, J. M., Barclay, T. S., Fanelli, M. N., et al. (2012). Kepler Presearch data conditioning II—A Bayesian approach to systematic error correction. PASP 124, 1000–1014. doi: 10.1086/667697
Stello, D., Bruntt, H., Preston, H., and Buzasi, D. (2008). Oscillating K giants with the WIRE satellite: determination of their asteroseismic masses. Astrophys. J. 674, L53. doi: 10.1086/528936
Stello, D., Chaplin, W. J., Basu, S., Elsworth, Y., and Bedding, T. R. (2009). The relation between Δν and νmax for solar-like oscillations. Mon. Not. R. Astron. Soc. 400, L80–L84. doi: 10.1111/j.1745-3933.2009.00767.x
Stumpe, M. C., Smith, J. C., Van Cleve, J. E., Twicken, J. D., Barclay, T. S., Fanelli, M. N., et al. (2012). Kepler presearch data conditioning I-architecture and algorithms for error correction in kepler light curves. Publ. Astron. Soc. Pac. 124, 985–999. doi: 10.1086/667698
Tassoul, M. (1980). Asymptotic approximations for stellar nonradial pulsations. Astrophys. J. Suppl. Ser. 43, 469–490. doi: 10.1086/190678
White, T. R., Bedding, T. R., Gruberbauer, M., Benomar, O., Stello, D., Appourchaux, T., et al. (2012). Solving the mode identification problem in asteroseismology of F stars observed with kepler. Astrophys. J. 751, L36. doi: 10.1088/2041-8205/751/2/L36
Keywords: solar-like oscillations, stellar pulsation, asteroseismology, δ Scuti stars, γ Doradus stars, asteroseismology
Citation: Balona LA (2020) The Hot Limit of Solar-like Oscillations From Kepler Photometry. Front. Astron. Space Sci. 7:529025. doi: 10.3389/fspas.2020.529025
Received: 22 January 2020; Accepted: 24 September 2020;
Published: 29 October 2020.
Edited by:
Antony Eugene Lynas-Gray, University College London, United KingdomReviewed by:
Tiago Campante, Instituto de Astrofísica e Ciências do Espaço (IA), PortugalAndrzej S. Baran, Pedagogical University of Kraków, Poland
Copyright © 2020 Balona. This is an open-access article distributed under the terms of the Creative Commons Attribution License (CC BY). The use, distribution or reproduction in other forums is permitted, provided the original author(s) and the copyright owner(s) are credited and that the original publication in this journal is cited, in accordance with accepted academic practice. No use, distribution or reproduction is permitted which does not comply with these terms.
*Correspondence: Luis A. Balona, bGFiQHNhYW8uYWMuemE=