 Teresa Fornaro1,2*
 John R. Brucato1
 Giovanni Poggiali1,3
 Maria Angela Corazzi1,3
 Malgorzata Biczysko4Maguy Jaber5
 Dionysis I. Foustoukos2Robert M. Hazen2Andrew Steele2
- 1INAF-Astrophysical Observatory of Arcetri, Florence, Italy
- 2Earth and Planets Laboratory, Carnegie Institution for Science, Washington, DC, United States
- 3Department of Physics and Astronomy, University of Florence, Florence, Italy
- 4International Centre for Quantum and Molecular Structures, Physics Department, College of Science, Shanghai University, Shanghai, China
- 5Laboratoire d’Archéologie Moléculaire et Structurale, Sorbonne Université, Paris, France
The search for molecular biosignatures at the surface of Mars is complicated by an intense irradiation in the mid- and near-ultraviolet (UV) spectral range for several reasons: (i) many astrobiologically relevant molecules are electronically excited by efficient absorption of UV radiation and rapidly undergo photochemical reactions; (ii) even though the penetration depth of UV radiation is limited, aeolian erosion continually exposes fresh material to radiation; and (iii) UV irradiation generates strong oxidants such as perchlorates that can penetrate deep into soils and cause subsurface oxidative degradation of organics. As a consequence, it is crucial to investigate the effects of UV radiation on organic molecules embedded in mineral matrices mimicking the martian soil, in order to validate hypotheses about the nature of the organic compounds detected so far at the surface of Mars by the NASA Mars Science Laboratory’s (MSL) Curiosity rover, as well as organics that will be possibly found by the next rover missions Mars 2020 (NASA) and ExoMars 2022 (ESA-Roscosmos). In addition, studying the alteration of possible molecular biosignatures in the martian environment will help to redefine the molecular targets for life detection missions and devise suitable detection methods. Here we report the results of mid- and near-UV irradiation experiments of Mars soil analog samples obtained adsorbing relevant organic molecules on a clay mineral that is quite common on Mars, i.e. montmorillonite, doped with 1 wt% of magnesium perchlorate. Specifically, we chose to investigate the photostability of a plausible precursor of the chlorohydrocarbons detected on Mars by the Curiosity rover, namely phthalic acid, along with the biomarkers of extant life L-phenylalanine and L-glutamic acid, which are proteomic amino acids, and adenosine 5’-monophosphate, which is a nucleic acid component. We monitored the degradation of these molecules adsorbed on montmorillonite through in situ spectroscopic analysis, investigating the reflectance properties of the samples in the Near InfraRed (NIR) spectral region. Such spectroscopic characterization of molecular alteration products provides support for two upcoming robotic missions to Mars that will employ NIR spectroscopy to look for molecular biosignatures, through the instruments SuperCam on board Mars 2020, ISEM, Ma_Miss and MicrOmega on board ExoMars 2022.
Introduction
Searching for molecular biosignatures is one of the primary goals of international Mars exploration programs (Des Marais et al., 2008; Walter et al., 2016). One of the most important findings of the Mars Science Laboratory (MSL) mission is the presence of organic matter in the top five centimeters of the martian regolith and within drilled mudstones (Glavin et al., 2013; Freissinet et al., 2015; Steele et al., 2016; Eigenbrode et al., 2018). However, the nature of such organic matter is still unclear because of possible molecular transformations occurring inside the instrument used for their detection (Millan et al., 2016; Miller et al., 2016). Specifically, the MSL’s Curiosity rover used the SAM instrument (Mahaffy et al., 2012) that heats up to 875°C the samples collected from the Martian regolith and monitors the volatiles released from the samples using a mass spectrometer. This kind of measurement can alter the original molecules due to thermal decomposition and chemical reactions with other inorganic species released from the soil like perchlorates. In order to identify the original material is therefore necessary to carry out non-destructive analyses. Two upcoming robotic missions, NASA Mars 2020 (Williford et al., 2018) and ESA-Roscosmos ExoMars 2022 (Vago et al., 2017), will have on board their rovers, named Perseverance and Rosalind Franklin, respectively, space flight instruments based on Near InfraRed (NIR) vibrational spectroscopy to inspect non-destructively the presence of organic matter at the respective landing sites. Specifically, Mars 2020 will be equipped with a remote-sensing instrument located on the “head” of the rover’s mast, SuperCam, which is a combined remote-sensing instrument implementing several techniques (Wiens et al., 2017): Laser Induced Breakdown Spectroscopy (LIBS) (1064 nm laser), to measure elemental composition of targets up to 7 m distance from the rover; Raman (532 nm laser), Time-Resolved Fluorescence (TRF), visible and Near InfraRed (NIR) reflectance spectroscopy (in the spectral ranges 400–900 nm and 1.3–2.6 µm, respectively), to investigate mineralogy and presence of possible organics.
ExoMars 2022 will have 3 NIR instruments, namely ISEM (Infrared Spectrometer for ExoMars), Ma_MISS (Mars Multispectral Imager for Subsurface Studies), and MicrOmega (Vago et al., 2017). ISEM is a spectrometer mounted on the “head” of the rover’s mast, co-aligned with the panoramic camera PanCam, which will measure IR spectra of solar light reflected by surface targets in the spectral range from 1.15 to 3.3 µm, to determine mineralogical composition at hundreds of meters distance, with a spatial resolution of 3–10 cm (Korablev et al., 2017). Together with PanCam, ISEM will be tasked to select remotely the target site to be analyzed more closely with other payload instruments. Ma_MISS is a miniaturized spectrometer integrated with the rover’s drill, capable of reaching 2 m depth, which will acquire reflectance spectra in the spectral range from 0.5 to 2.3 µm, with a spatial resolution of 120 μm, and study stratigraphy and mineralogical composition as a function of depth (De Sanctis et al., 2017). The capability to reach the subsurface will facilitate investigation of environments with higher preservation potential, and Ma_MISS in situ measurements will provide information on subsurface materials in their natural setting before crushing and subsequent analysis with MicrOmega. MicrOmega is a visible and NIR imaging microspectrometer, capable of acquiring monochromatic images at high resolution (20 µm × 20 µm per pixel) on a 5 mm × 5 mm field of view, with 20 cm−1 spectral sampling from 0.95 to 3.65 µm, along with few images at discrete wavelengths from 0.5 to 0.9 µm (Bibring et al., 2017). This instrument will characterize mineralogical composition and presence of organics at a scale of mineral grains, identifying non-destructively regions of interest for further examination with other payload instruments.
Given the importance of spectroscopic analysis to select the most interesting samples to further study with other payload instruments, a correct interpretation of vibrational spectroscopic data is essential for the success of these missions. However, the great variety of environmental factors and physico-chemical interactions that occur between organic molecules and minerals make vibrational spectra quite complex (Fornaro et al., 2013b). Vibrational spectroscopy is particularly sensitive to molecule-mineral interactions because different chemical functional groups give rise to characteristic vibrational bands that undergo significant changes as consequence of such interactions. Indeed, shifts of vibrational frequencies of molecular functional groups and mineral surface sites involved in the interaction can be observed to higher values in case the chemical bonds of these functional groups are strengthened, or to lower values in case they are weakened by the interaction. Band intensity variations can occur depending on molecular spatial arrangements as imposed by surface selection rules. New bands appear in the spectra due to formation of chemical bonds as a consequence of chemisorption. As an example, in the case of important biomarkers such as the components of nucleic acids, remarkable changes can be observed in the following cases: i) the phosphate group forms covalent bonds with surface sites that lower symmetry and a splitting of its symmetric stretching mode is observed (Fornaro et al., 2018a); ii) the carbonyl or amino groups of the nucleobases are involved in hydrogen bonds that weaken their chemical bonds and their stretching vibrational modes undergo red-shifts up to hundreds of cm−1 (Fornaro et al., 2015a; Fornaro et al., 2015b; Fornaro et al., 2016); and (iii) nucleobases are adsorbed parallel to the surface, canceling the dynamic dipole moment perpendicular to the surface for vibrational modes in the plane of the aromatic ring, and no bands in the spectrum will be observed for these modes (Fornaro et al., 2013b). The nature of physico-chemical interactions established between molecules and minerals are affected by multiple factors: molecular properties; mineral characteristics; molecule-mineral concentration ratio; and environmental conditions of temperature, pressure, ionic strength, pH, presence of reactive species etc. (Fornaro et al., 2013a; Fornaro et al., 2018b). For instance, at very high molecular concentrations, nucleotides and related molecules tend to form clusters on the mineral surface through strong intermolecular interactions of stacking or hydrogen bonds among nucleobases, with spectroscopic characteristics similar to those of the molecular solid. Therefore, in these cases, it is not possible to observe the spectroscopic features due to molecule-mineral interactions. Moreover, pH influences the molecular protonation state and surface charge and, hence, the possible involvement of electrostatic interactions in the adsorption process. Furthermore, some ions can inhibit bonding to surface sites by interacting with specific molecular functional groups, or favor molecular adsorption by acting as bridges with the mineral surface sites and forming surface complexes with the molecules.
Organic molecules and minerals on Mars are also affected by chemical weathering due to irradiation and oxidative degradation (Fornaro et al., 2018c and references therein; Pavlov et al., 2002). Indeed, the present atmosphere of the planet enables mid- and near-UV radiation, galactic cosmic rays (GCR) and solar energetic protons (SEP) to reach the surface. The RAD instrument on board the Curiosity rover has measured a flux of ionizing radiations from GCR of 233 ± 12 µGray per day, which has a negligible effect on survivability of possible microbial lifeforms on Mars, with sporadic events of SEP that last a few days and increase the dose of about 50 µGray (Hassler et al., 2014). Moreover, even though GCR can penetrate several meters in the Marian soil, measurable effects on organic matter apparently require hundreds of millions of years (Gerakines et al., 2012). On the other hand, organic molecules effectively absorb UV radiation, causing electronic excitation and photochemical reactions at very short timescales of a few hours (Fornaro et al., 2013b; Fornaro et al., 2018a; Poggiali et al., 2020; ten Kate, 2010) . In addition, even though UV penetrates only a few µm or mm into the soil, aeolian erosion constantly exposes fresh material to radiation. As a consequence, it is crucial to investigate the effects of UV radiation on organic molecules embedded in mineral matrices mimicking the martian soil, in order to validate hypotheses about the nature of the organic compounds detected so far at the surface of Mars by the Curiosity rover (Eigenbrode et al., 2018; Freissinet et al., 2015; Glavin et al., 2013; Steele et al., 2018; Steele et al., 2012), as well as organics that will be possibly found by the next rover missions Mars 2020 collecting surficial samples or ExoMars 2022 collecting subsurface samples. The ExoMars 2022 landing site, Oxia Planum, underwent an extensive aeolian erosion that exposed at the surface material of less than 100 million years (Vago et al., 2017). As estimated by previous studies (Fornaro et al., 2018c), we would expect that GCR and SEP had a limited effect on possible organics in this site, while UV degradation occurred at much shorter timescales but only in the near surface. However, UV also causes secondary effects such as photo-induced formation of oxidants in the soil (Lasne et al., 2016), which might cause oxidative degradation up to a depth in the martian soil that is difficult to predict. Specifically, perchlorates have been detected both by orbital observations and in situ analyses by the Phoenix lander and the Curiosity rover, at a concentration between 0.05 and 1.05 wt% (Clark and Kounaves, 2016). Perchlorates have also been found in the martian meteorite EETA79001 (with a concentration of 0.6 ± 0.1 ppm by mass) (Kounaves et al., 2014), confirming their ubiquity on Mars. It is also true that ExoMars will analyze samples that have been in the subsurface for many millions of years at constant temperature of about −60°C, at which perchlorates are more stable and oxidation kinetics is very slow. Nevertheless, it is not possible to exclude that the interactions of perchlorates with GCR (capable of penetrating many meters) cause decomposition of perchlorate also at low temperature, giving rise to oxychlorine species, radicals, molecular oxygen and hydrogen peroxide, which in turn may degrade organics. Hydrogen peroxide is characterized by low thermal stability and can produce hydroxyl and peroxide radicals in the presence of ferrous minerals through the Fenton process (Foustoukos and Stern, 2012). Such chemical weathering phenomena might cause profound alterations of the original material, such as breakage of chemical bonds and formation of new molecular species, significantly influencing relative spectroscopic features. Such transformations must be taken into account to redefine molecular targets for life detection.
For these reasons, assignment of spectroscopic features cannot be based solely on databases for pure minerals and pure molecules measured under terrestrial ambient conditions; rather, it is indispensable to perform laboratory studies with analogs of the martian soil, prepared simulating realistically the martian environment, to interpret accurately mission data. In addition, NIR data and relative vibrational mode assignments for organics, both pure and adsorbed on mineral matrices, are scarce in the literature (Clark et al., 2009). Indeed, the only fundamental vibrational modes in this spectral region for organics are O-H, N-H and C-H stretching, and they occur around 3,000 cm−1 where water gives strong and broad absorption, potentially obscuring molecular features. Beyond these fundamental bands, organics present overtones and combination bands in the NIR, but these modes are forbidden by primary vibrational selection rules, so they are usually very weak and often covered by much more intense mineral bands. As consequence, most literature studies for organics focus on the mid-IR spectral range, where very intense fundamental bands and the fingerprint region for organic molecules are present. Therefore, there is a great need of complementing vibrational studies for organics in the NIR, in order to be able to detect and identify organics on Mars from data acquired in this spectral range.
In this paper, we present laboratory analog studies concerning: i) preparation of analog samples, obtained adsorbing relevant organic molecules – i.e. a plausible precursor of the chlorohydrocarbons detected on Mars by Curiosity, namely phthalic acid, as well as the biomarkers of extant life L-phenylalanine and L-glutamic acid, which are proteomic amino acids, and adenosine 5’-monophosphate, which is a nucleic acid component - at various concentrations on a common martian clay mineral, montmorillonite, doped with 1 wt% of magnesium perchlorate; ii) mid- and near-UV irradiation processing, to investigate possible transformations of organics and define more accurately targets to search in surficial samples; iii) Near InfraRed characterization in situ, aided by computational spectroscopy at Density Functional Theory level to facilitate assignment of vibrational modes. These investigations represent the starting point of a systematic study with analog samples composed of several combinations of relevant minerals, salts, oxidants, and different classes of organic compounds at various concentrations, prepared with methods mimicking natural processes that possibly occurred through time at the landing sites selected for ExoMars 2022 and Mars 2020, i.e., Oxia Planum and Jezero Crater, respectively. At this first stage, we performed equilibrium adsorption experiments in the aqueous phase, in which the physical contact between an aqueous solution of the organics and the mineral powder is protracted for a time sufficient to reach the equilibrium state, so that molecules can establish physico-chemical interactions with minerals as in natural adsorption processes (Fornaro et al., 2018a). Such conditions mimic possible processes of molecular adsorption on minerals that might have occurred in early aqueous Martian environments for a time plausibly long enough to reach equilibrium. Different adsorption methods simulating other possible conditions will be investigated in future studies. Focusing on aqueous environments, for this work we chose to investigate organic compounds soluble in water. On one hand, we considered a compound like phthalic acid, which has been stated as possible precursor of the chlorohydrocarbons detected in 3-Gyr-old mudstones at Gale crater on Mars by the Sample Analysis at Mars (SAM) instrument on board the Curiosity rover. Indeed, analog experiments conducted under conditions similar to SAM gas chromatography-mass spectrometry analyses, pyrolyzing potential precursor compounds in the presence of various Cl salts and Fe oxides identified in Martian sediments, indicated phthalic acid as good precursor candidate (Miller et al., 2016). On the other hand, we considered biomarkers highly diagnostic of life such as AMP, which is a fundamental component of the informational biomolecules DNA and RNA, along with the amino acids L-glutamic acid and L-phenylalanine, which are components of proteins. Specifically, L-glutamic acid is one of the most abundant amino acids in proteins and, at the same time, is also barely detected in meteorites (Hand et al., 2016). Moreover, L-glutamic acid is particularly interesting for its resistance to racemization (Steel et al., 2017). L-glutamic acid is an aliphatic amino acid characterized by a charged side chain, so to increase diversity we wanted to investigate also an aromatic amino acid characterized by a hydrophobic side chain such as L-phenylalanine.
Regarding minerals, clays are of great relevance in the context of astrobiology because they are indications of aqueous alterations processes occurred on early Mars (Nazari-Sharabian et al., 2020). Moreover, clay minerals like smectites tend to accumulate organics due to their large surface area and optimal interlayer sites and favor preservation of organic molecules because their fine particles aggregate forming small pores that limit penetration of fluids and damaging radiations (Negron-Mendoza and Ramos-Bernal, 2004). Fe/Mg smectites are the most common clay minerals reported by orbital spectroscopy (Carter et al., 2013) and have been identified also in situ by the Curiosity rover at Gale crater (McLennan et al., 2014; Vaniman et al., 2014). Orbital data indicate that clays are present at both ExoMars 2022 (Quantin et al., 2016; Ivanova et al., 2020) and Mars 2020 (Schon et al., 2012; Salvatore et al., 2018) landing sites. Thus, we started our investigations using the smectite montmorillonite, with the intent to extend future studies to other clays relevant to the mineralogy of the ExoMars 2022 and Mars 2020 landing sites. Moreover, this first set of samples obtained with a single mineral phase represents samples observable at grain scale, but in future studies we intend to prepare samples of increasing complexity with mixtures of minerals that are more representative of samples observable at larger scale.
This series of studies will allow the assembly of custom databases of vibrational features to be used as a reference dataset to deconvolve complex features of actual martian samples and interpret in situ NIR measurements to assist ExoMars 2022 and Mars 2020 in identifying organics at the respective landing sites.
Materials and Methods
Preparation and Characterization of Mars Soil Analog Samples
As mineral substrate, we used a Ca-rich montmorillonite (“Cheto”), from County of Apache, State of Arizona, United States, called “Cheto” SAz-1, purchased from the Clay Mineral Society. Mineral phases were characterized at the Earth and Planets Laboratory of the Carnegie Institution for Science (Washington DC, United States) by making use of: i) X-Ray Fluorescence (XRF) using a SPECTRO XEPOS (AMETEK) instrument to determine chemical composition; ii) powder X-Ray Diffraction (XRD) using a Bruker D2 Phaser instrument to confirm mineralogy; and iii) Isotope Ratio Mass Spectrometry (IRMS) using a Thermo Scientific Delta V Plus mass spectrometer interfaced with a CE Instruments NC 2500 series Elemental Analyser (EA) to estimate the organic content originally present in the montmorillonite sample. Then, we devised a cleaning procedure to extract the organic contamination from this mineral through four extraction steps with different solvent systems: 1) Methanol + sonication for ½ h; 2) 40% Acetone in water + sonication for ½ h; 3) 0.1 M sodium pyrophosphate (Na4P2O7•10H2O) + sonication for ½ h; 4) Water + rotation for ½ h. We used a mineral concentration of 150 g L-1 in each step, and we alternated each extraction step with centrifugation and supernatant separation. Eventually we oven-dried the pellet at 50°C.
Given the ubiquity of perchlorates in the martian soil, we also prepared montmorillonite samples containing 1 wt% of magnesium perchlorate. Specifically, we impregnated the previously treated montmorillonite with 1 wt% of Mg(ClO4)2∙6H2O (Fisher Scientific) dissolved in milli-Q water. We agitated the suspension through magnetic stirring to homogenize and then we dried in an oven at 40°C.
To verify possible changes in mineral properties due to the presence of 1 wt% of magnesium perchlorate, we characterized the montmorillonite samples before and after impregnation with magnesium perchlorate through several techniques: XRD, IR, Raman, Transmission Electron Microscopy (TEM), Brunauer-Emmett-Teller (BET) surface area analysis, and solid state Nuclear Magnetic Resonance (NMR). IR measurements were performed using a single beam double pendulum interferometer Vertex 70v (Bruker), equipped with a Praying MantisTM Diffuse Reflection Accessory (Harrick DRIFT), in order to measure diffuse reflectance spectra, available at INAF-Astrophysical Observatory of Arcetri (Florence, Italy). Raman spectra and images were collected using a Witec α-Scanning Near-Field Optical Microscope that has been customized to incorporate confocal Raman spectroscopic imaging, available at the Earth and Planets Laboratory of the Carnegie Institution for Science (Washington DC, United States). The excitation source is a frequency-doubled solid-state YAG laser (532 nm) operating between 0.3 and 1 mW output power (dependent on objective), as measured at the sample using a laser power meter. Objective lenses used included a ×100 LWD and a x20 LWD with a 50 μm optical fiber acting as the confocal pin hole. Spectra were collected on a Peltier-cooled Andor EMCCD chip, after passing through a f/4 300 mm focal length imaging spectrometer typically using a 600 lines/mm grating. The lateral resolution of the instrument is as small as 360 nm in air when using the x100 LWD objective, with a focal plane depth of ∼800 nm. A cosmic ray reduction routine was used to reduce the effects of stray radiation on Raman images, as was image thresholding to reject isolated bright pixels. Fluorescence effects were inhibited by the use of specific peak fitting and flattening. TEM measurements of the samples were performed using a JEOL100CX microscope, available at Sorbonne Université (Paris, France). Specifically, samples in the form of bulk powders were suspended in ethanol and then deposited on 400-mesh copper grids covered with an ultrathin carbon membrane of 2-3 nm thickness. N2 adsorption–desorption isotherms at −196 °C were obtained on a Micromeritics ASAP 2020 instrument, available at Sorbonne Université (Paris, France). Prior to measurement, the samples (40 mg) were degassed under vacuum for 3 h at 250 °C. The Brunauer–Emmett–Teller (BET) surface areas were calculated from the BET equation for a relative pressure (P/P0) range between 0.05 and 0.25. 1H and 27Al and 29Si Magic angle spinning (MAS) nuclear magnetic resonance (NMR) spectra were obtained on a Bruker Advance III spectrometer equipped with a 2.5 mm and 4 mm H-X MAS probe, operating at frequency of 500.07 MHz (1H), 99.36 MHz (29Si) and 130.30 MHZ (27Al), available at Sorbonne Université (Paris, France). Chemical shifts were calibrated using the carboxyl signal of adamantane (38.52 ppm) for 1H, TMS (0 ppm) for 29Si and Al(NO3)3 (0 ppm) for 27Al as external standard. The 1H experiment using 90° pulse was recorded with a spinning rate of 14 kHz, with a number of scans of 128 and 1 s of recycle delay. Over an acquisition time of 40 ms, the number of scans to obtain the spectra depends on the S/N obtained for each sample. The 27Al experiment using 30° pulse was recorded in the same condition of spinning rate (14 kHz), with 2048 scans, 263 kHz spectral width, and 500 ms of recycle delay. The 29Si experiment using 90° pulse with a 1H decoupling spinal was recorded in the same condition of spinning rate. The number of scans was 8192 and the recycling time D1 was 10 s. The Spectra were processed with a zero-filling factor of 2 and without an exponential decay.
We used treated montmorillonite samples as substrates for performing adsorption experiments of adenosine 5’-monophosphate sodium salt (AMP), L-glutamic acid monosodium salt monohydrate 98% (GLU), L-phenylalanine ≥ 98% (PHE), and phthalic acid ≥ 99.5% (PHA) (all purchased from Sigma-Aldrich), both as individual molecules and as a mixture (MIX), at three different concentrations, i.e., 5, 1, and 0.1 wt%. Chemical structures for these molecules are shown in Figure 1.
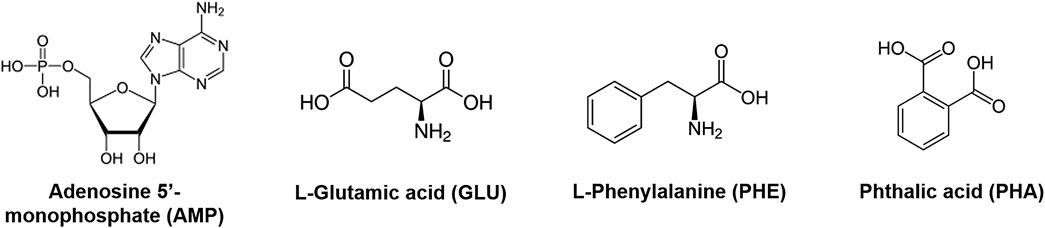
FIGURE 1. Chemical structures for adenosine 5’-monophosphate (AMP), L-glutamic acid (GLU), L-phenylalanine (PHE), and phthalic acid (PHA).
In order to simulate the formation of molecule-mineral complexes in diluted aqueous environments presumably present on early Mars, we performed equilibrium adsorption experiments in the aqueous phase (Fornaro et al., 2018a). Specifically, we dissolved specific amounts of the above-mentioned molecules, both individually and as a mixture, in a volume of milli-Q water much higher than the mineral porous volume, within molecular solubility, and then we mixed the mineral powder with such aqueous solutions using a mineral concentration of about 120 g∙L-1. We vortexed such suspensions to favor homogeneous interaction between molecules and mineral, and then we put the suspensions on a test tube rotator for a time sufficient to reach the equilibrium state (≈24 h). This time was estimated in previous kinetics experiments (not shown here), using the methodology described by Fornaro et al. (2013a). After equilibrium adsorption, we dried samples in an oven at 40°C overnight. This temperature was chosen to assure fast drying and, at the same time, to avoid degradation of organics. Drying the samples simulates possible desiccation processes of liquid water bodies on early Mars. With this method, all molecules in the initial aqueous solution adsorb on the solid substrate, since no separation step between liquid and solid phases is applied, and molecules do not degrade at the drying temperature of 40°C. Specifically, we chose to prepare montmorillonite samples with three different molecular concentrations, i.e., 5, 1, and 0.1 wt%. This preparation method was advantageous because it is time-effective and it enables us to control the amount of molecules adsorbed on the solid substrate and the experimental conditions. In addition, these procedures maximize molecular interactions with mineral surfaces as well as molecular diffusion inside the mineral matrix; therefore, molecules establish physico-chemical interactions with mineral surfaces as in natural processes of adsorption.
UV Irradiation Experiments and Near InfraRed Characterization
We subjected the Mars soil analog samples at 5 wt% molecular concentration on montmorillonite containing 1 wt% of magnesium perchlorate to mid- and near-UV irradiation processing. We chose the samples with the highest molecular concentration in order to observe the most obvious variations in the spectroscopic features due to UV irradiation, and with magnesium perchlorate to simulate realistically martian surficial samples. We used an experimental setup assembled at INAF-Astrophysical Observatory of Arcetri (Florence, Italy) that allows us to monitor the photochemistry in situ by Diffuse Reflectance Infrared Fourier Transform Spectroscopy (DRIFTS) analysis. Specifically, the UV light emitted by a Newport Xenon enhanced UV 300 W lamp with purified Xenon at 5–20 bar (wavelength range 185–2000 nm) is focused directly on the sample through an optical fiber of 800 μm spot size. With this setup, the irradiated spot of the sample presents an area of 7.07 mm2 and the UV flux focused on the sample is 2.75 × 10¹⁷ photons s−1 cm−2 in the 200–400 nm spectral range, as measured through a single monochromator Spectro 320 scanning spectrometer (Instrument System). The optical fiber is inserted into the sample chamber of a single beam double pendulum interferometer VERTEX 70v (Bruker), equipped with a Praying Mantis™ Diffuse Reflection Accessory (Harrick DRIFT), in order to measure diffuse reflectance spectra of the sample in situ at regular intervals during UV irradiation (Figure 2). For these experiments, we acquired reflectance spectra pre-irradiation and during UV irradiation in the spectral range 400–8,000 cm−1, using a resolution of 4 cm−1, 100 scan, Globar source, KBr beamsplitter, and a DTGS detector, but we focused our analysis only on the Near InfraRed (NIR) spectral region above 2,000 cm−1, which is relevant to space flight instruments such as SuperCam (spectral range 1.3–2.6 + 0.4–0.85 μm) on board Mars 2020, Ma_MISS (spectral range 0.5–2.3 μm), ISEM (spectral range 1.1–3.3 μm) and MicrOmega (spectral range 0.95–3.65 + 0.5–0.9 μm) on board ExoMars 2022. Furthermore, we acquired reflectance spectra also in the 8,000–20,000 cm−1 spectral region, using a Tungsten source, CaF2 beamsplitter and InGaAs detector.
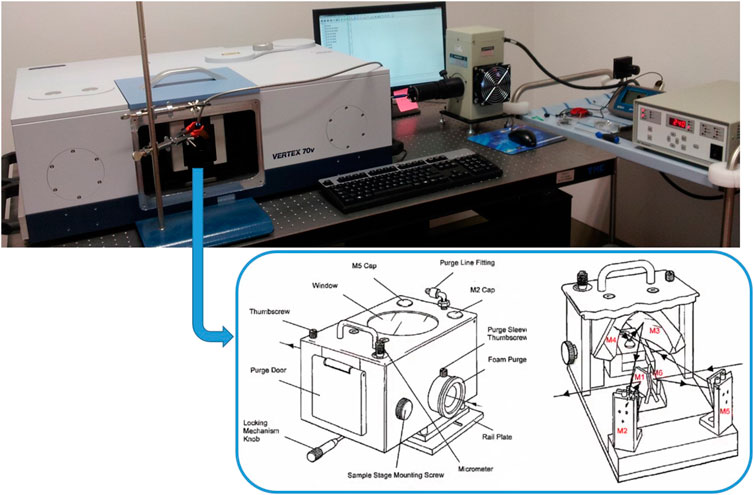
FIGURE 2. Experimental setup used for in situ UV irradiation experiments, with scheme of the Praying MantisTM Diffuse Reflection Accessory.
We irradiated for a total time of 70 min under a flux of nitrogen at room temperature. Such short irradiation experiments at room temperature simulate the most intense martian irradiation that occurs in the equatorial region around noon. Moreover, the Mars 2020 and ExoMars 2022 rovers will collect samples of the marian soil from a depth of at least a few centimeters and we expect a very limited time of exposure to UV radiation during collection and transport of the samples inside the rovers.
We evaluated the percentages of degradation after 70 min of UV irradiation as:
where Apre is the area of the molecular peak pre-irradiation and Apost is the area of the same molecular peak post-irradiation.
Anharmonic Computational Spectroscopy Calculations
To assign vibrational features in the NIR, it is necessary to carry out calculations at the anharmonic level that predict frequencies and intensities of overtones and combination bands. The anharmonic vibrational frequencies and IR intensities were obtained via a generalized second-order vibrational perturbation theory approach (GVPT2) (Barone, 2005; Barone et al., 2014; Bloino, 2015; Bloino et al., 2015), following the procedures recommended in Bloino et al. (2016). According to the experimental conditions, the geometry optimizations started from conformers present in the solid state. All computations have been performed by means of density functional theory employing the B3LYP functional (Becke, 1993) with the double-zeta basis sets SNSD (Barone et al., 2014), and including Grimme’s dispersion correction D3 (in conjunction with Becke-Johnson damping) (Ehrlich et al., 2011; Grimme et al., 2011, 2010). This approach has been well tested for structural and spectroscopy properties of biological molecules of astrochemical interest (Fornaro et al., 2014; Fornaro et al., 2015a; Barone et al., 2015; Fornaro et al., 2015b; Biczysko et al., 2018).
In GVPT2 computations, the default criteria for anharmonic resonances have been exploited, and variational corrections have been applied to both energies and IR intensities. Moreover, considering that the large amplitude-motion (LAM) vibrations, which cannot be well-described by perturbative approaches, may contaminate the overall VPT2 treatment and higher frequency vibrations, LAM-free VPT2 scheme have been used in this work (where all LAMs anharmonic constants are excluded from the VPT2) (Biczysko et al., 2018). For all molecules, vibrations with harmonic frequencies below 200 cm−1 have been considered as LAMs.
All calculations were performed with Gaussian 16 suite of computer codes (Frisch et al., 2016). VMS-Draw (Licari et al., 2015) was used to visualize the normal modes and analyze in detail the outcome of vibrational computations and IR spectra.
Results
Mineral Characterization
XRF measurements showed the following chemical composition (%): SiO2 = 69.1, Al2O3 = 18.1, TiO2 = 0.22, Fe2O3 = 1.75, MnO = 0.090, MgO = 6.49, CaO = 3.71, Na2O = 0.19, K2O = 0.26, P2O5 = 0.01, SO3=0.059, K2O=0.26.
We did not purify such montmorillonite sample from other mineral phases, so 1-2 wt% of quartz was also present, as confirmed by the presence of a peak at 26.6° in the XRD pattern shown in Supplementary Figure S1.
The carbon content originally present in the montmorillonite sample, measured through IRMS-EA, was 0.11 wt%. After the cleaning treatment, the carbon content was below the IRMS detection limit for Montmorillonite SAz-1.
XRD measurements showed that the treatment with sodium pyrophosphate caused cation exchange of doubly-hydrated Ca2+ with singularly-hydrated Na+, reducing montmorillonite interlayer distance of the basal plane (001) from 14.63 to 12.54 Å (Supplementary Figure S2). Based on a cation exchange capacity (CEC) of 120 meq/100g for montmorillonite and the amount of Na4P2O7•10H2O used for extraction, we estimated the presence in the interlayers of about 60% Na+ and 40% Ca2+. We also observed appearance of new peaks at 5.04, 5.45 and 8.56 Å in the XRD pattern of treated montmorillonite, likely due to salts precipitated as consequence of the cleaning treatment.
As shown in Supplementary Figure S3, XRD patterns of montmorillonite (MONT) and montmorillonite doped with 1 wt% magnesium perchlorate (MONTP) present almost the same interlayer distance, intensity and band width. We only observed slight expansion of the interlayer distance of the (001) planes from 12.54 Å for MONT to 12.63 Å for MONTP (Δd(001) = 0.09Å), that cannot be explained with intercalation of Mg2+, but it is likely due to hydration. We also observed disappearance of the peaks at 5.04, 5.45 and 8.56 Å, likely due to dissolution by perchlorate of the salts previously precipitated.
We did not observe any modifications of the mineral by IR or Raman characterization, as shown in Supplementary Figures S4 and S5.
TEM images of MONT and MONTP showed stacked layers with an interlayer spacing in agreement with XRD measurements (Supplementary Figure S6). Differences between samples before and after attack with perchlorate is not obvious since only 1 wt% of the latter was used. We suggest that 1 wt% of perchlorate does not strongly affect the montmorillonite layers. Statistics of layer spacing were done on several regions. The micrograph shown in Supplementary Figure S6 (on the right) exhibits some irregular layers compared to the ones before addition of perchlorate. A discontinuity in the layers can be underlined. These results should be carefully analyzed since1 wt% perchlorate cannot affect bulk properties of the sample.
However, BET analysis indicated that magnesium perchlorate affected montmorillonite surface area, which increased from 43 m2/g to 82 m2/g. As can be seen on the adsorption-desorption isotherms in Supplementary Figure S7, the sample containing the 1 wt% of magnesium perchlorate presents more “textural porosity”, probably due to alteration of surface charge that may cause disaggregation of the particles and an increase in the number of pores.
27Al and 29Si NMR spectra of samples before and after addition of magnesium perchlorate are superimposable without any difference, as shown in Supplementary Figure S8. The signal centered at 0 ppm in 27Al MAS NMR is attributed to hexa-coordinated aluminium usually present in montmorillonite. The 29Si signal centered around −92 ppm corresponds to Q3 species. For 1H NMR, as shown in Supplementary Figure S9, a slight difference is observed in the form of the peaks, but overall the signals remain the same and the attribution is as follows: the signal around 4.4 ppm is assigned to the protons of water, the one at 1.8 to the protons in Si-OH, and the one at 0.8 to the protons in Mg-OH. The negative 1H NMR shifts at -2.85 ppm can be attributed to a strong shielding effect due to the presence of paramagnetic center in the sample.
Near InfraRed Spectra Pre- and Post- UV Irradiation
Figures 3–7 report the NIR spectra pre-irradiation for AMP, GLU, PHE, PHA, and MIX adsorbed on montmorillonite at 5, 1 and 0.1 wt% concentration, along with frequency shifts with respect to the pure molecules in the solid state and tentative assignments based on DFT calculations at anharmonic level for the peaks in the most relevant 2,740–8,000 cm−1 spectral range. The full NIR spectra pre-irradiation in the 2,000–200,000 cm−1 spectral region are shown in Supplementary Figures S10–S14.
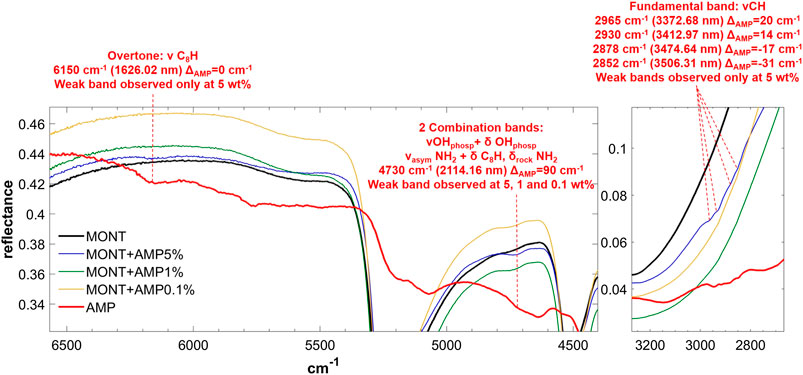
FIGURE 3. NIR spectra of AMP adsorbed on montmorillonite at 5, 1, and 0.1 wt% concentration. Legend: ΔAMP = wavenumber shift with respect to the same peak of the pure molecule in the solid state; phosp = phosphate group; ν = stretching vibrational mode; δ = bending vibrational mode; rock = rocking in-plane vibrational mode; asym = asymmetric vibrational mode.
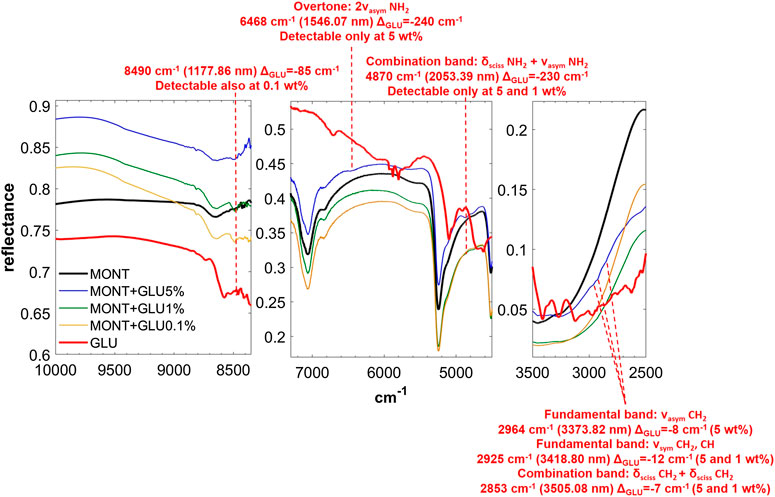
FIGURE 4. NIR spectra of GLU adsorbed on montmorillonite at 5, 1, and 0.1 wt% concentration. Legend: ΔGLU = wavenumber shift with respect to the same peak of the pure molecule in the solid state; ν = stretching vibrational mode; δ = bending vibrational mode; sciss = scissoring in-plane vibrational mode; sym = symmetric vibrational mode; asym = asymmetric vibrational mode.
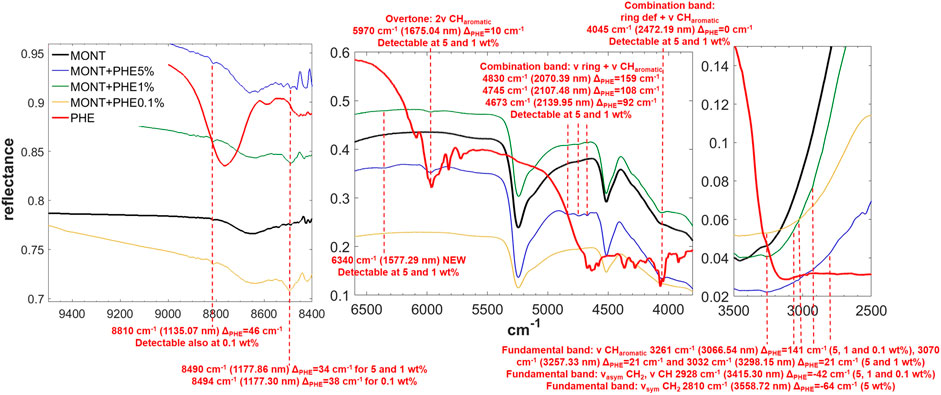
FIGURE 5. NIR spectra of PHE adsorbed on montmorillonite at 5, 1, and 0.1 wt% concentration. Legend: ΔPHE = wavenumber shift with respect to the same peak of the pure molecule in the solid state; ν = stretching vibrational mode; δ = bending vibrational mode; def = deformation vibrational mode; sym = symmetric vibrational mode; asym = asymmetric vibrational mode.
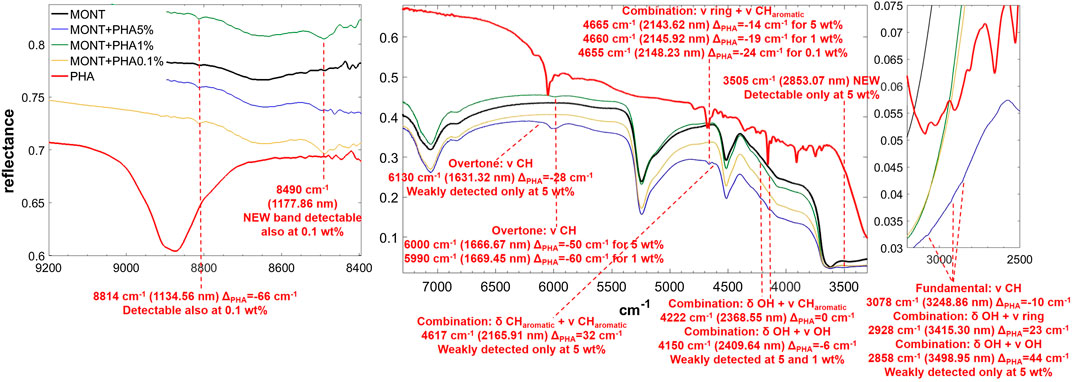
FIGURE 6. NIR spectra of PHA adsorbed on montmorillonite at 5, 1, and 0.1 wt% concentration. Legend: ΔPHA = wavenumber shift with respect to the same peak of the pure molecule in the solid state; ν = stretching vibrational mode; δ = bending vibrational mode.
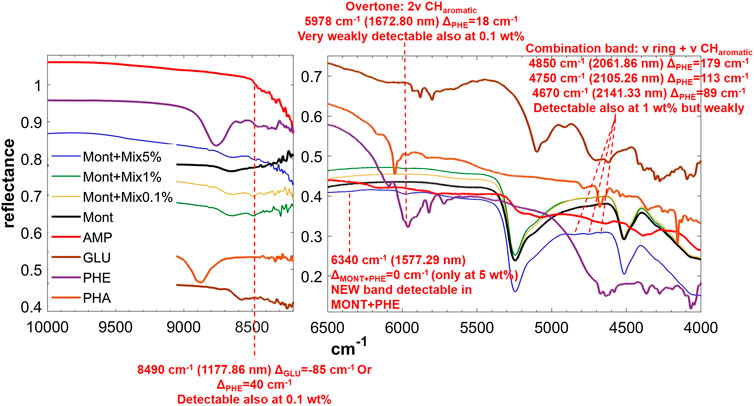
FIGURE 7. NIR spectra of MIX adsorbed on montmorillonite at 5, 1, and 0.1 wt% concentration. Legend: ΔPHE = wavenumber shift with respect to the same peak of the pure molecule in the solid state; ΔMONT+PHE = wavenumber shift with respect to the same peak of PHE adsorbed on MONT; ν = stretching vibrational mode.
Table 1 reports the changes of molecular NIR features due to adsorption onto montmorillonite at different concentrations, presence of 1 wt% of magnesium perchlorate and 70 min of UV irradiation, along with the new features forming during UV irradiation. Tentative assignments are based on DFT calculations at anharmonic level, which are reported in detail in Supplementary Table S1.
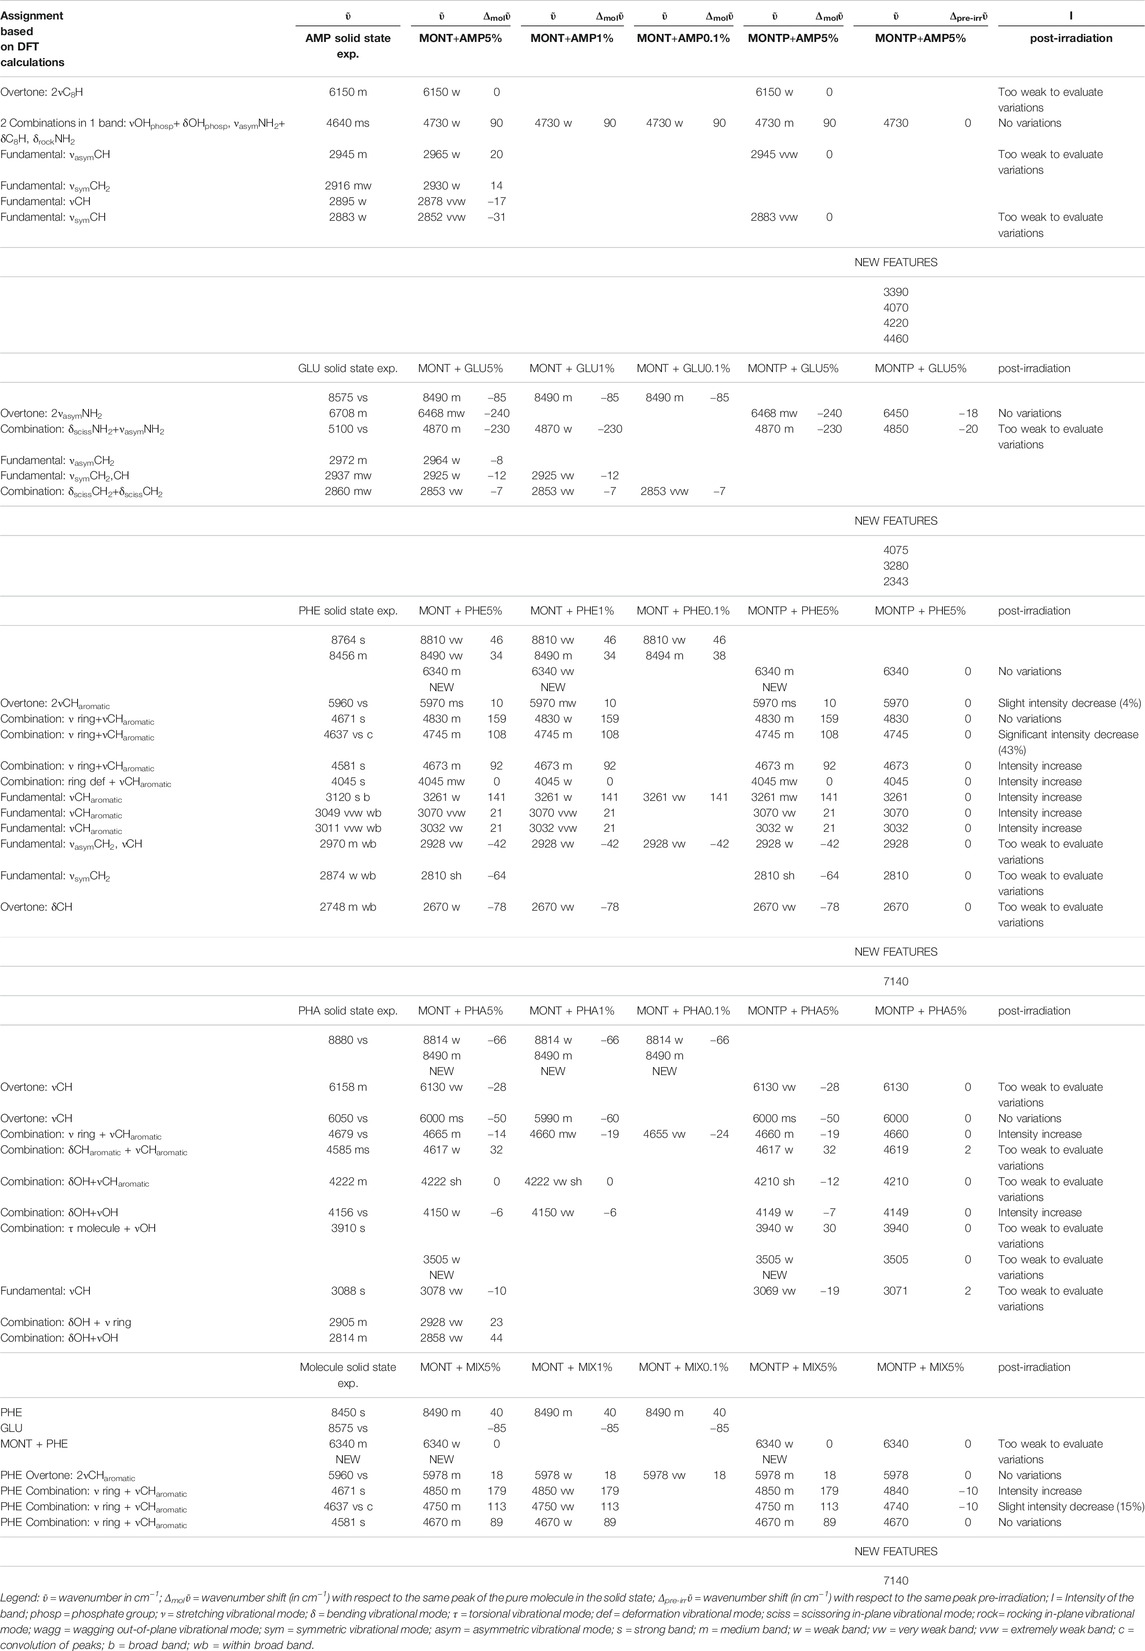
TABLE 1. Changes of molecular NIR features due to adsorption onto montmorillonite at different concentrations (5, 1 and 0.1 wt%), presence of 1 wt% of magnesium perchlorate and 70 min of UV irradiation.
Table 2 reports the changes of montmorillonite NIR features due to molecular adsorption at different concentrations, presence of 1 wt% of magnesium perchlorate and 70 min of UV irradiation.
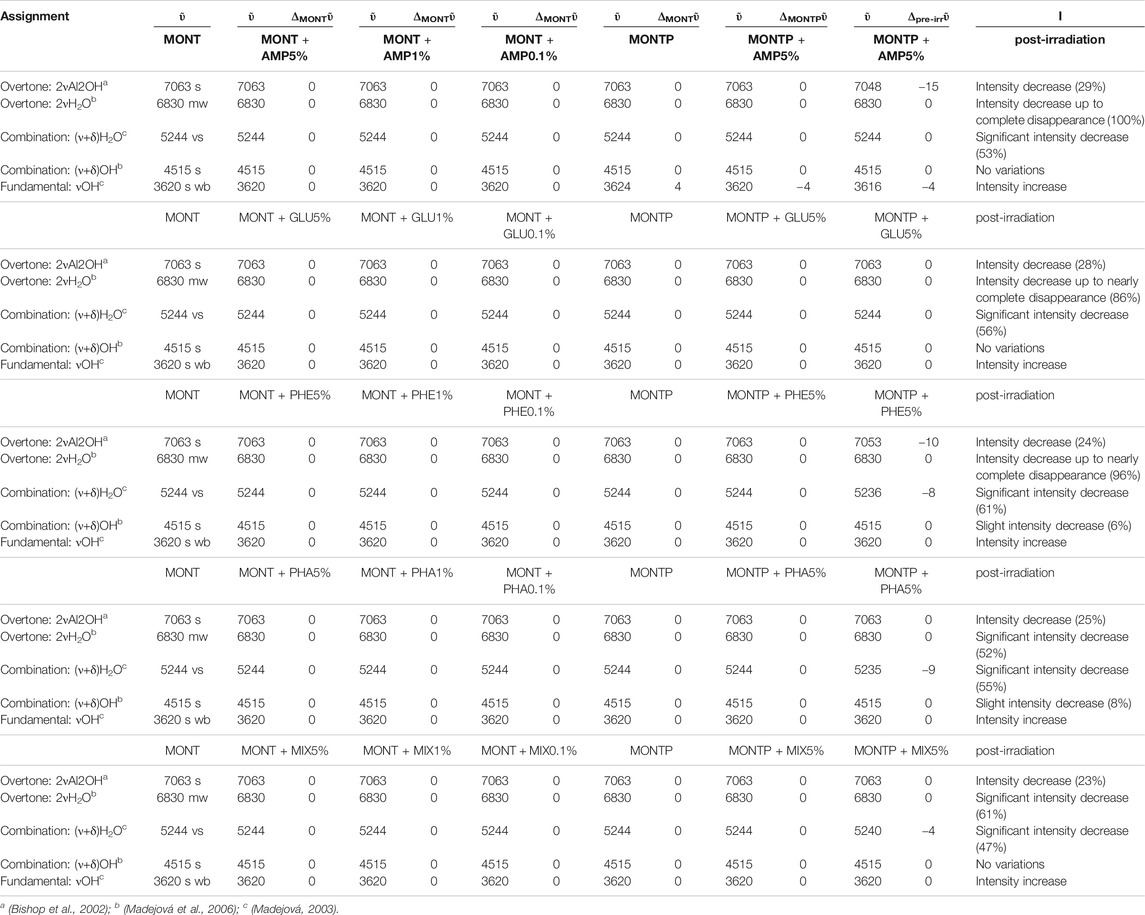
TABLE 2. Changes of montmorillonite NIR features due to molecular adsorption at different concentrations (5, 1 and 0.1 wt%), presence of 1 wt% of magnesium perchlorate and 70 min of UV irradiation.
Figures 8–12 show the main changes in NIR features after 70 min of UV irradiation for the samples of 5 wt% molecular concentration on montmorillonite containing 1 wt% of Mg-perchlorate.
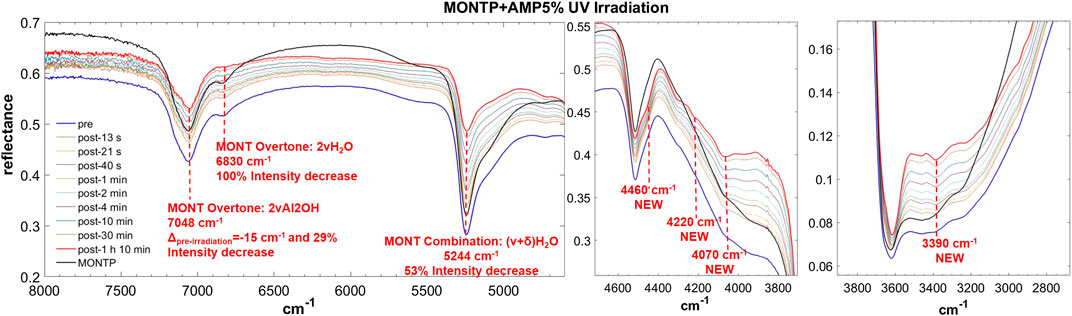
FIGURE 8. Main changes in NIR features after 70 min of UV irradiation for AMP 5 wt% on montmorillonite containing 1 wt% of Mg-perchlorate. Legend: Δpre-irr = wavenumber shift with respect to the same peak pre-irradiation; ν = stretching vibrational mode; δ = bending vibrational mode.
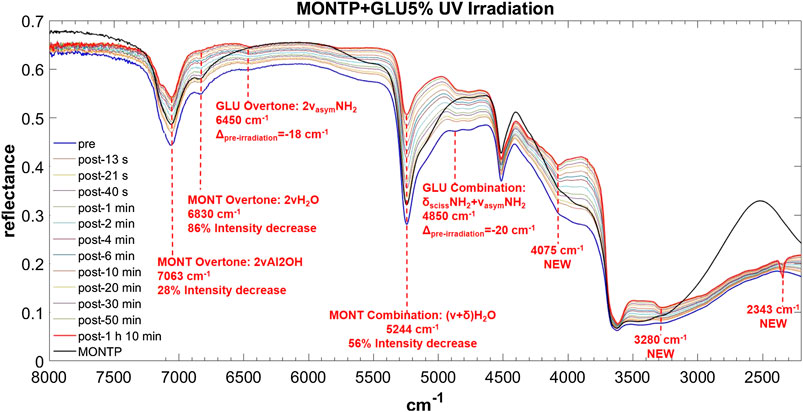
FIGURE 9. Main changes in NIR features after 70 min of UV irradiation for GLU 5 wt% on montmorillonite containing 1 wt% of Mg-perchlorate. Legend: Δpre-irr = wavenumber shift with respect to the same peak pre-irradiation; ν = stretching vibrational mode; δ = bending vibrational mode; sciss = scissoring in-plane vibrational mode; asym = asymmetric vibrational mode.
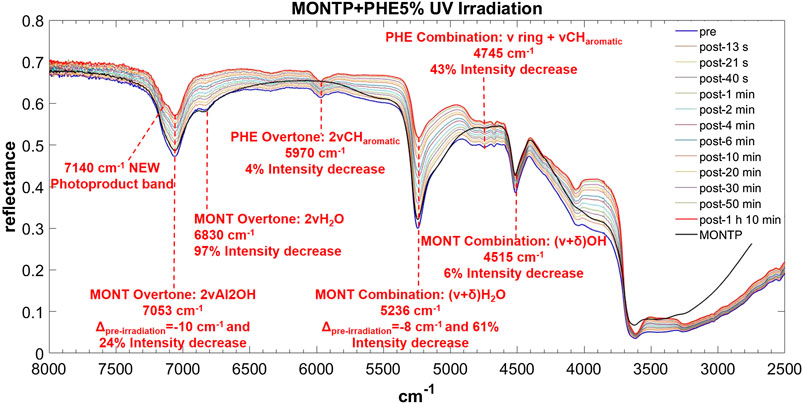
FIGURE 10. Main changes in NIR features after 70 min of UV irradiation for PHE 5 wt% on montmorillonite containing 1 wt% of Mg-perchlorate. Legend: Δpre-irr = wavenumber shift with respect to the same peak pre-irradiation; ν = stretching vibrational mode; δ = bending vibrational mode.
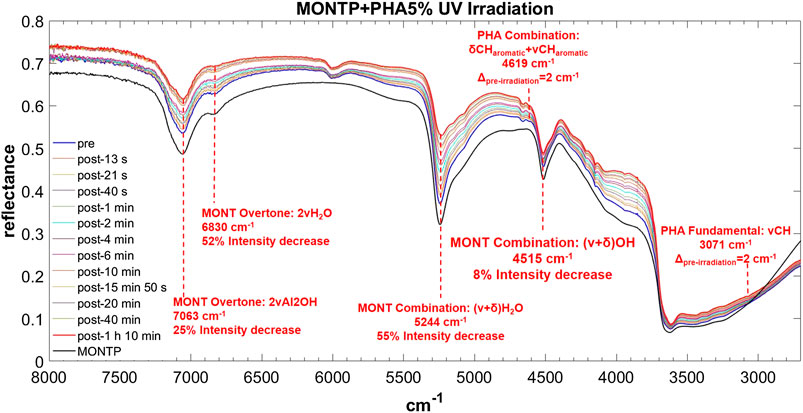
FIGURE 11. Main changes in NIR features after 70 min of UV irradiation for PHA 5 wt% on montmorillonite containing 1 wt% of Mg-perchlorate. Legend: Δpre-irr = wavenumber shift with respect to the same peak pre-irradiation; ν = stretching vibrational mode; δ = bending vibrational mode.
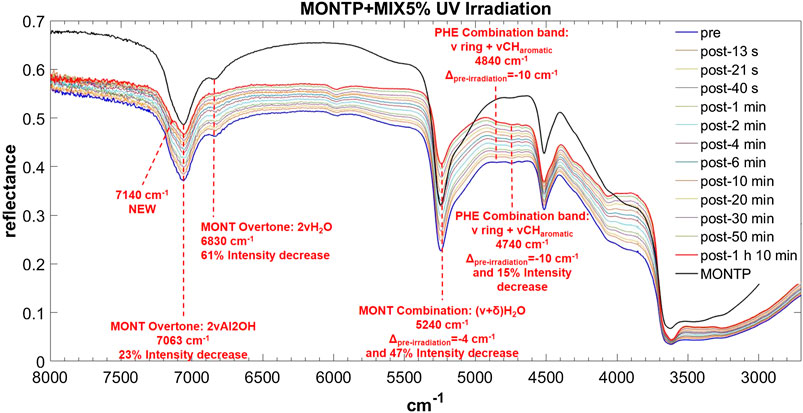
FIGURE 12. Main changes in NIR features after 70 min of UV irradiation for MIX 5 wt% on montmorillonite containing 1 wt% of Mg-perchlorate. Legend: Δpre-irr = wavenumber shift with respect to the same peak pre-irradiation; ν = stretching vibrational mode; δ = bending vibrational mode.
From these data, AMP appears to be the most difficult molecule to detect in the NIR, because it does not absorb in the 8,000–20,000 cm−1 spectral range and presents only a few weak bands in the 2,000–8,000 cm−1 spectral range detectable mainly at 5 wt%, although a very weak band at 4,730 cm−1 can still be detected at 1 wt%. Based on DFT calculations at anharmonic level, we assigned this band to two strong combinations: νOH + δOHphosphate and νasymNH2 + δC8H, δrockNH2. Due to molecule-mineral interactions, this band undergoes a significant high-frequency shift of 90 cm−1 with the respect to the case of pure AMP in the solid state, which indicates that the amino group of the adenine moiety is mainly involved in the interactions with the mineral. The other detectable peaks in the region of C-H stretching, instead, undergo less significant shifts, i.e., 20 cm−1 for the peak at 2,965, 14 cm−1 for the peak at 2,930, −17 cm−1 for the peak at 2,878, −31 cm−1 for the peak at 2,852 cm−1, and no shift for the peak at 2,700 cm−1. In the presence of 1 wt% of magnesium perchlorate, we can observe some differences, i.e. the peaks at 2,945 and 2,883 cm−1 which are at exactly the same wavenumber of pure AMP, and the peaks at 2,930 and 2,878 cm−1 which are not observable. Unfortunately, most of these peaks are too weak to evaluate intensity variations due to UV irradiation, but new features due to the formation of photoproducts are clearly observed at 3,390, 4,070, 4,220, and 4,460 cm−1.
GLU adsorbed on montmorillonite presents remarkable red-shifts with respect to pure GLU in the solid state, of 240 and 230 cm−1 for the peaks of highest intensity at 6,468 and 4,870 cm−1, respectively, attributable to the overtone 2νasym NH2 and the combination νasym NH2 + δ NH2, which are the same in the presence of 1 wt% of magnesium perchlorate and indicate the involvement of the NH2 functional group in the interaction with the mineral. New features appear as consequence of UV irradiation, at 4,075, 3,280, and 2,343 cm−1, indicative of the formation of photoproducts.
PHE is the molecule with the most intense bands in the NIR when adsorbed on montmorillonite. Significantly intense bands detectable also at 1 wt% occur at: 5,970 cm−1, attributable to the overtone 2ν CHaromatic, blue-shifted of 10 cm−1 with respect to pure PHE in the solid state; 4,830 and 4,745 cm−1, attributable to the combinations ν ring + ν CHaromatic, blue-shifted of 159 and 108 cm−1, respectively; 4,673 cm−1, attributable to ν ring + ν CHaromatic, blue-shifted of 92 cm−1; and 4,045 cm−1, attributable to the combination ring def + ν CHaromatic, not shifted with respect to pure PHE in the solid state. Weaker bands can be detected also for the 0.1 wt% concentration at 3,261 cm−1, attributable to the fundamental ν CHaromatic, blue-shifted of 141 cm−1 with respect to pure PHE in the solid state, and 2,928 cm−1, attributable to the fundamental νasym CH2 / ν CH, red-shifted of 42 cm−1 with respect to pure PHE in the solid state. These variations indicate involvement of the C-H of the aromatic ring in the interaction with the mineral. In addition, in the case of 5 and 1 wt%, a new band due to molecule-mineral interactions is detectable at 6,340 cm−1, indicative of chemisorption. The presence of 1 wt% of magnesium perchlorate does not seem to affect the NIR features, while UV irradiation causes intensity decreases for the bands at 5,970 cm−1 (about 4%), 4,745 cm−1 (about 43%), 2,545 cm−1 (about 13%), and 2,455 cm−1 (about 35%), along with the formation of a peak at 7,140 cm−1 due to formation of photoproducts.
PHA adsorbed on montmorillonite is also clearly detectable in the NIR thanks to the band at 6,000 cm−1, attributable to the overtone 2νCH, red-shifted by 50 cm−1 with respect to pure PHA in the solid state when PHA is adsorbed on montmorillonite at 5 wt%, which undergoes a further red-shift of 10 cm−1 at 1 wt%, and the band at 4,665 cm−1, attributable to the combination ν ring + νCHaromatic, whose red-shift with respect to pure PHA in the solid state goes from 14 cm−1 when PHA is adsorbed on montmorillonite at 5 wt% to 19 cm−1 at 1 wt% and 24 at 0.1 wt%. Significant shifts with respect to pure PHA can be observed also for other weaker bands like the combination δCHaromatic + νCHaromatic at 4,617 cm−1 with a blue-frequency shift of 32 cm−1, the fundamental νCH at 3,078 cm−1 with a red-shift of 10 cm−1, the combination δOH + ν ring at 2,905 cm−1 with a blue-shift of 23 cm−1, and the combination δOH + νOH at 2,814 cm−1 with a blue-shift of 44 cm−1. Also in this case, new bands due to molecule-mineral interactions are observed, one at 8,490 cm−1 at all concentrations, and another at 3,505 cm−1 only detectable at 5 wt%. In the case of PHA, many peaks are slightly different in the sample spiked with 1 wt% magnesium perchlorate: 4,660 cm−1 ΔPHA = −19, 4,210 cm−1 ΔPHA = −12, 4,149 cm−1 ΔPHA = −7 and 3,069 cm−1 ΔPHA = −19 cm−1. Other differences are the presence of the peak at 3,940 cm−1 ΔPHA = 30 cm−1, which is not observable in the analogous sample without magnesium perchlorate, and the absence of the peaks at 2,928 and 2,858 cm−1, which are detectable in the analogous sample without magnesium perchlorate. The effects of UV irradiation are, instead, negligible.
The NIR spectrum of the mixture of molecules adsorbed on montmorillonite appears dominated by PHE’s features. The main peaks of PHE adsorbed on montmorillonite can be detected with small shifts, i.e. 5,978 cm−1 (blue-shifted of 8 cm−1 with respect to PHE adsorbed on montmorillonite), 4,850 cm−1 (blue-shifted of 20 cm−1 with respect to PHE adsorbed on montmorillonite), 4,750 cm−1 (blue-shifted of 5 cm−1 with respect to PHE adsorbed on montmorillonite), and 4,670 cm−1 (red-shifted of 3 cm−1 with respect to PHE adsorbed on montmorillonite). Furthermore, the new peak at 6,340 cm−1 due to molecule-mineral interactions is the same observed in the case of PHE adsorbed on montmorillonite. Effects of the presence of magnesium perchlorate are not evident, while UV irradiation causes red-shifts of 10 cm−1 for the peaks at 4,850 and 4,750 cm−1, not observed in the case of PHE adsorbed on montmorillonite. The peak at 4,740 cm−1 also undergoes an intensity decrease, as observed with PHE adsorbed on montmorillonite, but at a much lower extent (15 vs. 43%). Finally, UV irradiation causes the formation of the same photoproduct as in the case of PHE adsorbed on montmorillonite, as indicated by the appearance of the same band at 7,140 cm−1.
Regarding NIR features of montmorillonite, as seen in Table 2, they are not affected by molecular interactions, neither by the presence of 1 wt% of magnesium perchlorate. However, UV irradiation causes some changes that depend on the molecule adsorbed.
In the case of AMP, the peak of montmorillonite at 7,063 cm−1, attributable to the overtone of the Al2OH stretching, undergoes a red-shift of 15 cm−1 as consequence of 70 min of UV irradiation and a 28% intensity decrease. The peak at 6,830 cm−1, due to the overtone of the stretching of the water adsorbed on the mineral, decreases in intensity up to complete disappearance after 70 min of UV irradiation. The peak at 5,244 cm−1, due to a combination of stretching and bending of adsorbed water, also undergoes a significant decrease in intensity of 53% in 70 min of UV irradiation.
In the case of GLU, the peak of montmorillonite at 7,063 cm−1 does not undergo any red-shift as a consequence of 70 min of UV irradiation, but a similar 28% intensity decrease is observed. The peak at 6,830 cm−1 undergoes a decrease in intensity of 86%, similar to the case of AMP. The peak at 5,244 cm−1 also undergoes a significant decrease in intensity of 56% in 70 min of UV irradiation.
In the case of PHE, similar to the case of AMP, the peak of montmorillonite at 7,063 cm−1 undergoes a red-shift of 10 cm−1 as consequence of 70 min of UV irradiation and a 24% intensity decrease. The peak at 6,830 cm−1 undergoes a decrease in intensity of 96% similarly to the case of AMP and GLU. The peak at 5,244 cm−1 undergoes a red-shift of 8 cm−1 and a significant decrease in intensity of 61% in 70 min of UV irradiation, as observed also in the other cases. In contrast to the other examples, the peak at 4,515 cm−1 undergoes a slight intensity decrease of 6% due to a combination of stretching and bending of the OH group.
For PHA, as for GLU, the montmorillonite peak at 7,063 cm−1 does not undergo a red-shift as a consequence of 70 min of UV irradiation, but a similar 25% intensity decrease is observed. The peak at 6,830 cm−1 displays a lower decrease in intensity with respect to the other cases (52%). Similar to PHE, the peak at 5,244 cm−1 undergoes a red-shift of 9 cm−1 and a significant decrease in intensity of 54% in 70 min of UV irradiation. As for PHE, the peak at 4,515 cm−1 also undergoes a slight intensity decrease of 8%.
In the case of the mixture, as observed for PHA and GLU, the montmorillonite peak at 7,063 cm−1 does not undergo a red-shift as a consequence of 70 min of UV irradiation but we observe a 23% intensity decrease. As observed with PHA, the 6,830 cm−1 peak shows a smaller decrease in intensity (61%). Similar to PHE and PHA, the peak at 5,244 cm−1 undergoes a red-shift of 4 cm−1 and a significant decrease in intensity of 47% in 70 min of UV irradiation. No variations of the peak at 4,515 cm−1 are observed in this case.
Discussion
The NIR characterization of Mars soil analog samples obtained by doping montmorillonite (MONT) with the nucleic acid component adenosine 5’-monophosphate (AMP), the amino acids L-glutamic acid (GLU) and L-phenylalanine (PHE), and phthalic acid, which is a plausible precursor of the chlorohydrocarbons detected on Mars by the Curiosity rover, has shown that this spectroscopic technique is suitable for detection of these kinds of organic molecules when adsorbed on MONT (Steele et al., 2018). Indeed, some bands can be detected for all molecules adsorbed on MONT, with estimated detection limits of ≤250 ppm for PHE, ≤1000 ppm for PHA and GLU, and ≤50000 ppm for AMP (despite a very weak band at 4,730 cm−1 can be detected also at 1000 ppm). In the case of samples with an adsorbed mixture of all four molecules (MIX), PHE’s adsorption features predominate, consistent with PHE being the molecule with the lowest detection limit.
We did not observe significant differences in the presence of 1 wt% magnesium perchlorate, except for MONTP + PHA, and to smaller extent MONTP + AMP, where discrepancies are within 10 cm−1. This finding suggests that such an amount of magnesium perchlorate does not interfere with molecule-mineral interactions.
We did not observe significant frequency shifts at different organic concentrations, but only fewer and less intense bands with lower organic concentrations, as expected, except for PHA, which presents larger red-shifts at lower concentrations. Different molecular peak positions at different surface coverage can be explained considering that molecules may occupy different surface sites at different concentrations, which results in different spectroscopic features.
Very importantly, we observed significant frequency shifts with respect to pure molecules (even greater than 100 cm−1) for some vibrational modes of molecular functional groups involved in the interaction with the mineral and new features due to chemisorption in the case of PHE and PHA, while the mineral features were unaltered. In addition, in the case of samples obtained by adsorbing a mixture of all four molecules on montmorillonite, the bands of PHE detected were shifted with respect to the case of the samples with only PHE adsorbed on montmorillonite, indicating that molecules influence each other’s adsorption, consequently affecting spectroscopic features. These results highlight the importance of establishing databases of spectroscopic features of molecule-mineral complexes because the features observed for organic molecules change when they are adsorbed on minerals; therefore, databases of spectroscopic features for pure molecules and pure minerals are not adequate for correct assignments.
Moreover, UV irradiation experiments show that at very short timescales both molecular and mineral NIR features are affected by UV radiation. Regarding molecular features, in most of the cases we do not observe significant intensity decreases, indicating that montmorillonite does not promote molecular degradation, except for the combination band ν ring + νCHaromatic of PHE at 4,745 cm−1 (43% of loss), which was limited to only 15% loss in the samples for which all four molecules adsorb as a mixture on montmorillonite. This result possibly indicates a photoprotective effect due to interactions among the different molecules. On the other hand, we observed the appearance of new features due to the formation of photoproducts in the case of AMP, PHE and GLU, whose nature is still to be determined. Regarding mineral features, the changes due to UV irradiation are particularly important both for the structural O-H groups of the mineral and the adsorbed water, whose bands undergo significant intensity decreases. Very interestingly, such changes depend on the specific molecule adsorbed. Indeed, in the case of AMP and PHE adsorbed on montmorillonite, we observed red-shifts of the overtone of the Al2OH stretching, whereas for PHE, PHA and MIX, we observed red-shifts of the combination band of stretching and bending of adsorbed water, indicating a weakening of the respective bonds as consequence of UV irradiation. In addition, the extent of intensity decrease of these bands is different for the different molecules adsorbed. These results indicate that molecule-mineral interactions influence the possible photochemical mechanisms induced by UV radiation.
Of course, the outcomes of these studies refer to specific molecule-mineral complexes prepared under particular conditions and different behavior can be observed with different combinations of molecules, mineral phases and conditions. Indeed, the physico-chemical interactions establishing between molecules and minerals specifically depend on molecular properties, mineral features, molecule-mineral concentration ratio, and environmental conditions in which molecule-mineral complexes form (like pH, ionic strength, presence of specific ions or reactive species, and so on). For instance, at high molecular concentration, molecules like nucleotides tend to form clusters on the mineral surface through strong intermolecular interactions (stacking and hydrogen bonds), whose spectroscopic features are similar to the molecular solid and it is not possible to observe spectroscopic features due to molecule-mineral interactions. Moreover, the mineral surface charge and the protonation state of many molecules depend on the pH, which determines the involvement of electrostatic interactions in the adsorption process. Furthermore, some ions may interact with molecular functional groups and inhibit bonding to mineral surface sites. On the contrary, other ions may favor molecular adsorption by forming surface complexes with the molecules and acting as bridges with the mineral surface sites. These examples show how difficult might be to predict spectroscopic features for real samples formed under a variety of environmental conditions. However, a systematic study with reference samples is key to dissect the multiple contributions to the overall spectroscopic signal of real samples.
Conclusion
This study reports changes of the NIR spectroscopic features due to molecule-mineral interactions, molecular concentration, presence of oxidants such as magnesium perchlorate, and UV irradiation, for molecules relevant in the context of life detection, such as adenosine 5’-monophosphate, L-glutamic acid, L-phenylalanine, and phthalic acid, adsorbed on montmorillonite, a clay mineral common on Mars.
We observed that molecule-mineral interactions and UV irradiation cause the most significant changes in NIR spectra.
Specifically, chemisorption determines frequency shifts even greater than 100 cm−1 with respect to pure molecules for the vibrational modes of molecular functional groups involved in the interaction with the mineral and the appearance of new features. Very importantly, molecule-mineral interactions strongly depend on many factors, including conditions of preparation of molecule-mineral complexes, specific properties of minerals and molecules, presence of multiple components in the system, and so on. Therefore, to interpret NIR features of martian samples, it is very important to prepare many analog samples obtained with various combinations of relevant molecules and minerals under conditions mimicking the martian environment and establish large libraries of NIR spectra to use as reference.
Based on this study and previous works (Fornaro et al., 2018c, and references therein Schuerger et al., 2003; Schuerger et al., 2006), the effects of UV radiation on NIR features occur quite rapidly, showing both variations in intensities and frequencies of molecular and mineral bands, and the appearance of photoproduct marker bands. Such effects concern mostly surficial samples reached by UV radiation, although regolith-bound organics moved around by dust devils and aeolian erosion can be affected as well. Subsurface exploration is therefore necessary to investigate organics in their original form. In this regard, the ExoMars 2022 mission will offer a great opportunity to inspect the alteration state of organic matter as a function of depth up to 2 m, providing also valuable information for interpreting Mars 2020 data acquired on more altered surficial samples.
This study highlights the importance of establishing custom databases of spectroscopic features for molecule-mineral complexes under martian-like conditions in order to assist interpretation of data collected by instruments based on NIR spectroscopy, such as SuperCam on board Mars 2020 space mission, ISEM, in situ and MicrOmega on board ExoMars 2022 space mission. To this end, such investigations provide important information on where to look for molecular spectroscopic features in NIR when molecules are embedded in plausible “martian” mineral matrices, along with assignments of molecular vibrational modes in the NIR spectral region, which are very scarce in the literature.
Furthermore, this work enables us to identify the molecules with the highest detection potential in the NIR when associated with specific minerals and, hence, select the best analog samples to be used for testbed analyses of flight instruments.
Data Availability Statement
All datasets generated for this study are included in the manuscript/Supplementary Material.
Author Contributions
TF prepared and characterized the Mars soil analog samples, analyzed all data and wrote the paper. JB, GP and MAC contributed to NIR characterization and UV irradiation experiments. MB performed DFT NIR spectra calculations. MJ carried out mineral characterization. DF performed XRF and IRMS measurements. AS and RH mentored this work and contributed to paper revision.
Funding
This research was supported by the Geophysical Laboratory of the Carnegie Institution of Washington and the Italian Space Agency (ASI) grant agreement ExoMars n. 2017-48-H.0. DF acknowledges support provided by the NASA awards NNX15AH77G and 80NSSC19K0559. MB acknowledges support from the National Natural Science Foundation of China (Grant No. 31870738).
Conflict of Interest
The authors declare that the research was conducted in the absence of any commercial or financial relationships that could be construed as a potential conflict of interest.
Acknowledgments
The authors acknowledge Timothy Strobel of the Geophysical Laboratory of the Carnegie Institution of Washington for his scientific and technical assistance in performing XRD measurements.
Supplementary Material
The Supplementary Material for this article can be found online at: https://www.frontiersin.org/articles/10.3389/fspas.2020.539289/full#supplementary-material
References
Barone, V. (2005). Anharmonic vibrational properties by a fully automated second-order perturbative approach. J. Chem. Phys. 122, 014108. doi:10.1063/1.1824881.
Barone, V., Biczysko, M., and Bloino, J. (2014). Fully anharmonic IR and Raman spectra of medium-size molecular systems: accuracy and interpretation. Phys. Chem. Chem. Phys. 16, 1759–1787. doi:10.1039/c3cp53413h.
Barone, V., Biczysko, M., and Puzzarini, C. (2015). Quantum chemistry meets Spectroscopy for astrochemistry: increasing complexity toward prebiotic molecules. Acc. Chem. Res. 48, 1413–1422. doi:10.1021/ar5003285.
Becke, A. D. (1993). Density‐functional thermochemistry. III. The role of exact exchange. J. Chem. Phys. 98, 5648–5652. doi:10.1063/1.464913.
Bibring, J.-P., Hamm, V., Pilorget, C., and Vago, J. L., and the MicrOmega Team (2017). The MicrOmega investigation onboard ExoMars. Astrobiology 17, 621–626. doi:10.1089/ast.2016.1642. CrossRef Full Text
Biczysko, M., Bloino, J., and Puzzarini, C. (2018). Computational challenges in astrochemistry. Wiley Interdiscip. Rev. Comput. Mol. Sci. 8, 33–38. doi:10.1002/wcms.1349
Bishop, J., Madejová, J., Komadel, P., and Fröschl, H. (2002). The influence of Structural Fe, Al and Mg on the infrared OH bands in Spectra of dioctahedral Smectites. Clay Miner.. 37, 607–616. doi:10.1180/0009855023740063. CrossRef Full Text
Bloino, J. (2015). A VPT2 route to near-infrared Spectroscopy: the role of mechanical and electrical anharmonicity. J. Phys. Chem. 119, 5269–5287. doi:10.1021/jp509985u. CrossRef Full Text | PubMed Abstract
Bloino, J., Baiardi, A., and Biczysko, M. (2016). Aiming at an accurate prediction of vibrational and electronic spectra for medium-to-large molecules: an overview. Int. J. Quant. Chem. 116, 1543–1574. doi:10.1002/qua.25188 | Google Scholar
Bloino, J., Biczysko, M., and Barone, V. (2015). Anharmonic effects on vibrational spectra intensities: infrared, Raman, vibrational circular dichroism, and Raman optical activity. J. Phys. Chem. 119, 11862–11874. doi:10.1021/acs.jpca.5b10067. CrossRef Full Text | PubMed Abstract
Carter, J., Poulet, F., Bibring, J.-P., Mangold, N., and Murchie, S. (2013). Hydrous minerals on Mars as seen by the CRISM and OMEGA imaging spectrometers: updated global view. J. Geophys. Res. Planets 118, 831–858. doi:10.1029/2012je004145. CrossRef Full Text
Clark, B. C., and Kounaves, S. P. (2016). Evidence for the distribution of perchlorates on Mars. Int. J. Astrobiol. 15, 311–318. doi:10.1017/s1473550415000385. CrossRef Full Text
Clark, R. N., Curchin, J. M., Hoefen, T. M., and Swayze, G. A. (2009). Reflectance spectroscopy of organic compounds: 1. Alkanes. J. Geophys. Res. 114, E03001. doi:10.1029/2008je003150. CrossRef Full Text
De Sanctis, M. C., Altieri, F., Ammannito, E., Biondi, D., De Angelis, S., Meini, M., et al. (2017). Ma_MISS on ExoMars: mineralogical characterization of the martian subsurface. Astrobiology 17, 612–620. doi:10.1089/ast.2016.1541. CrossRef Full Text
Des Marais, D. J., Nuth, J. A., Allamandola, L. J., Boss, A. P., Farmer, J. D., Hoehler, T. M., et al. (2008). The NASA astrobiology roadmap. Astrobiology 8, 715–730. doi:10.1089/ast.2008.0819.
Ehrlich, S., Moellmann, J., Reckien, W., Bredow, T., and Grimme, S. (2011). System-dependent dispersion coefficients for the DFT-D3 treatment of adsorption processes on ionic surfaces. ChemPhysChem 12, 3414–3420. doi:10.1002/cphc.201100521.
Eigenbrode, J. L., Summons, R. E., Steele, A., Freissinet, C., Millan, M., Navarro-González, R., et al. (2018). Organic matter preserved in 3-billion-year-old mudstones at Gale crater, Mars. Science 360, 1096–1101. doi:10.1126/science.aas9185.
Fornaro, T., Biczysko, M., Bloino, J., and Barone, V. (2016). Reliable vibrational wavenumbers for C·O and N–H stretchings of isolated and hydrogen-bonded nucleic acid bases. Phys. Chem. Chem. Phys. 18, 8479–8490. doi:10.1039/c5cp07386c.
Fornaro, T., Biczysko, M., Monti, S., and Barone, V. (2014). Dispersion corrected DFT approaches for anharmonic vibrational frequency calculations: nucleobases and their dimers. Phys. Chem. Chem. Phys. 16, 10112–10128. doi:10.1039/c3cp54724h.
Fornaro, T., Boosman, A., Brucato, J. R., ten Kate, I. L., Siljeström, S., Poggiali, G., et al. (2018a). UV irradiation of biomarkers adsorbed on minerals under Martian-like conditions: Hints for life detection on Mars. Icarus 313, 38–60. doi:10.1016/j.icarus.2018.05.001.
Fornaro, T., Brucato, J. R., Branciamore, S., and Pucci, A. (2013a). Adsorption of nucleic acid bases on magnesium oxide (MgO). Int. J. Astrobiol. 12, 78–86. doi:10.1017/s1473550412000444.
Fornaro, T., Brucato, J. R., Feuillie, C., Sverjensky, D. A., Hazen, R. M., Brunetto, R., et al. (2018b). Binding of nucleic acid components to the serpentinite-hosted hydrothermal mineral brucite. Astrobiology 18, 989–1007. doi:10.1089/ast.2017.1784. CrossRef Full Text | PubMed Abstract
Fornaro, T., Brucato, J. R., Pace, E., Guidi, M. C., Branciamore, S., and Pucci, A. (2013b). Infrared spectral investigations of UV irradiated nucleobases adsorbed on mineral surfaces. Icarus 226, 1068–1085. doi:10.1016/j.icarus.2013.07.024. CrossRef Full Text
Fornaro, T., Burini, D., Biczysko, M., and Barone, V. (2015a). Hydrogen-bonding effects on infrared spectra from anharmonic computations: uracil-water complexes and uracil dimers. J. Phys. Chem. 119, 4224–4236. doi:10.1021/acs.jpca.5b01561. CrossRef Full Text | PubMed Abstract
Fornaro, T., Carnimeo, I., and Biczysko, M. (2015b). Toward feasible and comprehensive computational protocol for simulation of the spectroscopic properties of large molecular systems: the anharmonic infrared spectrum of uracil in the solid state by the reduced dimensionality/hybrid VPT2 approach. J. Phys. Chem. 119, 5313–5326. doi:10.1021/jp510101y. CrossRef Full Text | PubMed Abstract
Fornaro, T., Steele, A., and Brucato, J. R. (2018c). Catalytic/protective properties of martian minerals and implications for possible origin of life on mars. Life 8, 1–41. doi:10.3390/life8040056. CrossRef Full Text
Foustoukos, D. I., and Stern, J. C. (2012). Oxidation pathways for formic acid under low temperature hydrothermal conditions: implications for the chemical and isotopic evolution of organics on Mars. Geochem. Cosmochim. Acta 76, 14–28. doi:10.1016/j.gca.2011.10.016. CrossRef Full Text
Freissinet, C., Glavin, D. P., Mahaffy, P. R., Miller, K. E., Eigenbrode, J. L., Summons, R. E., et al. (2015). Organic molecules in the sheepbed mudstone, gale crater, mars. J. Geophys. Res. Planets 120, 495–514. doi:10.1002/2014je004737. CrossRef Full Text | PubMed Abstract
Frisch, M. J., Trucks, G. W., Schlegel, H. B., Scuseria, G. E., Robb, M. A., Cheeseman, J. R., et al. (2016). Gaussian 16, Revision C.01. | Google Scholar
Gerakines, P. A., Hudson, R. L., Moore, M. H., and Bell, J.-L. (2012). In situ measurements of the radiation stability of amino acids at 15–140K. Icarus 220, 647–659. doi:10.1016/j.icarus.2012.06.001. CrossRef Full Text
Glavin, D. P., Freissinet, C., Miller, K. E., Eigenbrode, J. L., Brunner, A. E., Buch, A., et al. (2013). Evidence for perchlorates and the origin of chlorinated hydrocarbons detected by SAM at the Rocknest aeolian deposit in Gale Crater. J. Geophys. Res. Planets 118, 1955–1973. doi:10.1002/jgre.20144. CrossRef Full Text
Grimme, S., Antony, J., Ehrlich, S., and Krieg, H. (2010). A consistent and accurate ab initio parametrization of density functional dispersion correction (DFT-D) for the 94 elements H-Pu. J. Chem. Phys. 132, 154104. doi:10.1063/1.3382344. CrossRef Full Text | PubMed Abstract
Grimme, S., Ehrlich, S., and Goerigk, L. (2011). Effect of the damping function in dispersion corrected density functional theory. J. Comput. Chem. 32, 1456–1465. doi:10.1002/jcc.21759. CrossRef Full Text | PubMed Abstract
Hand, K., Murray, A. E., and Garvin, J. B. (2016). Europa Lander study 2016 report. JPL D-97667. Pasedena: NASA JPL. | Google Scholar
Hassler, D. M., Zeitlin, C., Wimmer-schweingruber, R. F., Ehresmann, B., Rafkin, S., and Eigenbrode, J. L, (2014). Mars' surface radiation environment measured with the Mars Science Laboratory's Curiosity rover. Science 343, 1244797. doi:10.1126/science.1244797. CrossRef Full Text | PubMed Abstract
Ivanov, M. A., Slyuta, E. N., Grishakina, E. A., and Dmitrovskii, A. A. (2020). Geomorphological analysis of ExoMars candidate landing site oxia planum. Sol. Syst. Res. 54(1), 1–14. doi:10.1134/s0038094620010050. CrossRef Full Text
Korablev, O. I., Dobrolensky, Y., Evdokimova, N., Fedorova, A. A., Kuzmin, R. O., Mantsevich, S. N., et al. (2017). Infrared spectrometer for ExoMars: a mast-mounted instrument for the rover. Astrobiology 17, 542–564. doi:10.1089/ast.2016.1543 | Google Scholar
Kounaves, S. P., Carrier, B. L., O’Neil, G. D., Stroble, S. T., and Claire, M. W. (2014). Evidence of Martian perchlorate, chlorate, and nitrate in Mars meteorite EETA79001: implications for oxidants and organics. Icarus 229, 206–213. doi:10.1016/j.icarus.2013.11.012. CrossRef Full Text
Lasne, J., Noblet, A., Szopa, C., Navarro-González, R., Cabane, M., Poch, O., et al. (2016). Oxidants at the surface of mars: a review in light of recent exploration results. Astrobiology 16, 977–996. doi:10.1089/ast.2016.1502. CrossRef Full Text | PubMed Abstract
Licari, D., Baiardi, A., Biczysko, M., Egidi, F., Latouche, C., and Barone, V. (2015). Implementation of a graphical user interface for the virtual multifrequency Spectrometer: the VMS-draw tool. J. Comput. Chem. 36, 321–334. doi:10.1002/jcc.23785. CrossRef Full Text
Madejová, J. (2003). FTIR techniques in clay mineral studies. Vib. Spectrosc. 31(1), 1–10. doi:10.1016/s0924-2031(02)00065-6 | Google Scholar
Madejová, J., Pálková, H., and Komadel, P. (2006). Behaviour of Li+ and Cu2+ in heated montmorillonite: evidence from far-, mid-, and near-IR regions. Vib. Spectrosc. 40, 80–88. doi:10.1016/j.vibspec.2005.07.004. CrossRef Full Text
Mahaffy, P. R., Webster, C. R., Cabane, M., Conrad, P. G., Coll, P., Atreya, S. K., et al. (2012). The sample analysis at mars investigation and instrument Suite. Space Sci. Rev. 170 (1–4), 401–478. doi:10.1007/s11214-012-9879-z. CrossRef Full Text
McLennan, S. M., Anderson, R. B., Bell, J. F., Bridges, J. C., Calef, F., and Campbell, J. L. (2014). Elemental geochemistry of Sedimentary rocks at yellowknife bay, Gale Crater, mars. Science 343, 1244734. doi:10.1126/science.1244734. CrossRef Full Text | PubMed Abstract
Millan, M., Szopa, C., Buch, A., Coll, P., Glavin, D. P., Freissinet, C., et al. (2016). In Situ Analysis of martian regolith with the SAM experiment during the First mars year of the MSL mission: identification of Organic molecules by gas Chromatography from laboratory measurements. Planet. Space Sci. 129, 88–102. doi:10.1016/j.pss.2016.06.007. CrossRef Full Text
Miller, K. E., Eigenbrode, J. L., Freissinet, C., Glavin, D. P., Kotrc, B., Francois, P., et al. (2016). Potential precursor compounds for chlorohydrocarbons detected in Gale Crater, Mars, by the SAM instrument suite on the Curiosity Rover. J. Geophys. Res. Planets 121, 296–308. doi:10.1002/2015je004939. CrossRef Full Text
Nazari-Sharabian, M., Aghababaei, M., Karakouzian, M., and Karami, M. (2020). Water on mars-A literature review. Galaxies 8 (2), 40. doi:10.3390/galaxies8020040. CrossRef Full Text
Negron-Mendoza, A., and Ramos-Bernal, S. (2004). “The role of clays in the origin of life,” in Origins. Cellular origin, life in extreme habitats and astrobiology. Editor J. Seckbach (Dordrecht: Springer), 181–194. | Google Scholar
Pavlov, A. K., Blinov, A. V., and Konstantinov, A. N. (2002). Sterilization of Martian surface by cosmic radiation. Planet. Space Sci. 50, 669–673. doi:10.1016/s0032-0633(01)00113-1. CrossRef Full Text
Poggiali, G., Fornaro, T., Potenti, S., Corazzi, M. A., and Brucato, J. R. (2020). Ultraviolet photoprocessing of glycine adsorbed on various space-relevant minerals. Front. Astron. Sp. Sci. 7, 18. doi:10.3389/fspas.2020.00018. CrossRef Full Text
Quantin, C., Carter, J., Thollot, P., Broyer, J., Lozach, L., Davis, J., et al. (2016). “Oxia Planum, the Landing Site for ExoMars 2018. Abstract 2863,” in 47th Lunar and planetary science conference. Houston, TX. (Houston, TX). | Google Scholar
Salvatore, M. R., Goudge, T. A., Bramble, M. S., Edwards, C. S., Bandfield, J. L., Amador, E. S., et al. (2018). Bulk mineralogy of the NE Syrtis and Jezero crater regions of Mars derived through thermal infrared spectral analyses. Icarus 301, 76–96. doi:10.1016/j.icarus.2017.09.019. CrossRef Full Text
Schon, S. C., Head, J. W., and Fassett, C. I. (2012). An overfilled lacustrine system and progradational delta in Jezero crater, Mars: implications for Noachian climate. Planet. Space Sci. 67(1), 28–45. doi:10.1016/j.pss.2012.02.003. CrossRef Full Text
Schuerger, A. C., Mancinelli, R. L., Kern, R. G., Rothschild, L. J., and McKay, C. P. (2003). Survival of endospores of Bacillus subtilis on spacecraft surfaces under simulated martian environments. Icarus 165, 253–276. doi:10.1016/s0019-1035(03)00200-8. CrossRef Full Text | PubMed Abstract
Schuerger, A., Richards, J., Newcombe, D., and Venkateswaran, K. (2006). Rapid inactivation of seven Bacillus spp. under simulated Mars UV irradiation☆. Icarus 181, 52–62. doi:10.1016/j.icarus.2005.10.008. CrossRef Full Text
Steel, E. L., Davila, A., and McKay, C. P. (2017). Abiotic and biotic Formation of Amino Acids in the enceladus Ocean. Astrobiology 17, 862–875. doi:10.1089/ast.2017.1673. CrossRef Full Text | PubMed Abstract
Steele, A., Benning, L. G., Wirth, R., Siljeström, S., Fries, M. D., Hauri, E., et al. (2018). Organic synthesis on Mars by electrochemical reduction of CO2. Sci. Adv. 4, eaat5118. doi:10.1126/sciadv.aat5118. CrossRef Full Text | PubMed Abstract
Steele, A., McCubbin, F. M., and Fries, M. D., (2016). The provenance, Formation, and implications of reduced Carbon Phases in martian meteorites. Meteor. Planet Sci. 51 (11), 2203–2225. doi:10.1111/maps.12670.
Steele, A., McCubbin, F. M., Fries, M., Kater, L., Boctor, N. Z., Fogel, M. L., et al. (2012). A reduced organic carbon component in martian basalts. Science 337, 212–215. doi:10.1126/science.1220715.
Vago, J. L., Westall, F., Coates, A. J., Jaumann, R., Korablev, O., Ciarletti, V., et al. (2017). Habitability on early mars and the search for biosignatures with the ExoMars Rover. Astrobiology 6, 309–347. doi:10.1016/b978-0-12-809935-3.00011-6
Vaniman, D. T., Bish, D. L., Ming, D. W., Bristow, T. F., Morris, R. V., and Blake, D. F. (2014). Mineralogy of a mudstone at yellowknife bay, Gale Crater, mars. Science 343, 1243480. doi:10.1126/science.1243480.
Walter, N., Horneck, G., Walter, N., Westall, F., Grenfell, J. L., Martin, W. F., and Gomez, F. (2016). AstRoMap European Astrobiology roadmap. Astrobiology 16, 201–243. doi:10.1089/ast.2015.1441.
Wiens, R. C., Maurice, S., and Rull Perez, F. (2017). The SuperCam remote sensing instrument suite for the Mars 2020 rover mission: A preview. Spectroscopy 32(LA-UR-17–26876), 29–37. doi:10.1117/12.2296230
Keywords: molecular biosignatures, Mars, UV irradiation, infrared spectroscopy, life detection
Citation: Fornaro T, Brucato JR, Poggiali G, Corazzi MA, Biczysko M, Jaber M, Foustoukos DI, Hazen RM and Steele A (2020) UV Irradiation and Near Infrared Characterization of Laboratory Mars Soil Analog Samples. Front. Astron. Space Sci. 7:539289. doi: 10.3389/fspas.2020.539289
Received: 29 February 2020; Accepted: 14 October 2020;
Published: 18 November 2020.
Edited by:
Isik Kanik, NASA Jet Propulsion Laboratory (JPL), United StatesReviewed by:
Oliver Strbak, Comenius University, SlovakiaJosep M. Trigo-Rodríguez, Consejo Superior de Investigaciones Científicas (CSIC), Spain
Jan Hendrik Bredehöft, University of Bremen, Germany
Copyright © 2020 Fornaro, Brucato, Poggiali, Corazzi, Biczysko, Jaber, Foustoukos, Hazen and Steele. This is an open-access article distributed under the terms of the Creative Commons Attribution License (CC BY). The use, distribution or reproduction in other forums is permitted, provided the original author(s) and the copyright owner(s) are credited and that the original publication in this journal is cited, in accordance with accepted academic practice. No use, distribution or reproduction is permitted which does not comply with these terms.
*Correspondence: Teresa Fornaro, dGVyZXNhLmZvcm5hcm9AaW5hZi5pdA==