 Yihua Yan1,2*
 Zhijun Chen1Wei Wang1
 Fei Liu1
 Lihong Geng1
 Linjie Chen1Chengming Tan1,2
 Xingyao Chen1Cang Su1Baolin Tan1,2
- 1CAS Key Laboratory of Solar Activity, National Astronomical Observatories, Chinese Academy of Sciences, Beijing, China
- 2School of Astronomy and Space Science, University of Chinese Academy of Sciences, Beijing, China
The Chinese Spectral Radioheliograph (CSRH) covering 400 MHz-15 GHz frequency range was constructed during 2009–2016 in Mingantu Observing Station, National Astronomical Observatories, Chinese Academy of Sciences at Zhengxiangbaiqi, Inner Mongolia of China. The CSRH is renamed as MingantU SpEctral Radioheliograph (MUSER) after its accomplishment. Currently, MUSER consists of two arrays spreading over three spiral-shaped arms. The maximum baseline length is ∼3 km in both east-west and north-south directions. The MUSER array configuration is optimized to meet the needs of observing the full-disk Sun over ultrawide wavebands with images of high temporal, spatial and spectral resolutions and high dynamic range. The low frequency array, called MUSER-I, covers 400 MHz-2.0 GHz with 40 antennas of 4.5-m-diameter each and the high frequency array, called MUSER-II, covers 2–15 GHz with 60 antennas of 2-m-diameter each. The MUSER-I can obtain full-disk solar radio images in 64 frequency channels with a time cadence of 25 ms and a spatial resolution of 51.6″ to 10.3″ (corresponding to the frequency range 400 MHz to 2 GHz), whereas the MUSER-II can obtain full-disk solar images in 520 channels with a time cadence of 206.25 ms and a spatial resolution of 10.3″ to 1.3 (corresponding to the frequency range 2 to 15 GHz). A dynamic range of 25 dB can be obtained with snapshot images produced with the MUSER. An extension of MUSER in the further lower frequency range covering 30–400 MHz with an array of 224 logarithm-periodic dipole antennas (LPDAs) has been approved and will be completed during the next 4 years. The MUSER, as a dedicated solar instrument, has the following advantages providing simultaneous images over a wide frequency range with a unique high temporal-spatial-spectral resolutions; high-performing ultrawide-band dual-polarization feeds for wide-band signal collection; advanced high data-rate, large-scale digital correlation receiver for multiple-frequency and faster snapshot observations; and applications of new technologies such as using optical fiber to obtain remote antenna and wide-band analog signal transmission. The MUSER thus provides a unique opportunity to measure solar magnetic fields and trace dynamic evolution of energetic electrons in several radio frequencies, which, in turn, will help to have better understandings of the origin of various solar activities and the basic drivers of space weather.
1 Introduction
Solar radio bursts are rich with information as they are associated with different types solar eruptions, such as solar flares, coronal mass ejections (CMEs), and various thermal and nonthermal processes. The solar eruptions are believed to arise due to the sudden energy release process because of topological re-organization of solar magnetic field or magnetic reconnection (Benz, 2009). Radio bursts are hence prompt indicators of those solar activities. X-ray observations show that non-thermal particles are highly related to the energy release process and demonstrate a significant amount of total flare energy during initial phase of solar flares (Lin (2008)). Normally, the radio bursts are observed in an ultrawide frequency range, starting from decimetric wavelength range, extending down to a few tens of KHz and up through several GHz even up to mm-wavelengths in a short time scale (e.g., Benz, 2009). Especially, the radio observations covering centimeter and decimetric wavelengths are important as they can reveal key informations about the energy release, and particle acceleration and transportation (Bastian et al., 1998; Gary and Keller 2004; Aschwanden 2005; Pick and Vilmer 2008; Chernov et al., 2014).
The radio burst emissions were commonly generated by different mechanisms. If the plasma mechanism were assumed as the generation mechanism, one can infer from statistical study of radio dynamic spectra during different flare events that the electrons are accelerated from a region with electron density of
Many studies on the associations between hard X-ray (HXR) and radio emissions demand this need. For example, Vilmer et al., 2002 studied and compared locations of RHESSI HXR and NRH radio sources observed for a flare event on 20 February 2002. Since the direct link between HXR and radio emissions was not available from observations, it was hard to understand the details of magnetic reconnection and the energy conversion processes, including their temporal and spatial evolutions. Therefore, it is crucial to image radio emissions in wide centimetric and decimetric wavelengths in order to cover the whole acceleration sites and primary propagation regions of nonthermal electrons which are responsible for the HXR emission. Trottet et al. (2006) carried out a detailed analysis of the HXR images observed by the Yohkoh and the radio images observed by the NRH in a flare on 5 November 1998. They found the evidence that the HXR and radio-emitting electrons were produced by the same accelerator. However, the available observations and analysis did not allow them to make a definite connection between the HXR source region and the radio source sources in the middle corona. Therefore, the spectral imaging observations in frequency range higher than 400 MHz are really important in this regard. As for the famous flare event on 13 December 2006, many radio fine structures were registered by the Chinese Spectral Broadband Radio Spectrometer (SBRS) in the microwave range. Deduced from the microwave Zebra Patterns (ZPs), it was found that the scale-height ratio between plasma density and magnetic field decreased by a factor of about 2 before and after the flare maximum (Yan et al., 2007). A further statistical investigation from 74 ZPs confirmed the above result (Yu et al., 2012). However, due to lack of observations of the relevant coronal magnetic field structures, it is difficult to present an exact interpretation of the above results. The radio imaging—spectroscopy over a wide frequency range provide such observations. The spectral observations of small-scale microwave bursts (SMBs) in solar flares provides the evidence of small—scale elementary energy releasing activities and electron accelerations in the flaring source regions (Tan, 2013), however, in order to understand the nature of SMBs, we need imaging-spectroscopy in the related frequency range, which may provide the real position of the source region, the relevant magnetic field, and the relationship with the physical mechanisms. The microwave type III pairs (Aschwanden and Benz 1997; Tan et al., 2016) indicate that the frequency where magnetic reconnection and particle acceleration taking place occurred around 0.3–3.4 GHz, but we need imaging observations at the corresponding frequencies to deduce the magnetic fields and the relevant topological structures. Thus, the solar radio imaging-spectroscopy can provide the following crucial information for the solar bursts: 1) positions, 2) topological structures, 3) coronal magnetic fields, and 4) spatio—temporal evolutions. With these informations, we can deduce the primary energy release, particle acceleration, and the mass-energy transportation, furthermore, predicting the occurrence of the solar bursts and their corresponding influences on space weather.
Several general purpose radio telescopes can also be used to observe the Sun, such as the VLA (Napier et al., 1983), the Low-Frequency Array (van Haarlem et al., 2013) and the (Swarup, 1991). The upgraded VLA has been used for solar studies (e.g., Chen et al., 2013; Chen et al., 2015). However, as they were primarily built for non-solar radio astronomical objectives, only about 2% time is available for solar observations, and their field of view is normally too small to cover the whole solar disk. In fact, the solar-dedicated instrument of imaging spectroscopy should have high temporal, spatial, and spectral resolutions and at least with field of view more than 32 arc-minute simultaneously (Bastian et al., 1998; Hudson and Vilmer, 2007; Pick and Vilmer, 2008). The Chinese Spectral Radioheliograph (Yan et al., 2004) and the Frequency-Agile Solar Radiotelescope (FASR, Bastian, 2003; Gary, 2003) proposed to realize this goal. The FASR is still not granted for construction yet and the Expanded Owens Valley Solar Array (Gary et al., 2018) has been developed as a pathfinder for the FASR (Nita et al., 2016). The microwave spectral imaging observations of the well known X8.2-class limb flare on 2017 September 10 by EOVSA have been extensively studied to indicate the nonthermal emissions by flare- and shock-accelerated electrons (Gary et al., 2018; Fleishman, et al., 2020; Karlický et al., 2020), or the detection of nonthermal emission at conjugate flux rope footpoints showing the solid evidence of particle transport along the erupting magnetic flux rope during the early impulsive phase (Chen et al., 2020).
The Chinese solar physics community had planned to build a radioheliograph since 1960s. Some pre-studies were carried out on proposals for radioheliograph in either centimeter-band (Hu et al., 1984) or millimeter-band (Fu et al., 1997), but none of these had been implemented. Following these lines, it was suggested to build a Chinese Spectral radioheliograph in the decimetric to centimeter wavelength range (Yan et al., 2004). It was later recommended as one of the two major ground-based facilities by Chinese solar physics community in 2006. A 2-element interferometer prototype was built and tested for tackling the key technologies in 2004–2005 (Yan et al., 2009). The Chinese Spectral Radioheliograph was officially supported in 2009 as a National Major Scientific Research Facility Program of China. The site survey was pursued at Mingantu town in Inner Mongolia of China. The radio quiet zone protection of 10 km radius centered at Mingantu Observing Station has been setup since 2008. The construction was fulfilled during 2009–2016, and the instrument was renamed as MingantU SpEctral Radioheliograph (MUSER) after its accomplishment, as seen in Figure 1. The brief description and progress of MUSER project while it was under construction as well as a few initial results from MUSER were reported by Yan et al. (2013); Yan et al. (2016). The Meridian-II project among the Major National Infrastructure Projects for Science and Technology under “13th 5-year plan” program (2016–2020) has been approved and a Solar and Interplanetary subsystem as a new part in the Meridian-II project will include a logarithm-periodic dipole antenna (LPDA) array at metric and decametric wave range to be built in the Mingantu Observing Station (Blanc et al., 2020).
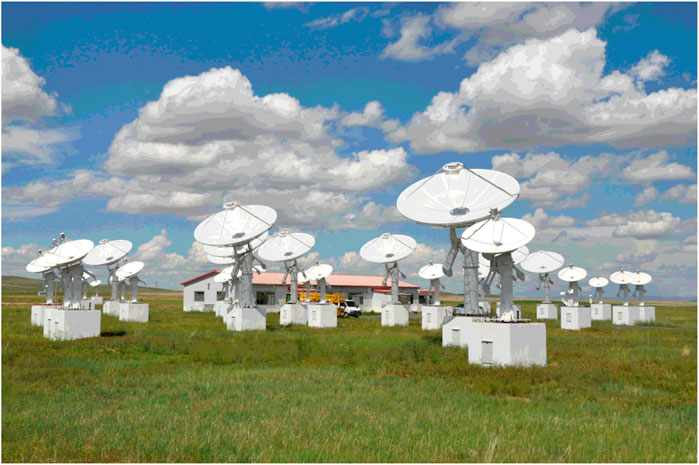
FIGURE 1. Central part of MUSER-I and MUSER-II arrays.
The key technical issues consist of implementing high cadence imaging with an aperture synthesis system at about two order higher multiple frequencies than the presently-available radioheliographs over an ultrawide frequency band, and the data processing for such a large data volume from MUSER. We introduce the MUSER system description in § 1. The calibration and synthesis imaging are described in § 2. The observational results are presented in § 3 and the future plans are briefly described in § 4. Finally, we summarize our conclusions in § 5.
2 Description of MUSER
The MUSER is a solar-dedicated radio interferometric array with high temporal, spatial and spectral resolutions, and it can simultaneously perform the spectral and imaging observations of the full Sun in a wide frequency range (Yan et al., 2004; Yan et al., 2009). The main characteristics and performance are listed in Table 1. The MUSER currently covers the centimetric to decimetric wave range, including MUSER-I operating in the frequency range of 400 MHz–2 GHz and MUSER-II in 2–15 GHz. The MUSER-I array contains 40 antennas with 4.5 m diameter each, and the MUSER-II array contains 60 antennas with 2 m diameter each. All the 100 antennas are located on three log-spiral arms with the maximum baseline length of about 3 km in both north-south and east-west directions. The MUSER antennas, numbered as IA#, IB#, IC# from 1 to 13 for MUSER-I array and HA#, HB#, HC# from 1 to 20 for MUSER-II array in local coordinates with the central antenna IA0 as the reference point, are schematically shown in black dots in Figure 2. IA0’s location is E 115°15'1.8”, N 42°12′42.6″, with an altitude of 1365 m. The central part of the MUSER arrays is shown in Figure 1.
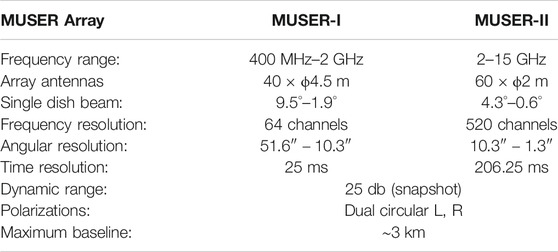
TABLE 1. MUSER characterestics and performance.
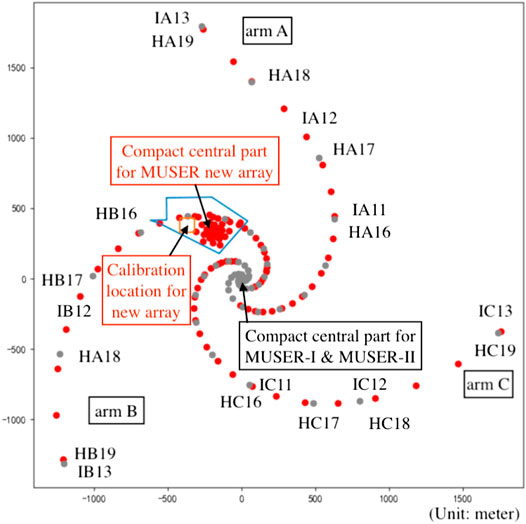
FIGURE 2. The array configuration for extension of MUSER to lower frequency range of 30–400 MHz with black dots indicating existing MUSER-I and MUSER-II antennas whereas red dots indicating the locations for the newly designed 100 LPDAs. The blue area is the region where the compact central part of the new MUSER low frequency array will be located. The red square indicates the location where the compact calibration array with 124 LPDAs will be placed. Some MUSER-I and MUSER-II antenna locations are marked with corresponding antenna numbers.
Figure 3 shows the schematic system block diagram for MUSER. The signal processing for MUSER-I (400 MHz–2 GHz) and MUSER-II (2–15 GHz) is almost same. Additionally two 20-m antennas (400 MHz–1 GHz) were established for interferometry experiment in 2011 at the same site. They are proposed to work as a part of MUSER-I array for calibrations. Figure 3 shows that the solar radio signal (400 MHz–2 GHz, 2–15 GHz) as received by the MUSER-I and MUSER-II antennas with broadband feeds, front-end LNAs and optic transmitters. The signal is then transmitted through optic fibers to indoor analog receivers with an Intermediate frequency (IF) output of 400 MHz bandwidth (50–450 MHz), which covers the whole bandwidth by sweeping four times for MUSER-I and 33 times for MUSER-II. It takes 25 ms to cover the 400 MHz–2 GHz bandwidth of MUSER-I by sweeping. For MUSER-II, the sweeping time is ∼200 ms. The observing mode implemented in MUSER allows us to observe at a given frequency in full 25 ms without band or polarization switching. So it provides the flexibility to investigate useful information by setting the working mode of the instrument. The 400-MHz IF signal is received by a digital correlation receiver. Firstly, it is sampled with 1 Gsps Analog to Digital converters (ADC), then goes into the polyphase filter bank (PFB). The PFB generates 16 complex baseband signals with ∼2–25 MHz simultaneously. All baseband signals with same frequency are computed to send out the correlation data. The time delay compensation and fringe stopping are implemented in the digital correlation receiver (Liu et al., 2019). Both MUSER-II and MUSER-I has the same architecture in their digital correlation receivers. The whole correlation procedure is controlled by a monitoring subsystem.
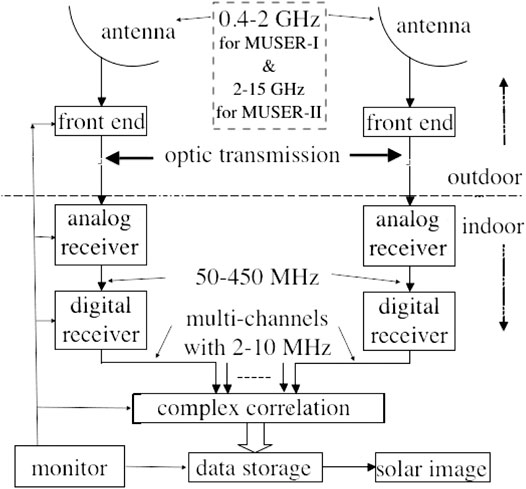
FIGURE 3. The schematic system block diagram of MUSER-I and MUSER-II. Both have a similar system structure except that the radio frequency (RF) input is 0.4–2 GHz for MUSER-I whereas 2–15 GHz for MUSER-II (Yan et al., 2013).
Among the various issues of aperture synthesis techniques for MUSER (Taylor et al., 1999; Thompson et al., 2017), one of the key problems is to develop a high performance ultra-wide band feed for the reflector antennas. Such feed should have wide impedance bandwidth, low profile, symmetrical radiation patterns, and fixed phase center over the whole frequency band. So far, the eleven feed (Olsson et al., 2006) can be used for observing the slow-evolving astrophysical objects since its original version only has a maximum return loss of about
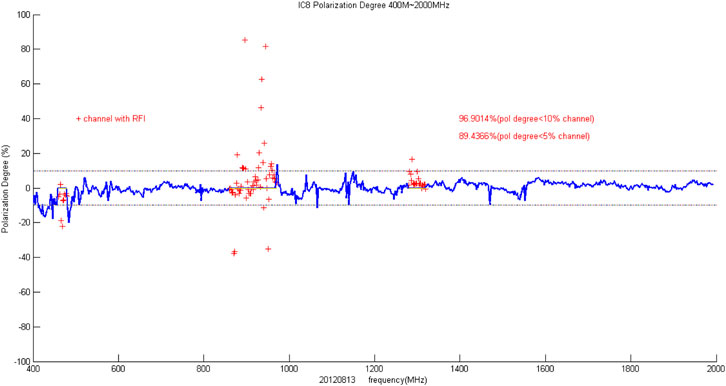
FIGURE 4. Polarization degree, or
3 Muser Observations
The MUSER array began observations in 2014, routinely observed the Sun from 2016, roughly in a time range from 01:00 to 08:00 UT. In total, the MUSER has accumulated more than 390 TB observational data. Considering a large amount of raw data, it has not been available in an online archive so far. But the data are public and interested users can get in touch with us if they are looking for some specific data. There were fewer spectral events observed by MUSER-II in the high frequency band. Wang et al. (2019) proposed a new restoration method for the data processing of MUSER-II observations at 4.2 GHz, which shows a better quality than using the deconvolution algorithm for the production of radio images. Here, more attentions were paid to a lower frequency band, which show more fruitful spectral structures. During 2014–2019, a total number of 85 solar radio burst events have been registered by the MUSER-I, as shown in Table 2. More than 60 radio burst events contain the fine structures. The MUSER data are processed using the radio astronomy software, Common Astronomy Software Applications (CASA) and the own developed Fourier routines. The data processing code has been made available at https://github.com/astroitlab/museros (Mei et al., 2018). A brief introduction of the pipeline for data processing was discussed in Mei et al. (2018) and Chen et al. (2019). Next, we will present three typical solar radio burst events observed by MUSER.
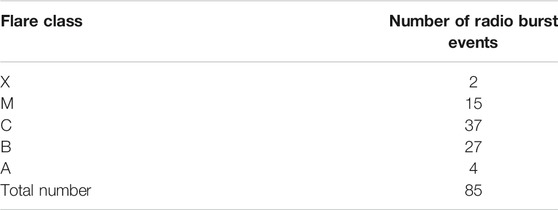
TABLE 2. Event list of MUSER in 2014–2019.
3.1 A Radio Burst Event on 11 November 2014
During 04:22-04:24UT On 11 Nov 2014, a radio burst event was recorded by MUSER-I array at 400 MHz–2 GHz. Figure 5 presents a comparison of time profiles of GOES SXR flux, the NoRP radio flux at 2 GHz and MUSER-I radio fluxes at several frequencies in the range of 400 MHz-2 GHz. It was wrongly attributed to a C-class flare (started from 04:22 UT and peaked at 04:49UT) near the disk center according to SGD event list (http://www.swpc.noaa.gov/products/goes-x-ray-flux). The Nobeyama Radio Polarimeters (NoRP) also demonstrated strong burst signals at 1, 2, and 3.75 GHz during 04:22-04:24 UT but weaker signals at higher frequencies. While NoRH (Nakajima et al., 1994) observations at 17 and 34 GHz obtained the small burst around the flare peak at 04:49 UT, the MUSER observations show that a non-thermal process happened during the flare impulsive phase was not associated with this C-class flare. The radio images obtained from MUSER-I at 1.7 GHz show that the radio source is located at the east limb of the Sun, not in the solar disk area, as shown on top panels in Figure 6 at different times before, during and after the radio burst. In order to identify the correctness of the radio sources, we checked the EUV images observed by AIA/SDO (Lemen et al., 2012) during the same time period and at the same location. The EUV images at wavelength of 94 Å and 131 Å are presented in the middle and bottom panels of Figure 6. It is found that there were indeed loop opening at 94 Å and 131 Å corresponding to hot plasmas whereas responses at other EUV wavelengths were not so obvious. A CME event with a signature starting around 04:36 UT was observed by SOHO/LASCO (Brueckner et al., 1995), which indicates the CME at that location (Figure 7). As there was no radio burst at higher frequencies at the solar east limb, we propose that the decimetric radio burst starting at 04:22 UT in the east limb was due to the solar eruptions taking place in the backside of the Sun but it was very close to the east limb. As radio bursts occurred at higher altitude which can be observed by MUSER-I in the Earth direction. Its occurrence during the impulsive phase of the C-class flare in the solar disk was just a coincidence and there should be no physical connection to the C-class flare on the solar disk. This demonstrate the importance of the image spectroscopy observation of the solar radio burst (Yan et al., 2016).
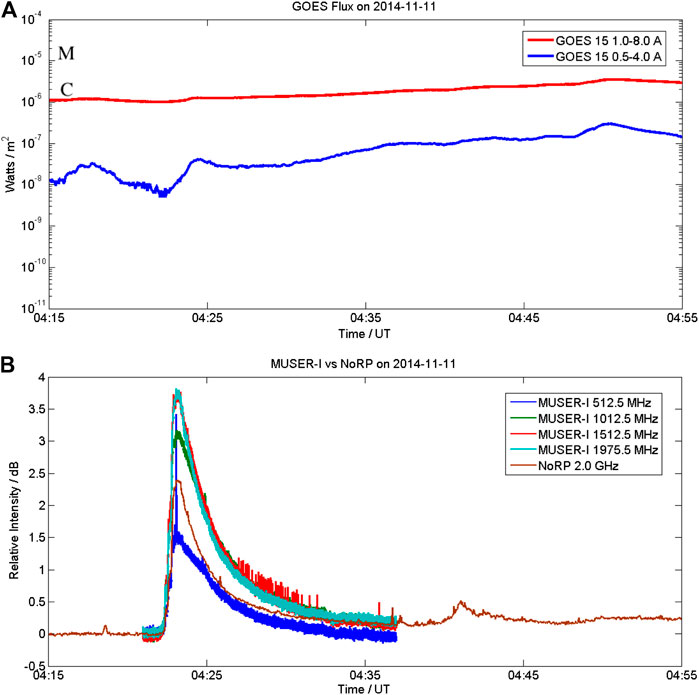
FIGURE 5. (A) The temporal profiles of GOES SXR flux for the C3.4 class flare starting from 04:22 UT and peaked at 04:49 UT on 11 November 2014. (B) The NoRP radio flux at 2 GHz(brown) and MUSER-I radio fluxes at 0.5125, 1.0125, 1.5125 and 1.9755 GHz of the burst event peaked at 04:23 UT in a relative unit.
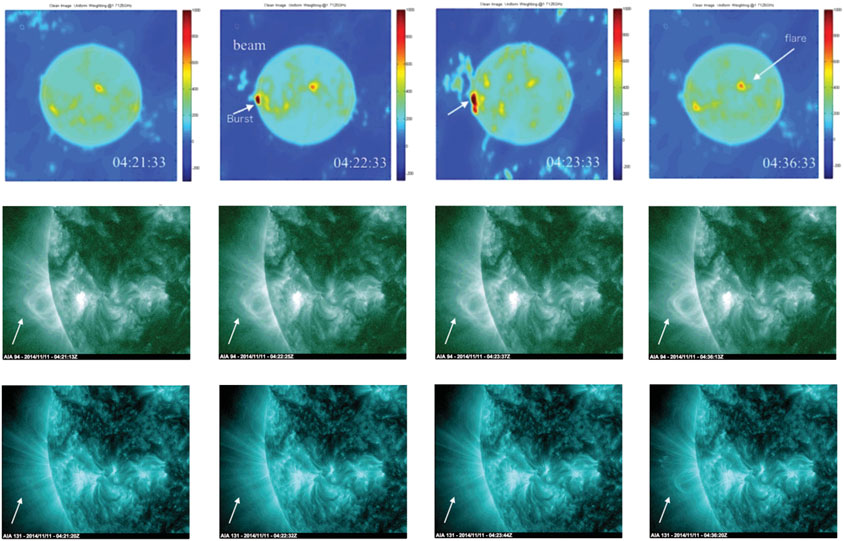
FIGURE 6. Top panel: The radio images obtained at 04:21:33 UT (before), 04:22:33 UT (during), 04:23:33 UT (around peak) and 04:36:33 UT (after) the decimetric radio burst. Middle panel: The EUV images obtained at 94 Å corresponding to almost the same instants (04:21:13 UT, 04:22:25 UT, 04:23:37 UT, 04:36:13 UT) showing the faint eruptive feature of loop opening as indicated by the arrow. Bottom panel: The EUV images obtained at 131 Å corresponding to almost the same instants(04:21:20 UT, 04:22:32 UT, 04:23:44 UT, 04:36:20 UT) showing the faint eruptive feature of loop opening as indicated by the arrow.
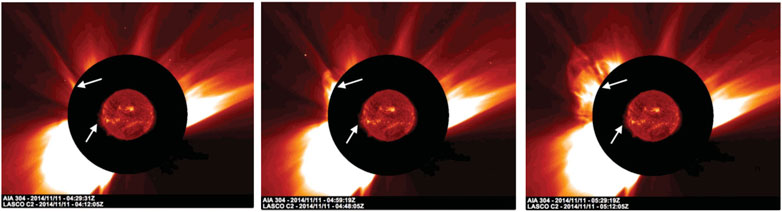
FIGURE 7. The CME process recored by the SOHO/LASCO C2 at 04:29, 04:59 and 05:29UT after the radio burst. The CME and radio burst locations are indicated by the arrows, respectively.
3.2 A Radio Burst Event on 17 December 2014
The spectral imaging of quasi-periodic pulsations (QPPs) overlaid on a type IV microwave continuum was recorded by MUSER at frequencies of 1.2–2.0 GHz for the first time. It took place during 04:25-04:45 UT in an M8.7 flare (start at 04:25 UT, peak at 04:51 UT) in active region AR12242 on 2014 December 17.
The flare region has circular ribbons over multiple-scale loop structures as revealed by the EUV images of AIA/SDO. The flare-related loops can be classified into three groups: small-scale low-lying loops, intermediate dome-like structure, and a group of large-scale loops.
The radio observations (shown in Figure 8) indicates that 1) the temporal profile at 2 GHz is similar to that of NoRP, but with more spikes superimposed on an increasing-to-decreaing intensity profile; 2) the intensity profile integrated from the radio images of the source region at 1.7 GHz matches well with the temporal profile at 1.7 GHz obtained from the spectrum; 3) the period of the radio QPP at 2.0 GHz is about 121s from the wavelet analysis; 4) the size of the radio source varies from small to large and then small at a given intensity and frequency, which corresponds to the evolutions of radio emission processes; 5) the radio sources locate in the middle of the active region, over the positive magnetic field; 6) the radio sources at six frequencies line up nicely and move along the similar expanding direction of flaring loop. The detailed data processing of spectral and imaging observations of the radio source, the main features and complicated interactions among different loops, and the physical relationships from various multi-wavelength observations to the possible mechanisms of QPPs have been presented in Chen et al. (2019).
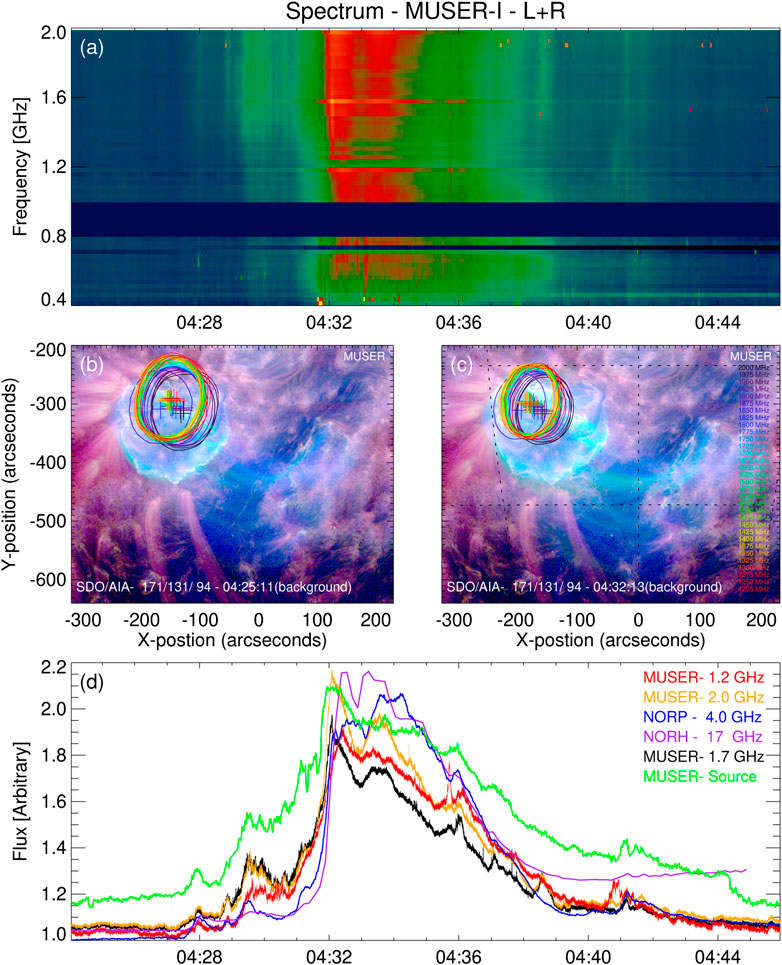
FIGURE 8. (A) The dynamic spectrum of quasi-periodic pulsations overlaid on type IV solar radio continuum was recorded by MUSER-I in a time range of 04:25–04:45 UT and a frequency range of 1.2–2.0 GHz. (B) and (C) Images of the radio source with a 50% intensity level observed at multi frequencies from 1.2 GHz(red) to 2.0 GHz (black), overlaid on the AIA images of three combined wavelengths at the start (04:25 UT) and peak (04:32 UT) time of the radio burst. The radio source centroids were marked by the plus signs. (D) The radio flux curves from NoRP, the spectrum of MUSER and the intensity of radio source from MUSER imaging (green).
3.3 A Radio Burst Event on 22 November 2015
The solar fine radio burst of November 22, 2015 event is shown in the Figure 9. It was occurred just at the beginning of a small SXR flare (indicated by an arrow on the top panel of Figure 9). The reported C5.6 SXR flare was occurred during 5:31-05:41UT. The middle panel of the figure is the cross correlation spectrum of all baselines, while the bottom panel is the auto-correlation intensity spectrum of all antennas. The middle panel showed the fine structures more details and more clear than bottom panel. This indicated that the sensibility of all baselines is much better than that of all antennae. The inverted V like shape fine structures occurred between 04:51:27 and 04:51:41 UT. First, groups of spiky narrowband strip bursts drifted slowly from higher to lower frequencies, and after 04:51:31.2UT they globally drifted slowly and reversely to higher frequencies. The global upward drifting rate is about −22 ∼ –33 MHz/s, while the global downward drifting rate is about 29∼35 MHz/s. The speed of plasmoid can be estimated about 2200∼3500 km/s under the 30 times of Newkirk model. It is interesting that hundreds of individual narrow band spiky strips have much higher drifting rates upward and downward within the rising and downward branches. Before 04:51:31.2UT, about 66 percent individual strips are with fast upward drifting rate of −350 ∼ –3000 MHz/s, 18 percent are with fast downward drifting rate of 650∼5250 MHz/s, and the rest 16 percent are with measureless drifting rate. After 04:51:31.2UT, about 19 percent individual strips are with fast upward drifting rate of −200 ∼ −3000 MHz/s, 64 percent are with fast downward drifting rate of 357∼3500 MHz/s, and the rest 16 percent are with measureless drifting rate. The speed of electron beam can be also estimated of >0.12c under the 30 times of Newkirk model. Further studies on imaging spectroscopy of the event associated with other space and ground-based observations are under way.
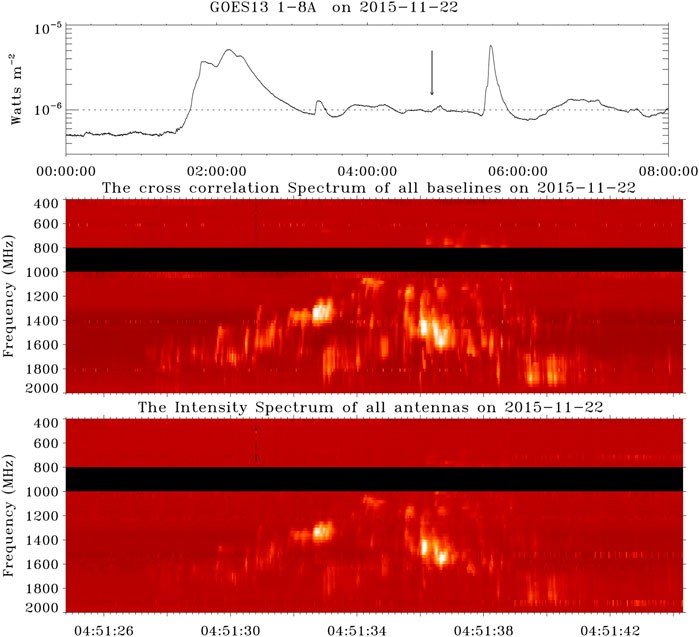
FIGURE 9. Top panel: The GOES SXR profile during 0–8 UT on 22 November 2015. The arrow indicates the moment where the radio burst fine structures occurred. Middle panel: The averaged cross correlation spectrum of all MUSER-I baselines for a radio burst fine structure event with about 15 s duration occurred around 04:51:35 UT. Bottom panel: The auto-correlation intensity spectrum of all MUSER-I antennas.
4 Extension of MUSER to 30–400 MHZ Band
The project to extend MUSER to 30–400 MHz frequency regime with 224 LPDAs has been approved under the Meridian-II Project which is a National Science Infrastructure Project under “13th 5-years plan” program (2016–2020). Solar and Interplanetary Subsystem as a new part in Meridian-II project will include metric and decametric wave range with a LPDA array to be built in Mingantu Observing Station.
The array configuration for extension of MUSER to lower frequency range of 30–400 MHz with 100 LPDAs has been optimized to achieve minimum RMS number derivation of antenna distributions in axial direction and minimum RMS number derivation of antenna distributions with respect to a Gaussian distribution in the radial direction. Some LPDAs’ locations are adjusted to avoid blocking to each other during observations. As the original central part of the MUSER-I and MUSER-II arrays is populated with dense antennas, there is no sufficient space to allocate new LPDAs. So the compact central part of the new array is chosen to be close to the arm B and 31 LPDAs can be allocated there, as shown in the region outlined by blue area in Figure 2. The rest 69 LPDAs are spread over three arms with 20 LPDAs in arm A, 25 LPDAs in arm B and 24 LPDAs in arm C, with red dots indicating the locations of the newly designed 100 LPDAs in Figure 2. Within the compact area located in the red square in Figure 2, a total of 124 LPDAs will be grouped into 16 sub arrays with 1 central subarray containing 19 LPDAs whereas rest subarray each containing 7 LPDAs. The 16 subarray will form a phased array for calibration as shown in Figure 10. The snapshot uv distribution and the synthesized beam at 200 MHz are shown in Figure 11. The performance of the MUSER array in metric and decametric wave range is listed in Table 3.
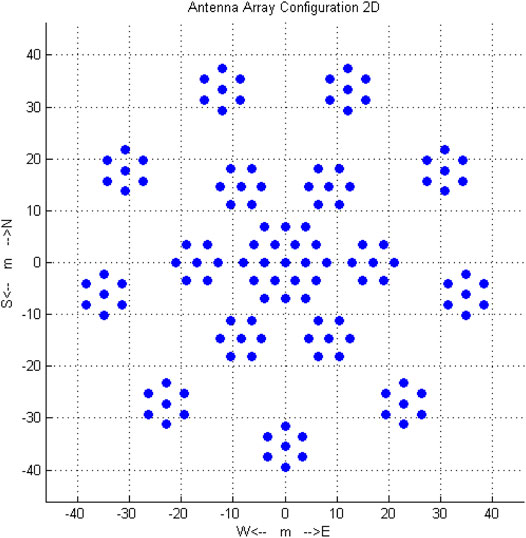
FIGURE 10. The compact phased array configuration for calibration of the MUSER array in metric and decametric wave range with 124 LPDAs.
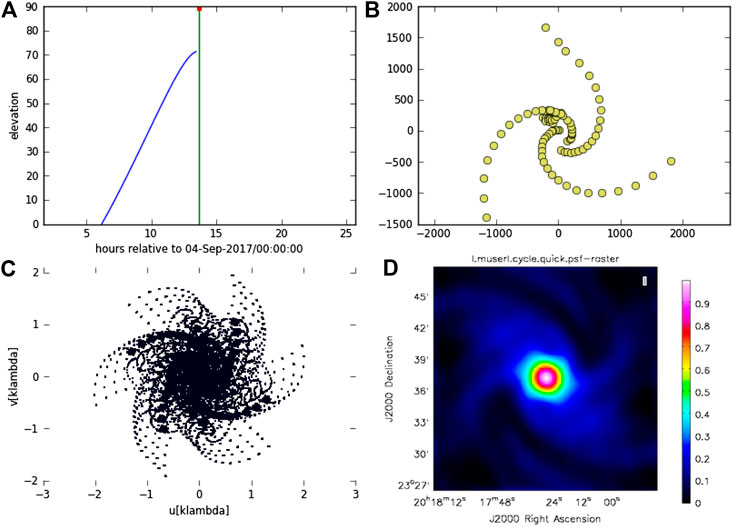
FIGURE 11. (A) The hour angle and declination of the Sun on September 2017. (B) The 100 LPDA locations of MUSER extension to 30–400 MHz. (C) The snapshot uv distribution at 200 MHz. (D) The synthesized beam at 200 MHz.
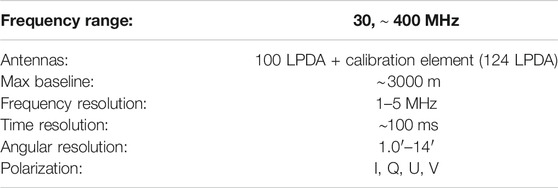
TABLE 3. Performance of MUSER in metric and decametric wave range.
The extension of MUSER to lower frequency range of 30–400 MHz will be built in the next a few years. These radio facilities will be very important tools for monitoring solar disturbances from the Sun to the Earth environment and they will play fundamental role for space weather studies and monitoring.
5 Summary
A dedicated solar radio interferometer MUSER was built in China, covering the frequency range 0.4–15 GHz, targeting high time, space and frequency resolutions with an aim to produce simultaneous solar radio images over a wide frequency band. The images obtained with MUSER can provide a unique opportunity to study different types of solar eruptive activities, such as flares and CMEs processes and their evolutions in decimetric and centimetric radio wavelengths. The few initial results as discussed here provides the evidence for the successful use of MUSER observations yielding the measurements and imaging of solar magnetic fields covering from the solar chromosphere to the higher corona, helping to understand the physics of various solar activities involved and the basic drivers of space weather activities. The MUSER and its extension to metric and decametric wavelengths will further play the role of the new-generation radioheliographs, and will be the major solar-dedicated leading radio facility in the world for carrying out solar physics and space weather studies.
Data Availability Statement
Further inquiries can be directed to the corresponding author. Our observed events are listed from the link: http://mos.bao.ac.cn
Author Contributions
YY led the design, construction and operation of the MUSER and developed the observational strategy, methodology, and calibration for MUSER system; He also guided the analyses of MUSER data, and wrote the draft manuscript; ZC proposed the methodology for achieving high-performance feeds of MUSER and coordinated the construction of MUSER antenna and feed sub-system; WW designed the configurations for MUSER arrays and developed software for imaging and calibration; FL developed the MUSER digital correlator prototype and coordinated the construction of monitoring and digital correlating sub-system of MUSER; LG coordinated the construction of MUSER analogous receiving sub-system; LC implemented the software for imaging and calibration; CT developed pipeline for spectra analysis and visualization under the guidance of YY and WW; XC conducted the event analysis under the guidance of YY, WW, LC and BT; CS contributed to the MUSER feed performance evaluations and the configuration for future MUSER metric and decametric wave array under the guidance of YY and WW; and BT contributed to the interpretation of MUSER observations. All authors discussed the interpretation of the data, contributed scientific and technical results, and helped prepare the paper.
Funding
National Major Scientific Research Facility Program of China with the grant Number ZDYZ2009-3 for construction of MUSER; NSFC grants (11790301, 11790305, 11973057, 11773043) for calibration and data analyses of MUSER; and National Key R\&D Program of China (2018YFA0404602) for related interferometry studies.
Conflict of Interest
The authors declare that the research was conducted in the absence of any commercial or financial relationships that could be construed as a potential conflict of interest.
Acknowledgments
We thank many scientists and engineers who helped design and build MUSER. In particular, we thank Prof. Guoxiang Ai (NAOC) for his support on the initiation of the project, and Profs. Cheng Fang, Jingxiu Wang, Monique Pick, Alain Kerdraon, Hiroshi Nakajima, Kiyoto Shibasaki, Subra Ananthakrishnan, Tim Bastian, Dale Gary, Fushun Zhang and Jian Zhang for their valuable helps and commnets about MUSER design and construction. We also thank Jingchao Geng, Chuanfeng Niu, Yuecheng Zhang, Lifeng Wu, Lihui Wei, Qinghui Song, Jutao Li, Chunhui Qu, with a large, skillful, and dedicated team during the construction of MUSER. We wish to acknowledge many individuals who contributed to the success of the MUSER. Prof. Feng Wang and his skillful team including Dr Ying Mei, etc., are acknowledged for the development of MUSER data processing pipeline. Several former and current PhD students have been involved in the design and construction of MUSER, MUSER testbed experiments as well as MUSER data processing, who are Yujiang Dou, Donghao Liu, Sijie Yu, An Zhao, Sha Li, Jing Du, Zhichao Zhou, Minghui Zhang, etc. We also acknowledge Cambridge University Press for permission to reproduce our previous figures here (Figures 3, 4).
References
Aschwanden, M. J., and Benz, A. O. (1997). Electron densities in solar flare loops, chromospheric evaporation upflows, and acceleration sites. ApJ 480, 825. doi:10.1086/303995
Bastian, T. S. (2003). Society of photo-optical instrumentation engineers (SPIE) conference series. Washington, DC: SPIE 4853, 98.
Bastian, T. S., Benz, A. O., and Gary, D. E. (1998). Radio emission from solar flares. Annu. Rev. Astron. Astrophys. 36, 131. doi:10.1146/annurev.astro.36.1.131
Benz, A. O. (2009). Landolt-bornstein-group VI astronomy and astrophysics numerical data and functional relationships in science and Technology (Berlin Heidelberg: Springer-Verlag) , Vol. 4B, 189.
Blanc, M., (2020). Science objectives and observation system for the international meridian circle. Taikong, China: ISSI-BJ Magazine.
Brueckner, G. E., Howard, R. A., Koomen, M. J., Korendyke, C. M., Michels, D. J., and Moses, J. D The large angle spectroscopic coronagraph (LASCO). Solar Phys., 162(1-2), 357–402. doi:10.1007/BF00733434
Chen, B., Bastian, T. S., Shen, C., Gary, D. E., Krucker, S., and Glesener, L. (2015). Particle acceleration by a solar flare termination shock. Science 350, 1238. doi:10.1126/science.aac8467
Chen, B., Bastian, T. S., White, S. M., Gary, D. E., Perley, R., Rupen, M., et al. (2013). Tracing electron beams in the sun's corona with radio dynamic imaging spectroscopy. ApJ 763, L21. doi:10.1088/2041-8205/763/1/l21
Chen, B., Yu, S., Reeves, K. K., and Gary, D. E. (2020). Microwave spectral imaging of an erupting magnetic flux rope: implications for the standard solar flare model in three dimensions. ApJ 895, L50. doi:10.3847/2041-8213/ab901a
Chen, X., Yan, Y., and Tan, B. (2019). Quasi-periodic Pulsations before and during a Solar Flare in AR 12242. Astrophysical J. 878, 78. doi:10.3847/1538-4357/ab1d64
Chernov, G. (2011). Fine structure of solar radio bursts, 375. Astrophysics and Space Science Library.
Chernov, G. P., Yan, Y.-H., and Fu, Q.-J. (2014). The importance of source positions during radio fine structure observations. Res. Astron. Astrophys. 14, 831–842. doi:10.1088/1674-4527/14/7/005
D. E. Gary, and C. U. Keller (Editors) (2004). Solar and space weather radiophysics. Australia: Astronomical Society.
Du, J., Yan, Y., Wang, W., and Liu, D. (2015). , simulation for Mingantu ultrawide spectral radioheliograph in the decimetre wave range. Astron. Soc. Aust. 32, e024. doi:10.1017/pasa.2015.24
Erickson, W. C., Mahoney, M. J., and Erb, K. (1982). The Clark Lake teepee-tee telescope. ApJS 50, 403. doi:10.1086/190831
Fleishman, G. D., Gary, D. E., Chen, B., Kuroda, N., Yu, S., and Nita, G. M. (2020). Decay of the coronal magnetic field can release sufficient energy to power a solar flare. Science 367, 278. doi:10.1126/science.aax6874
Fu, Q., Xu, Z., Qin, Z., Li, C., Chen, H., Ji, H., et al. (1997). 30. Astrophysics Reports. Beijing, China: Astron Obs, 71.
Gary, D. E., Chen, B., Dennis, B. R., Fleishman, G. D., Hurford, G. J., Krucker, S., et al. (2018). Microwave and hard X-ray observations of the 2017 september 10 solar limb flare. ApJ 863, 83. doi:10.3847/1538-4357/aad0ef
Gary, D. E. (2003). The frequency agile solar radiotelescope. J. Korean Astronomical Soc. 36, 135. doi:10.5303/jkas.2003.36.spc1.135
Grechnev, V. V., Lesovoi, S. V., Smolkov, G. Y., Krissinel, B. B., Zandanov, V. G., Altyntsev, A. T., et al. (2003). The Siberian Solar Radio Telescope: the current state of the instrument, observations, and data. Sol. Phys. 216, 239. doi:10.1023/a:1026153410061
Hu, C. M., Fu, Q. J., Li, S. D., Zhen, L. P., and Xin, J. X. (1984). Acta Astrophysica Sinica 4, 340.
Hudson, H., and Vilmer, N. (2007). “The high energy solar corona: waves, eruptions, particles. Lecture Notes in Physics. Editors K.-L. Klein and A. L. MacKinnon (Berlin, Germany: Springer), Vol. 725, 81.
Karlický, M., Chen, B., Gary, D. E., Kašparová, J., and Rybák, J. (2020). Drifting pulsation structure at the very beginning of the 2017 september 10 limb flare. ApJ 889, 72. doi:10.3847/1538-4357/ab63d0
Kerdraon, A., and Delouis, J.-M. (1997). “Coronal physics from radio and space observations,” in Proceedings of the CESRA workshop held in nouan le Fuzelier, France, June 3–7, 1997. Editor G. Trottet, 192.
Lemen, J. R., Title, A. M., Akin, D. J., Boerner, P. F., Chou, C., Drake, J. F., et al. (2012). The atmospheric imaging assembly (AIA) on the solar dynamics observatory (SDO). Sol. Phys. 275, 17. doi:10.1007/s11207-011-9776-8
Li, S., Yan, Y.-H., Chen, Z.-J., Wang, W., and Liu, D.-H. (2015a). Antenna system characteristics and solar radio burst observations. Res. Astron. Astrophys. 15, 1917. doi:10.1088/1674-4527/15/11/013
Li, S., Yan, Y. H., Chen, Z. J., Wang, W., and Zhang, F. S. (2015b). Design of dual circularly polarised 2-15 GHz feed and the polarisation degree measurement for CSRH-II antenna system. Publi.Astron. Soci. Australia 32, 13. doi:10.1017/pasa.2015.14
Lin, R. P. (2008). “Particle acceleration and transport in the heliosphere and beyond,” in AIP conference proceedings, Kyoto, Japan, June 20–25, 2008, Editors G. Li, Q. Hu, O. Verkhoglyadova, G. P. Zank, R. P. Lin, and J. Luhman (College Park, MD: American Institute of Physics), 52.
Liu, D. H., Yan, Y. H., Zhao, A., and Wang, W. (2013). ATCA Electronica Sinica, 41, 570. doi:10.3969/j.issn.0372-2112.2013.03.025
Liu, F., Yan, Y., Wang, W., Tan, B., Chen, L., Qu, C., et al. (2019). A digital correlation receiver for the Mingantu Spectral Radioheliograph, Publ. Astron. Soc. Aust. 36, e043, doi:10.1017/pasa.2019.35
Mei, Y., Wang, F., Wang, W., Chen, L., Liu, Y., Deng, H., et al. (2018). GPU-based high-performance imaging for Mingantu spectral RadioHeliograph, Pasp, 130, 014503. doi:10.1088/1538–3873/aa9608
Nakajima, H., Nishio, M., Enome, S., Shibasaki, K., Takano, T., Hanaoka, Y., et al. (1994). The Nobeyama radioheliograph, Proc. IEEE 82, 705. doi:10.1109/5.284737
Napier, P. J., Thompson, A. R., and Ekers, R. D. (1983). The very large array: design and performance of a modern synthesis radio telescope, Proc. IEEE 71, 1295. doi:10.1109/proc.1983.12765
Nita, G. M., Hickish, J., MacMahon, D., and Gary, D. E. (2016). EOVSA implementation of a spectral kurtosis correlator for transient detection and classification. J. Astron. Instrum. 5, 1641009–1647366. doi:10.1142/s2251171716410099
Olsson, R., Kildal, P.-S., and Weinreb, S. (2006). The eleven antenna: a compact low-profile decade bandwidth dual polarized feed for reflector antennas. IEEE Trans. Antennas Propagat. 54, 368. doi:10.1109/tap.2005.863392
Pick, M., and Vilmer, N. (2008). Sixty-five years of solar radioastronomy: flares, coronal mass ejections and Sun-Earth connection. Astron. Astrophys Rev. 16, 1. doi:10.1007/s00159-008-0013-x
Ramesh, R., Subramanian, K. R., Sundararajan, M. S., and Sastry, C. V. (1998). The Gauribidanur Radioheliograph. Sol. Phys. 181, 439. doi:10.1023/a:1005075003370
Sheridan, K. V., Labrum, N. R., and Payten, W. J. (1973). Three-frequency operation of the Culgoora radioheliograph. Proc. IEEE, 61, 1312. doi:10.1109/proc.1973.9267
Swarup, G (1991). Giant metrewave radio telescope (GMRT). In Radio interferometry: Theory, techniques, and applications: Proceedings of the 131st IAU Colloquium (A92-56376 24-89), Socorro, NM, October 8–12, 1990. San Francisco, CA,Astronomical Society of the Pacific, 376–380.
Tan, B. (2013). Small-scale microwave bursts in long-duration solar flares. The Astrophysical J. 773 (2), 12.
Tan, B., Mészárosová, H., Karlický, M., Huang, G., and Tan, C. (2016). Microwave type iii pair bursts in solar flares. ApJ, 819, 42, doi:10.3847/0004-637x/819/1/42
Taylor, G. B., Carilli, C. L., and Perley, R. A. (1999). Synthesis imaging in radio astronomy II, a collection of lectures from the sixth NRAO/NMIMT synthesis imaging summer school. Synthesis imaging in radio astronomy, II. ASP conference series, Vol. 180.
Thompson, A. R., Moran, J. M., and Swenson, G. W. (2017). Interferometry and synthesis in radio astronomy. 3rd Edn. Berlin, Germany: Springer.
Tingay, S. J., Goeke, R., Bowman, J. D., Emrich, D., Ord, S. M., Mitchell, D. A., et al. (2013). The murchison widefield array: the square kilometre array precursor at low radio frequencies. PASA 30, 21. doi:10.1017/pasa.2012.007
Trottet, G., Correia, E., Karlický, M., Aulanier, G., Yan, Y., and Kaufmann, P. (2006). Electron acceleration and transport during the november 5, 1998 solar flare at ∼13:34 UT, Sol. Phys. 236, 75. doi:10.1007/s11207-006-0089-2
van Haarlem, M. P., Wise, M. W., Gunst, A. W., Heald, G., McKean, J. P., and Hessels, J. W. T (2013). LOFAR: the LOw-Frequency ARray. A&A 556, 53. doi:10.1051/0004-6361/201220873
Vilmer, N., Krucker, S., and Lin, R. P. (2002). Hard x-ray and Metric/Decimetric Radio Observations of the 20 February 2002 Solar Flare. Sol. Phys. 210, 261. doi:10.1023/a:1022492414597
Yan, Y., Chen, L., and Yu, S. (2016). “Solar and stellar flares and their effects on planets,” in Proc. IAU symposium, Beijing, China, September 9, 2016, Vol. 320, Editors A. G. Kosovichev, S. L. Hawley, and P. Heinzel (Paris, France: IAU), 427.
Yan, Y. H., Wang, W., Liu, F., Geng, L. H., Chen, Z. J., and Zhang, J. (2013). “Solar and astrophysical dynamos and magnetic activity,” in Proc. IAU symposium, Beijing, China, February 24, 2013, Editors A. G. Kosovichev, E. M. de Gouveia Dal Pino, and Y. Yan (Paris, France: IAU) Vol. 294, 489.
Yan, Y. H., Zhang, J., and Huang, G. (2004). Proc. 2004 asia-pacific radio science conference, Qingdao, China: IEEE, 391.
Yan, Y., Huang, J., Chen, B., and Sakurai, T. (2007). diagnostics of radio fine structures around 3 GHz with hinode data in the impulsive phase of an X3.4/4B flare event on 2006 December 13. Japan: Astronomical Society of Japan 59, 815.
Yan, Y., Zhang, J., Wang, W., Liu, F., Chen, Z., and Ji, G. (2009). The Chinese spectral radioheliograph-CSRH. Earth Moon Planet. 104, 97. doi:10.1007/s11038-008-9254-y
Keywords: solar corona, solar instrumentation, solar imaging, radioheliograph, solar radio radiation, space weather, flares, coronal mass ejections
Citation: Yan Y, Chen Z, Wang W, Liu F, Geng L, Chen L, Tan C, Chen X, Su C and Tan B (2021) Mingantu Spectral Radioheliograph for Solar and Space Weather Studies. Front. Astron. Space Sci. 8:584043. doi: 10.3389/fspas.2021.584043
Received: 16 July 2020; Accepted: 01 February 2021;
Published: 29 March 2021.
Edited by:
Dale E. Gary, New Jersey Institute of Technology, United StatesReviewed by:
Timothy Bastian, National Radio Astronomy Observatory, United StatesDivya Oberoi, Tata Institute of Fundamental Research, India
Copyright © 2021 Yan, Chen, Wang, Liu, Geng, Chen, Tan, Chen, Su and Tan. This is an open-access article distributed under the terms of the Creative Commons Attribution License (CC BY). The use, distribution or reproduction in other forums is permitted, provided the original author(s) and the copyright owner(s) are credited and that the original publication in this journal is cited, in accordance with accepted academic practice. No use, distribution or reproduction is permitted which does not comply with these terms.
*Correspondence: Yihua Yan, eXloQG5hby5jYXMuY24=