 C. C. Chaston
- Space Sciences Laboratory, University of California, Berkeley, CA, United States
Folding, kinking, curling and vortical optical forms are distinctive features of most bright auroral displays. These forms are symptomatic of non-linear forcing of the plasma above auroral arcs resulting from the intensification of electrical currents and Alfvén waves along high-latitude geomagnetic field-lines during periods of disturbed space weather. Electrons accelerated to energies sufficient to carry these currents impact the atmosphere and drive visible emission with spatial structure and dynamics that replicate the morphology and time evolution of the plasma region where the acceleration occurs. Movies of active auroral displays, particularly when combined with conjugate in-situ fields and plasma measurements, therefore capture the physics of a driven, non-linearly evolving space plasma system. Here a perspective emphasizing the utility of combining in-situ measurements through the auroral acceleration region with high time and spatial resolution auroral imaging for the study of space plasma turbulence is presented. It is demonstrated how this special capacity reveals the operation of a cascade of vortical flows and currents through the auroral acceleration region regulated by the physics of Alfvén waves similar to that thought to operate in the Solar wind.
Introduction
Earth’s discrete aurora is a consequence of the closure of geomagnetic field-aligned electric currents through the ionosphere and propagating Alfvén waves. The concentration of Earthward field-aligned current from a magnetospheric source due to the convergence of the geomagnetic field requires electron acceleration (Knight, 1973). The region where this acceleration occurs is known as the auroral acceleration region (Paschmann et al., 2003). Qualitatively, this region is bound at low altitudes by the topside ionosphere, below which densities rapidly increase, and at high altitudes by the capacity of hot ambient electrons to carry the current with little or no acceleration. Observations show that the auroral acceleration region extends from >2,000 to ∼10,000km in altitude depending on local time, season and solar activity (Karlsson, 2012).
The auroral acceleration region is host to a variety of non-linear processes including the formation of double layers and phase space holes (Ergun et al., 2004) as well as meso-scale plasma instabilities (Selyer and Wu, 2001) that shape the evolving form of auroral displays. These processes decouple magnetospheric convection from the ionosphere through the formation of parallel electric fields. An outer-scale for the operation of these dynamics can be defined by considering the relationship between the cross-field potential in the magnetospheric generator region and that in the ionosphere. Observations above discrete aurora suggest that the field-aligned current (
after Lysak and Song (1996) where
For time varying potential structures or Alfvén waves the same procedure can be performed by replacing the current voltage relation with the cold plasma wave impedance relationship (Stasiewicz et al., 2000),
and using Ampere’s law with
Here,
For the interpretation of auroral imagery the large size of
In the following we draw on previously reported observations to present a perspective on the relationship between the spectral scaling of field structures through the acceleration region and the motions of optical elements within auroral forms. The consistency of the spectral scaling observed in-situ with that observed via auroral imaging supports the connection of
The Turbulent Alfvénic Aurora
Figure 1 shows spectrograms of the spectral energy density in electric and magnetic fields through the auroral acceleration region as derived from statistics reported from the FAST mission (Chaston et al., 2008). FAST had the unique capacity to measure the electric field at several points in the spacecraft spin plane allowing unambiguous measurement of
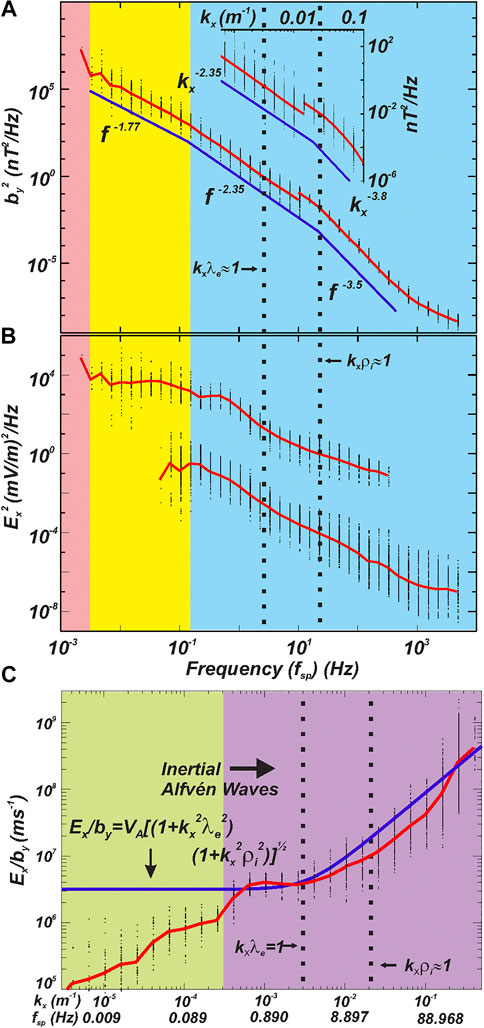
FIGURE 1. Spectral statistics above “Alfvenic” aurora. (A) Average spectral energy density in magnetic field variations (
Indeed, the measurements shown in Figure 1 bear remarkable similarity to those reported in turbulent Alfvénic fields on kinetic scales in the solar wind. In the work of Bale et al., (2005), for example, spectral energy densities with a Kolmogorov
Imaging an Alfvénic Cascade
The Reimei spacecraft (Sakanoi et al., 2003) provided conjugate measurements of accelerated electrons and high temporal/spatial resolution imaging of evolving auroral luminosity. Example measurements of a rapidly evolving “Alfvénic” auroral arc are shown in Figure 2. This identification is based on the relatively flat electron spectra shown in Figure 2A as opposed to the clear mono-energetic peak or inverted-V attributed to “quasi-static” discrete aurora. The snapshots in Figure 2B-F show luminosity over a 66 by 66 km field of view (FOV) at 110 km altitude and ∼670 nm on a logarithmic scale. Note that this prompt emission is a consequence of energetic electron precipitation (Lanchester et al., 2009; Frey et al., 2010). A bright feature with evolving vortical forms at the upper edge of the region of luminosity can be identified in each snapshot. This feature moves upward through the FOV with the location of the magnetic foot-point of the spacecraft on each image shown by the white box. This allows identification of the electron spectrogram in Figure 2A driving the luminosity at that location. Following this bright “arc” is a region of swirling variations in luminosity corresponding to larger vortical features. These snapshots are at a cadence of 0.6 s or every fifth frame retuned by the Reimei camera.
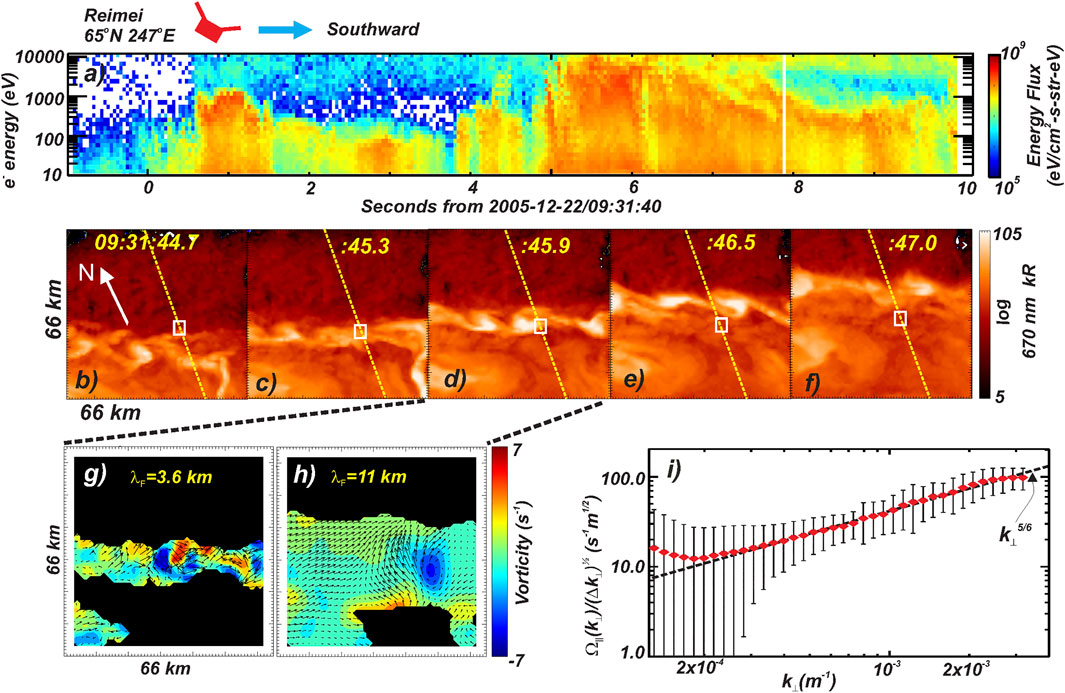
FIGURE 2. Reimei spacecraft measurements above an “Alfvenic” auroral arc. (A) Omni-directional electron energy spectrogram. (B–F) Snapshots at ∼670 nm of the evolving luminosity. Yellow trace shows the trajectory of the spacecraft mapped onto each image with the white box indicating the spacecraft magnetic foot-point at the snapshot time. (G–H) Optical vorticity measurements derived from cross-spectral analysis between snapshot d and the next frame capture (not shown) at the scales indicated. Arrows show optical flow direction and relative speed. (I) Vorticity spectrum derived from the full resolution measurements over the time-range comprising the sequence (B–F). Red dots show the log normal average in each
By cross-correlating the consecutive images at full resolution it is possible to measure the velocity field of the features observed in regions of luminosity. At the time of these observations the camera looked along the geomagnetic field nearly normal to the Earth’s surface so that the velocities observed are perpendicular to
Figure 2G shows there is considerable structure in the vorticity on small scales distributed over the width of the bright “arc”. As indicated by the arrows these features arise from fast motions of the order of 20 km/s composed of both shears and rotational flows. Nested regions of positive and negative vorticity are observed representing structured electric fields on kilometer scales. On larger scales the flow is smoother and a prominent peak in negative vorticity or clockwise rotation can be identified in the center right portion of Figure 2H. Performing the same analysis for subsequent image pairs shows rapid temporal variations in the small-scale vorticity with these features advected in the larger scale flow. Compiling statistics over the whole image sequence shown in Figures 2B–F provides the spectrum presented in Figure 2I. Here, each point represents the average of the distribution in vorticity at each scale normalized by the bandwidth occupied by each spectral bin in
Discussion and Conclusion
The in-situ measurements and auroral imagery presented above suggest the operation of a turbulent cascade of inertial Alfvén waves in the auroral acceleration region. Over a range of scales extending from ∼60 km down to 10 s of meters perpendicular to
In inertial Alfvén waves the plasma moves at the
which for
which in the limit
While this model may describe the large wavenumber portion of the spectrum, Figures 1A and 2I respectively show that the
Where
An estimate for the value of
Finally, an analysis similar to that above has been performed to examine the scale dependency of variations in auroral luminosity (Chaston, 2015), albeit within an “inverted-V” or “quasi-static” auroral arc with a different scaling in
Data Availability Statement
Publicly available datasets were analyzed in this study. This data can be found here: the JAXA website https://darts.isas.jaxa.jp/stp/reimei/ and the FAST data repository at https://cdaweb.gsfc.nasa.gov/index.html.
Author Contributions
CC performed the analysis/interpretation in this report and is solely responsible for the results described.
Funding
This research was supported by NASA grant NNX17AI55G.
Conflict of Interest
The author declares that the research was conducted in the absence of any commercial or financial relationships that could be construed as a potential conflict of interest.
Acknowledgments
CC thanks the FAST and Reimei teams for the providing the calibrated measurements used in this research.
References
Bale, S. D., Kellogg, P. J., Mozer, F. S., Horbury, T. S., and Reme, H. (2005). Measurement of the electric fluctuation spectrum of magnetohydrodynamic turbulence. Phys. Rev. Lett. 94, 215002. doi:10.1103/PhysRevLett.94.215002
Borovsky, J. E. (1993). Auroral arc thicknesses as predicted by various theories. J. Geophys. Res. 98 (A4), 6101–6138. doi:10.1029/92JA02242
Chaston, C. C., Peticolas, L. M., Bonnell, J. W., Carlson, C. W., Ergun, R. E., and McFadden, J. P. (2003). The width and brightness of auroral arcs driven by inertial Alfvén waves. J. Geophys. Res. 108, 1091. doi:10.1029/2001ja007537
Chaston, C. C., Salem, C., Bonnell, J. W., Carlson, C. W., Ergun, R. E., Strangeway, R. J., et al. (2008). The turbulent Alfvénic aurora. Phys. Rev. Lett. 100, 175003. doi:10.1103/PhysRevLett.100.175003
Chaston, C. C. (2015). “Inverted-V auroral arcs and Alfvén waves,” in Auroral dynamics and space weather. Editors Y. Zhang, and L. J. Paxton (Hoboken, NJ: John Wiley & Sons). doi:10.1002/9781118978719.ch3
Chaston, C. C., Seki, K., Sakanoi, T., Asamura, K., Hirahara, M., and Carlson, C. W. (2011). Cross-scale coupling in the auroral acceleration region. Geophys. Res. Lett. 38, L20101. doi:10.1029/2011GL049185
Chaston, C. C., Seki, K., Sakanoi, T., Asamura, K., and Hirahara, M. (2010). Motion of aurorae. Geophys. Res. Lett. 37, L08104. doi:10.1029/2009GL042117
Chaston, C. C. (2006). ULF waves and auroral electrons. Geophys. Monogr. Ser., 169, 239. doi:10.1029/169GM16
Ergun, R. E., Carlson, C. W., McFadden, J. P., Mozer, F. S., Delory, G. T., Peria, W., et al. (1998). FAST satellite observations of large-amplitude solitary structures. Geophys. Res. Lett. 25, 2041.
Ergun, R. E., Andersson, L., Main, D., Su, Y.‐J., Newman, D. L., Goldman, M. V., et al. (2004). Auroral particle acceleration by strong double layers: the upward current region. J. Geophys. Res. 109, A12220. doi:10.1029/2004JA010545
Frey, H. U., Amm, O., Chaston, C. C., Fu, S., Haerendel, G., Juusola, L., et al. (2010). Small and meso-scale properties of a substorm onset auroral arc. J. Geophys. Res. 115, A10209. doi:10.1029/2010JA015537
Frisch, U. (1995). Turbulence: the legacy of A. N. Kolmogorov. Cambridge, England: Cambridge University Press.
Goldreich, P., and Sridhar, S. (1997). Magnetohydrodynamic turbulence revisited. Astrophys. J. 485, 680–688. doi:10.1086/304442
Hallinan, T. J. (1981). “The distribution of vorticity in auroral arcs,” in Physics of auroral arc formation, Geophys. Monogr. Ser. Editors S.‐I. Akasofu, and J. R. Kan (Washington, DC: AGU), Vol. 25, 42. doi:10.1029/GM025p0042
Howes, G. G., Cowley, S. C., Dorland, W., Hammett, G. W., Quataert, E., and Schekochihin, A. A. (2008). A model of turbulence in magnetized plasmas: implications for the dissipation range in the solar wind. J. Geophys. Res. 113, A05103. doi:10.1029/2007JA012665
Karlsson, T. (2012). “The acceleration region of stable auroral arcs,” in Auroral phenomenology and magnetospheric processes: Earth and other planets, Geophysical Monograph, 197. Editors A. Keiling, E. Donovan, F. Bagenal, and T. Karlsson (Washington, DC: AGU). doi:10.1029/2011GM001179
Kintner, P. M., and Seyler, C. E. (1985). The status of observations and theory of high latitude ionospheric and magnetospheric plasma turbulence. Space Sci. Rev. 41, 91–12. doi:10.1007/bf00241347
Knight, S. (1973). Parallel electric fields. Planet. Space Sci. 21, 741–750. doi:10.1016/0032-0633(73)90093-7
Lanchester, B. S., Ashrafi, M., and Ivchenko, N. (2009). Simultaneous imaging of aurora on small scale in OI (777.4 nm) and N21P to estimate energy and flux of precipitation. Ann. Geophys. 27, 2881–2891. doi:10.5194/angeo-27-2881-2009
Lyons, L. R. (1981). “The field aligned current versus electric potential relation and auroral electrodynamics,” in Physics of auroral arc formation, Geophys. Monogr. Ser. Editors S.‐I. Akasofu, and J. R. Kan (Washington, DC: AGU), Vol. 25, 252.
Lysak, R. L., and Carlson, C. W. (1981). The effect of microscopic turbulence on magnetosphere-ionosphere coupling. Geophys. Res. Lett. 8, 269–272. doi:10.1029/gl008i003p00269
Lysak, R. L. (1990). Electrodynamic coupling of the magnetosphere and ionosphere. Space Sci. Rev. 52, 33. doi:10.1007/BF00704239
Lysak, R. L., and Song, Y. (1996). Coupling of Kelvin-Helmholtz and current sheet instabilities to the ionosphere: a dynamic theory of auroral spirals. J. Geophys. Res. 101, 15411–15422. doi:10.1029/96JA00521
G. Paschmann, S. Haaland, and R. Treumann (Editors) (2003). Auroral plasma physics. Dodrecht, Netherlands: Kluwer Academic.
Pécseli, H. L. (2015). Spectral properties of electrostatic drift wave turbulence in the laboratory and the ionosphere. Ann. Geophys. 33, 875–900. doi:10.5194/angeo-33-875-2015
Rankin, R., Samson, J. C., and Tikhonchuk, V. T. (1999). Parallel electric fields in dispersive shear Alfvén waves in the dipolar magnetosphere. Geophys. Res. Lett. 26, 3601. doi:10.1029/1999gl010715
Rees, M. H., and Jones, R. A. (1973). Time dependent studies of the aurora-II. Spectroscopic morphology. Planet. Space Sci. 21, 1213. doi:10.1016/0032-0633(73)90207-9
Sakanoi, T., Okano, S., Obuchi, Y., Kobayashi, T., Ejiri, M., Asamura, K., et al. (2003). Development of the multi-spectral auroral camera onboard the INDEX satellite. Adv. Space Res. 32, 379–384. doi:10.1016/s0273-1177(03)90276-6
Seyler, C. E. (1990). A mathematical model of the structure and evolution of small-scale discrete auroral arcs. J. Geophys. Res. 95 (A10), 17199–17215. doi:10.1029/JA095iA10p17199
Seyler, C. E., and Wu, K. (2001). Instability at the electron inertial scale. J. Geophys. Res. 106, 21623–21644. doi:10.1029/2000JA000410
Stasiewicz, K., Bellan, P., Chaston, C., Kletzing, C., Lysak, R., Maggs, J., et al. (2000). Small scale Alfvénic structure in the aurora. Space Sci. Rev. 92, 423–533. doi:10.1023/a:1005207202143
Torrence, C., and Compo, G. P. (1998). A practical guide to wavelet analysis. Bull. Am. Meteorol. Soc. 79, 61–78. doi:10.1175/1520-0477(1998)079<0061:apgtwa>2.0.co;2
Keywords: Alfvén waves 1, turbulence 2, aurora 3, vorticity 4, cascades 5
Citation: Chaston CC (2021) An Auroral Alfvén Wave Cascade. Front. Astron. Space Sci. 8:618429. doi: 10.3389/fspas.2021.618429
Received: 16 October 2020; Accepted: 09 February 2021;
Published: 25 March 2021.
Edited by:
Gaetano Zimbardo, University of Calabria, ItalyReviewed by:
Giuseppe Consolini, Institute for Space Astrophysics and Planetology (INAF), ItalyRobert Lysak, University of Minnesota Twin Cities, United States
R. P. Sharma, Indian Institute of Technology Delhi, India
Copyright © 2021 Chaston. This is an open-access article distributed under the terms of the Creative Commons Attribution License (CC BY). The use, distribution or reproduction in other forums is permitted, provided the original author(s) and the copyright owner(s) are credited and that the original publication in this journal is cited, in accordance with accepted academic practice. No use, distribution or reproduction is permitted which does not comply with these terms.
*Correspondence: C. C. Chaston, Y2NjQHNzbC5iZXJrZWxleS5lZHU=