 A. V. Eyelade1,2*
 C. M. Espinoza1,2
 M. Stepanova1,2*
 E. E. Antonova3,4
 I. L. Ovchinnikov3
 I. P. Kirpichev4
- 1Physics Department, University of Santiago of Chile, Santiago, Chile
- 2Center for Interdisciplinary Research in Astrophysics and Space Sciences, University of Santiago of Chile, Santiago, Chile
- 3Skobeltsyn Institute of Nuclear Physics, Moscow State University, Moscow, Russia
- 4Space Research Institute, Russian Academy of Science, Moscow, Russia
The possible influence of MHD turbulence on the energy distributions of ions in the Earth's plasma sheet was studied using data taken by the THEMIS satellites. Turbulence levels were traced using eddy diffusion coefficients (D), of which we measured one for each Geocentric Solar Magnetospheric (GSM) coordinates every 12 min. Ion fluxes between 1.75 and 210.5 keV during the same time windows that correspond to mainly suprathermal populations were fitted to Kappa distribution functions, which approximate a Maxwellian distribution when the κ-index (κ) is large. We found that the distribution of the eddy diffusion coefficients is bimodal, independently of both the eddy diffusion component and the plasma beta (β) parameter, which is defined as the ratio between plasma and magnetic pressures. The main peak corresponds to turbulent plasma flows with D > 103 km2 s−1. In such cases, the impact of turbulence on the κ index depends on the value of β and also on the direction of the turbulent transport. For eddy diffusion perpendicular to the neutral sheet, the values of κ decrease as Dzz increases for β < 2; while for higher values of β, κ increases with Dzz. For the other two directions, the values of κ decrease as D increases. This last tendency is stronger for β ~ 1 but almost null for β ~ 10. The secondary peak in the distribution of D values might represent quasi-laminar flows forming part of very large vortices, correct detection and description of which is beyond the scope of this study.
1. Introduction
Since the beginnings of the Space Age, it is known that various regions of the Earth's magnetosphere are filled with turbulent plasmas (see, for example, Sonett, 1960; Ness et al., 1961). Such dynamics are somewhat expected if the Earth's magnetic field is considered as an obstacle in the path of the incoming turbulent, supersonic, and superalfvenic solar wind, which leads to turbulent wake formation. Nonetheless, the magnetotail presents a more complex structure than an ordinary wake, as the plasma density and beta (β) parameter in the plasma sheet are much higher than in the tail lobes, and the plasma sheet is much more turbulent (e.g. Antonova, 1985; Montgomery, 1987; Angelopoulos et al., 1993; Borovsky et al., 1997). This behavior constitutes one of the many unsolved problems in magnetospheric physics (Borovsky et al., 2020).
Detailed studies of the properties of plasma sheet turbulent flows in the magnetotail started at the end of the 90's. For instance, Borovsky et al. (1997, 1998) showed that unpredictable random fluctuations of flow velocity are observed in the plasma sheet and that their amplitudes are much larger than the mean flow velocities. They also obtained the probability distributions and autocorrelation times of flow velocity and concluded that the observed properties correspond to magnetohydrodynamic (MHD) turbulence. The flow velocities were normally shown to be sub-Alfvenic, which is especially important for frozen-in condition applicability and the observed properties of turbulent fluctuations. Borovsky and Funsten (2003) later confirmed that the observed turbulence is essentially formed by eddies (eddy turbulence) and determined that the typical scale of such eddies is 4,000–10,000 km, or even greater, with a mean value of about 1.6 Earth Radii (RE). Later, though Weygand et al. (2005) obtained somewhat smaller estimates of 6, 000 km for the eddy sizes. Successful direct observations of eddy vortices in the plasma sheet are only possible if measurements are carried out fairly simultaneously by two or more satellites separated by long distances, such as THEMIS satellite mission (Time History of Events and Macroscale Interactions during Substorms; Angelopoulos, 2008). Plasma vortices of such scales were observed by Keika et al. (2009); Keiling et al. (2009); Panov et al. (2010) using THEMIS data. The eddy diffusion coefficients are a useful way to quantify MHD turbulence. Borovsky et al. (1998) proposed a method for calculating this coefficient using data from a single satellite as a function of the root mean square velocity and autocorrelation time.
Many authors have carried out measurements of eddy diffusion coefficients in the plasma sheet using data from different satellites. In general, most results point to km2/s (e.g. Ovchinnikov et al., 2000; Troshichev et al., 2002). Subsequent studies of turbulent eddy diffusion in the plasma sheet have shown that eddy-diffusion coefficients increase with Earth distance toward the tail (Stepanova et al., 2009, 2011; Pinto et al., 2011), but are nearly constant at mid distances and slightly decrease in the distant tail (Troshichev et al., 2002). The eddy diffusion was also found to be sensitive to the geomagnetic activity, increasing during geomagnetic substorms, especially during the expansion phase process (Stepanova et al., 2009, 2011).
Studies of the stability of the plasma sheet commonly consider laminar flows only (see Petrukovich et al., 2015; Sitnov et al., 2019). Nonetheless, the presence of turbulence requires to modify this approach. In this case, the stability of a turbulent plasma sheet can be reached due to a balance between regular and turbulent transports: Large-scale dawn-dusk electric field allows plasma advects toward the tail center; meanwhile, turbulent transport could compensate for this advection, thereby forming a stable plasma sheet (Antonova and Ovchinnikov, 1996, 1997, 1999, 2001; Antonova, 2002; Stepanova and Antonova, 2011). The same approach can be applied to explain the dawn-dusk asymmetry in the thickness of the turbulent low latitude boundary layer: a balance between the regular transport and transport due to turbulent eddy diffusion is assumed in combination with a dependence of this thickness on the orientation of the interplanetary magnetic field (IMF) (Antonova, 2005).
However, strictly speaking, the MHD approach for describing magnetospheric plasmas is valid only when the particle distribution functions are Maxwellian. Meanwhile, this may not be the case, as the energy distributions of particles in the magnetosphere, especially in the plasma sheet, are generally not Maxwellian. In fact, enhanced high energy tails are often observed in the energy distributions (e.g. Christon et al., 1989; Espinoza et al., 2018).
Kappa distribution functions (Livadiotis, 2017) have proven to be useful representations of the differential particle fluxes in the magnetosphere (e.g. Olbert, 1968; Christon et al., 1989; Haaland et al., 2010; Navarro et al., 2015; Runov et al., 2015; Viñas et al., 2015; Yoon and Livadiotis, 2017; Kirpichev and Antonova, 2020). In general, these functions will recover more information than a Maxwellian function, albeit the addition of one more parameter: the kappa index (κ). While high kappa values imply a higher slope of the distribution at the highest energies (hence a more Maxwellian behavior); low kappa values indicate the presence of a substantial population of energetic particles. Their presence can partially be understood by the fact that particle collisions are rare in these plasmas, and there seems not to be an efficient mechanism to thermalize them (evolve the distribution toward a Maxwellian function) over timescales shorter than the main dynamical scales that govern the systems. In this regard, although the derivation of the Kappa distribution from first principles is under strong debate, the Kappa function might be understood as a generalized case of the Maxwellian distribution (Olbert, 1968; Vasyliunas, 1968; Tsallis, 1988, 2004, 2009; Collier, 1993, 1999; Nauenberg, 2003, 2004; Livadiotis and McComas, 2013; Livadiotis, 2015; Treumann and Baumjohann, 2020).
The general form of the Kappa distribution is denoted by f:
where f is the phase space density, E is the kinetic energy, n is the particle density, m is the particle mass, Γ is the Euler gamma function, and κ and Ec are the κ-parameter and characteristic or core energy, respectively. The κ index is a measure of the energy spectrum slope of the suprathermal particles forming the tail of the velocity distribution function. Indeed, for κ → ∞, Equation (1) becomes identical to the Maxwellian distribution. The Kappa distributions given by Equation (1) exhibit a thermal core with characteristic energy Ec and suprathermal tails, such that the total characteristic particle kinetic energy Etotal is given by
which enables a straightforward comparison between Kappa and Maxwellian distributions, and to outline the effects of suprathermals as shown by Lazar et al. (2015, 2016).
Over the last decades, it has become clear that Kappa Distributions can successfully describe ion distribution functions in the plasma sheet. For instance, Christon et al. (1989, 1991) used the particle instruments onboard the International Sun-Earth Explorer 1 (ISEE 1) and found that kappa-index ranges between 4 and 8 for both ions and electrons, with a most probable value between 5 and 6. Later, Haaland et al. (2010) found that the κ-index ranges between 3 and 6, using data from the Cluster satellites.
Espinoza et al. (2018) also used the Kappa approximation to model ions and electrons flux spectra along the plasma sheet. Their statistical results reveal that the electrons have smaller kappa κe than ion kappa κi, which suggests electrons non-thermal properties are stronger than ions. Besides, their results in the relative numbers of energetic ions show a significant dawn-dusk asymmetry, being lower in the dusk-side, which increases during substorms. This is consistent with the previous study of Wing et al. (2005).
Stepanova and Antonova (2015) utilized Kappa distributions to fit ion and electron flux spectra for five events in which the THEMIS satellites were oriented in the plasma sheet. They obtained snapshots of kappa index properties that show a tendency for the electron κ-index to be high toward tailward direction; while the situation with the ion κ-index is less clear. In two of the five events analyzed, the kappa-index decreased toward the tail. To explain this, it was proposed that the stochastic acceleration responsible for the diffusion in energy space could lead to hardening of particle spectra (low kappa values) near the Earth region. Simultaneously, the diffusion in velocity space could lead to softening of particle spectra (Collier, 1999). Considering that for some events, the relaxation took place further away from the Earth, it was proposed that plasma transport from the Earth to the tail takes enough time for the relaxation of spectra (aging).
Nonetheless, it is well-known that the dawn-dusk electric field drives a regular transport toward the Earth. On the other hand, the bursty bulk flows mainly produce much of the particle transport earthward, which is faster than regular convection. The dipolarization fronts also produce plasma transport in the earthward direction (Runov et al., 2012). At the same time, the form of ion spectra fitted by Kappa distribution is conserved during the dipolarization, and on average, no non-adiabatic acceleration of ions in dipolarization flux bundles were present (Runov et al., 2015). Consequently, none of these sources of plasma transport could explain the gradual increase of kappa toward the tail due to tailward plasma transport accompanied by the “aging” of the distribution function.
Stepanova and Antonova (2015) proposed that particle transport from the inner magnetosphere toward the tail could be attributed to turbulent eddy diffusion. In this case, the time available for Kappa distribution function relaxation to Maxwellian will depend on balance between the processes leading to both transport directions. The characteristic time of turbulent transport between 3 and 12 h were estimated. At the same time, they calculated the average bulk velocity and found that most velocities were directed toward the Earth. However, there are points at which the bulk velocity was directed tailward, thus reducing the time available for relaxation. Whereas, the low kappa values were found precisely for these events, suggesting that Kappa distribution evolution is mainly due to relaxation in the velocity space. It could be that MHD turbulence is what modifies the particle distribution functions. To date, there are no specific studies about a possible relation between the kappa index and MHD turbulence—considering turbulent transport, local turbulent acceleration, or conversely turbulent mixing; that might lead to the Maxwellization of the distribution functions. In this study, we explore the relation between the ion kappa index and the eddy diffusion coefficients. This result contributes to a better understanding of the possible influence that MHD turbulence may have on the departure of the ion distribution functions from Maxwellian.
The organization of this paper is as follows: In section 2, we describe the instruments and methodology used to obtain the ion Kappa distribution parameters; In section 3, we present the results of the analyses and explore the relationship between kappa and three components of the eddy diffusion tensor. In section 4, we discuss the results; and in section 5, we summarize and conclude our findings.
2. Instrumentation, Data Selection, and Analysis
We utilized data taken by the THEMIS mission (Time History of Events and Macroscale Interactions during Substorms; Angelopoulos, 2008) during the years 2008–2009, downloaded via the THEMIS ftp website.1 Quasi-static magnetic field measurements were taken using the Flux Gate Magnetometer (FGM; Auster et al., 2008). Ion spectra were obtained by combining the measurements of the Electrostatic Analyzers (ESA; McFadden et al., 2008), which operates at lower energies, from a few eV to 25 keV, and the Solid State Telescopes (SST; Angelopoulos, 2008), which is sensitive to energies above 30 keV. We used level 2 full particle energy flux spectrogram. The angular distributions are not considered in the measured data since the pitch angle dependency has been averaged. Taking into consideration that ions in the plasma sheet are typically isotropic, the loss of anisotropy information is not critical. Moreover, due to the average process the number of counts in each energy channel increases, which is beneficial for the study of energy distributions. A mass-spectrometer was not included in the THEMIS instruments and it is impossible to differentiate ions of different species; therefore, we refer to them as just ions.
We restricted our analyses to ions energy range of 1.75–210.5 keV, to ensure that the actual fits of the tail and core parts of ion distribution function are obtained following the method used by Espinoza et al. (2018). We discarded lower energies due to contamination from the photoelectrons and spacecraft potential. Similarly, we discarded higher energies due to contamination by solar cosmic rays, energetic electrons, and a low number of counts. This energy range does not contain relativistic ions, hence we use the ordinary κ−distribution function, without the relativistic corrections suggested by Scherer et al. (2018, 2019); Lazar et al. (2020).
Example of ion energy flux spectra measured by combining both particle instruments (ESA and SST) onboard THEMIS satellites (solid lines) is illustrated in Figure 1. The circles on the plots are the average of the spectra obtained for the 12 min time windows. The open circles represent measurements from the ESA, while the filled circles represent the SST. For the average flux data, the error bars represent the spread between the maximum and minimum values observed. The error bars were found to vary significantly between the ESA and SST data, so they were normalized in the same way as Espinoza et al. (2018). The inverse squared of the error bars is used to define weights for the fits, which were performed over the averaged data using a non-linear least-squares method combined with the Levenberg-Mardquart algorithm. We inspected hundreds of spectra visually and decided to work only with the fits that give a reduced chi-squared χ2 < 100.
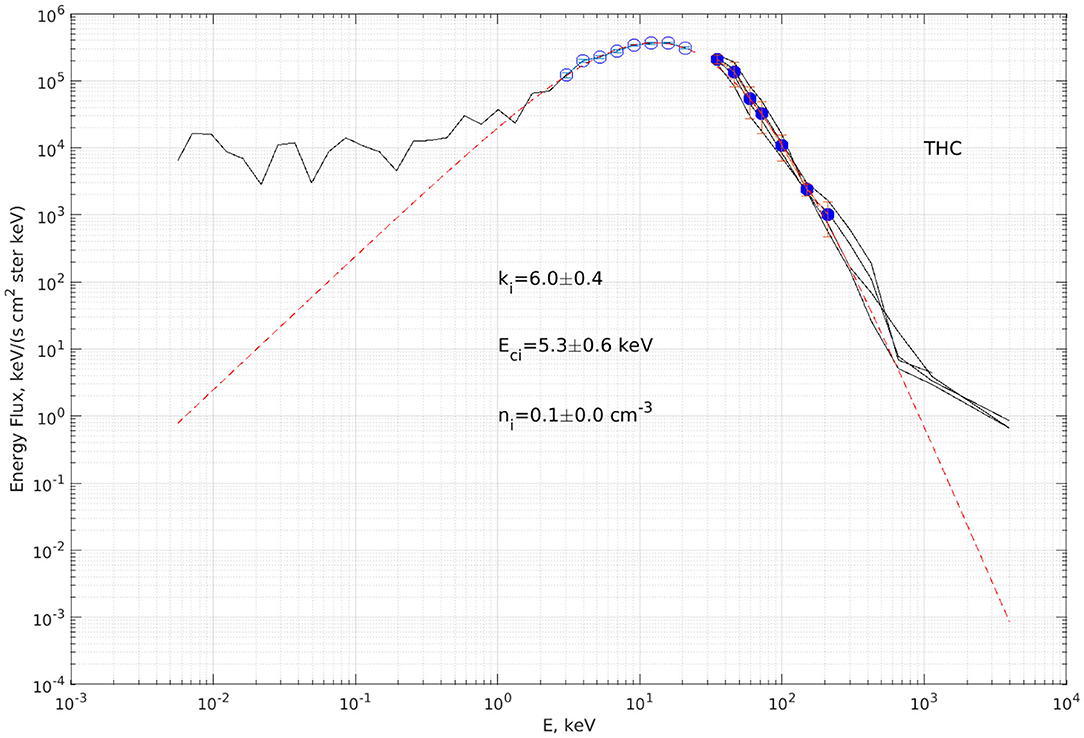
Figure 1. Example of the fit of κ−distribution to the flux spectra of ions measured by THEMIS-C (THC), on 14th February 2008, at 12.8 UT, GSM coordinate (X, Y, Z) = (−15.8, −0.82, −4.10) RE. The solid black lines are sub-datasets taken over a total of 12 min. Open circles represent averages of the subsets measurements of low energy particles (ESA), and filled circles represent averages of the subsets of measurements of high energy particles (SST). The red dash-line is the Kappa function curve fitted to the open and filled circles.
The observed differential energy spectra of ions were fitted to the model obtained by transforming the Kappa distribution from Equation (1) to differential energy fluxes:
This expression agrees with the expression of the differential particle flux (I(E)) used, for example, by Vasyliunas (1968); Christon et al. (1989); Olsson and Janhunen (1998). As in Stepanova and Antonova (2015); Espinoza et al. (2018), here we use the differential energy flux, that is F(E) = E·I(E) (Lyons et al., 1985; Baumjohann and Treumann, 1997). The differential energy flux was used since this is how the information related to particle distribution functions is given by the THEMIS team.
Following Borovsky et al. (1998, see their appendix), to estimate the eddy-diffusion coefficient Dzz, the eddy transport is assumed to be a Markov process (i.e., each plasma displacement Δz is independent of previous displacements). This is valid when displacements are separated in time by the autocorrelation time τauto of the flow velocity. In the Markovian picture, the diffusion coefficient is given as;
A typical Δz displacement which has a z-component of fluid velocity is Δz = Vzτauto. With this, the turbulent transport is evaluated by determining the eddy diffusion coefficient tensor denoted as Dαα:
where ταα is the decay time of the autocorrelation function of the ion bulk velocity component Vα; which acts as a measure of the persistence of a fluctuating bulk velocity, and Vrms is the root mean square (rms) of the α component of the velocity fluctuations around a mean value, which can be determined from
Both the diffusion coefficients and the parameters of the kappa fits were obtained from 12-min intervals shifted every 6 min. This allowed us to use about 240 bulk velocity measurements in each interval to calculate Vrms and ταα, as described in Stepanova et al. (2011). All measurements were constrained to the following Geocentric Solar Magnetospheric (GSM) coordinate system: X ≤ −10 RE, −30 ≤ Y ≤ 30 RE, −5 ≤ Z ≤ 5 RE. To ensure that the measurements are performed in plasma sheet-like plasmas, the time intervals were selected based on the following criteria: ion number density (ni), ion temperature (Ti), x components of the magnetic field (Bx), bulk velocity (Vx) were restricted to ni ≥ 0.1 cm−3, Ti ≥ 1 keV, |Bx| < 20 nT, and |Vx| < 300 km/s.
As well, we considered only cases in which β > 0.1; where β is the ion plasma parameter defined as the ratio of the ion plasma pressure to magnetic pressure: , where B is the total magnetic field strength and μ0 is the magnetic permeability, and Pi is the plasma pressure. The values of Pi and ion bulk velocity were taken directly from the level 2 data products containing the ESA macro-parameters (see the SPEDAS THEMIS documentation2). The contribution of ions with energies above 25 keV (detected by the SST, Angelopoulos, 2008) to the bulk velocity has been evaluated and found to be negligible (Lee and Angelopoulos, 2014), hence the influence of SST on macro parameters, such as Pi, is not strong. Thus, we utilized only the ESA measurements to calculate beta parameter and rms velocities.
Figure 2 illustrates the data analysis described above, using data obtained from THEMIS C satellite on February 26, 2008, between 05 to 08 UT during quiet geomagnetic conditions. In this case, the satellite was inside the plasma sheet until ~7:45 UT. Both the eddy diffusion coefficients and the κ index were obtained while |Bx| < −20 nT. As mentioned at the beginning of this section, we used 12-min time intervals to calculate the eddy diffusion and kappa parameters. Nonetheless, we acknowledge that this choice for the duration of the interval might interfere with the calculation of the eddy diffusion coefficients. To estimate this effect we present two hodograms in Figure 3, which show the evolution of particles velocities in the (Vx,Vy) and (Vx, Vz) planes. We calculated both the average and the root mean square velocities (Vrms) for a 3-h long interval, as well as for selected 12 min intervals. As it can be seen, the average velocities calculated over 12-min intervals are of the same order as the average value over 3-h. This suggests that the 12-min intervals are enough to recover eddy diffusion coefficients.
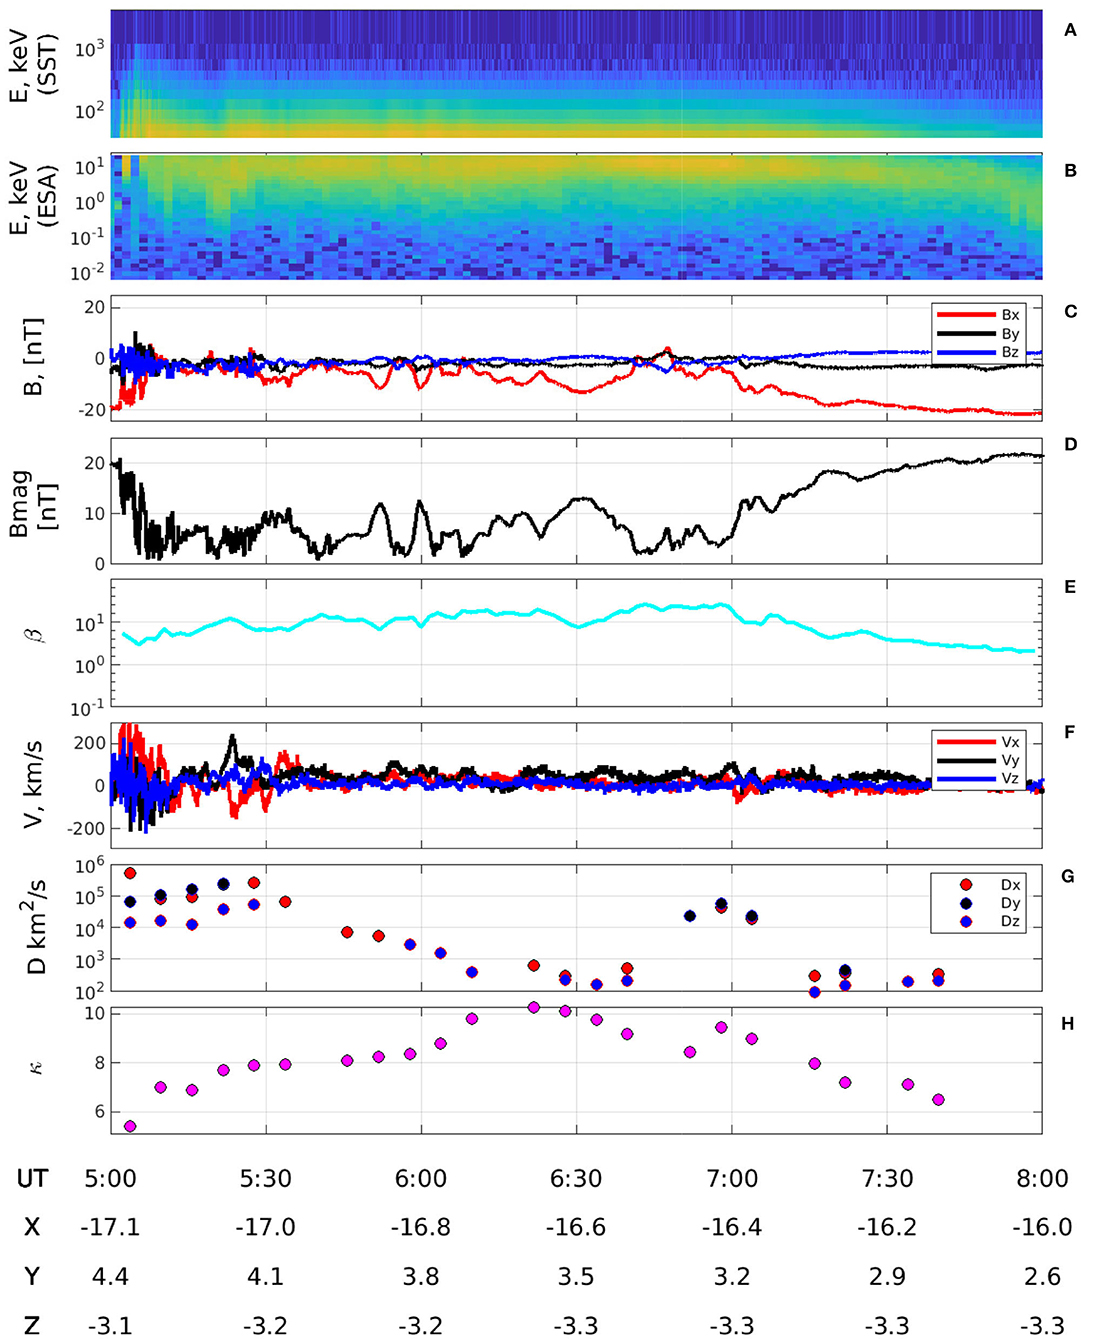
Figure 2. Panels from top to bottom are the: (A) Ion spectrogram (SST), (B) Ion spectrogram (ESA), (C) Magnetic field components, (D) Magnetic field magnitude, (E) plasma β parameter, (F) Bulk velocity components, (G) Eddy diffusion coefficient, and (H) ion kappa-index obtained from the on-board moments of ion distribution function measured between 5 and 8 UT by THEMIS-C (THC) on 26 February 2008.
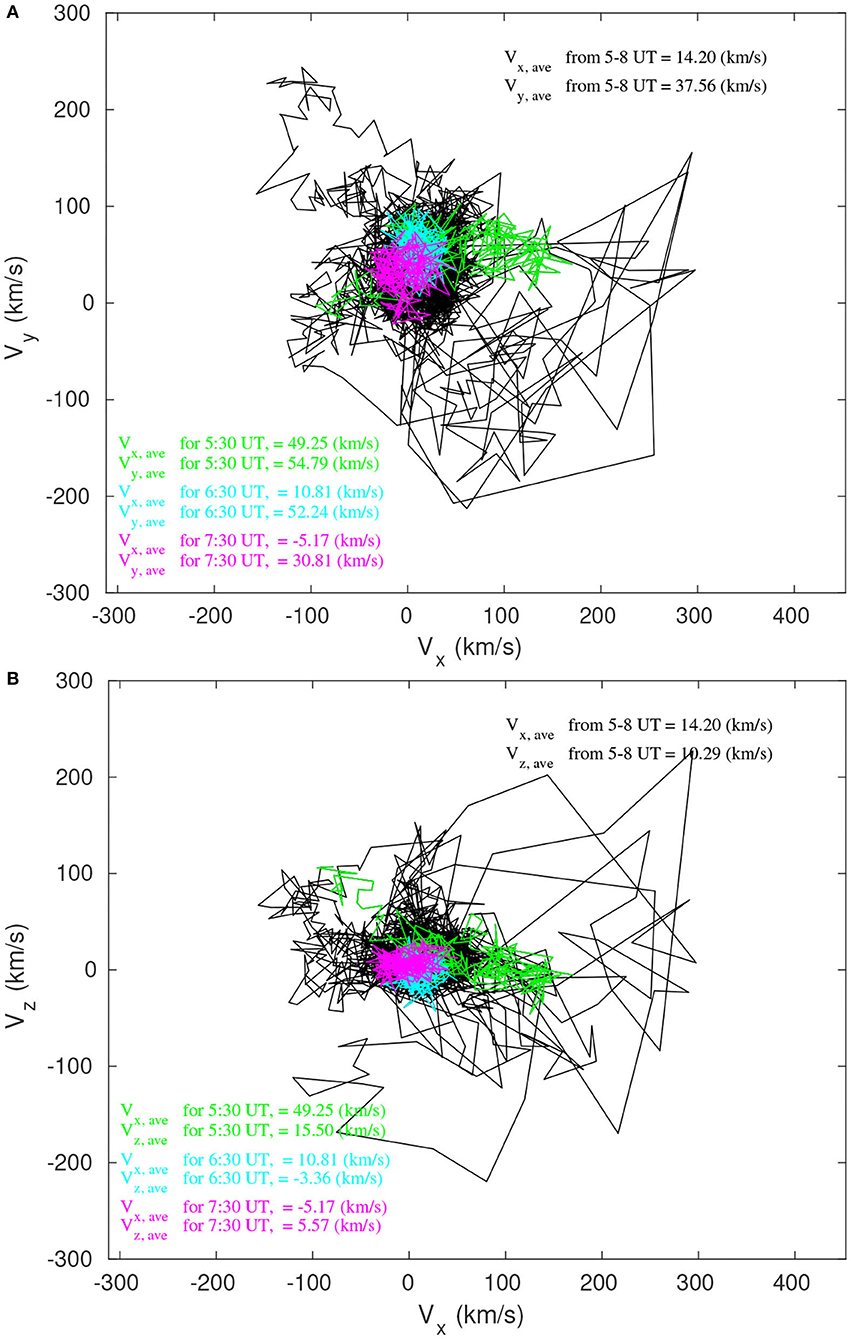
Figure 3. Hodograms of flow measured between 5 and 8 UT by THEMIS-C (THC) on 26 February 2008 and during three 12 min intervals. Panels from top to bottom are: (A) Vx and Vy, (B) Vx and Vz bulk velocity components. The colors represent 12 min intervals centered at the time indicated in the lower left corner by the same color together with the average bulk velocity calculated for each interval.
Figure 4 illustrates the spatial coverage of the selected intervals projected in the X-Ygsm and X-Zgsm planes in the geocentric solar magnetospheric system. Each interval is represented by a dot, which is color-coded with the measured plasma β parameter. Furthermore, the intervals selected correspond to the quiet time geomagnetic conditions, which were identified using the criteria applied by Stepanova et al. (2011). They are based on the variation of the high resolution (1-min) auroral electrojet lower index (AL) obtained from the OMNI database. This was achieved by subjecting the 1-min resolution of the AL index to AL ≥ −100 nT and the slope absolute value |s| to ≤ 1/2 nT/min, which indicate how fast the AL-index changed during a minute (more details about this analysis are given in Stepanova et al., 2011).
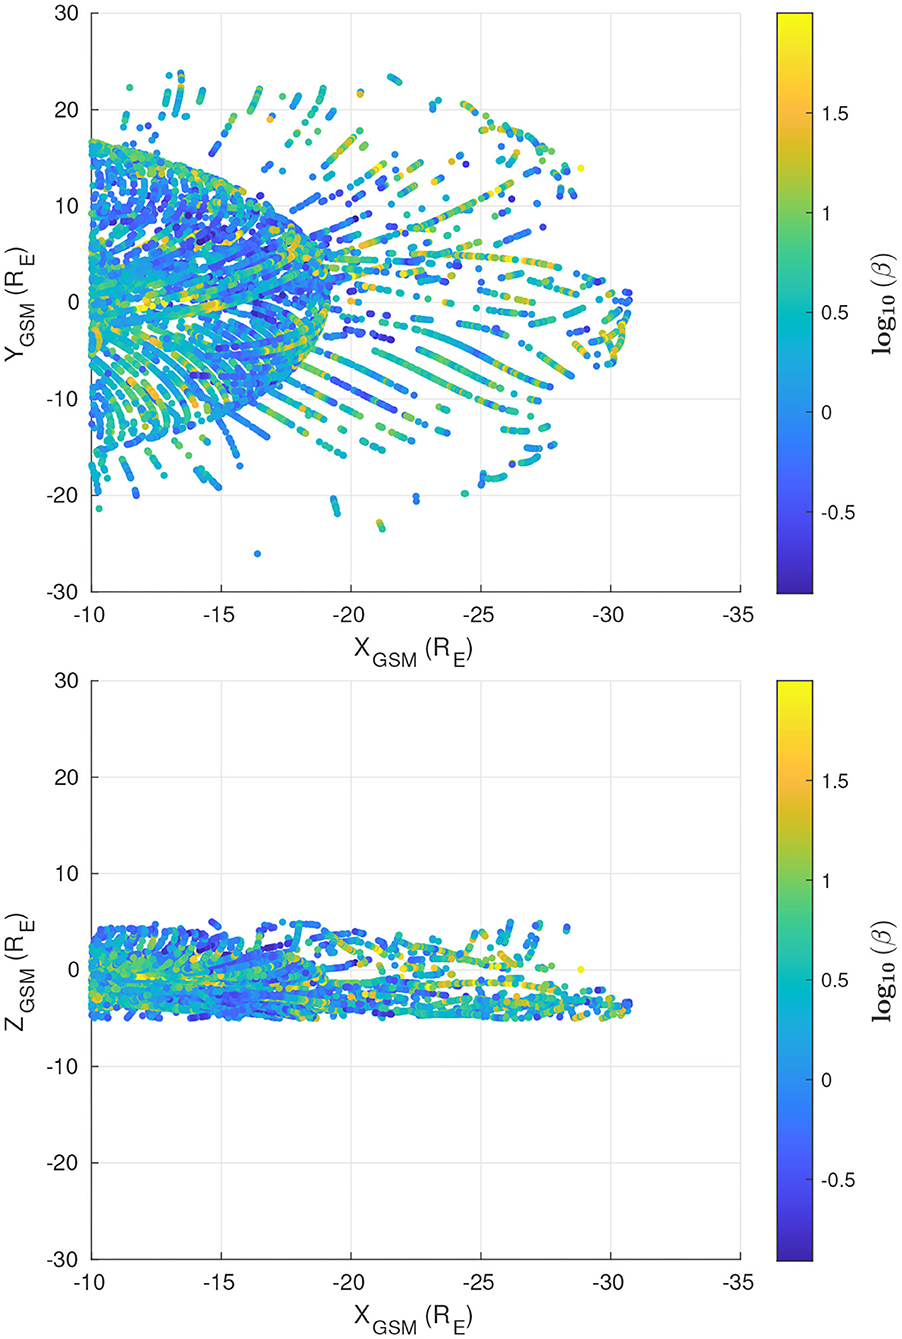
Figure 4. Spatial coverage of the time intervals used in the study. (Top) The X-Ygsm plane. (Bottom) The X-Zgsm plane. The 12-min averaged plasma β at each location is represented with the color scale.
3. Results
As seen in Figure 2, for relatively low β the values of κ in some intervals anti-correlate with the eddy diffusion coefficients. However, whether this behavior persists for all orbits and for all values of β is unclear. Thus we made an extensive statistical study of a set of hundreds of thousands quiet time 12-min-long intervals, for which we have calculated D, κ, and β. Considering that both D and β cover a few orders of magnitude, we define a grid in the logarithmic (β, D) space using a cell size of Δlog10 β = 0.2, and Δlog10 D = 0.5 within the range −1 < log10 β < 2 and 0 < log10 D < 7. This was used to create the color-coded plots shown in Figure 5.
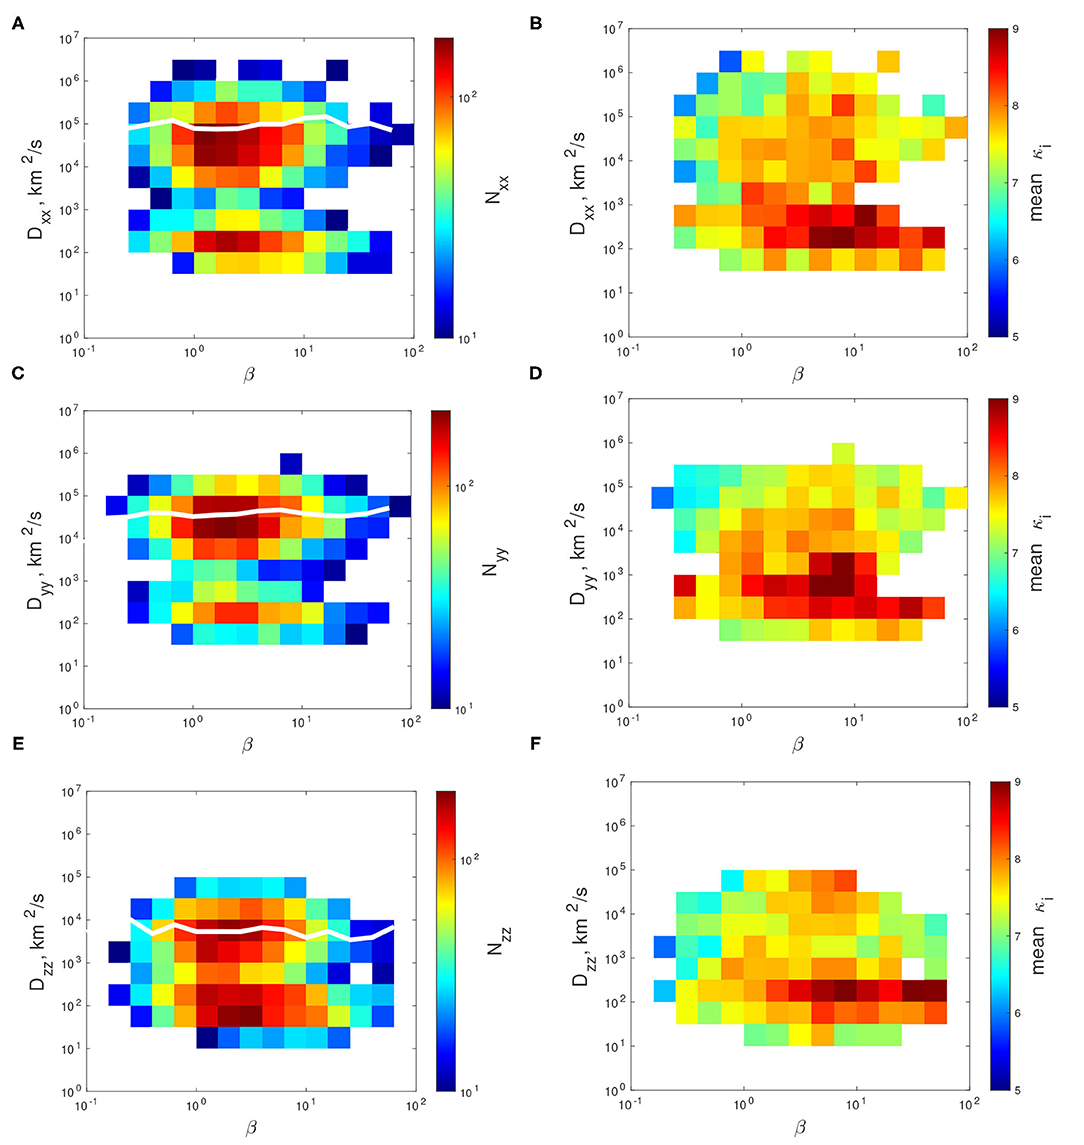
Figure 5. Eddy diffusion coefficients and κ indices as a function of β. Left column (A,C,E): the number of measurements in each cell. Right column (B,D,F): average values of the κ index. Only bins with 10 or more measurements are colored.
Figure 5 shows the number of measurements (N) and the average values of κi, in each bin. The empty bins contain less than ten measurements. As it can be seen in the left column [panels (A), (C), and (E)], for all eddy diffusion coefficients components, and for all values of β, the distributions of eddy diffusion coefficients have two maxima. The main peak corresponds to turbulent plasma, with D between 104 and 106 km2/s. These high values are the main contribution to the values of the eddy diffusion coefficients averaged within each β bin, which are shown with a white solid line in the figure. The secondary maximum might correspond to nearly laminar flows (D ~ 102 km2/s), which could be part of vortices larger than the maximum vortex size that we are able to detect (determined by the 12-min intervals chosen for this study). In such case, the rms velocity would be low, and the autocorrelation time would exceed 12 min, hence could not be measured correctly. In other words, this method may be insensitive to very large vortices, especially considering that the satellite velocity is often of the same order of magnitude as the plasma velocity averaged over turbulent eddies. Therefore, we restrict the following analysis of a possible relation between κ and Dαα to turbulent flows only.
In order to understand whether there is a relation between κ and Dαα for a fixed value of β (as suggested by the right panels of Figure 5), we use the linear function κ = Alog10 D + B to fit κ and log10 D. Figure 6 shows these dependencies for some selected values of β. The fitted data, corresponding to turbulent flows, are plotted with filled circles (D > 103 km2/s). The vertical error bars represent the standard deviation of the κ values within each bin; meanwhile, the horizontal error bars reflect the D bin's width.
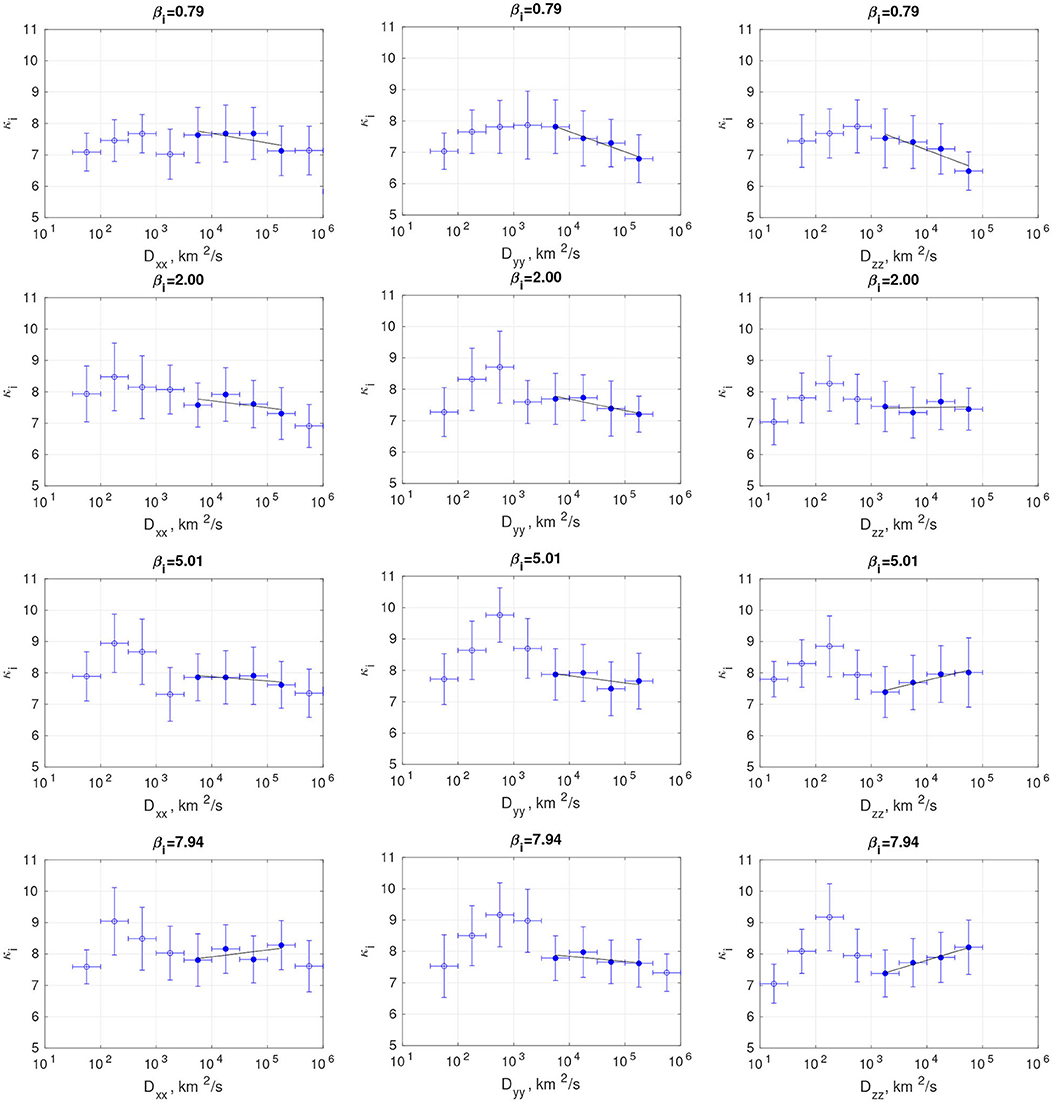
Figure 6. Dependence of ion κ indices on mean log10 D for different plasma β. The first column is for Dxx, while second and third columns are for Dyy and Dzz, respectively. The function κ = Alog10 D + B was fitted to the points plotted with filled circles, and the results are plotted with a solid line.
Despite the strong dispersion of the κ values in each bin, there are systematic trends in the behavior of the measured slopes (A) and intercept (B), as β increases (Figure 7). These trends are different for each Dαα component. For the x-component the κ indices almost do not depend on D: Axx ~ 0 except for β ~ 1, for which Axx is minimum and negative; thereby implying that the κ-index decreases with Dxx. The trend for Y is similar to the one observed for X but clearer. The behavior of Azz is different: it monotonically increases with β and changes its sign, implying that while κ decreases with D for low β, κ increases with D for β ≥ 2. The latter suggests that eddy diffusion in plasmas with high β might make the distribution functions more Maxwellian.
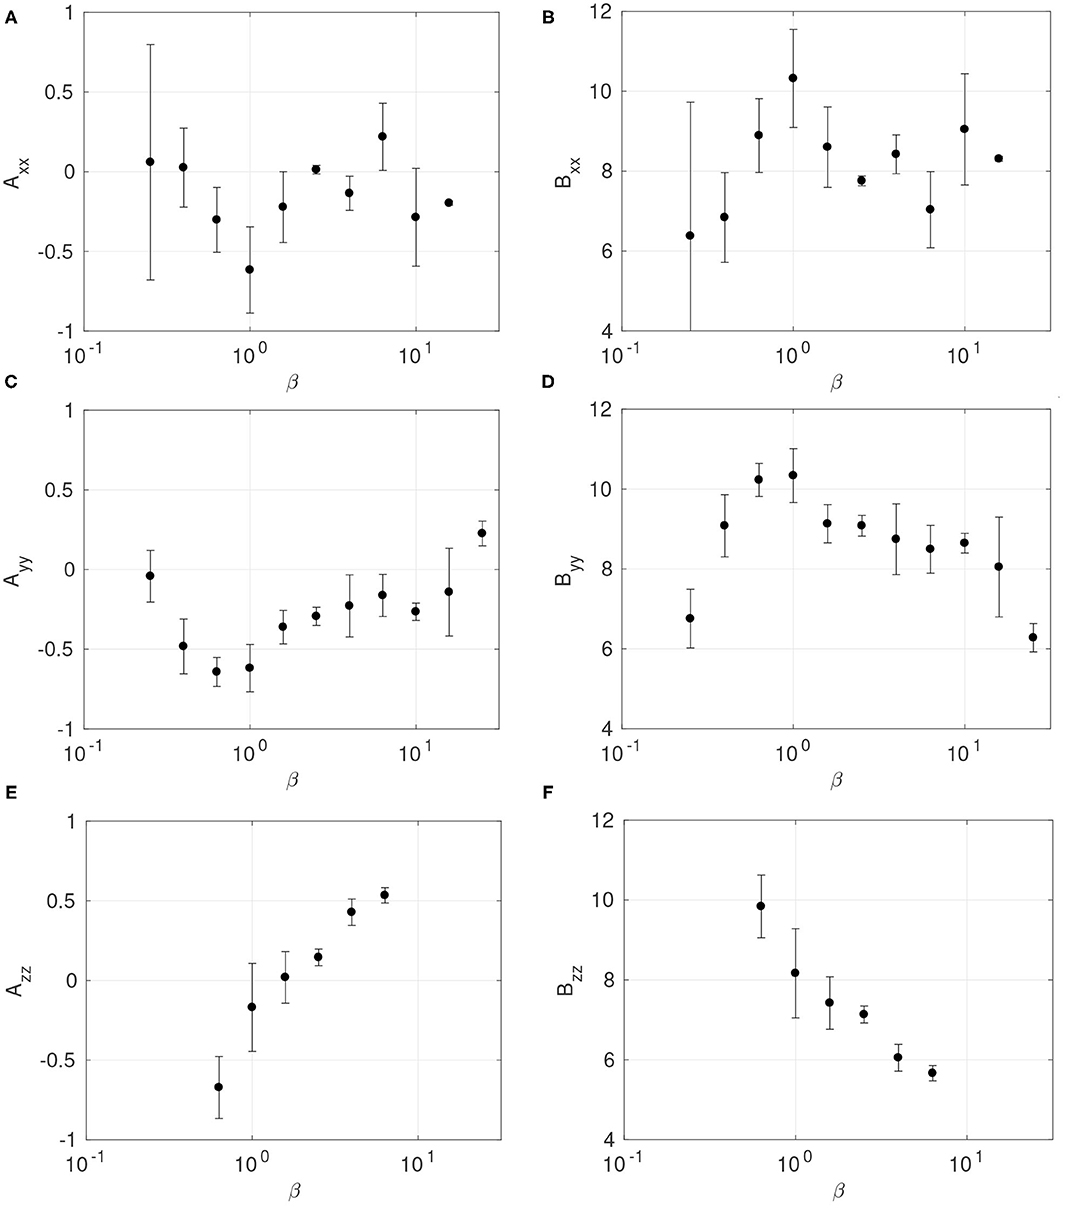
Figure 7. Slopes (A) and intercepts (B) obtained from fits of κ vs. log10 D data for different β values. The first row (A,B) is for Dxx, while the second (C,D) and third rows (E,F) are for Dxx and Dxx, respectively.
4. Discussion
Our study shows that MHD turbulence in the plasma sheet might have an intermittent character. As seen in Figure 5, for most β values the eddy diffusion coefficients vary over a wide range (101–106 km2/s) and present two peaks. The majority of the coefficients concentrate around 104–105 km2/s, which correspond to medium scale vortices with scales of ~ 10, 000 km that contribute to turbulent transport.
The eddy diffusion coefficients lower than 103 km2/s may correspond to very large vortices for which the coefficients are underestimated due to the 6-min limit in the determination of the autocorrelation time (half of the 12-min-long windows used for the analyses). The duration of the time interval used can also affect the values of the average Vrms over the interval. Borovsky et al. (1997) used a 2-h interval and obtained average bulk velocity values of the order of 10 km/s. In our study, these averages range between a few km/s to a few hundreds km/s, while the typical values are a few tens km/s. Inside big vortices the average Vrms will be low, because within the vortex the velocity of the vortex is subtracted and only small fluctuations remain.
On the other hand, the presence of stable quasi-laminar flows would agree with the results of Angelopoulos et al. (1999), who analyzed the properties of velocity fluctuations and concluded that the geomagnetic tail is a system that has properties of intermittent turbulence and exhibits sporadic variability. This fact is also reflected in multi-scale features of magnetic fluctuations in the near-Earth magnetosphere (Lui, 2001; Consolini et al., 2005). The intermittent behavior can be observed over all the plasma sheet for example see Figure 2, also (Stepanova and Antonova, 2011; Stepanova et al., 2011). However, the average values of the eddy diffusion coefficients are 104-105 km2/s (solid white lines in Figure 5), indicating a strong presence of turbulence, and suggesting that turbulent transport may play an important role in magnetospheric dynamics.
The evolution observed of κ toward the geomagnetic tail has been associated with the transport of particles induced by turbulent eddy diffusion. For slow plasma transport from the Earth to the tail, there is enough time for the Kappa distribution to relax toward Maxwellian distribution due to diffusion in the velocity space (aging). This mechanism of relaxation (proposed by Collier, 1999) explains also the increase of the κ-index with the Ec that has been observed (Kirpichev and Antonova, 2020; Eyelade et al., 2021).
Our results show that low values of κ are observed for the highest eddy diffusion coefficients Dxx and Dyy. In this case, turbulent transport in the X and Y directions is faster, and the available time for Kappa distribution functions to relax to a Maxwellian is shorter. Thus the Kappa distributions cannot thermalize, which is reflected in the low κ indices.
However, some energetic tails might also be the consequence of reconnection outflows, as observed in many experiments and also modeled by El-Alaoui et al. (2010, 2012). These outflows appear as part of turbulent cascades during MHD simulations, when the computer codes combine both low resistivity and small grid spacing, thereby obtaining comparatively large values of the magnetic Reynolds number. El-Alaoui et al. (2010, 2012), argued that the formation of localized reconnection regions is the main process driving turbulence in the plasma sheet. These processes would also lead to a decrease in κ-index.
On the other hand, for the Z direction the eddy diffusion seems to increase with the κ-index, for high values of β. This could be related to turbulent mixing, which is commonly observed in the plasma sheet. The mixing length of the average plasma sheet is ~10,000 km (Borovsky et al., 1998), leading to equalization of temperature across the plasma sheet, which is commonly observed (Huang and Frank, 1994). The plasma sheet extends to thousands of Earth's radii toward the tail in the X direction, while in the Y direction to tens of radii and just about ten Earth's radii in the direction perpendicular to the neutral sheet Z. This might explain why our results show that turbulent plasma mixing might prevail in the Z direction; meanwhile the fast turbulent transport and local reconnection is relevant in the X and Y directions. The efficiency of all the aforementioned processes could depend on the plasma β parameter, as reflected in our study. Nonetheless, more exhaustive statistical studies are necessary to untangle these effects.
5. Conclusions
Observations of ion Kappa distribution made by the multi-satellite THEMIS mission in the magnetotail plasma sheet were statistically explored in conjunction with eddy diffusion coefficients D and the plasma β parameter. Our study reveals the presence of turbulent flows (D ~ 104 − 106 km2/s) alternated with quasi-laminar flows (D ~ 102 km2/s), which might belong to large vortexes that are beyond the detection limits of our method. For turbulent plasmas, several processes related to MHD turbulence lead to either an increase or decrease of the κ index, depending on the value of β and the direction of the turbulent transport with respect to the plasma sheet.
Data Availability Statement
The raw data supporting the conclusions of this article will be made available by the authors, without undue reservation.
Author Contributions
All the research analysis in this study was carried out by AE, CE, and MS, while IK assisted in analyzing Kappa distribution functions. IO was engaged in the analysis of eddy diffusion transport, while EA was involved in the theoretical interpretation of the results. All authors contributed to the manuscript revisions and approved the final version of the manuscript.
Funding
This work was supported by Agencia Nacional de Investigación y Desarrollo de Chile (ANID) grants 21181777 and 1191351. MS acknowledges support from University of Santiago Chile through DICYT grant number 042031S. CE and MS acknowledge support from AFOSR (FA9550-19-1-0384).
Conflict of Interest
The authors declare that the research was conducted in the absence of any commercial or financial relationships that could be construed as a potential conflict of interest.
Acknowledgments
We acknowledge NASA contract NAS5-02099 and V. Angelopoulos for the use of THEMIS mission data, specifically C. W. Carlson and J. P. McFadden for ESA data, D. Larson for SST data, and K. H. Glassmeier, U. Auster, and W. Baumjohann for FGM data. THEMIS satellite mission data used in this paper are available on the THEMIS mission website: http://themis.ssl.berkeley.edu/index.shtml.
Footnotes
References
Angelopoulos, V. (2008). The themis mission. Space Sci. Rev. 141, 5–34. doi: 10.1007/s11214-008-9336-1
Angelopoulos, V., Kennel, C. F., Coroniti, F. V., Pellat, R., Spence, H. E., Kivelson, M. G., et al. (1993). Characteristics of ion flow in the quiet state of the inner plasma sheet. Geophys. Res. Lett. 20, 1711–1714. doi: 10.1029/93GL00847
Angelopoulos, V., Mukai, T., and Kokubun, S. (1999). Evidence for intermittency in earth's plasma sheet and implications for self-organized criticality. Phys. Plasmas 6, 4161–4168. doi: 10.1063/1.873681
Antonova, E. (2002). Magnetostatic equilibrium and turbulent transport in earth's magnetosphere: a review of experimental observation data and theoretical approach. Geomagn. Aeron. 3, 117–130. Available online at: http://ijga.agu.org/v03/gai00358/gai00358.htm
Antonova, E. E. (1985). The nonadiabatic character of diffusion and the equalization of concentration and temperature in the plasma sheet of the earth magnetosphere. Geomagn. Aeron. 25, 623–627.
Antonova, E. E. (2005). The structure of the magnetospheric boundary layers and the magnetospheric turbulence. Planet. Space Sci. 53, 161–168. doi: 10.1016/j.pss.2004.09.041
Antonova, E. E., and Ovchinnikov, I. L. (1996). The equilibrium of turbulent current sheet and the current sheet of the earth's magnetotail. Geomagn. Aeron. 36, 7–14.
Antonova, E. E., and Ovchinnikov, I. L. (1997). Current sheet with medium scale developed turbulence and the formation of the plasma sheet of earth's magnetosphere and solar prominences. Adv. Space Res. 19, 1919–1922. doi: 10.1016/S0273-1177(97)00101-4
Antonova, E. E., and Ovchinnikov, I. L. (1999). Magnetostatically equilibrated plasma sheet with developed medium-scale turbulence: structure and implications for substorm dynamics. J. Geophys. Res. 104, 17289–17298. doi: 10.1029/1999JA900141
Antonova, E. E., and Ovchinnikov, I. L. (2001). The model of turbulent plasma sheet during IMF Bz>0. Adv. Space Res. 28, 1747–1752. doi: 10.1016/S0273-1177(01)00541-5
Auster, H., Glassmeier, K., Magnes, W., Aydogar, O., Baumjohann, W., Constantinescu, D., et al. (2008). The themis fluxgate magnetometer. Space Sci. Rev. 141, 235–264. doi: 10.1007/s11214-008-9365-9
Baumjohann, W., and Treumann, R. (1997). Basic Space Plasma Physics. London: Imperial College Press.
Borovsky, J. E., Delzanno, G. L., Valdivia, J. A., Moya, P. S., Stepanova, M., Birn, J., et al. (2020). Outstanding questions in magnetospheric plasma physics: the Pollenzo view. J. Atmos. Sol. Terres. Phys. 208:105377. doi: 10.1016/j.jastp.2020.105377
Borovsky, J. E., Elphic, R. C., Funsten, H. O., and Thomsen, M. F. (1997). The Earth's plasma sheet as a laboratory for flow turbulence in high-[beta] MHD. J. Plasma Phys. 57, 1–34. doi: 10.1017/S0022377896005259
Borovsky, J. E., and Funsten, H. O. (2003). MHD turbulence in the Earth's plasma sheet: dynamics, dissipation, and driving. J. Geophys. Res. 108:1284. doi: 10.1029/2002JA009625
Borovsky, J. E., Thomsen, M. F., and Elphic, R. C. (1998). The driving of the plasma sheet by the solar wind. J. Geophys. Res. 103, 17617–17640. doi: 10.1029/97JA02986
Christon, S. P., Williams, D. J., Mitchell, D. G., Frank, L. A., and Huang, C. Y. (1989). Spectral characteristics of plasma sheet ion and electron populations during undisturbed geomagnetic conditions. J. Geophys. Res. 94, 13409–13424. doi: 10.1029/JA094iA10p13409
Christon, S. P., Williams, D. J., Mitchell, D. G., Huang, C. Y., and Frank, L. A. (1991). Spectral characteristics of plasma sheet ion and electron populations during disturbed geomagnetic conditions. J. Geophys. Res. 96, 1–22. doi: 10.1029/90JA01633
Collier, M. R. (1993). On generating kappa-like distribution functions using velocity space Levy flights. Geophys. Res. Lett. 20, 1531–1534. doi: 10.1029/93GL01702
Collier, M. R. (1999). Evolution of kappa distributions under velocity space diffusion: a model for the observed relationship between their spectral parameters. J. Geophys. Res. 104, 28559–28564. doi: 10.1029/1999JA900355
Consolini, G., Kretzschmar, M., Lui, A. T., Zimbardo, G., and Macek, W. M. (2005). On the magnetic field fluctuations during magnetospheric tail current disruption: a statistical approach. J. Geophys. Res. 110:10–11. doi: 10.1029/2004JA010947
El-Alaoui, M., Ashour-Abdalla, M., Richard, R. L., Goldstein, M. L., Weygand, J. M., and Walker, R. J. (2010). Global magnetohydrodynamic simulation of reconnection and turbulence in the plasma sheet. J. Geophys. Res. 115:2–5. doi: 10.1029/2010JA015653
El-Alaoui, M., Richard, R., Ashour-Abdalla, M., Walker, R., and Goldstein, M. (2012). Turbulence in a global magnetohydrodynamic simulation of the earth's magnetosphere during northward and southward interplanetary magnetic field. Nonlin. Process. Geophys. 19, 165–175. doi: 10.5194/npg-19-165-2012
Espinoza, C. M., Stepanova, M., Moya, P. S., Antonova, E. E., and Valdivia, J. A. (2018). Ion and electron kappa distribution functions along the plasma sheet. Geophys. Res. Lett. 45:6362. doi: 10.1029/2018GL078631
Eyelade, A. V., Stepanova, M., Espinoza, C. M., and Moya, P. S. (2021). On the relation between kappa distribution functions and the plasma beta parameter in the earth magnetosphere: THEMIS observations. arXiv 2101.07305.
Haaland, S., Kronberg, E. A., Daly, P. W., Fränz, M., Degener, L., Georgescu, E., et al. (2010). Spectral characteristics of protons in the Earth's plasmasheet: statistical results from cluster CIS and RAPID. Ann. Geophys. 28, 1483–1498. doi: 10.5194/angeo-28-1483-2010
Huang, C., and Frank, L. (1994). A statistical survey of the central plasma sheet. J. Geophys. Res. 99, 83–95. doi: 10.1029/93JA01894
Keika, K., Nakamura, R., Volwerk, M., Angelopoulos, V., Baumjohann, W., Retinò, A., et al. (2009). Observations of plasma vortices in the vicinity of flow-braking: a case study. Ann. Geophys. 27, 3009–3017. doi: 10.5194/angeo-27-3009-2009
Keiling, A., Angelopoulos, V., Weygand, J. M., Amm, O., Spanswick, E., Donovan, E., et al. (2009). THEMIS ground-space observations during the development of auroral spirals. Ann. Geophys. 27, 4317–4332. doi: 10.5194/angeo-27-4317-2009
Kirpichev, I., and Antonova, E. (2020). Dependencies of kappa parameter on the core energy of kappa distributions and plasma parameter in the case of the magnetosphere of the earth. Astrophys. J. 891:35. doi: 10.3847/1538-4357/ab700f
Lazar, M., Fichtner, H., and Yoon, P. (2016). On the interpretation and applicability of κ-distributions. Astron. Astrophys. 589:A39. doi: 10.1051/0004-6361/201527593
Lazar, M., Poedts, S., and Fichtner, H. (2015). Destabilizing effects of the suprathermal populations in the solar wind. Astron. Astrophys. 582:A124. doi: 10.1051/0004-6361/201526509
Lazar, M., Scherer, K., Fichtner, H., and Pierrard, V. (2020). Toward a realistic macroscopic parametrization of space plasmas with regularized κ-distributions. Astron. Astrophys. 634:A20. doi: 10.1051/0004-6361/201936861
Lee, J. H., and Angelopoulos, V. (2014). On the presence and properties of cold ions near earth's equatorial magnetosphere. J. Geophys. Res. 119, 1749–1770. doi: 10.1002/2013JA019305
Livadiotis, G. (2015). Introduction to special section on origins and properties of kappa distributions: statistical background and properties of kappa distributions in space plasmas. J. Geophys. Res. 120, 1607–1619. doi: 10.1002/2014JA020825
Livadiotis, G., and McComas, D. (2013). Understanding kappa distributions: a toolbox for space science and astrophysics. Space Sci. Rev. 175, 183–214. doi: 10.1007/s11214-013-9982-9
Lui, A. (2001). Multifractal and intermittent nature of substorm-associated magnetic turbulence in the magnetotail. J. Atmos. Sol. Terres. Phys. 63, 1379–1385. doi: 10.1016/S1364-6826(00)00239-X
Lyons, L., Williams, D., and Prigancova, A. (1985). Book-review-quantitative aspects of magnetospheric physics-geophysics and astrophysics monographs. Astrophys. Space Sci. 113:423. doi: 10.1007/BF00650979
McFadden, J., Carlson, C., Larson, D., Ludlam, M., Abiad, R., Elliott, B., et al. (2008). The themis esa plasma instrument and in-flight calibration. Space Sci. Rev. 141, 277–302. doi: 10.1007/s11214-008-9440-2
Montgomery, D. (1987). “Remarks on the MHD problem of generic magnetospheres and magnetotails,” in Magnetotail Physics, ed A. T. Y. Liu (Baltimore, MD: Johns Hopkins University Press), 203.
Nauenberg, M. (2003). Critique of q-entropy for thermal statistics. Phys. Rev. E 67:036114. doi: 10.1103/PhysRevE.67.036114
Nauenberg, M. (2004). Reply to “comment on ‘critique of q-entropy for thermal statistics'”. Phys. Rev. E 69:038102. doi: 10.1103/PhysRevE.69.038102
Navarro, R. E., Moya, P. S., Muñoz, V., Araneda, J. A., Viñas, A. F., and Valdivia, J. A. (2015). Magnetic alfven-cyclotron fluctuations of anisotropic non-thermal plasmas. J. Geophys. Res. 120, 2382–2396. doi: 10.1002/2014JA020550
Ness, N. F., Harrison, J. C., and Slichter, L. B. (1961). Observations of the free oscillations of the earth. J. Geophys. Res. 66, 621–629. doi: 10.1029/JZ066i002p00621
Olbert, S. (1968). “Summary of experimental results from MIT detector on IMP-1,” in Physics of the Magnetosphere, eds R. L. Carovillano, J. F. McClay, and H. R. Radoski (Dordrecht: Springer), 641–659. doi: 10.1007/978-94-010-3467-8_23
Olsson, A., and Janhunen, P. (1998). Field-aligned conductance values estimated from Maxwellian and kappa distributions in quiet and disturbed events using freja electron data. Ann. Geophys. 16, 298–302. doi: 10.1007/s00585-998-0298-0
Ovchinnikov, I. L., Antonova, E. E., and Yermolaev, Y. I. (2000). Determination of the turbulent diffusion coefficient in the plasma sheet using the project interball data. Cosmic Res. 38, 557–561. doi: 10.1023/A:1026686600686
Panov, E. V., Nakamura, R., Baumjohann, W., Sergeev, V. A., Petrukovich, A. A., Angelopoulos, V., et al. (2010). Plasma sheet thickness during a bursty bulk flow reversal. J. Geophys. Res. 115:A05213. doi: 10.1029/2009JA014743
Petrukovich, A., Artemyev, A., Vasko, I., Nakamura, R., and Zelenyi, L. (2015). Current sheets in the earth magnetotail: plasma and magnetic field structure with cluster project observations. Space Sci. Rev. 188, 311–337. doi: 10.1007/s11214-014-0126-7
Pinto, V., Stepanova, M., Antonova, E. E., and Valdivia, J. A. (2011). Estimation of the eddy-diffusion coefficients in the plasma sheet using THEMIS satellite data. J. Atmos. Sol. Terres. Phys. 73, 1472–1477. doi: 10.1016/j.jastp.2011.05.007
Runov, A., Angelopoulos, V., Gabrielse, C., Liu, J., Turner, D. L., and Zhou, X. Z. (2015). Average thermodynamic and spectral properties of plasma in and around dipolarizing flux bundles. J. Geophys. Res. 120, 4369–4383. doi: 10.1002/2015JA021166
Runov, A., Angelopoulos, V., and Zhou, X. Z. (2012). Multipoint observations of dipolarization front formation by magnetotail reconnection. J. Geophys. Res. 117:14. doi: 10.1029/2011JA017361
Scherer, K., Fichtner, H., Fahr, H. J., and Lazar, M. (2019). On the applicability of κ-distributions. Astrophys. J. 881:93. doi: 10.3847/1538-4357/ab2df9
Scherer, K., Fichtner, H., and Lazar, M. (2018). Regularized κ-distributions with non-diverging moments. Europhys. Lett. 120:50002. doi: 10.1209/0295-5075/120/50002
Sitnov, M., Birn, J., Ferdousi, B., Gordeev, E., Khotyaintsev, Y., Merkin, V., et al. (2019). Explosive magnetotail activity. Space Sci. Rev. 215:31. doi: 10.1007/s11214-019-0599-5
Sonett, C. P. (1960). “Space research, proceedings of the first international space science symposium,” Nice, ed H. K. Bijl (New York, NY: North-Holland Publishing Amsterdam), 921.
Stepanova, M., and Antonova, E. E. (2011). Modeling of the turbulent plasma sheet during quiet geomagnetic conditions. J. Atmos. Sol. Terres. Phys. 73, 1636–1642. doi: 10.1016/j.jastp.2011.02.009
Stepanova, M., and Antonova, E. E. (2015). Role of turbulent transport in the evolution of the κ distribution functions in the plasma sheet. J. Geophys. Res. 120:2014JA020684. doi: 10.1002/2014JA020684
Stepanova, M., Antonova, E. E., Paredes-Davis, D., Ovchinnikov, I. L., and Yermolaev, Y. I. (2009). Spatial variation of Eddy-diffusion coefficients in the turbulent plasma sheet during substorms. Ann. Geophys. 27, 1407–1411. doi: 10.5194/angeo-27-1407-2009
Stepanova, M., Pinto, V., Valdivia, J. A., and Antonova, E. E. (2011). Spatial distribution of the Eddy diffusion coefficients in the plasma sheet during quiet time and substorms from THEMIS satellite data. J. Geophys. Res. 116:1637. doi: 10.1029/2010JA015887
Treumann, R., and Baumjohann, W. (2020). Olbertian partition function in scalar field theory. arXiv 2011.03445. doi: 10.3389/fphy.2020.610625
Troshichev, O. A., Antonova, E. E., and Kamide, Y. (2002). Inconsistency of magnetic field and plasma velocity variations in the distant plasma sheet: violation of the “frozen-in” criterion? Adv. Space Res. 30, 2683–2687. doi: 10.1016/S0273-1177(02)80382-9
Tsallis, C. (1988). Possible generalization of boltzmann-gibbs statistics. J. Stat. Phys. 52:479. doi: 10.1007/BF01016429
Tsallis, C. (2004). Comment on “critique of q-entropy for thermal statistics”. Phys. Rev. E 69:038101. doi: 10.1103/PhysRevE.69.038101
Vasyliunas, V. M. (1968). A survey of low-energy electrons in the evening sector of the magnetosphere with OGO1 and OGO3. J. Geophys. Res. 73, 2839–2884. doi: 10.1029/JA073i009p02839
Viñas, A. F., Moya, P. S., Navarro, R. E., Valdivia, J. A., Araneda, J. A., and Muñoz, V. (2015). Electromagnetic fluctuations of the whistler cyclotron and firehose instabilities in a maxwellian and tsallis-kappa-like plasma. J. Geophys. Res. 120, 3307–3317. doi: 10.1002/2014JA020554
Weygand, J. M., Kivelson, M. G., Khur ana, K. K., Schwarzl, H. K., Thompson, S. M., McPherron, R. L., et al. (2005). Plasma sheet turbulence observed by cluster II. J. Geophys. Res. 110:A01205. doi: 10.1029/2004JA010581
Wing, S., Johnson, J., Newell, P., and Meng, C. I. (2005). Dawn-dusk asymmetries, ion spectra, and sources in the northward interplanetary magnetic field plasma sheet. J. Geophys. Res. 110:7–8. doi: 10.1029/2005JA011086
Keywords: turbulence, Kappa distributions, plasma sheet, magnetotail, substorms
Citation: Eyelade AV, Espinoza CM, Stepanova M, Antonova EE, Ovchinnikov IL and Kirpichev IP (2021) Influence of MHD Turbulence on Ion Kappa Distributions in the Earth's Plasma Sheet as a Function of Plasma β Parameter. Front. Astron. Space Sci. 8:647121. doi: 10.3389/fspas.2021.647121
Received: 29 December 2020; Accepted: 25 February 2021;
Published: 23 March 2021.
Edited by:
Luca Sorriso-Valvo, Institute for Space Physics (Uppsala), SwedenReviewed by:
Ivan Vasko, University of California, Berkeley, United StatesMarian Lazar, Ruhr-Universität Bochum, Germany
Copyright © 2021 Eyelade, Espinoza, Stepanova, Antonova, Ovchinnikov and Kirpichev. This is an open-access article distributed under the terms of the Creative Commons Attribution License (CC BY). The use, distribution or reproduction in other forums is permitted, provided the original author(s) and the copyright owner(s) are credited and that the original publication in this journal is cited, in accordance with accepted academic practice. No use, distribution or reproduction is permitted which does not comply with these terms.
*Correspondence: A. V. Eyelade, YWRldGF5by5leWVsYWRlQHVzYWNoLmNs; M. Stepanova, bWFyaW5hLnN0ZXBhbm92YUB1c2FjaC5jbA==