 Rémi Bérard1,2
 Kremena Makasheva2
 Karine Demyk1
 Aude Simon3
 Dianailys Nuñez Reyes1
 Fabrizio Mastrorocco1
 Hassan Sabbah1,4
 Christine Joblin1*
- 1IRAP, CNRS, UPS, CNES, Université de Toulouse, Toulouse, France
- 2LAPLACE, CNRS, UPS, INPT, Université de Toulouse, Toulouse, France
- 3LCPQ-IRSAMC, UPS, CNRS, Université de Toulouse, Toulouse, France
- 4LCAR-IRSAMC, UPS, CNRS, Université de Toulouse, Toulouse, France
Laboratory experiments are essential in exploring the mechanisms involved in stardust formation. One key question is how a metal is incorporated into dust for an environment rich in elements involved in stardust formation (C, H, O, Si). To address experimentally this question we have used a radiofrequency cold plasma reactor in which cyclic organosilicon dust formation is observed. Metallic (silver) atoms were injected in the plasma during the dust nucleation phase to study their incorporation in the dust. The experiments show formation of silver nanoparticles (~15 nm) under conditions in which organosilicon dust of size 200 nm or less is grown. The presence of AgSiO bonds, revealed by infrared spectroscopy, suggests the presence of junctions between the metallic nanoparticles and the organosilicon dust. Even after annealing we could not conclude on the formation of silver silicates, emphasizing that most of silver is included in the metallic nanoparticles. The molecular analysis performed by laser mass spectrometry exhibits a complex chemistry leading to a variety of molecules including large hydrocarbons and organometallic species. In order to gain insights into the involved chemical molecular pathways, the reactivity of silver atoms/ions with acetylene was studied in a laser vaporization source. Key organometallic species, AgnC2Hm (n = 1–3; m = 0–2), were identified and their structures and energetic data computed using density functional theory. This allows us to propose that molecular Ag–C seeds promote the formation of Ag clusters but also catalyze hydrocarbon growth. Throughout the article, we show how the developed methodology can be used to characterize the incorporation of metal atoms both in the molecular and dust phases. The presence of silver species in the plasma was motivated by objectives finding their application in other research fields than astrochemistry. Still, the reported methodology is a demonstration laying down the ground for future studies on metals of astrophysical interest, such as iron.
1. Introduction
Interstellar space is populated by gas and dust made of (nano)grains of size less than typically 100 nm. A large fraction of this dust is expected to be formed in the cooling gas expelled from evolved stars and injected in the interstellar medium. The environments in which stardust forms include the envelopes of asymptotic giant branch (AGB) stars and the ejecta of supernovae. They comprise a range of densities and temperatures and carry chemical complexity involving as main elements H, C, O and N but also less abundant species, such as Si, S, and metals (Ti, Al, Mg, Fe). Infrared observations have led to identify two main classes of dust composition: carbon-based and oxide-based (silicates) dust, which was mainly attributed to the value of the C/O abundance ratio during their formation. Indeed, at thermal equilibrium, only the dominant of the two elements (C or O) is expected to remain available for dust formation, due to the consumption of the other element by the very stable CO molecule. For environments that are rich in oxygen, the formed solids would therefore be metal oxides (e.g., Al2O3) and silicates (e.g., Mg2SiO4 and MgSiO3) and for environments rich in carbon one would expect the formation of silicon and titanium carbide as well as of solid carbon. But the analysis of observations suggests that other types of grains e.g., metallic iron grains, might be present (Kemper et al., 2002). This calls for a better understanding of the formation of stardust. However, this is a complex problem in which evolving chemical conditions are coupled with the changing physical conditions of the expanding shell or cooling ejecta. Most of the chemistry is therefore expected to be out of equilibrium and indeed molecular observations point to species whose observed abundances are not in agreement with equilibrium chemical models of stellar atmospheres (e.g., detection of SiO and H2O in C-rich environments; Schöier et al., 2006, 2011; Cherchneff, 2012 and references therein). Considering these out-of-equilibrium conditions and the diversity of chemical elements that are involved, one could therefore expect a larger diversity of dust components, either as separate grains or combined in heterogeneous phases.
The conditions in which stardust forms differ from laboratory conditions. In particular, they involve much lower densities of species. In terms of gas-phase chemistry it implies that a reactive complex cannot be stabilized by 3-body reactions. Simulating the chemistry in circumstellar environments requires then to consider gas-phase chemistry and gas-grain interactions (once dust is formed) in low-density conditions and for a range of temperatures (typically from 2,000 to ~500 K). Various techniques have been used to produce stardust analogs, which are based on laser ablation and laser pyrolysis (Kroto et al., 1985; Jäger et al., 2009), flames (Carpentier et al., 2012), pyrolysis (Biennier et al., 2009), thermal evaporation (Ishizuka et al., 2015), and dusty plasmas (Contreras and Salama, 2013). The conditions in these different experiments have been summarized in Mart́ınez et al. (2020). The latter article reports on the first experiments with a new setup, the Stardust machine, which presents the advantages of relatively well-controlled conditions for the study of stardust formation. Still the machine is not designed to address the case of a too complex chemistry involving more than a couple of elements, which calls for preparatory experiments in order to tackle the impact of chemical complexity on dust formation and growth.
We report here a study focusing on the impact of the addition of a metal on dust formation in an environment in which the key elements involved in stardust formation (C, H, O, Si) are already present. To address experimentally this question we have used a radiofrequency cold plasma reactor for which cyclic dust formation from the decomposition of an organosilicon precursor was observed (Despax et al., 2012; Garofano et al., 2019). In addition, the reactor has been designed to allow for the introduction of metallic (silver) atoms in the plasma during the dust nucleation phase. This is achieved by sputtering of a metallic target and has the advantage not to involve in dust formation additional fragments issued from the decomposition of metal-organic precursors. We have also performed complementary experiments using a newly developed laser vaporization source, in order to get further information on the gas-phase reactivity of silver atoms/ions and their small clusters with hydrocarbons. The dust composition was analyzed by infrared spectroscopy and the molecular composition by laser mass spectrometry. The experimental methodology was complemented by density functional theory calculations. Throughout the article, we show how the developed methodology can be used to characterize the incorporation of metal atoms into the molecular and dust phases. The presence of a silver electrode within the plasma reactor was motivated by objectives finding their application in other research fields in relation with the optical, electronic and biocide properties of silver nanoparticles. Still, we believe that the reported results provide general ideas about what could be expected for more astro-relevant metals, such as titanium, aluminum, magnesium, or iron.
Our article is organized as follows. We first present our methodology followed by the results on infrared spectroscopy and molecular analysis. We include in the discussion the impact of Ag on the dust composition as well as its catalytic role on hydrocarbon molecular growth. We provide potential astrophysical implications. Finally, we conclude and present some perspectives.
2. Materials and Methods
2.1. Cold Plasma Experiments
Dust formation was achieved in a cold plasma successfully combining fragmentation of a precursor and sputtering of a metal target. The plasma reactor is a capacitively-coupled radio-frequency one (RF, 13.56 MHz) with strong axial asymmetry that leads to a self-bias voltage (negative in this case) on the powered electrode and is at the origin of acceleration of the positive ions from the plasma toward this same electrode to bombard it and achieve sputtering. Typically, this type of plasma is used for deposition on a substrate of nanocomposite thin dielectric films with embedded metallic nanoparticles for different applications (Despax and Raynaud, 2007; Körner et al., 2010; Milella et al., 2014; Makasheva et al., 2016). In this work, we take advantage of this versatile cold plasma to focus on dust formation in the plasma gas-phase. The plasma was sustained at low gas pressure (5.3 × 10⁻² mbar) in argon gas (AirLiquid ALPHAGAZ 2 with a purity of 99.9995%), injected continuously at 2.8 sccm (standard cubic centimeters at standard pressure and temperature). The reactive gas used for dust formation was hexamethyldisiloxane (HMDSO, C6H18OSi2, Sigma-Aldrich with a purity >99.5%), injected by pulses. Stable cyclic dust formation in the plasma can exclusively be obtained when the precursor is injected by pulses (Despax et al., 2012; Garofano et al., 2019). In the reported here experiments, the HMDSO gas pulses were injected during 1.5 s each 5 s, thus providing an averaged over the gas-pulses flow of 0.12 sccm and leading to a total gas-mixture pressure of 5.6 × 10⁻² mbar. Such selection of the gas-pulse parameters allows simultaneous fragmentation of the precursor and sputtering of the metal target to provide the metal atoms. Silver (Inland Europe, with purity of 99.99%) was used here, due to the multidisciplinary context of the study. A power of 30 W was applied to the plasma to perform the experiments. Prior to each experiment, the reactor was mechanically cleaned with ethanol and pumped overnight. Further details on the experimental setup can be found in Despax and Raynaud (2007) and Bérard et al. (submitted). The different stages of cyclic dust formation in the plasma gas-phase were monitored in situ by optical emission spectroscopy (Despax et al., 2012; Garofano et al., 2019). For ex situ analysis, such as electron microscopy, infrared spectroscopy, and molecular analysis, as discussed below, the produced dust was collected on silicon substrates (provided by Sil'tronix).
2.2. Laser Vaporization Experiments
Gas-phase experiments were performed in the laser vaporization source (LVAP) of the PIRENEA 2 setup (Bonnamy et al., 2018). LVAP is a laser aggregation source combining laser ablation with pulsed buffer gas in order to favor the formation of clusters from the vapor of ablated material. This technique is commonly used to produce gas-phase clusters (Duncan, 2012) and more precisely LVAP is based on the design described in Truong et al. (2016). The second harmonic of a Nd:YAG pulsed laser (QUANTEL Q-smart 850) at 532 nm was focused on a silver rod (NEYCO 99.9994% purity). At this wavelength, Duncan (2012) noticed that, in the case of silver, atomic species rather than clusters are formed. The typical energy of the laser pulse is 6–8 mJ with a repetition rate of 10 Hz. The rod is continuously rotated and translated by a motor to expose fresh surface to each laser spot. After each experiment, the silver rod is mechanically cleaned using a sponge and ethanol followed by 15 min in an ultrasonic bath filled with ethanol. Typical background pressure in the source chamber is 3 × 10⁻⁷ mbar. Cooling of the laser plasma and clustering is produced by He gas with a backing pressure of 3.5 bar injected through a pulsed valve (Parker) with a repetition rate of 10 Hz and a pulse duration of 550 μs. For reactivity studies, He gas containing 1% of acetylene was used. In this configuration, the reactive gas and the Ag species created in the plasma interact near the ablation zone and in the growth channel of 1 cm long. The formed species are collected during 1–2 h of operation on a gold coated stainless steel disc (10 mm, TED PELLA PELCO AFM) located at 5 cm away from the ablation zone. The deposition disc is then extracted from the source for an ex situ analysis in the AROMA setup. The main operating parameters associated with the LVAP samples are given in Table 1.
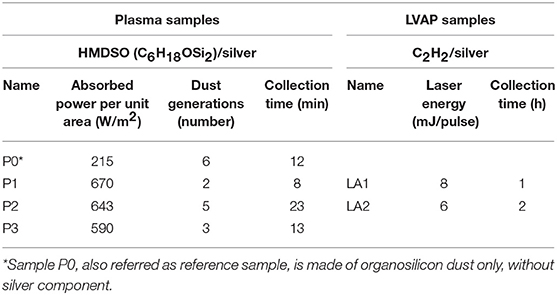
Table 1. Short summary on the samples presented in this study.
2.3. Infrared Spectroscopy
The infrared (IR) spectra were recorded on the experimental setup ESPOIRS dedicated to the study of the optical properties of analogs of interstellar grains in the infrared and submillimeter range (ESPOIRS; Demyk et al., 2017). For these measurements, the ESPOIRS Fourier-transform spectrometer (Bruker VERTEX 70V) was equipped with a Globar source, a KBr beamsplitter and a DLaTGS detector. The IR spectra were recorded under a controlled rarefied atmosphere of 0.5 mbar with a 2 cm−1 resolution between 4,000 and 400 cm−1. A total of 256 to 1,024 scans are co-added to ensure a good signal-to-noise ratio of the final spectra. Plasma dust was collected on intrinsic silicon substrates, because of their transparency to infrared light. The transmittance spectra are obtained after dividing the spectra of each sample by the spectrum of a blank silicon substrate recorded under the same conditions (pressure, temperature). The absorbance spectra are calculated from the transmittance spectra and a continuum is subtracted to facilitate comparison of the spectra. The evolution of the IR spectrum with temperature was followed by using the environmental cell of ESPOIRS (HT/HP Cell EN58J from Specac). To improve thermal exchange with the cell, we used a Si-intrinsic substrate for the high temperature measurements thicker than the one used for room temperature measurements. The two dust samples, for room temperature and for high temperature measurements, were collected during the same plasma experiment with the experimental conditions of sample P1 (see Table 1). Spectra were recorded at room temperature, at 200 and 500°C. A temperature ramp of 5°C/min was applied. At each selected temperature, the spectra were recorded every 30 min over 2 h.
2.4. Molecular Analysis
The molecular analysis has been performed on the Astrochemistry Research of Organics with Molecular Analyzer (AROMA) setup. It consists of a microprobe laser desorption ionization (LDI) source and a segmented linear quadrupole ion trap connected to an orthogonal time-of-flight mass spectrometer. In a first step, a pulsed (5 ns) near-infrared laser (Nd:YAG at 1,064 nm) is focused on the sample with a spot size of 300 μm to cause rapid and localized heating. This favors thermal desorption over decomposition. The laser desorption fluence for this work varies in the 100–200 mJ/cm2 range. In a second step, a pulsed ultraviolet laser (fourth harmonic of an Nd:YAG at 266 nm) intercepts perpendicularly the expanding plume of the desorbed molecules after 0.2–0.4 μs and ionizes the organic molecules by (1+1) resonance-enhanced multi-photon ionization. Due to its specific features, the ionization source is particularly adapted for the analysis of aromatic organic compounds. Aliphatic hydrocarbons are difficult to detect with AROMA since they involve larger ionization potentials that cannot be reached with our laser scheme (Hanley and Zimmermann, 2009). The laser energy per pulse is optimized between 3 and 5 mJ/pulse to have parent ions and not fragments dominating the mass spectra. Generated ions are driven to the orthogonal time-of-flight mass spectrometer trough an horizontal segmented ions trap. The detailed description of the setup can be found elsewhere (Sabbah et al., 2017).
2.5. Theoretical Methods
In order to support the experimental data and provide first insights into C-H bond activation mechanisms, portions of potential energy surfaces (PES) for the complexes of interest were explored at the Density Functional Theory (DFT) level using the Gaussian16 suite of programs (Frisch et al., 2016). The wB97XD hybrid functional, which includes empirical dispersion and long-range corrections (Chai and Head-Gordon, 2008), was used in conjunction with the cc-pvtz basis set for C and H (Kendall et al., 1992). The wB97XD functional was previously employed to model cycloaddition reactions on Ag and Ag2 (Boz and Tüzün, 2016) in the context of modeling catalytic reactions on silver driving its biocide properties. The 4s, 4p, 4d, and 5s electrons of Ag are described using a [6s5p3d] basis set (Martin and Sundermann, 2001) associated to the Stuttgart relativistic effective core potential (ECP) (Andrae et al., 1990) that describes the 28 remaining core electrons. Basis sets and ECP were obtained from the Basis Set Exchange (Feller, 1996; Schuchardt et al., 2007; Pritchard et al., 2019). We insist on the fact that the calculations presented in the present paper can be regarded as starting points for further theoretical studies aiming at rationalizing and complementing the experimental investigations. Only trends are searched for, and any systematic benchmark, such as the one achieved for H2 activation by Ag2 and Ag3 (Moncho et al., 2013) are out of the scope presently.
Local DFT geometry optimizations were complemented by full harmonic frequency calculations diagonalizing the Hessian matrix. Each stationary geometry was characterized as a minimum or a saddle point of first order by frequency calculations, which were also used to obtain the zero-point vibrational energies (ZPE). The search for the transition states (TS) was accomplished through the Synchronous Transit-Guided Quasi-Newton (STQN) search algorithm, followed by the Berny algorithm, and confirmed by the Intrinsic Reaction Coordinate (IRC) procedure, as implemented in Gaussian16. Coupled-Cluster with Single and Double and perturbative Triple excitations [CCSD(T)] single point calculations on the DFT optimized geometries, using the same basis set, were occasionally performed to confirm the energetics.
3. Results
3.1. Dust Formation Conditions and Environment
The selected above plasma operating parameters (applied power, gas pressure, injected HMDSO amount and gas-pulse parameters) lead to the formation of successive dust generations in the plasma, approximately every 250 s. Due to the dynamic character of the cyclic dust generation all plasma characteristics oscillate with the same frequency. The produced plasma has averaged values of its two main characteristics, the electron energy and the electron number density, of 2.2 eV and 1.1 × 1010 cm−3, respectively (Garofano et al., 2019; Bérard et al., submitted). These values gradually vary during dust formation and dust escape from the plasma gas-phase. The electron energy and electron number density have opposite behavior. When dust grows in plasma the electron number density decreases (down to 1.0 × 1010 cm−3) because of the electron loss on the dust surface. In order to compensate the electron loss by stronger ionization, and thus to sustain the plasma, the electron energy increases up to 2.4 eV. At that stage the HMDSO fragments are involved in the dust growth and their contribution to the plasma maintenance is reduced. It is worth noting here that because the main channel of HMDSO fragmentation in the plasma goes through dissociative-ionization processes involving electrons, an increased electron energy would lead to stronger HMDSO fragmentation and result in smaller chemical species, increasing their variety. When dust escapes the plasma gas-phase, due to different forces exerting on it, the energetic need to sustain the plasma decreases and the electron energy goes down to 2.0 eV. The loss of electrons on the dust surface becomes limited and the electron number density increases up to 1.2 × 1010 cm−3. Moreover, without dust in the plasma, the HMDSO fragments which generally possess ionization potentials much lower than the one of argon largely contribute to the ionization and thus to the increase of the electron number density. The different chemical environments and the variety of chemical species during different stages of dust formation and escape from the plasma gas-phase determine the dynamical character of the chemical reactions and increase their possible pathways.
The complex chemistry and the large number of elementary processes occurring in the plasma define the total absorbed power per unit area Sabs (W/m2). They are also at the origin of the differences in Sabs although the injected power is kept constant (30 W) for the series of performed experiments. The total absorbed power in this kind of plasma is a sum of two components, each one representing the Ohmic and the stochastic electron heating. They both depend on the RF voltage amplitude and are weighed by the energy transfer from the electrons to the atoms and molecules in the plasma. In asymmetric capacitively-coupled plasmas, the self-bias voltage (in modulus) is close to the RF voltage amplitude; being smaller by a factor of 0.8 (Lieberman and Lichtenberg, 2005). The systematic measurement of the self-bias voltage on the powered electrode allows calculation of the amount of total absorbed power per unit area in the plasma. The obtained values are reported in Table 1. The differences in Sabs for the different samples point to variations in the plasma response in relation with its energetic conditions (electron energy and density variations).
The dust obtained in the plasma gas-phase under the above described dynamic chemical environment is composed of organosilicon (size 200 nm or less) and silver (polycrystalline nanoparticles of size 15 nm) parts. A clear segregation of these two phases is observed. The small whitish dots observed in Figure 1 are identified as silver compounds and the gray surrounding matter is of organosilicon composition as determined by energy dispersive X-ray spectroscopy. The morphology of the generated dust is of “raspberry-like” type as illustrated on Figure 1, which suggests a highly porous structure of the dust particles and cavities in between them. Further results on these aspects can be found elsewhere (Bérard et al., submitted). For comparison reasons, an organosilicon only dust sample, i.e., without the silver component (called hereafter reference sample), is included in the discussion of the results. The reference sample was obtained after injection in the plasma of a larger amount of HMDSO. The exact plasma operating conditions for generation of this sample are given in Bérard et al. (2019). Table 1 presents a summary of the plasma samples used in this work.
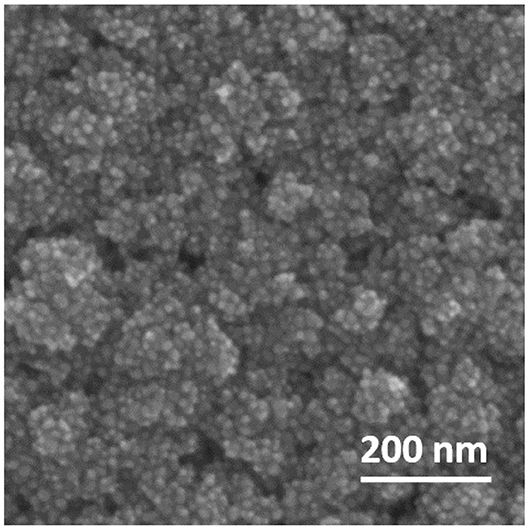
Figure 1. Scanning electron microscopy (SEM) image: plan view of the dust structure corresponding to sample P2, showing the two phases, organosilicon dust and silver nanoparticles organized in a “raspberry-like” structure.
3.2. Dust Infrared Spectroscopy
Infrared spectra are presented in Figure 2 for the plasma reference sample (P0) produced without silver and for the sample (P1) produced with silver in the plasma. The IR spectrum of P0 shows the characteristic bands of an organosilicon structure (Figure 2A). One can observe the two typical broad massifs centered around 800 and 1,000 cm−1 (Figure 2E) that indicate the amorphous structure of the organosilicon dust through the large band width. The intense band at 1,030 cm−1 can be assigned to Si-O-Si asymmetric stretching mode in a silicon suboxide environment with a contribution of the Si-CHx(x ≤ 2)-Si wagging mode, most probably positioned at around 1,020 cm−1. The band in the 800 cm−1 range is likely a mix of the Si-O-Si symmetric stretching vibration at 810 cm−1 with contribution of the symmetric stretching vibration of Si-C usually appearing at 840 cm−1, as well as several other bands between 700 and 900 cm−1 associated with Si-C and Si-O bonds of the organosilicon structure (Smith, 1960; Benítez et al., 2000; Raynaud et al., 2005; Despax and Raynaud, 2007; Li et al., 2020). Amongst the minor features, methyl CH stretching modes can also be observed at 2,960 and 2,904 cm−1, together with the typical symmetric bending mode of Si-CH3 at 1,260 cm−1, which is related to the decomposition of HMDSO in the plasma. The band at 2,876 cm−1 due to the symmetric stretching of CH2 is also present on the spectrum. It is paired with the Si-CH2-Si bridge (bending mode) at 1,358 cm−1, which is very slightly visible in the spectrum.
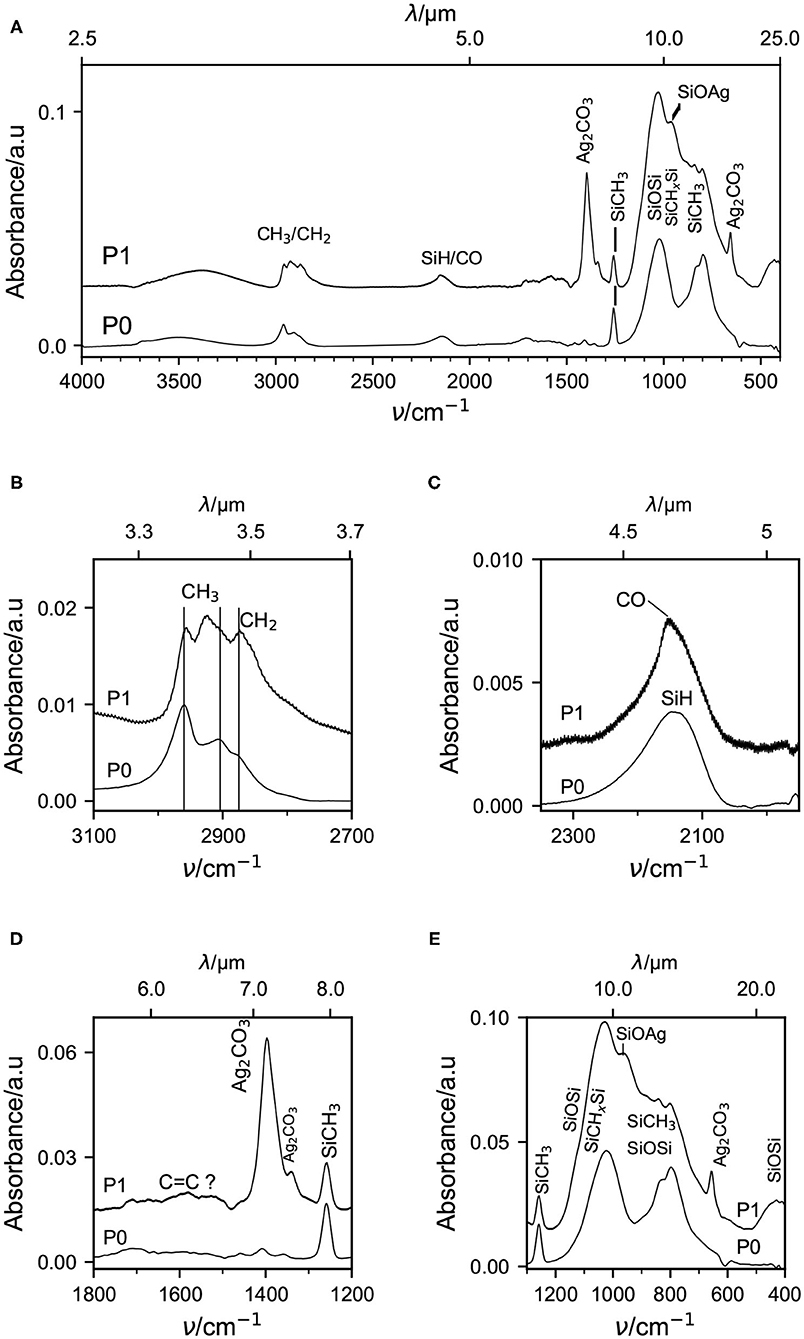
Figure 2. ESPOIRS-FTIR spectra of the collected dust in plasma experiments. (A) Full IR spectrum for samples P0 (without silver) and P1 (with silver) with the principal band attributions indicated (see text for more details). Zooms in on the most interesting spectral regions are presented in (B–E).
With the addition of silver in the experiments (sample P1), new bands appear in the spectrum. It is worth noting that the spectra of all silver-containing dust samples contain identical information. They all exhibit the same spectral bands although their relative intensities may vary slightly from one sample to another reflecting the heterogeneity of the produced dust. The most intense band is observed at 1,395 cm−1 with a shoulder at 1,340 cm−1. Another clear new band is observed at 655 cm−1. The 1,395 cm−1 band has been attributed to the asymmetric stretching of CO3 in silver carbonate (Ag2CO3) and the band at 655 cm−1 to its rocking mode (Gatehouse et al., 1958; Slager et al., 1972). We also observed a band at 883 cm−1, heavily blended with other nearby OSiO bands, which could correspond to the CO3 out-of-plane deformation mode (Slager et al., 1972). To get further confidence into this assignment, we have measured with ESPOIRS the spectrum of bulk silver carbonate. It shows a good correspondence within ~30 cm−1 for the main band at 1,395 cm−1 and its shoulder (see Bérard, 2019). The band at 655 cm−1 is less concordant with the spectrum of bulk Ag2CO3 but the agreement improves when compared to the spectrum of Ag2CO3 thin film (Slager et al., 1972), with the latter being more relevant to our study.
The band at 2,144 cm−1 (Figure 2C) observed in the Ag-free sample (P0) spectrum and attributed to Si-H stretching mode is modified in the presence of Ag. In the spectrum of the Ag-containing sample (P1), the band shape has changed with a maximum of the band at 2,153 cm−1. The position and shape of the SiH band are found to depend on the chemical environment of the grain (Moore et al., 1991) and also on the gas-phase environment through gas-grain interactions (Accolla et al., 2021). The observed variations could therefore be attributed to this effect. However, we found that another scenario might be more attractive. Indeed, experiments on CO adsorption on water ices show the presence of a specific band at 2,152–2,153 cm−1 in the case of CO adsorption in pores compared to a band at 2,139 cm−1 for surface adsorption sites (Fraser et al., 2004; Taj et al., 2017, 2019). The relatively sharp band that we observed at 2,153 cm−1 might well be due to CO entrapped in the porous dust (cf. section 3.1).
Another new band, which cannot be attributed to carbonate nor to adsorbed CO is observed at 965 cm−1 (Figure 2E), blended with the bands of the asymmetric stretching mode of Si-O-Si band and the Si-CHx(x ≤ 2)-Si wagging mode at around 1,020 cm−1. The assignment of this band is debated in the literature. It has been reported in several studies and attributed either to Si-OH or Si-O-Ag bond. A band at this position is observed in metal-free samples in which it is attributed to SiOH (Racles et al., 2013). On the other hand the infrared spectrum of amorphous AgSiO measured by Cao et al. (2017) shows a broad band at 987 cm−1, also observed in Ag6Si2O7 (Qin et al., 2019), close to the band observed in the spectrum of sample P1. The band at ~ 450 cm−1 present in the sample containing silver is due to Si-O-Si rocking vibrations (Kirk, 1988; Innocenzi et al., 2003). This band cannot be specifically attributed to Ag-containing samples since it is in general also present in the organosilicon phase, although weak (Makasheva et al., 2016). This band is not seen here in the P0 sample, which can be explained by its intensity dependence on the plasma conditions and on the oxygen content (Makasheva et al., 2016; Bérard, 2019).
Comparison of the two spectra shows that the massif corresponding to the methyl stretching modes around 2,960 cm−1 is modified by the addition of silver in the experiment. Some new bands appear at shorter wavenumbers in the spectrum of sample P1 and the band ratios change (Figure 2B). The band at 2,925 cm−1 (symmetric stretching) becomes more intense than the band at 2,960 cm−1 (asymmetric stretching) in sample P1. At the same time the CH2 band at 2,876 cm−1 is much stronger relative to the others in sample P1. These changes could point to the presence of additional carbonaceous components in the silver-containing sample. The spectral region 1,500–1,800 cm−1 shows many weak and blended bands in both samples (Figure 2D). However, two weak bands at 1,530 and 1,586 cm−1 are clearly observed in sample P1 but not in sample P0, or much weaker. Although it is difficult to identify confidently these bands, their presence in sample P1 is compatible with an additional carbonaceous component.
The evolution with temperature of the spectrum of silver-containing dust is presented in Figure 3 in the 500–1,500 cm−1 range. Below 600 cm−1, the transmission of the ZnSe windows of the environmental cell was found to be degraded and data at frequency lower than 500 cm−1 are therefore not shown. At 200°C, the main band of Ag2CO3 has disappeared which is consistent with the thermal decomposition of Ag2CO3 (Koga et al., 2013). Similarly, the sharper component at 2,153 cm−1 (Figure 3B) is not seen at 200°C, which supports the idea that this band is associated to CO entrapped inside the cavities present in the dust sample. The broad massif around 1,000 cm−1 strongly evolves with the temperature increase (Figures 3C,D). The contribution to this band of the Si-C-Si stretching vibration at 1,020 cm−1 becomes dominant compared to the Si-O-Si asymmetric stretching vibration at 1,030 cm−1 for 200°C, thus placing the peak of this massif at lower energy compared to room temperature. After 2 h at 200°C, the massif exhibits three components and its integrated intensity has increased indicating that the Si-O-Si network rearranges itself. This evolution continues with the temperature increase up to 500°C at which the spectrum exhibits features closer to those of silica but with strong mixing between the Si-O-Si and Si-C-Si vibrations, resulting in a peak at 1,000 cm−1 and a well-defined band due to the symmetric Si-O-Si stretching vibration at 810 cm−1 (Kirk, 1988; Innocenzi et al., 2003; Li et al., 2020). Besides, the Si-O-Ag shoulder at 965 cm−1 becomes an integral contribution to the massif. This spectral evolution is most likely due to a further rearrangement of the dust network and to an intensive hydrogen out-diffusion, with the latter expected to start at temperatures higher than 350°C (Wang et al., 1987). The loss of the SiH band at 2,144 cm−1 while heating to 500°C (Figure 3B) supports the strong decrease in hydrogen concentration, which is expected to lead to the creation of new bonds in the network, such as Si-O, Si-C, Ag-Si, Ag-C, C=C, and Si-Si, in order to satisfy the valence bonding of each atom. The creation of new bonds together with the rearrangement of the dust network can account for the increase of the intensity of the spectral massif at ~1,000 cm−1 from 200°C to 500°C. Indications of remaining carbon bonds in the sample at 500°C are given by the still broad massif peaking at 1,000 cm−1 and the band of SiCH3 at 1,260 cm−1. The remaining signal at ~2,950 cm−1 (Figure 3A) is likely to be dominated by the latter bonds. Other CH aliphatic components associated with volatile hydrocarbons have disappeared during the thermal processing.
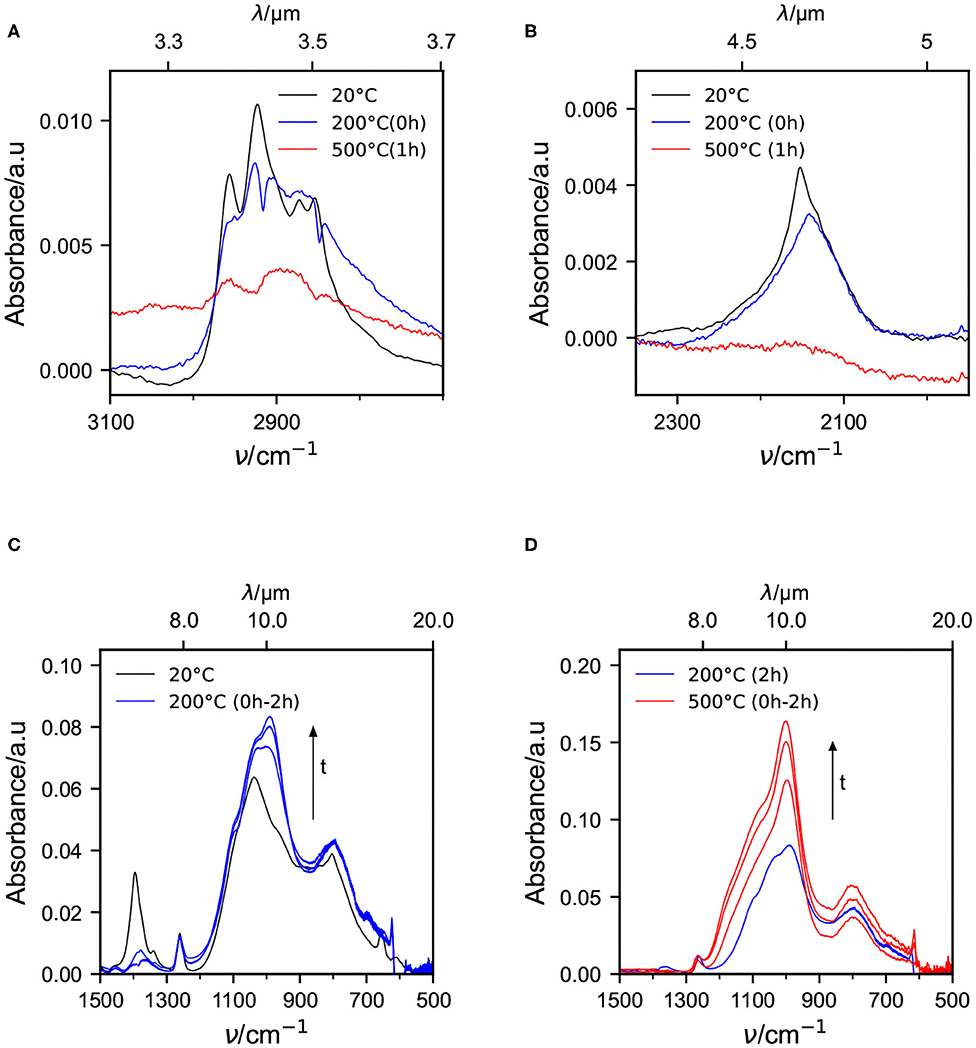
Figure 3. Evolution of the most interesting bands presented in Figure 2 with time at 200 and 500°C. For each temperature the presented spectra are recorded at t = 0, 1, 2 h. The spectrum at 20°C is also plotted for comparison.
3.3. Molecular Composition
Whereas the IR spectra provide global information on the dust composition, the AROMA analysis brings very sensitive information on the molecular content. Figure 4 displays the mass spectra for samples P1, P2 and LA1 (see Table 1), which have been recorded with the AROMA setup in the range m/z = 20–400. All samples show numerous mass peaks with major peaks corresponding to the cations of Ag, Ag2 and Ag3. In addition, a large variety of peaks are attributed to hydrocarbon species together with a number of mixed silver-carbon species. The attribution of the latter, even if some peaks have low intensity, is favored by the presence of the typical isotope pattern of silver and silver aggregates. The major detected molecular species are listed in Table 2. The observed species point to the interaction of C2H2 with silver as discussed in section 4.1. Larger hydrocarbons complexed with silver are also observed and are divided into two categories as a function of their (low vs. high) hydrogenation state. Other species observed in the plasma experiments only are also listed in Table 2. In particular, some peaks are attributed to Si-bearing compounds, such as SiOH or SiOCH5, which are related to the decomposition of the HMDSO precursor. Few silver-silicon mixed species, such as Ag3Si and AgSiO can be identified.
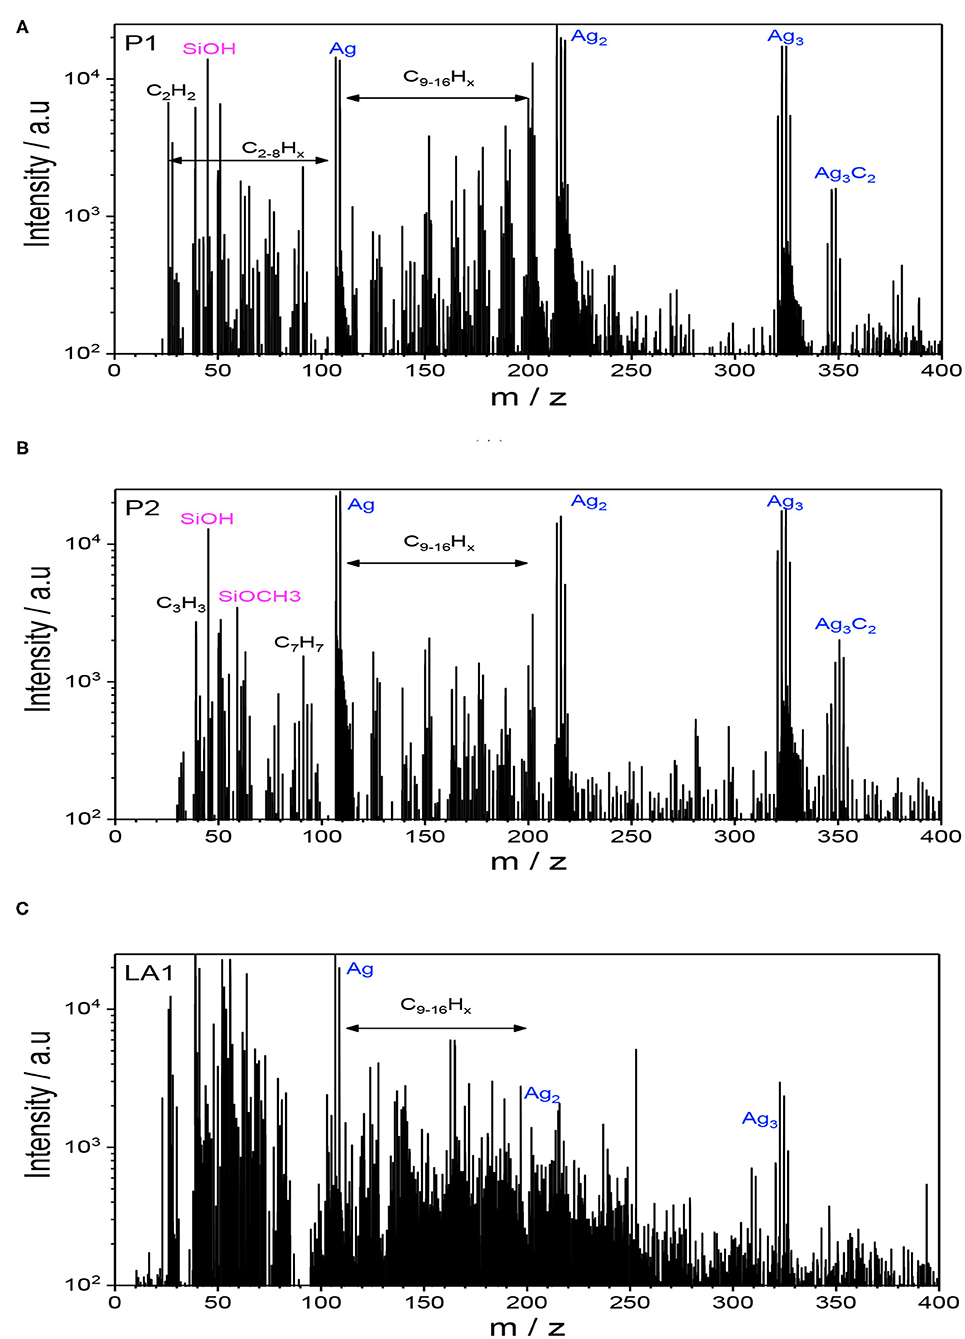
Figure 4. Mass spectra obtained with the AROMA setup for samples P1 (A), P2 (B), and LA1 (C) compiled in Table 1.
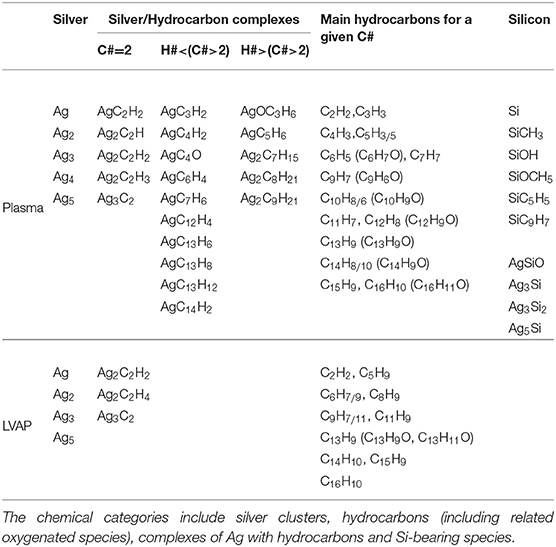
Table 2. Census of the main ions (charge is omitted for clarity) detected in the molecular analysis of the plasma and LVAP samples (Table 1) using AROMA.
The large amount of different hydrocarbons species is further analyzed. We note that none of these species could be detected for the plasma samples produced without Ag (such as P0), although organosilicon dust was clearly formed. A number of aromatic species are present, up to typically the size of pyrene or its isomers (C16H10) at m/z = 202.08. AROMA is very sensitive to detect these species. Therefore, their detection in the plasma samples containing silver, points to a role of this metal in their formation. Aromatic compounds are also clearly detected in the LVAP samples with a number of species in common with the plasma experiments like the strong C13 peak. A noticeable difference though is the non-detection of C7 in LVAP samples, which points to some differences in the chemistry as discussed in section 4.2. Some oxygenated hydrocarbons are also identified, a large fraction of these corresponding to oxidized aromatic molecules (see Table 2).
In order to further analyze the families of carbonaceous molecules, we used a double bond equivalent (DBE) analysis as described in Sabbah et al. (2021). For a compound of molecular formula (CcHhNnOoSs) the DBE is defined by:
Figure 5 shows the DBE/C# values as a function of the carbon number (C#) for all the detected carbonaceous molecules. We do not consider in the analysis the carbon species that are complexed with Ag. The values fall mainly in the range 0.5 ≤ DBE/C# ≤ 0.9, which corresponds to planar aromatic species. The species at DBE/C# > 0.9 are called hydrogenated carbon (HC) clusters. This family can include cumulenes, polyynes or non-planar aromatic structures (Hsu et al., 2011; Lobodin et al., 2012). The limit at DBE/C# = 1 corresponds to carbon clusters. A few of them were observed in the LVAP experiments (Figure 5). Finally species with DBE/C# < 0.5 correspond mainly to aliphatic hydrocarbons with C# ≤ 6. AROMA is not optimized to detect aliphatic hydrocarbons which have large ionization potentials (see section 2.4). Complexation with Ag/Ag+ can however favor their detection (Grace et al., 2005). A few species have been evidenced consisting of Ag2 complexes with alkanes (see Table 2 and discussion in section 4.2).
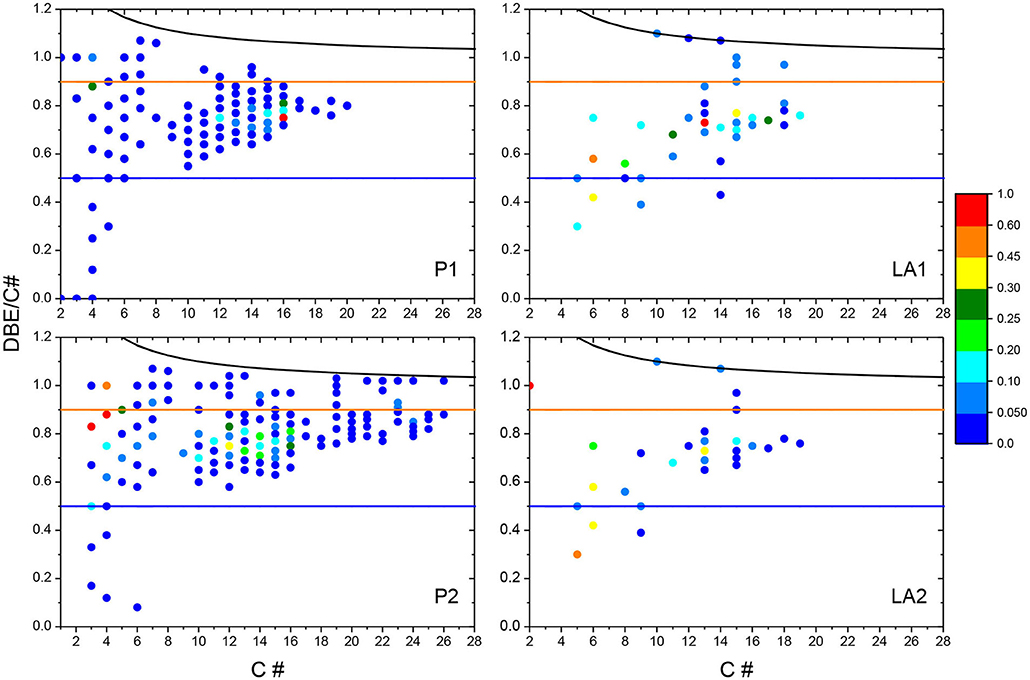
Figure 5. Plot of DBE/C# (see Equation 1) as a function of the carbon number (C#) for the hydrocarbons and a few carbon clusters, which have been identified with AROMA on samples P1, P2, LA1, and LA2. The corresponding mass spectra for the three first samples are shown in Figure 4. The colored scale refers to the normalized intensity on the most intense peaks in the spectra. Below DBE/C# = 0.5 the species are considered as aliphatic and above as containing aromatic cycles (Koch and Dittmar, 2006). They remain planar below DBE/C# = 0.9 (Hsu et al., 2011). Above this value, they are classified as HC clusters. The upper black line corresponds to pure carbon clusters.
Figure 6 compiles information on the relative contribution in summed ion intensities of Ag-bearing species and hydrocarbons for the different studied samples. One can see that the fraction of Ag-bearing species changes in the different plasma samples from a value of about 70 to 40%, whereas it is similar (~45%) in the two LVAP samples. On the other hand, the relative summed ion intensities of aromatic relative to aliphatic species changes significantly from a value of ~7 in samples P3 and LA1 to ~2 in samples P1, P2, and ~1 in sample LA2. One expects a larger amount of Ag in the gas phase for higher total absorbed power in plasmas or for a higher laser fluence in LVAP experiment. However, we could not find a simple relation between the energetic conditions and the amount of Ag-bearing species seen by AROMA. More energetic conditions are also expected to favor aromatic with respect to the more fragile aliphatic species. Although it might be the case in the LVAP experiments, a simple relation was not found in the plasma experiments. All this points to a complex competition between chemical networks.
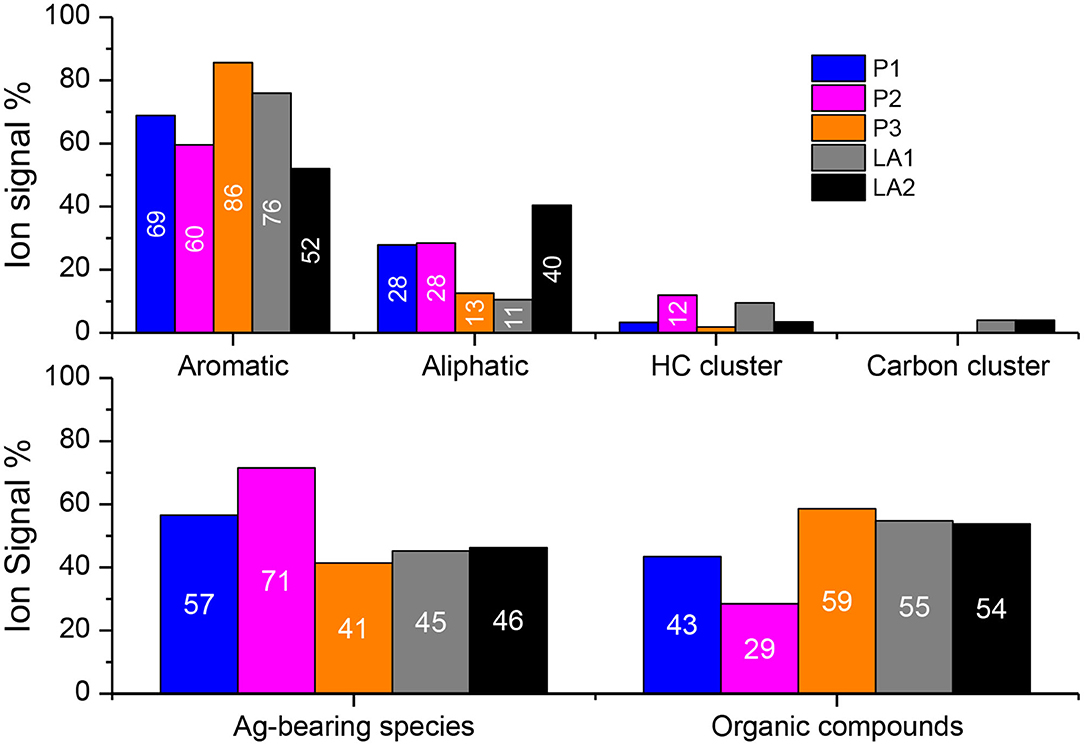
Figure 6. Molecular family analysis of the different samples, P1, P2, P3, LA1, LA2 (see Table 1) analyzed with AROMA. The bottom diagram shows the fraction of summed ion intensities of Ag-bearing compounds relative to organic compounds. The top diagram separates the organic compounds (CxHyO0,1 species) into the families defined in Figure 5 and section 3.3.
3.4. Energetics and Mechanisms With DFT Calculations
In order to rationalize experimental results, structures and energetic data were computed for the smallest observed species, i.e., AgnC2 (n = 1–3, m = 0–2). Energetic data include ionization potentials (IPs), adiabatic and vertical, bond dissociation energies (BDEs) and ΔH(0K) for association reactions. They are reported in Table 3. The structures of neutral complexes of interest and their cationic counterparts are reported in Figure 7. The determination of these structures has been inspired by DFT calculations previously published in the literature. For AgnC2Hm neutral clusters, starting point geometries were determined using the results by Xu et al. (2013), who focused on AgnC2H0/− (n = 1–4) complexes, invoking their interest in terms of catalytic properties. Regarding Agn complexes, our work was based on the results obtained by Cohen et al. (2011) showing the peculiar stability of M-π-(M2C2)+ clusters with M = Ag,Au through DFT calculations run in conjunction with high-energy collision experiments. Interestingly, we found here that the most stable structures for AgnC2H+ (n = 2, 3) differ from those of their neutral counterparts, leading to important differences between the adiabatic and diabatic (vertical) IPs (8.41 against 5.55 eV for n = 2). Indeed, in the structures of AgnC2H+ (n = 2, 3), one Ag atom forms a covalent bond with a C atom while the rest of the metallic cluster (Ag or Ag2) has a π interaction with the AgC2H+ moiety. This generalizes the statement by Cohen et al. (2011) to M-π-(MC2H+) clusters.
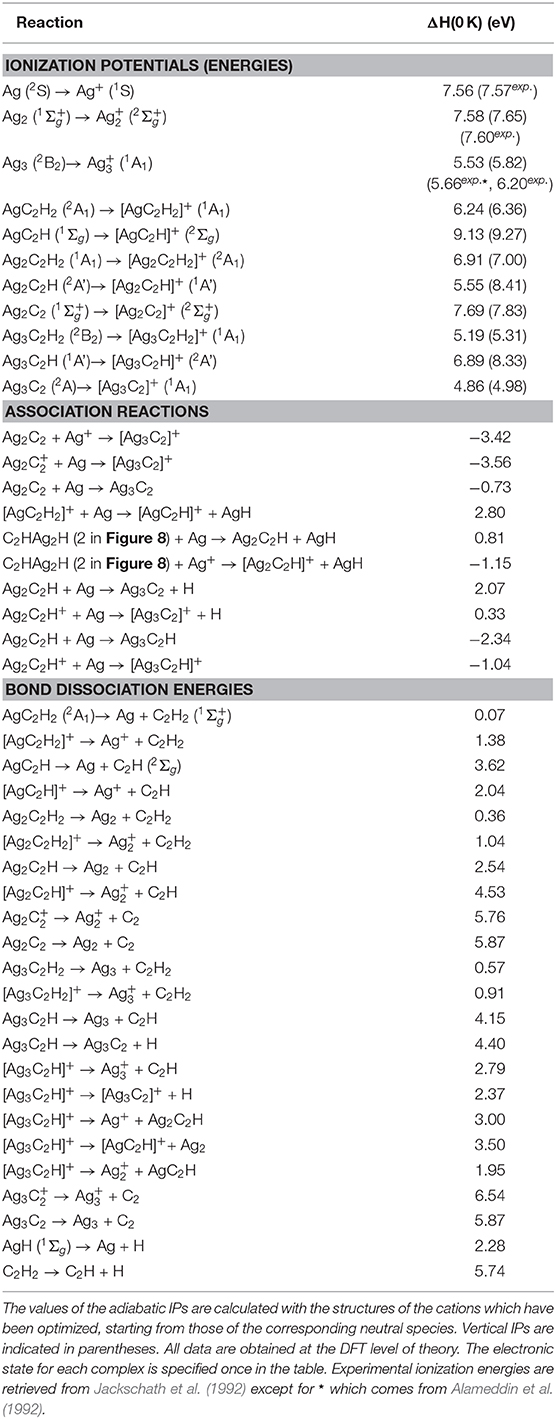
Table 3. Thermodynamic data of interest, including BDEs and IPs.
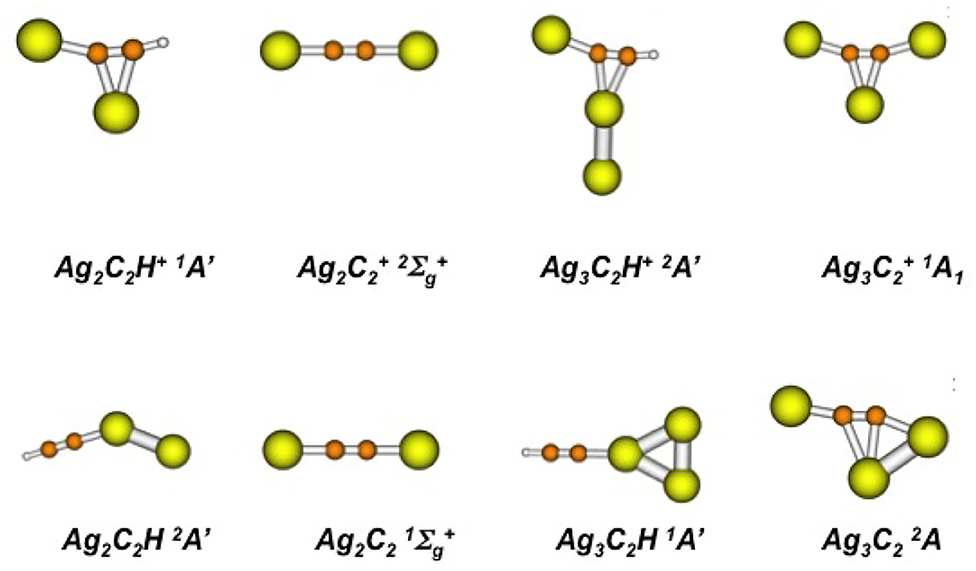
Figure 7. Lowest energy structures and electronic states for [Ag2,3C2]0/+ and [Ag2,3C2H]0/+ calculated using DFT.
Unless specified, the IP values discussed hereafter are the adiabatic IPs. As can be seen in Table 3, the IPs of Agn species (n = 1–3) are found between 5.5 and 7.6 eV. They are quite similar for n = 1, 2, and lower for n = 3. The values are found in excellent agreement with published experimental values of ionization energies (IEs) for n = 1 and 2, and slightly too low for n = 3 (see Table 3). For n = 4 and 5, experimental IEs were measured at 6.65 eV (Jackschath et al., 1992) and 6.35 (Jackschath et al., 1992) /5.75 eV (Alameddin et al., 1992), respectively. Several theoretical studies have been dedicated to the geometric and electronic structures of Ag clusters (Walch et al., 1986; Sioutis et al., 2007; McKee and Samokhvalov, 2017; Tsuneda, 2019) with the first ab initio studies on Ag2 and Ag3 in 1986 (Walch et al., 1986), the latter undergoing Jahn-Teller effect (Sioutis et al., 2007). Before studying AgnC2Hm clusters, we checked our level of theory on Ag clusters based on these previous studies.
The ground states geometric and electronic structures of small neutral and charged organometallic complexes AgxCmHn were investigated using the approach detailed in section 2.5. The structures and energetics of similar complexes were previously investigated with various DFT functionals and basis sets mostly in synergy with experimental studies (Tian and Tang, 2005; Cohen et al., 2011; Xu et al., 2013; Yang et al., 2019). The IPs of AgnC2Hm (n = 1–3, m = 0–2) were found to lie between 4.9 and 9.1 eV. For AgnC2H2 (n = 1–3), the IPs were determined to be lower than those of the corresponding pure Agn clusters by −1.32, −0.67, and −0.34 eV for n = 1–3, respectively. For AgnC2H, the trend is reverse for n = 1, 3 as the complexation to C2H leads to an increase of the IP by +1.57 and +1.36 eV, respectively, with respect to Ag and Ag3. Interestingly, the trend is the reverse regarding the adiabatic IP of Ag2C2H, which was found −2.03 eV below that of Ag2. The IPs of Ag2C2 and Ag3C2 were found, respectively higher (+0.11 eV) and lower (−0.67 eV) than those of the corresponding pure Ag clusters. The IP of Ag3C2 is the lowest among all computed IPs. It is −2.8 eV lower than that of Ag2C2, in particular. This is related to the peculiar stability of Ag3C2 (Cohen et al., 2011).
The metal-ligand bond strengths for [AgnC2Hm]0, + (n = 1–3, m = 1, 2) were estimated computing adiabatic BDEs. Neutral AgnC2H2 π complexes were found to be weakly bound, with BDEs of 0.07, 0.36, and 0.57 eV for n = 1–3, respectively. Larger values of 1.38, 1.04, and 0.91 eV were obtained for their cationic counterparts for n = 1–3, respectively. After losing one H atom, the metal-ligand bond in Agn-C2H species, which presents a covalent character, is stronger compared to the bond in AgnC2H2 complexes. BDEs of 3.62, 2.54, and 4.15 eV were obtained for n = 1–3, respectively. The lower value for the even n value can be accounted for by the difference between the open/closed shell characters of Agn (closed shell for n = 2, open shell for n = 1, 3) and AgnC2H (open shell for n = 2, closed shell for n = 1, 3), the closed shell character leading to increased stability. For [Agn-C2H]+, BDEs of 2.04, 4.53, and 2.79 eV were obtained for n = 1–3, respectively. The higher value found for n = 2 can be explained by the closed shell character of [Agn-C2H]+. The structure of Ag2C2 differs from that of Ag2C2H as it resembles an acetylene molecule where two hydrogen atoms have been substituted by two Ag atoms, the two Ag atoms are therefore not bounded. The Ag-C BDE within this complex has been estimated to be 3.75 eV.
Regarding the modeling of reactivity, we focused on dehydrogenation reactions starting from the Ag2C2H2 complex, that would lead to a reactive C2H or C2 site for further carbon growth chemistry (see section 4.2). As we will see in the discussion section, complexity drastically increases when increasing the size of the system. Some possible reactive intermediates and transitions states involved in the dehydrogenation of the Ag2C2H2 complex are reported in Figure 8. The loss of H to form the potentially reactive intermediate Ag2C2H is limited by the thermodynamics: it is endothermic by 3.19 (DFT)/3.18 [CCSD(T)] eV with respect to the ground state of the reactants Ag2 + C2H2, while the H migration from acetylene to Ag2 within the complex only costs 1.90 (DFT)/1.76 [CCSD(T)] eV with respect to Ag2 + C2H2. More favorable pathways involve H abstraction mechanisms. If Ag is involved then the intermediate 2 in Figure 8 can exchange an H atom with Ag to form Ag2C2H and AgH, this reaction being estimated endothermic by 0.81 eV (see Table 3), the rate limiting step becoming 1→2. If instead Ag+ is involved, then the formation of the intermediate involves charge transfer and becomes exothermic by 1.15 eV (see Table 3).
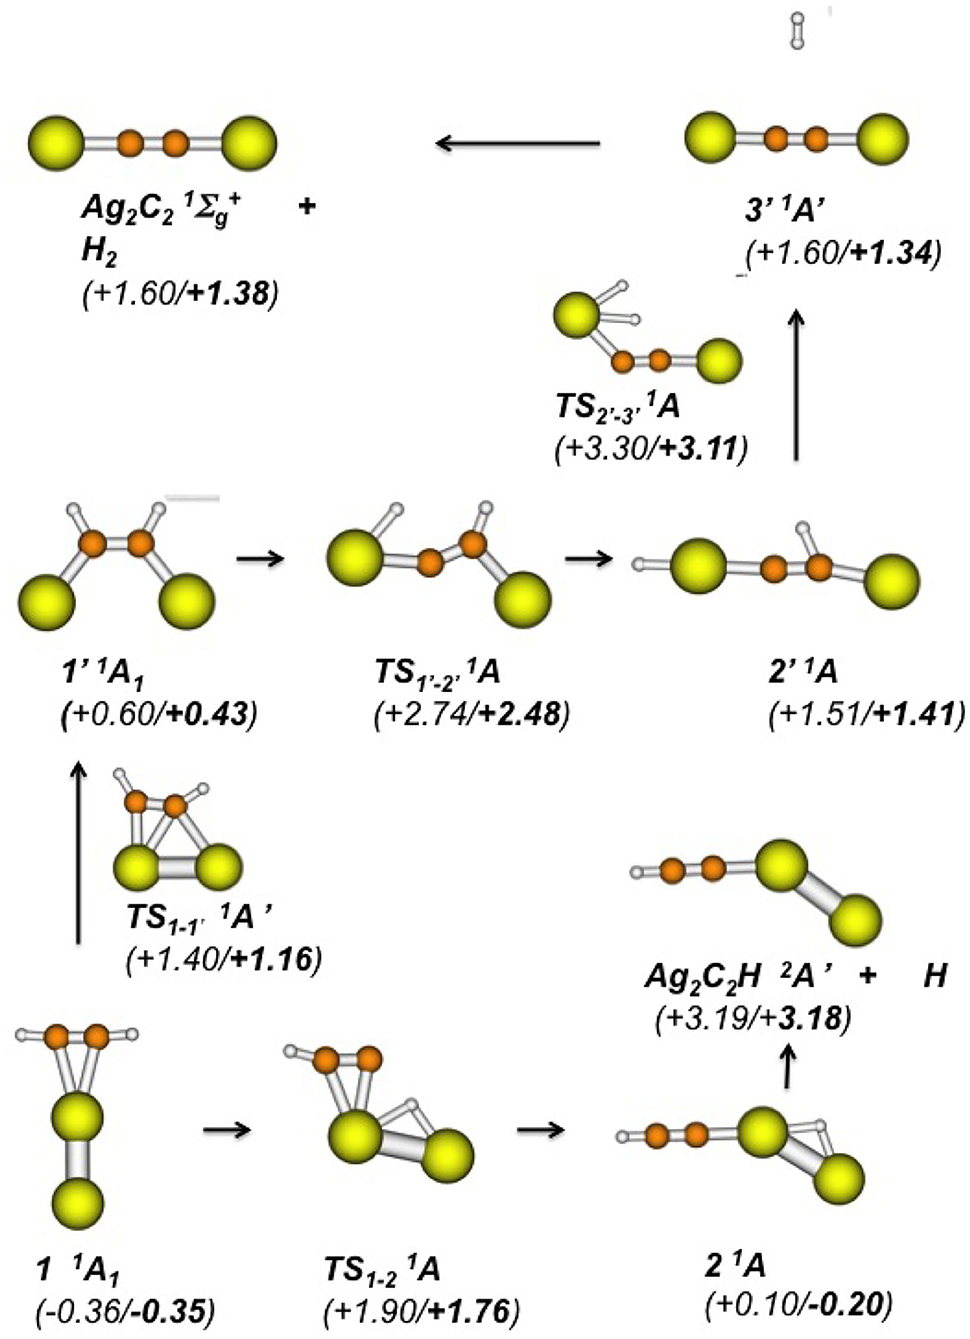
Figure 8. Calculated possible intermediates and transition states leading to the loss of H (bottom) and H2 (top) from Ag2C2H2 (structure 1; Ag atoms are yellow). The electronic states are reported, and the DFT relative enthalpies at 0 K with respect to Ag2 + C2H2 in their ground electronic states are reported in eV in parentheses, along with CCSD(T) single point values in bold characters. For , no IRC path could be computed due to convergence problem.
The mechanism for the loss of H2 is expected to be distinct from that of the loss of H, as in the structures of the final products, the atoms have different adjacencies. In the case of Ag2C2H, the identity of the silver dimer is preserved while silver is under the form of two atoms in Ag2C2, with a structure similar to that of acetylene, as specified hereabove. Therefore, we considered a mechanism starting from 1′ in Figure 8, with a structure analogous to that of ethylene, located at 0.60 (DFT)/0.43 [CCSD(T)] eV above the reference corresponding to the separated neutral reactants Ag2 + C2H2. A transition state TS connecting the two minima was computed but its relevance remains uncertain. The path leading to Ag2C2 involves the insertion of an Ag atom into a C-H bond via TS (+2.74 (DFT)/+2.48 [CCSD(T)] eV above the reference Ag2 + C2H2). Then the second H atom remaining bonded to a C atom migrates onto the Ag atom already carrying the first H atoms to form the 3′ complex where the H2 molecule presents quasi no interaction with the Ag2C2 moiety. Finally, starting from 1′, the H2 loss reaction is endothermic by ~ 1 eV, the rate limiting step being the last elementary step 2′ → 3′.
4. Discussion
4.1. Agn-C2Hm Chemistry
The precursors used in the experiments is HMDSO in the plasma and acetylene in LVAP, respectively. The HMDSO molecule quickly loses a methyl group after injection in the plasma. Further fragmentation of the precursor in the plasma gas-phase leads to the formation of methane and acetylene, among others (Despax et al., 2016). It is therefore not surprising that a number of AgnC2 (n = 1–3, m = 0–2) species are common for both experiments (see Table 2). The DFT calculations contribute to shed light on the specific clusters and molecules that were detected with AROMA. Noticeable species are AgC2, Ag2C2, Ag2C2H+, and Ag3. One should keep in mind that due to the LDI scheme used in AROMA, species with the lowest IPs are expected to be best detected. The much lower IP of Ag3C2 compared to that of Ag2C2 can explain the presence/absence of Ag3C2+/Ag2C2+ in the mass spectra. Ag2C2 might be an important intermediate in the chemistry though if one considers the thermodynamically favorable formation of Ag3 by association of Ag+ with Ag2C2. Similarly, the adiabatic IP of Ag2C2H is low (5.55 eV) and we observed Ag2C2H+. On the other hand, we could not observe AgC2H+, which can be related to the higher IP of its neutral counterpart (9.13 eV). This scenario is supported by the detection of AgC2H by rotational spectroscopy by Cabezas et al. (2012) after production in a laser ablation source. There is however one noticeable species for which the argument on the IP fails; Ag3C2 is not detected in the mass spectra despite Ag3C2H2 has a low IP comparable to that of Ag3C2.
This suggests that dehydrogenation has already proceeded from the Ag2C2 complexes. We note that the mechanisms proposed in Figure 8 were computed for neutral complexes. They are expected to be more energetically favorable for Ag2C2 complexes as larger metal-ligand binding energies come into play (see Table 3). Hydrogen abstraction mechanisms involving Ag atoms/ions are expected to be the most energetically favored pathways. Once formed, the Ag2C2H0/+ and Ag2 complexes are expected to be quite resistant even in the energetic conditions of the experiments since their fragmentation involves BDEs of at least 2 eV. Then larger Agn complexes starting from Ag3 can be formed from further Ag0/+ addition. We therefore suggest that Ag2C2H0/+ and Ag2 complexes are nucleation seeds for Agn cluster growth.
4.2. Catalytic Role of Ag on Hydrocarbon Molecular Growth in the Gas-Phase
Large hydrocarbons are not present at the beginning of the experiments; in the plasma, methyl groups are abundantly produced from the decomposition of the HMDSO precursor and contribute to form methane and acetylene. Acetylene is injected in LVAP experiments. The AROMA analysis shows that hydrocarbon growth occurs at least up to C# = 16 in all experiments (cf. Table 2). The DBE/C# diagrams (Figure 5) show a trend for a periodicity of 2 carbon addition in the LVAP experiments, which is coherent with a growth mechanism based on acetylene. In the plasma, growth also proceeds by single carbon addition, which is expected from the addition of methyl groups. There are several reasons why we think that Ag can play a role in hydrocarbon growth. First, the analysis of plasma samples produced in the absence of silver did not provide evidence for the presence of hydrocarbons, in particular aromatic species for which the AROMA analysis is very sensitive (Sabbah et al., 2017). Second, we detected a number of molecular species that are complexes of hydrocarbons with silver (cf. Table 2). Third, we observed additional bands in the IR spectrum of the Ag-containing sample compared to the Ag-free sample in the 2,800–3,000 cm−1 (–CH3, –CH2) and 1,500–1,800 cm−1 (C=C) spectral regions, which indicates the presence of an additional volatile hydrocarbon population in the Ag-containing sample (cf. section 3.2). In particular, the CH2 band at 2,876 cm−1, which is much more intense in the presence of silver, suggests the presence of long aliphatic species in the Ag-containing sample. It is important to remind that AROMA provides a biased view of the composition in aliphatic compounds (cf. section 2.4). Although we cannot exclude a contribution of the chemistry on dust surface to the formation of hydrocarbons, we provide below arguments supporting a scenario in which Ag atoms/ions and clusters would promote the growth in the gas-phase of hydrocarbons in general and aromatic ones in particular.
A bottleneck in the gas-phase formation of aromatics is the formation of the first aromatic ring. Santoro et al. (2020) recently carried out experiments on the reactivity of C, C2, and C2H2 in the Stardust machine (Mart́ınez et al., 2020). They concluded that the most likely pathway for benzene formation in these conditions is given by neutral-neutral reactions involving mainly the addition of C2H2 to C4H3 in agreement with reactions derived from dusty plasma (De Bleecker et al., 2006). Our AROMA analysis reveals indeed the presence of C4H3 and C6H5. In this chemistry, C4H3 needs a termolecular association reaction to be formed:
with M being the third body, which is necessary to stabilize the reaction complex. Interestingly, in our case, the reaction could be promoted by complexes of silver with C2H, in particular Ag2C2H, which we have proposed as a seed.
Several isomers for C4H3 are possible, and the most stable cation form differs from the neutral one (see Kaiser et al., 2010, and references therein). For the neutral, a cycle is not the most stable isomer: a linear form (and more precisely i-C4H3) is the most stable one. A mechanism we may invoke for carbon growth is a radical mechanism on a metallic center, as illustrated in Figure 9A, with Ag2C2H the initial promotor. The next C2H2 addition would lead to the formation of Ag2C6H5. The cyclization of C6H5 might be accompanied by a weakening of the Ag2 bonding to the complex facilitating the separation of C6H5 from Ag2 in the gas-phase. Further chemistry will then proceed leading to the formation of larger aromatic compounds via C2H2 and CH3 (for the plasma) addition to the first aromatic ring. The role of metal ions and small clusters in the cyclization of unsaturated hydrocarbons has been previously demonstrated (Schnabel et al., 1991; Wesendrup and Schwarz, 1997; Chrétien and Salahub, 2003; Marks et al., 2019). We suggest here that Ag2 would act as a catalyst for the formation of the first aromatic ring.
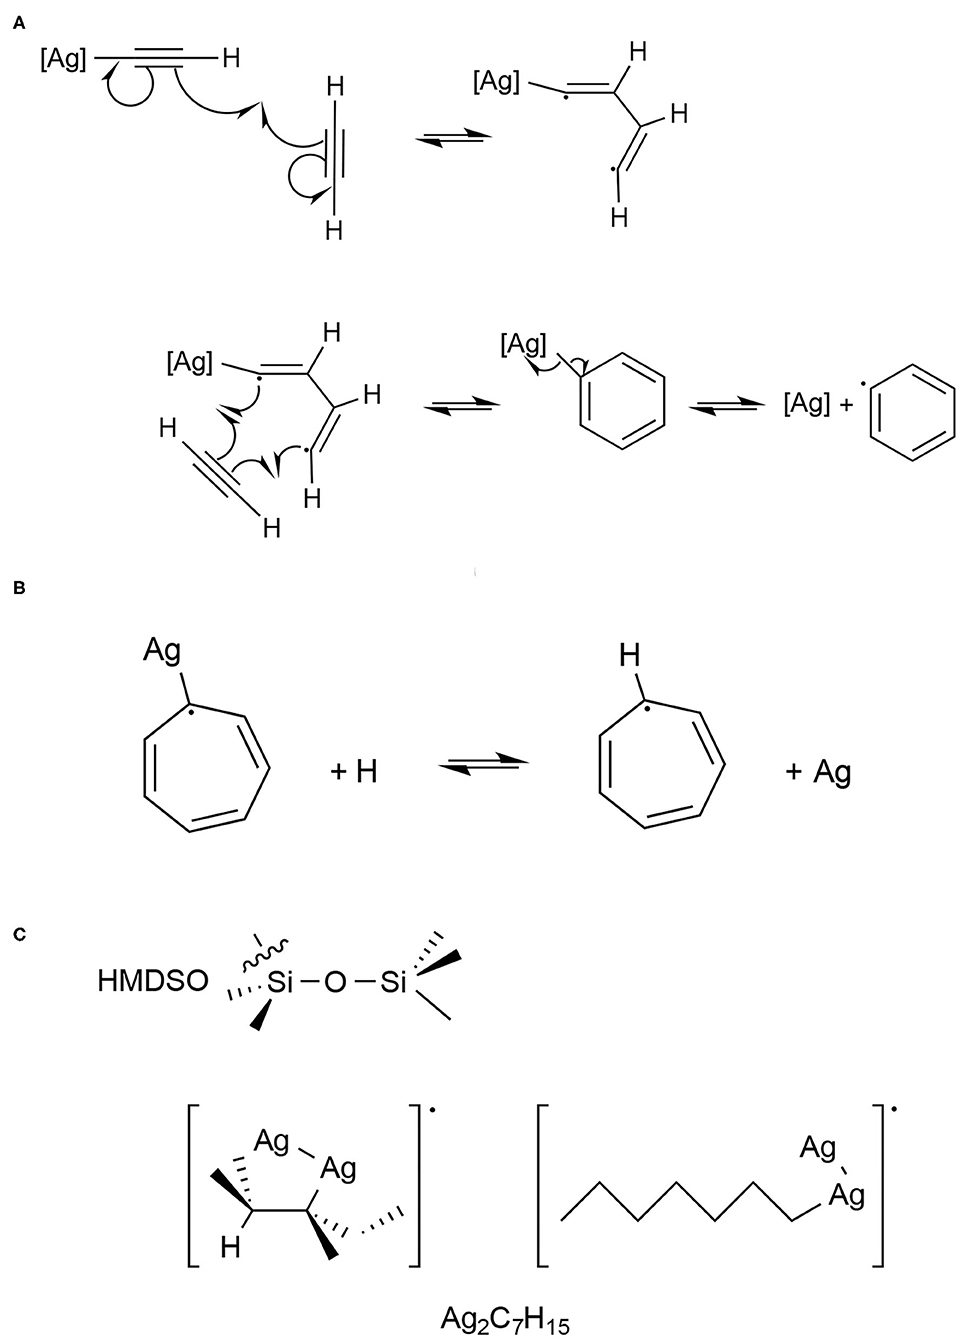
Figure 9. (A) Possible initial steps of the radical mechanism for C-C coupling on a metallic cluster [Ag] with formation of the first aromatic ring [C6H5]•; (B) Substitution of Ag by H to form [C7H7]• (C) Examples of possible isomers for [Ag2-C7H15]•. In (A–C) only the H atoms of interest are represented. Let us specify that neutral species are shown here, whereas cationic species are detected by AROMA.
Another interesting property of silver is the propensity of an Ag atom to substitute to an H atom. This is illustrated in Figure 9B for the case of AgC7H6 and C7H7, whose cation is the well-known stable tropylium species. The same occurs for the key species C4H3 and C6H5 discussed above, with AgC4H2 and AgC6H4 being identified as main ions in Table 2. Another noticeable case is AgC13H8 / C13H9. The substitution of Ag was also key in revealing the presence of more hydrogenated species, which would form in the plasma experiments but cannot be detected with the AROMA LDI scheme. For instance, at the bottom of Figure 9C, two possible stable isomers are reported for Ag2-C7H15. In such complexes, it appears unlikely that the carbon structure is cyclic, presenting any aromatic character and Ag2 can be regarded as a substituent of H in heptane C7H16. Interestingly, such organometallic complexes are formed on the Ag2 organometallic centers and not Ag. The formation of these species likely results from C-C coupling, coupled to H abstraction/H migration, starting from the methyl groups released in the plasma by decomposition of HMDSO.
4.3. Chemical Conditions for Dust Formation
The formation of dust in the plasma arises from the variety of species produced after fragmentation of the precursor and their further evolution by chemistry. Plasma induced fragmentation of HMDSO provides a very large number of chemical radicals. The main neutral reactive species detected by in situ mass spectrometry are H, H2, C2H2, CH4, CO, CO2, and Si2O(CH3)5, with the latter being characteristic of the injected amount of HMDSO (Despax et al., 2016). In addition to the small molecules, one can observe larger mass species, even compounds issued from oligomerization of the parent monomer, and a very rich variety of ions. The formation of dust in HMDSO-containing plasmas is considered to be based on a negative ion formation scheme, initiated manly by the acetylene-related anions C2H− and complemented during the dust growth by large C- and Si-bearing species; among others those observed in the plasma are Si(CH3)3, SiH(CH3)2, Si2OCH2(CH3)3, Si2O(CH3)5. In this scheme, the nucleation of dust is limited by the formation and survival of C2H−, which is formed by electron impact on C2H2 and reacts quickly with H to reform C2H2. The dust growth on the other hand depends on the availability of HMDSO fragments. The composition of available fragments depends on the plasma conditions and the quantity of injected HMDSO. For a small amount of injected HMDSO, which is the case for the experiments with silver, the energy of the electrons increases (Bérard et al., submitted). It is thus expected to lead to a higher fragmentation of the HMDSO, i.e., to the production of smaller fragments. In particular AROMA evidences the presence of Si and SiO, which shows that the fragmentation can proceed to the atomic and diatomic levels, opening new chemical pathways for dust formation and growth, different from that based on the large fragments of HMDSO. An implication of this chemical complexity is also that the formed dust can be very heterogeneous and with various components located at different scales.
4.4. Ag Incorporation in Dust
The main contribution of silver in dust consists in crystalline nanoparticles of diameter ~ 15 nm (Bérard et al., submitted) that decorate the organosilicon dust particles as shown on the SEM image (Figure 1). This shows that a large fraction of the Ag-containing dust is segregated from the organosilicon dust. As discussed in section 4.1, the formation of silver nanoparticles could be initiated by the formation of Ag3C2H or Ag3C2 complexes that could constitute nucleation seeds for their growth. On the other hand, there is evidence that silver is also involved in bonds with other elements and it is therefore also part of other dust components. We have also identified in the infrared spectrum a silver carbonate component. There is also evidence of silver interaction with SiO, through the ~965 cm−1 band, which we assign to AgSiO (Figure 2). This result is strengthened by the observation of molecular AgSiO in the AROMA setup (Table 2). If these species result from dust fragmentation upon laser impact, then it implies, considering the low laser fluences used in AROMA, that AgSiO is part of a highly disordered network. Rearrangement upon annealing and the formation of silica and Ag-silicate structures with increased temperature is therefore expected. At 200°C, one can note that the massif at ~1,000 cm−1 is progressively dominated by the SiOSi band at 990 cm−1 (Figure 3C). At 500°C, this massif narrows showing that the organosilicon dust evolves toward silica (SiO2), even though the structure remains amorphous and with a Si-C rich component (shoulder at ~1,100 cm−1 in Figure 3D), both characteristics leading to an increased bandwidth relative to that of crystalline silica. The SiO network rearranges itself and becomes more polymerized. The evolution of the AgSiO phase is more difficult to trace as the 965 cm−1 band is blended with the SiOSi band which increases with temperature from 200 to 500°C. Although additional experiments would be necessary to conclude on this point, it is likely that the AgSiO component is located at the junction between the silver nanoparticles and the amorphous organosilicon component.
5. Conclusion and Astrophysical Implications
The formation of dust in the circumstellar environments of evolved stars is a complicated problem which involves different gas and dust phases in varying physical and chemical conditions (Gail and Sedlmayr, 2014). There are several aspects that limit the description of dust formation in models. One concerns the possibility to form inclusions in a growing dust particle. In O-rich circumstellar environments, Mg is found to be well-incorporated in silicates. This is less clear for iron, which could be mostly included in the form of iron nanoparticles. In their modeling work, Gail and Sedlmayr (1999) discussed that the formation of iron nanoparticles cannot arise from iron clusters in the gas phase and therefore requires precipitation on grains that are already present. The same reasoning was applied for other phases, such as silica.
As a case study, we report here the formation of metallic (silver) nanoparticles (size ~15 nm) under dusty plasma conditions in which organosilicon dust of size 200 nm or less is formed.
These experiments show that the growths of metallic and organosilicon dust parts happen independently, although simultaneously. We found a possible gas-phase route to initiate the formation of Ag clusters, which involves Ag2C2H0/+ and Ag2 complexes as nucleation seeds. The growing Ag clusters can create bonds with the organosilicon part leading to junctions, as evidenced by the AgSiO infrared band. Further growth of the Ag clusters can then occur to form the observed polycrystalline silver nanoparticles. For the organosilicon part, trend of organization is observed only upon annealing with formation of a silica-like phase. We could not find clear evidence for the presence of silver silicate, which shows that silver is poorly incorporated in the organosilicon dust. We can conclude that the segregation of iron nanoparticles proposed by Gail and Sedlmayr (1999) in their model is observed for silver in our experiments, the difference being that the condensation of the silver metallic phase can start in the gas phase. Finally, we also found that, due to its porous nature the formed dust has the ability to adsorb CO, which might be a property to consider in circumstellar environments in which CO is an abundant gas-phase species.
The search for key molecular clusters that would initiate dust formation is at the heart of many studies both from astronomical observations and quantum chemical modeling. Emphasis has been given on the more refractory species that could nucleate the first particles in the expanding circumstellar shells. In the case of O-rich environments, a route to silicates via SiO clusters has been excluded (Bromley et al., 2016) and alumina (Al2O3) condensates are considered as possible nucleation seeds (Gobrecht et al., 2018). Models are now developed to include a variety of chemical networks for these clusters (Boulangier et al., 2019). In the case of C-rich environments, the first condensates are expected to be silicon carbide and titanium carbide (Lodders and Fegley, 1995). SiCSi and Si2C have been shown to be the most abundant SiC-containing species in the dust formation zone of the prototype C-rich AGB star, IRC+10216 (Cernicharo et al., 2015). Other seeds could form at lower temperatures while some dust components are already in the growing phase. For instance, we demonstrated the importance of mixed Ag-C molecular species. In particular, we showed that these seeds promoted not only the formation of Ag clusters but also catalyzed hydrocarbon growth. The role of metals (iron) in gas-phase formation of PAHs in the envelopes of AGB stars was earlier suggested by Ristorcelli and Klotz (1997) and is seen here in experiments with silver. This organometallic chemistry could be a way to increase the formation rate of PAHs compared to models based solely on hydrocarbon chemistry (Cherchneff et al., 1992).
To conclude, the presented experiments and analysis raise the methodology and open perspectives to tackle questions related to dust formation in circumstellar shells of evolved stars. Silver is not a relevant metal in these environments. Still our work provides a proof of concept to study the impact of metallic atoms on the nucleation processes in the ejecta of dying stars. It shows that addressing the problem of dust formation requires a multidisciplinary context. Further experiments are planned to study the case of iron in an environment in which the key elements involved in stardust formation (C, H, O, Si) are already present.
Author's Note
This article is dedicated to Dominique Le Quéau, who is deeply acknowledged for his scientific curiosity, enthusiasm, and selfless support over many years. All this has been essential in promoting our laboratory astrophysics and interdisciplinary activities.
Data Availability Statement
The experimental datasets presented in this study can be found in online repositories. The names of the repository/repositories and accession number(s) can be found at: http://aroma.irap.omp.eu for molecular data http://doi.org/10.5281/zenodo.4544876 for infrared data.
Author Contributions
RB performed the plasma experiments and the dust characterization. DN performed the LVAP experiments. HS, RB, DN, and FM performed the molecular characterization. RB and KD performed the IR studies. AS made the DFT calculations to elucidate the organometallic chemistry. KM and RB characterized the plasma conditions, CJ and KD characterized the astrophysical context. KM and CJ conceived and planned the experiments, and participated in the data analyses. CJ supervised the project and led the writing of the article. All authors contributed to the manuscript edition and approved the submitted version of the paper.
Funding
This work has been funded by the European Research Council under Synergy Grant ERC-2013-SyG, G.A. 610256 (NANOCOSMOS) with PIs Jose Cernicharo, CJ, and José Ángel Martín-Gago.
Conflict of Interest
The authors declare that the research was conducted in the absence of any commercial or financial relationships that could be construed as a potential conflict of interest.
Acknowledgments
We acknowledge Jose Cernicharo and José Ángel Martín-Gago for fruitful discussions, as well as Anthony Bonnamy, Pavol Jusko, Ming Chao Ji, and Michel Pellarin for their contribution in the commissioning of the LVAP source. The authors also acknowledge support from UAR Raymond Castaing of the University of Toulouse and Mr. Stéphane Le Blond du Plouy for the SEM observations.
References
Accolla, M., Santoro, G., Merino, P., Martínez, L., Tajuelo-Castilla, G., Vázquez, L., et al. (2021). Silicon and hydrogen chemistry under laboratory conditions mimicking the atmosphere of evolved stars. Astrophys. J. 906:44. doi: 10.3847/1538-4357/abc703
Alameddin, G., Hunter, J., Cameron, D., and Kappes, M. M. (1992). Electronic and geometric structure in silver clusters. Chem. Phys. Lett. 192, 122–128. doi: 10.1016/0009-2614(92)85439-H
Andrae, D., Häußermann, U., Dolg, M., Stoll, H., and Preuß, H. (1990). Energy-adjustedab initio pseudopotentials for the second and third row transition elements. Theor. Chim. Acta 77, 123–141. doi: 10.1007/BF01114537
Benítez, F., Martínez, E., and Esteve, J. (2000). Improvement of hardness in plasma polymerized hexamethyldisiloxane coatings by silica-like surface modification. Thin Solid Films 377–378, 109–114. doi: 10.1016/S0040-6090(00)01393-6
Bérard, R. (2019). Formation et croissance par voie plasma d'analogues en laboratoire de poussières d'étoiles: exploration du rôle du rapport C/O et des métaux (Theses), Université Paul Sabatier, Toulouse, France.
Bérard, R., Makasheva, K., Sabbah, H., Demyk, K., and Joblin, C. (2019). Using cold plasma to investigate the mechanisms involved in cosmic dust formation: role of the C/O ratio and metals. Proc. Int. Astron. Union 15, 297–300. doi: 10.1017/S1743921319008457
Biennier, L., Georges, R., Chandrasekaran, V., Rowe, B., Bataille, T., Jayaram, V., et al. (2009). Characterization of circumstellar carbonaceous dust analogues produced by pyrolysis of acetylene in a porous graphite reactor. Carbon 47, 3295–3305. doi: 10.1016/j.carbon.2009.07.050
Bonnamy, A., Jusko, P., Ji, M., Moretto-Capelle, P., Zamith, S., Lhermitte, J. M., et al. (2018). “PIRENEA 2: a new set up to study cosmic dust in the laboratory,” in 22nd International Mass Spectrometry Conference 2018 (IMSC 2018) (Florence).
Boulangier, J., Gobrecht, D., Decin, L., de Koter, A., and Yates, J. (2019). Developing a self-consistent AGB wind model–II. Non-classical, non-equilibrium polymer nucleation in a chemical mixture. Mon. Not. R. Astron. Soc. 489, 4890–4911. doi: 10.1093/mnras/stz2358
Boz, E., and Tüzün, N. (2016). Ag-catalyzed azide alkyne cycloaddition: a DFT approach. Dalton Trans. 45, 5752–5764. doi: 10.1039/C5DT04902D
Bromley, S. T., Gómez Martín, J. C., and Plane, J. M. C. (2016). Under what conditions does (SiO)Nnucleation occur? A bottom-up kinetic modelling evaluation. Phys. Chem. Chem. Phys. 18, 26913–26922. doi: 10.1039/C6CP03629E
Cabezas, C., Mata, S., Daly, A. M., Martn, A., Alonso, J. L., and Cernicharo, J. (2012). La-mb-ftmw spectroscopy of alcch and agcch with a discharge source. J. Mol. Spec. 278, 31–34. doi: 10.1016/j.jms.2012.07.003
Cao, R., Yang, H., Deng, X., Zhang, S., and Xu, X. (2017). In-situ synthesis of amorphous silver silicate/carbonate composites for selective visible-light photocatalytic decomposition. Sci. Rep. 7:15001. doi: 10.1038/s41598-017-15405-6
Carpentier, Y., Féraud, G., Dartois, E., Brunetto, R., Charon, E., Cao, A. T., et al. (2012). Nanostructuration of carbonaceous dust as seen through the positions of the 6.2 and 7.7 μm AIBs. Astron. Astrophys. 548:A40. doi: 10.1051/0004-6361/201118700
Cernicharo, J., McCarthy, M. C., Gottlieb, C. A., Agúndez, M., Velilla Prieto, L., Baraban, J. H., et al. (2015). Discovery of SiCSi in IRC+10216: a missing link between gas and dust carriers of Si–C bonds. Astrophys. J. Lett. 806:L3. doi: 10.1088/2041-8205/806/1/L3
Chai, J.-D., and Head-Gordon, M. (2008). Long-range corrected hybrid density functionals with damped atom–atom dispersion corrections. Phys. Chem. Chem. Phys. 10:6615. doi: 10.1039/b810189b
Cherchneff, I. (2012). The inner wind of IRC+10216 revisited: new exotic chemistry and diagnostic for dust condensation in carbon stars. Astron. Astrophys. 545:A12. doi: 10.1051/0004-6361/201118542
Cherchneff, I., Barker, J. R., and Tielens, A. G. G. M. (1992). Polycyclic aromatic hydrocarbon formation in carbon-rich stellar envelopes. Astrophys. J. 401:269. doi: 10.1086/172059
Chrétien, S., and Salahub, D. R. (2003). Kohn-sham density-functional study of the formation of benzene from acetylene on iron clusters, Fe/Fen+ (n = 1–4). J. Chem. Phys. 119, 12291–12300. doi: 10.1063/1.1626626
Cohen, Y., Bernshtein, V., Armon, E., Bekkerman, A., and Kolodney, E. (2011). Formation and emission of gold and silver carbide cluster ions in a single C60surface impact at keV energies: experiment and calculations. J. Chem. Phys. 134:124701. doi: 10.1063/1.3561317
Contreras, C. S., and Salama, F. (2013). Laboratory investigations of polycyclic aromatic hydrocarbon formation and destruction in the circumstellar outflows of carbon stars. Astrophys. J. Suppl. 208:6. doi: 10.1088/0067-0049/208/1/6
De Bleecker, K., Bogaerts, A., and Goedheer, W. (2006). Detailed modeling of hydrocarbon nanoparticle nucleation in acetylene discharges. Phys. Rev. E 73:026405. doi: 10.1103/PhysRevE.73.026405
Demyk, K., Meny, C., Lu, X.-H., Papatheodorou, G., Toplis, M. J., Leroux, H., et al. (2017). Low temperature MIR to submillimeter mass absorption coefficient of interstellar dust analogues: I. Mg-rich glassy silicates. Astron. Astrophys. 600:A123. doi: 10.1051/0004-6361/201629711
Despax, B., Gaboriau, F., Caquineau, H., and Makasheva, K. (2016). Influence of the temporal variations of plasma composition on the cyclic formation of dust in hexamethyldisiloxane-argon radiofrequency discharges: Analysis by time-resolved mass spectrometry. AIP Adv. 6:105111. doi: 10.1063/1.4966254
Despax, B., Makasheva, K., and Caquineau, H. (2012). Cyclic powder formation during pulsed injection of hexamethyldisiloxane in an axially asymmetric radiofrequency argon discharge. J. Appl. Phys. 112:093302. doi: 10.1063/1.4761971
Despax, B., and Raynaud, P. (2007). Deposition of “polysiloxane” thin films containing silver particles by an RF asymmetrical discharge. Plasma Process. Polym. 4, 127–134. doi: 10.1002/ppap.200600083
Duncan, M. A. (2012). Invited review article: laser vaporization cluster sources. Rev. Sci. Instrum. 83:041101. doi: 10.1063/1.3697599
Feller, D. (1996). The role of databases in support of computational chemistry calculations. J. Comput. Chem. 17, 1571–1586. doi: 10.1002/(SICI)1096-987X(199610)17:13<1571::AID-JCC9>3.0.CO;2-P
Fraser, H. J., Collings, M. P., Dever, J. W., and McCoustra, M. R. S. (2004). Using laboratory studies of CO-H2O ices to understand the non-detection of a 2152 cm−1 (4.647μm) band in the spectra of interstellar ices. Mon. Not. R. Astron. Soc. 353, 59–68. doi: 10.1111/j.1365-2966.2004.08038.x
Frisch, M. J., Trucks, G. W., Schlegel, H. B., Scuseria, G. E., Robb, M. A., Cheeseman, J. R., et al. (2016). Gaussiañ16 Revision B.01. Wallingford, CT: Gaussian Inc.
Gail, H. P., and Sedlmayr, E. (1999). Mineral formation in stellar winds. I. Condensation sequence of silicate and iron grains in stationary oxygen rich outflows. Astron. Astrophys. 347, 594–616.
Gail, H. P., and Sedlmayr, E. (2014). Physics and Chemistry of Circumstellar Dust Shells, Vol. 52. Cambridge, UK: Cambridge University Press.
Garofano, V., Bérard, R., Boivin, S., Joblin, C., Makasheva, K., and Stafford, L. (2019). Multi-scale investigation in the frequency domain of Ar/HMDSO dusty plasma with pulsed injection of HMDSO. Plasma Sources Sci. Technol. 28:055019. doi: 10.1088/1361-6595/ab07cc
Gatehouse, B. M., Livingstone, S. E., and Nyholm, R. S. (1958). The infrared spectra of some simple and complex carbonates. J. Chem. Soc. 636, 3137–3142.
Gobrecht, D., Decin, L., Cristallo, S., and Bromley, S. T. (2018). A global optimisation study of the low-lying isomers of the alumina octomer (Al2O3)8. Chem. Phys. Lett. 711, 138–147. doi: 10.1016/j.cplett.2018.09.018
Grace, L. I., Abo-Riziq, A., and deVries, M. S. (2005). An in situ silver cationization method for hydrocarbon mass spectrometry. J. Am. Soc. Mass Spectrom. 16, 437–440. doi: 10.1016/j.jasms.2004.12.011
Hanley, L., and Zimmermann, R. (2009). Light and molecular ions: the emergence of vacuum UV single-photon ionization in MS. Anal. Chem. 81, 4174–4182. doi: 10.1021/ac8013675
Hsu, C. S., Lobodin, V. V., Rodgers, R. P., McKenna, A. M., and Marshall, A. G. (2011). Compositional boundaries for fossil hydrocarbons. Energy Fuels 25, 2174–2178. doi: 10.1021/ef2004392
Innocenzi, P., Falcaro, P., Grosso, D., and Babonneau, F. (2003). Order disorder transitions and evolution of silica structure in self-assembled mesostructured silica films studied through FTIR spectroscopy. J. Phys. Chem. B 107, 4711–4717. doi: 10.1021/jp026609z
Ishizuka, S., Kimura, Y., and Sakon, I. (2015). In situ infrared measurements of free-flying silicate during condensation in the laboratory. Astrophys. J. 803:88. doi: 10.1088/0004-637X/803/2/88
Jackschath, C., Rabin, I., and Schulze, W. (1992). Electron impact ionization of silver clusters Agn, n ≤ 36. Z. Phys. D Atoms Mol. Clusters 22, 517–520. doi: 10.1007/BF01426093
Jäger, C., Huisken, F., Mutschke, H., Jansa, I. L., and Henning, T. (2009). Formation of polycyclic aromatic hydrocarbons and carbonaceous solids in gas-phase condensation experiments. Astrophys. J. 696, 706–712. doi: 10.1088/0004-637X/696/1/706
Kaiser, R. I., Mebel, A., Kostko, O., and Ahmed, M. (2010). On the ionization energies of C4H3 isomers. Chem. Phys. Lett. 485, 281–285. doi: 10.1016/j.cplett.2009.12.027
Kemper, F., de Koter, A., Waters, L. B. F. M., Bouwman, J., and Tielens, A. G. G. M. (2002). Dust and the spectral energy distribution of the OH/IR star OH 127.8+0.0: evidence for circumstellar metallic iron. Astron. Astrophys. 384, 585–593. doi: 10.1051/0004-6361:20020036
Kendall, R. A., Dunning, T. H., and Harrison, R. J. (1992). Electron affinities of the first–row atoms revisited. Systematic basis sets and wave functions. J. Chem. Phys. 96, 6796–6806. doi: 10.1063/1.462569
Kirk, C. T. (1988). Quantitative analysis of the effect of disorder-induced mode coupling on infrared absorption in silica. Phys. Rev. B 38, 1255–1273. doi: 10.1103/PhysRevB.38.1255
Koch, B. P., and Dittmar, T. (2006). From mass to structure : an aromaticity index for high-resolution mass data of natural organic matter. Rapid Commun. Mass Spectrom. 20, 926–932. doi: 10.1002/rcm.2386
Koga, N., Yamada, S., and Kimura, T. (2013). Thermal decomposition of silver carbonate: phenomenology and physicogeometrical kinetics. J. Phys. Chem. C 117, 326–336. doi: 10.1021/jp309655s
Körner, E., Aguirre, M. H., Fortunato, G., Ritter, A., Rühe, J., and Hegemann, D. (2010). Formation and distribution of silver nanoparticles in a functional plasma polymer matrix and Related Ag+ release properties. Plasma Process. Polym. 7, 619–625. doi: 10.1002/ppap.200900163
Kroto, H. W., Heath, J. R., Obrien, S. C., Curl, R. F., and Smalley, R. E. (1985). C60: Buckminsterfullerene. Nature 318, 162–163. doi: 10.1038/318162a0
Li, X., Xu, Z., Chen, L., Hong, L., and Li, Y. (2020). Thermal oxidation curing polycarbosilane fibers by alternating air and vacuum process. RSC Adv. 10, 26052–26058. doi: 10.1039/D0RA04888G
Lieberman, M. A., and Lichtenberg, A. J. (2005). Principles of Plasma Discharges and Materials Processing, 2nd Edn. Hoboken, NJ: Wiley-Interscience.
Lobodin, V. V., Marshall, A. G., and Hsu, C. S. (2012). Compositional space boundaries for organic compounds. Anal. Chem. 84, 3410–3416. doi: 10.1021/ac300244f
Lodders, K., and Fegley, B. J. (1995). The origin of circumstellar silicon carbide grains found in meteorites. Meteoritics 30:661. doi: 10.1111/j.1945-5100.1995.tb01164.x
Makasheva, K., Villeneuve-Faure, C., Bonafos, C., Laurent, C., Pugliara, A., Despax, B., et al. (2016). Dielectric engineering of nanostructured layers to control the transport of injected charges in thin dielectrics. IEEE Trans. Nanotechnol. 15, 839–848. doi: 10.1109/TNANO.2016.2553179
Marks, J. H., Ward, T. B., Brathwaite, A. D., Ferguson, S., and Duncan, M. A. (2019). Cyclotrimerization of acetylene in gas phase v+(C2H2)n complexes: detection of intermediates and products with infrared spectroscopy. J. Phys. Chem. A 123, 6733–6743. doi: 10.1021/acs.jpca.9b04962
Martin, J. M. L., and Sundermann, A. (2001). Correlation consistent valence basis sets for use with the Stuttgart–Dresden–Bonn relativistic effective core potentials: the atoms Ga–Kr and In–Xe. J. Chem. Phys. 114, 3408–3420. doi: 10.1063/1.1337864
Martínez, L., Santoro, G., Merino, P., Accolla, M., Lauwaet, K., Sobrado, J., et al. (2020). Prevalence of non-aromatic carbonaceous molecules in the inner regions of circumstellar envelopes. Nat. Astron. 4, 97–105. doi: 10.1038/s41550-019-0899-4
McKee, M. L., and Samokhvalov, A. (2017). Density functional study of neutral and charged silver clusters Agn with n = 2−22. Evolution of properties and structure. J. Phys. Chem. A 121, 5018–5028. doi: 10.1021/acs.jpca.7b03905
Milella, A., Palumbo, F., Dilonardo, E., Barucca, G., Cosma, P., and Fracassi, F. (2014). Single step plasma deposition of platinum-fluorocarbon nanocomposite films as electrocatalysts of interest for micro fuel cells technology: single step plasma deposition of platinum-fluorocarbon nanocomposite. Plasma Process. Polym. 11, 1068–1075. doi: 10.1002/ppap.201400039
Moncho, S., Brothers, E. N., and Janesko, B. G. (2013). A benchmark study of H 2 activation by Au 3 and Ag 3 clusters. J. Phys. Chem. C 117, 7487–7496. doi: 10.1021/jp3098704
Moore, M. H., Tanabe, T., and Nuth, J. A. (1991). The SiH vibrational stretch as an indicator of the chemical state of interstellar grains. Astrophys. J. Lett. 373:L31. doi: 10.1086/186044
Pritchard, B. P., Altarawy, D., Didier, B., Gibsom, T. D., and Windus, T. L. (2019). A new basis set exchange: an open, up-to-date resource for the molecular sciences community. J. Chem. Inf. Model. 59, 4814–4820. doi: 10.1021/acs.jcim.9b00725
Qin, J., Chen, N., Feng, C., Fan, C., and Gao, Y. (2019). Synthesis of a high-performance silver silicate (Ag6Si2O7)/silver bromide (AgBr) photocatalyst with enhanced visible light catalytic activity for refractory organic pollutants. Colloids Surf. A Physicochem. Eng. Aspects 577, 213–223. doi: 10.1016/j.colsurfa.2019.05.076
Racles, C., Nistor, A., and Cazacu, M. (2013). A silica-silver nanocomposite obtained by sol-gel method in the presence of silver nanoparticles. Open Chem. 11, 1689–1698. doi: 10.2478/s11532-013-0294-4
Raynaud, P., Despax, B., Segui, Y., and Caquineau, H. (2005). FTIR plasma phase analysis of hexamethyldisiloxane discharge in microwave multipolar plasma at different electrical powers. Plasma Process. Polym. 2, 45–52. doi: 10.1002/ppap.200400034
Ristorcelli, I., and Klotz, A. (1997). Organometallic catalysis for aromatic molecules formation in carbon rich envelopes. Astron. Astrophys. 317, 962–967.
Sabbah, H., Bonnamy, A., Papanastasiou, D., Cernicharo, J., Martín-Gago, J.-A., and Joblin, C. (2017). Identification of PAH isomeric structure in cosmic dust analogs: the AROMA setup. Astrophys. J. 843:34. doi: 10.3847/1538-4357/aa73dd
Sabbah, H., Commodo, M., Picca, F., De Falco, G., Minutolo, P., D'Anna, A., et al. (2021). Molecular content of nascent soot: family characterization using two-step laser desorption laser ionization mass spectrometry. Proc. Combust. Inst. doi: 10.1016/j.proci.2020.09.022
Santoro, G., Martínez, L., Lauwaet, K., Accolla, M., Tajuelo-Castilla, G., Merino, P., et al. (2020). The chemistry of cosmic dust analogs from C, C2, and C2H2 in C-rich circumstellar envelopes. Astrophys. J. 895:97. doi: 10.3847/1538-4357/ab9086
Schnabel, P., Irion, M., and Weil, K. (1991). Evidence for low-pressure catalysis in the gas phase by a naked metal cluster: the growth of benzene precursors on Fe4+. J. Phys. Chem. 95, 9688–9694. doi: 10.1021/j100177a018
Schöier, F. L., Maercker, M., Justtanont, K., Olofsson, H., Black, J. H., Decin, L., et al. (2011). A chemical inventory of the S-type AGB star χ Cygni based on Herschel/HIFI observations of circumstellar line emission. The importance of non-LTE chemical processes in a dynamical region. Astron. Astrophys. 530:A83. doi: 10.1051/0004-6361/201116597
Schöier, F. L., Olofsson, H., and Lundgren, A. A. (2006). SiO in C-rich circumstellar envelopes of AGB stars: effects of non-LTE chemistry and grain adsorption. Astron. Astrophys. 454, 247–255. doi: 10.1051/0004-6361:20054795
Schuchardt, K. L., Didier, B. T., Elsethagen, T., Sun, L., Gurumoorthi, V., Chase, J., et al. (2007). Basis set exchange: a community database for computational sciences. J. Chem. Inf. Model. 47, 1045–1052. doi: 10.1021/ci600510j
Sioutis, I., Stakhursky, V. L., Pitzer, R. M., and Miller, T. A. (2007). Jahn-teller and related effects in the silver trimer. i. the ab initio calculation of spectroscopically observable parameters for the X~2E′ and Ã2E′′ electronic states. J. Chem. Phys. 126:124308. doi: 10.1063/1.2430703
Slager, T. L., Lindgren, B. J., Mallmann, A. J., and Greenler, R. G. (1972). Infrared spectra of the oxides and carbonates of silver. J. Phys. Chem. 76, 940–943. doi: 10.1021/j100650a029
Smith, A. (1960). Infrared spectra-structure correlations for organosilicon compounds. Spectrochim. Acta 16, 87–105. doi: 10.1016/0371-1951(60)80074-4
Taj, S., Baird, D., Rosu-Finsen, A., and McCoustra, M. R. S. (2017). Surface heterogeneity and inhomogeneous broadening of vibrational line profiles. Phys. Chem. Chem. Phys. 19, 7990–7995. doi: 10.1039/C6CP07530D
Taj, S., Baird, D., Rosu-Finsen, A., and McCoustra, M. R. S. (2019). Correction: Surface heterogeneity and inhomogeneous broadening of vibrational line profiles. Phys. Chem. Chem. Phys. 21, 21663–21664. doi: 10.1039/C9CP90226K
Tian, Z., and Tang, Z. (2005). Experimental and theoretical studies of the interaction of silver cluster cations (n = 1–4) with ethylene. Rapid Commun. Mass Spectrom. 19, 2893–2904. doi: 10.1002/rcm.2139
Truong, N. X., Haertelt, M., Jaeger, B. K., Gewinner, S., Schöllkopf, W., Fielicke, A., et al. (2016). Characterization of neutral boron-silicon clusters using infrared spectroscopy: the case of Si6B. Int. J. Mass Spectrom. 395, 1–6. doi: 10.1016/j.ijms.2015.11.006
Tsuneda, T. (2019). Theoretical investigations on geometrical and electronic structures of silver clusters: theoretical investigations on geometrical and electronic structures of silver clusters. J. Comput. Chem. 40, 206–211. doi: 10.1002/jcc.25577
Walch, S. P., Bauschlicher, C. W., and Langhoff, S. R. (1986). Theoretical studies of diatomic and triatomic systems containing the group ib atoms Cu, Ag, and Au. J. Chem. Phys. 85, 5900–5907. doi: 10.1063/1.451501
Wang, W., Zhang, J., and Liao, K. (1987). Effect of annealing temperature on hydrogen content in H multilayer films. Mater. Lett. 6, 45–48. doi: 10.1016/0167-577X(87)90100-5
Wesendrup, R., and Schwarz, H. (1997). Catalytic benzene formation in the gas-phase reactions of MC4 (M = Ru, Rh) with C2H2. Organometallics 16, 461–466. doi: 10.1021/om960757s
Xu, Q. H., Li, D. Z., Song, M. Z., and Zhang, S. G. (2013). A density-functional study on the interaction of C2H radical with silver clusters (n = 1–4). J. Chem. Eng. Process Technol. 4:173. doi: 10.4172/2157-7048.1000173
Keywords: laboratory astrophysics, stardust, dusty plasma, organosilicon dust, silver nanoparticles, infrared spectroscopy, molecular analysis, density functional theory
Citation: Bérard R, Makasheva K, Demyk K, Simon A, Nuñez Reyes D, Mastrorocco F, Sabbah H and Joblin C (2021) Impact of Metals on (Star)Dust Chemistry: A Laboratory Astrophysics Approach. Front. Astron. Space Sci. 8:654879. doi: 10.3389/fspas.2021.654879
Received: 17 January 2021; Accepted: 24 February 2021;
Published: 25 March 2021.
Edited by:
Ryan C. Fortenberry, University of Mississippi, United StatesReviewed by:
Martin Robert Stewart McCoustra, Heriot-Watt University, United KingdomMarzio Rosi, University of Perugia, Italy
Copyright © 2021 Bérard, Makasheva, Demyk, Simon, Nuñez Reyes, Mastrorocco, Sabbah and Joblin. This is an open-access article distributed under the terms of the Creative Commons Attribution License (CC BY). The use, distribution or reproduction in other forums is permitted, provided the original author(s) and the copyright owner(s) are credited and that the original publication in this journal is cited, in accordance with accepted academic practice. No use, distribution or reproduction is permitted which does not comply with these terms.
*Correspondence: Christine Joblin, Y2hyaXN0aW5lLmpvYmxpbkBpcmFwLm9tcC5ldQ==