 Ningjing Jiang1
 Mattia Melosso1*
 Filippo Tamassia2
 Luca Bizzocchi3
 Luca Dore1Elisabetta Canè2
 Davide Fedele4,5Jean-Claude Guillemin6
 Cristina Puzzarini1
- 1Dipartimento di Chimica “Giacomo Ciamician”, Università di Bologna, Bologna, Italy
- 2Dipartimento di Chimica Industriale “Toso Montanari”, Università di Bologna, Bologna, Italy
- 3Center for Astrochemical Studies, Max Planck Institut für Extraterrestrische Physik, Garching bei München, Germany
- 4INAF—Osservatorio Astrofisico di Arcetri, Firenze, Italy
- 5INAF—Osservatorio Astrofisico di Torino, Pino Torinese, Italy
- 6Ecole Nationale Supérieure de Chimie de Rennes, CNRS, ISCR–UMR6226, University of Rennes, Rennes, France
The perspectives opened by modern ground-based infrared facilities and the forthcoming James Webb Telescope mission have brought a great attention to the ro-vibrational spectra of simple interstellar molecules. In this view, and because of the lack of accurate spectroscopic data, we have investigated the infrared spectrum of deuterated cyanoacetylene (DC3N), a relevant astrochemical species. The
1 Introduction
Interstellar DC3N was first discovered in the dark cloud TMC-1 (Taurus Molecular Cloud 1) through the observation in emission of its
The astrophysical relevance of DC3N is related both to the ubiquitous presence of its parent species (HC3N) in Space and to its deuteration. Indeed, the study of interstellar D-containing molecules provides important information on the properties and the evolution of star-forming regions (see, e.g., Ceccarelli et al., 2014, and references therein), and is a key tool to follow the chemical history of the materials which eventually enter into the composition of planetary bodies.
On a general ground, the identification of an interstellar molecule is achieved through the detection of its rotational and/or vibrational spectral features (McGuire, 2018). In recent years, the observations of molecules in the interstellar medium (ISM) has prospered thanks to the development of new high-sensitivity telescopes operating at a wavelength range spanning from centimeter to micrometer. The Atacama Large Millimeter/sub-millimeter Array (ALMA) is one of the best facility for the observation of molecular signatures in a variety of astrophysical objects, including remote galaxies and planets. With ten different bands (from 0.32 to 3.6 mm) ALMA covers a spectral window wherein most of the rotational transitions fall, allowing to probe a multiplicity of chemical (light and medium-sized molecules) and excitation conditions (gas temperature).
On the other hand, the observation of vibrational signatures of interstellar molecules is comparatively more difficult due to the limited transparency of the Earth atmosphere in the Mid- and Far-infrared regions. Despite the fact that a number of powerful telescopes are equipped with state-of-the-art high-resolution
The laboratory spectroscopic knowledge of DC3N over the full spectral range of interest for astronomy is, however, not homogeneous. While the rotational spectrum of DC3N has been accurately studied and it is well suited to guide astronomical observations at millimeter wavelengths, a detailed knowledge of its infrared spectrum is limited to the spectral range between 200 and 1,100 cm−1 (Melosso et al., 2020). At higher frequencies, only low-accuracy spectroscopic data are available in the literature (Mallinson and Fayt, 1976). The same applies to the MIR spectrum of HC3N above 1,000 cm−1, for which the ro-vibrational bands were recorded either at low resolution of 0.025 and 0.050 cm−1 (Mallinson and Fayt, 1976) or in a narrow spectral interval (Yamada et al., 1980; Yamada and Winnewisser, 1981; Yamada et al., 1983). Such patchy results were due mainly to the type of instrumentation employed, i.e., Ebert-type and Diode-laser spectrometers. Currently, these limitations are easily overcome by Fourier-transform infrared (FTIR) spectrometers, which offers the possibility of recording high-resolution ro-vibrational spectra in a wide frequency range.
To fill the lack of information described above, in this work we report on a comprehensive investigation of the high-resolution MIR spectra of DC3N and HC3N, obtained using FTIR spectroscopy. In addition, the pure rotational spectra in some vibrational excited states of DC3N have been recorded in order to determine highly-accurate spectroscopic parameters. The new assignments of the IR and millimeter-wave spectra were combined into a single global fit from which a consistent set of spectroscopic constants has been determined. The analysis of DC3N provides a highly-precise rest-frequency catalog useful for astronomical observations.
2 Experimental Details
The DC3N sample was prepared as recently reported in Melosso et al. (2020).
2.1 Fourier-Transform Infrared Interferometer
Infrared spectra of DC3N and HC3N were recorded in the 1,500–3,500 cm−1 range with a Fourier-Transform Bomem DA3.002 interferometer (Stoppa et al., 2016; Tamassia et al., 2020). In the present work, the spectrometer was equipped with a KBr beam-splitter, a Globar source, a liquid-nitrogen InSb detector, and a multipass cell whose absorption-pathlength was set to 8 m. Two spectra were recorded in the 1,500–3,500 cm−1 region using different pressures of DC3N, namely 16 and 32 Pa, at a nominal resolution of 0.004 cm−1. Both of them were obtained from the co-addition of 140–200 scans, for a total integration time of 13–18 h. The frequency axis of the spectra was calibrated by using some 50 transitions of H2O and CO2 as references, whose wavenumbers were taken from the HITRAN database (Gordon et al., 2017). On average, the calibration residuals are about 5 × 10⁻⁵ cm−1. The HC3N absorptions were also detected in the same spectra with a good signal-to-noise ratio (S/N) because of the hydrogen-deuterium (H/D) exchange occurring in the multipass cell. The line-center frequencies were retrieved with PGOPHER (Western, 2017) using the maximum intensity of the lines and their uncertainty is assumed to be 4 × 10⁻⁴ cm−1 in all cases.
2.2 Frequency-Modulation Millimeter/Submillimeter-Wave Spectrometer
Pure rotational transitions of DC3N were recorded in three high-energy vibrational states by means of a frequency-modulation (FM) millimeter/submillimeter-wave spectrometer (Melosso et al., 2019a; Melosso et al., 2019b). Briefly, the primary radiation source is a Gunn oscillator working in the W band (80–115 GHz), whose frequency is stabilized and modulated in a phase-lock loop. Higher frequencies are obtained by coupling the Gunn diode with passive frequency-multipliers (doublers and triplers). The detection system is constituted by a Schottky barrier diode connected to a lock-in amplifier set at twice the modulation frequency (
3 Analysis and Results
3.1 Theoretical Background
DC3N is a closed shell linear molecule which possesses seven vibrational modes: four stretching modes (
The effective Hamiltonian employed in this work to analyze the ro-vibrational transitions mentioned above (both DC3N and HC3N) and to retrieve the spectroscopic parameters was already described in Bizzocchi et al. (2017). Since the present study focuses on the analysis of three stretching states (
where
In the ro-vibrational part, the diagonal elements of the Hamiltonian can be expressed as:
where
As far as the vibrational
The functions
3.2 Spectral Features
The stretching bands
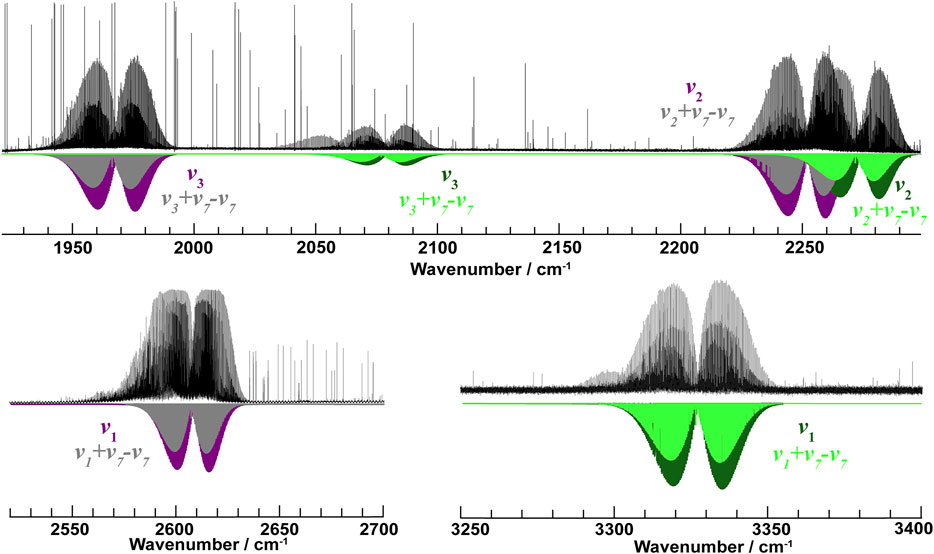
FIGURE 1. Portions of the recorded MIR spectra (black traces): 1,930–2,300 cm−1, 2,500–2,700 cm−1 and 3,250–3,400 cm−1. Spectral simulations based on the spectroscopic constants of Tables 2, 3 are reported for both DC3N (violet traces) and HC3N (green traces). Recording conditions: T = 298 K, p = 16–32 Pa (top and bottom-left: 32 Pa, bottom-right: 16 Pa), Lopt = 8 m, 140–200 scans, unapodized resolution 0.004 cm−1.
While the absolute intensities of DC3N bands are quite similar to each other (v1 = 81 atm−1 cm−2, v2 = 50 atm−1 cm−2, and v3 = 39 atm−1 cm−2Bénilan et al., 2006), the situation is different for HC3N (v1 = 249 atm−1 cm−2, v2 = 41 atm−1 cm−2, and v3 = 8 atm−1 cm−2Jolly et al., 2007), with an overall variation of more than one order of magnitude. Furthermore, the hot-bands analyzed in this work (
In addition to the infrared measurements, pure rotational spectra of three vibrational excited states of DC3N were recorded between 243 and 295 GHz using the spectrometer described in Section 2.2. In detail: some
3.3 Analysis of the Spectra
The analysis of the ro-vibrational and pure rotational spectra has been performed with the aid of the PGOPHER program (Western, 2017) and the CALPGM suite (Pickett, 1991). Initially, more than 1500 ro-vibrational transitions of DC3N belonging to the fundamental bands
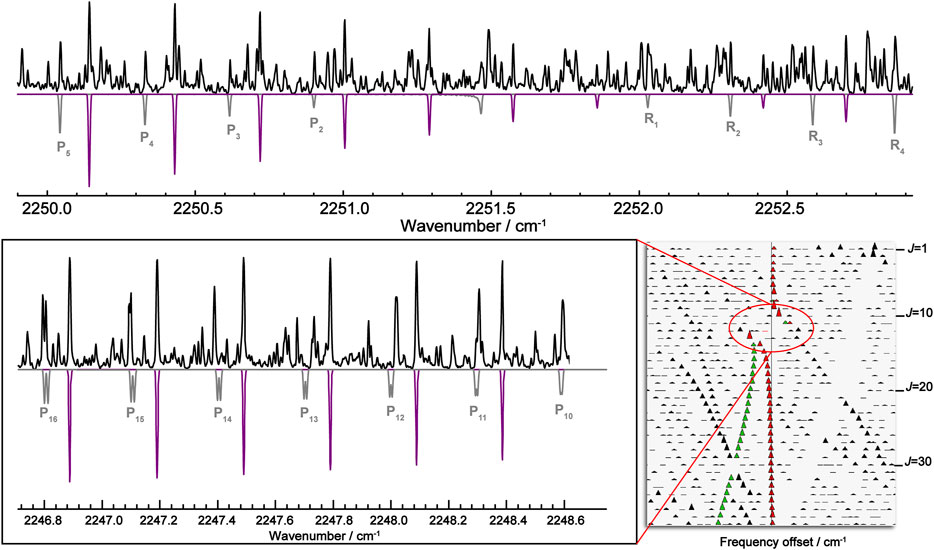
FIGURE 2. (Top panel): Portions of the
The analysis of the other five bands was instead rather straightforward and satisfactory, with the Hamiltonian of Eqs 1–3 able to well reproduce all experimental data within their nominal uncertainty. The quality of the band analyses can be inferred from the root-mean-square (rms) errors of the fits, which are reported in Table 1.
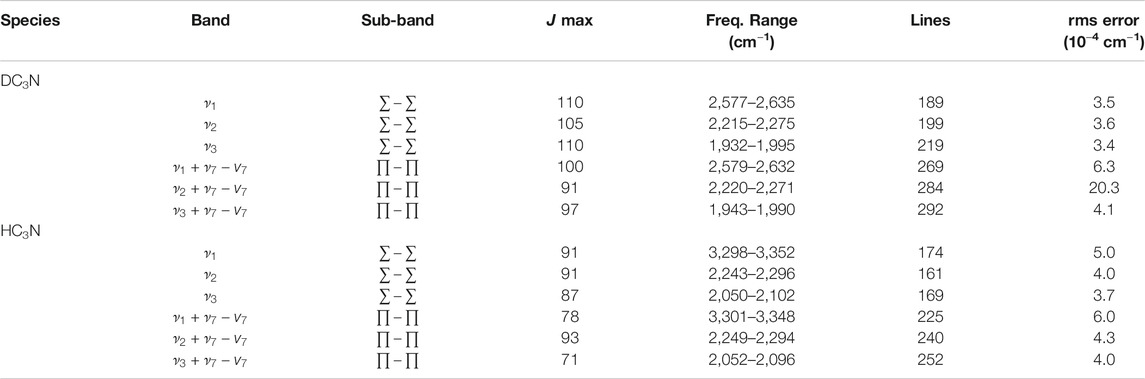
TABLE 1. Summary of the ro-vibrational bands recorded and analyzed in this work.
The spectroscopic constants determined from the preliminary analysis of the six bands of DC3N were used to predict its pure rotational spectrum in the
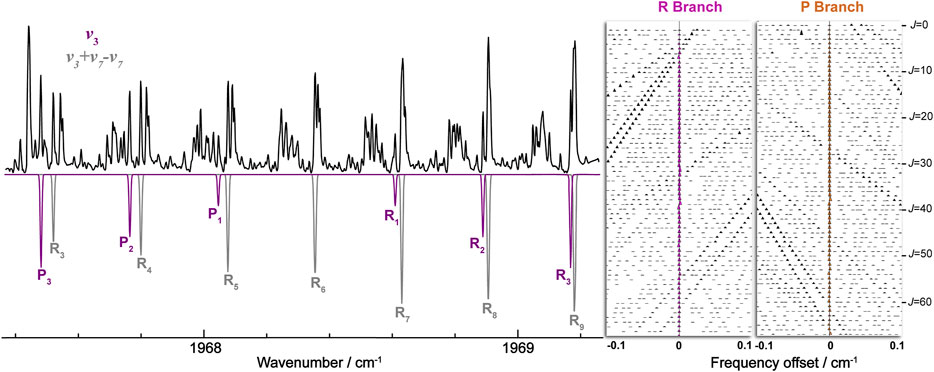
FIGURE 3. (Left panel): Portions of the DC3N spectrum in the region of the
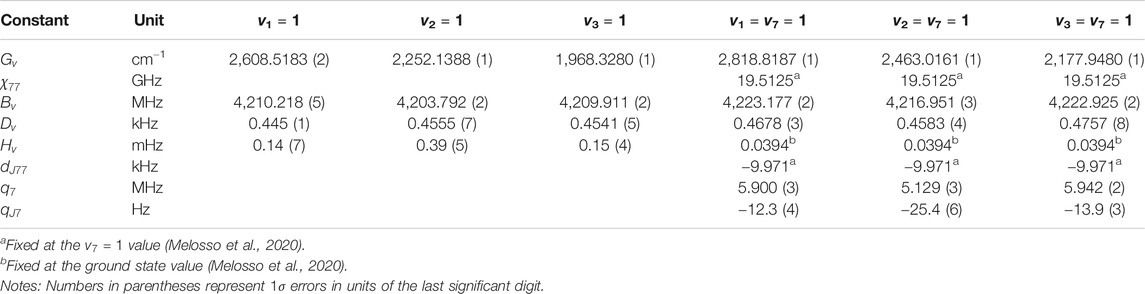
TABLE 2. Spectroscopic constants determined for DC3N.
As far as HC3N is concerned, being a side-product of our spectral recording, we limited the analysis to its infrared spectrum. With the only exception of a few small deviations involving blocks of 2–3 consecutive J levels, no evident perturbations were observed during the assignment procedure and/or at the fitting stage. Overall, for HC3N, 1221 different lines were assigned to the
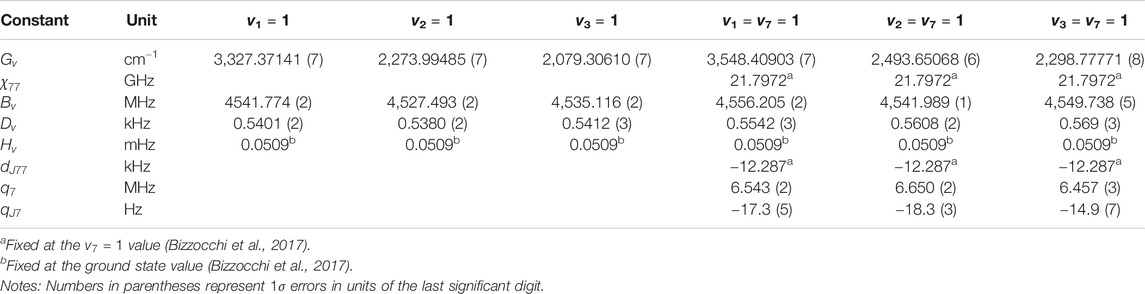
TABLE 3. Spectroscopic constants determined for HC3N.
The fit output files containing the assigned transitions, their wavenumbers, and the residual errors for each band are provided as Supplementary Material.
4 Discussion and Conclusion
Nowadays, the improvement of the ground-based infrared facilities (e.g., CRIRES + at VLT) and the perspectives opened by the forthcoming JWST telescope (with MIRI and NISPEC instruments) have brought a considerable interest to the ro-vibrational spectrum of simple interstellar molecules, both at low and high wavenumbers. In particular, the possibility of probing the inner portions of young proto-planetary disks where the material is funneled into the planetary formation zone and—at later stages—to directly observe the atmospheres of the mature exoplanets, makes the stretching spectral interval (1,500–3,500 cm−1) of particular interest due to its selectivity to the high gas temperatures typical of these regions. In this context, a detailed knowledge of the associated hot bands is as important as that of the fundamentals. In high excitation conditions, many vibrational states are significantly populated and the corresponding satellite features are able to make up a considerable amount of the retrieved flux. Hot bands are thus critical to accurately model the shape of the band profile and to retrieve reliable column densities. The laboratory detection of accurate infrared spectra is therefore essential to guide such astronomical investigations. Prior to our investigation, the knowledge of the mid-infrared spectra of DC3N and HC3N above 1,200 cm−1 was sparse and deficient in terms of measurement precision.
Therefore, part of the MIR spectra of DC3N and HC3N has been re-investigated with a FTIR spectrometer, which ensures high-resolution across a broad band spectrum. Three fundamentals (
Additional and complementary measurements were performed with a FM millimeter/submillimeter-wave spectrometer, equipped with a furnace that allowed to record pure rotational transitions in highly excited states (with energies above 2,000 cm−1). The inclusion of rotational lines, whose precision is intrinsically much higher than ro-vibrational data, led to an improved determination of the upper state spectroscopic parameters. If compared to the previous work, our constants are more than two orders of magnitude more accurate than those from Mallinson and Fayt (1976), and are consistent with the most recent spectroscopic data available for DC3N (Melosso et al., 2020) and HC3N (Bizzocchi et al., 2017). Additionally, the line list for the
As a final remark, the high-temperature rotational spectroscopy experimental technique presented in this work can be successfully applied to future investigations of the vibrational excited states of molecules relevant to astrophysics and possessing only highly-energetic vibrations, such as water or other small species.
Data Availability Statement
The original contributions presented in the study are included in the article/Supplementary Material, further inquiries can be directed to the corresponding author.
Author Contributions
MM, FT, and CP contributed to conception and design of the study; JG synthesized the sample; MM, FT, and LD set-up the experiments; NJ, MM, FT, and EC recorded the spectra; NJ prepared the figures; MM organized the tables; NJ, MM, and FT performed the analysis; NJ wrote the first draft of the article with the help of MM and CP; MM, LB, and CP wrote sections of the article; DF contributed to the discussion on the astronomical applications. All authors contributed to article revision, read, and approved the submitted version.
Funding
This study was supported by Bologna University (RFO funds) and by MIUR (Project PRIN 2015: STARS in the CAOS, Grant Number 2015F59J3R). NJ thanks the China Scholarships Council (CSC) for the financial support. JG thanks the Centre National d’Etudes Spatiales (CNES) for a grant. The paper is published with the contribution of the Department of Excellence program financed by the Ministry of Education, University and Research (MIUR, L. 232 del 01/12/2016).
Conflict of Interest
The authors declare that the research was conducted in the absence of any commercial or financial relationships that could be construed as a potential conflict of interest.
Supplementary Material
The Supplementary Material for this article can be found online at: https://www.frontiersin.org/articles/10.3389/fspas.2021.656295/full#supplementary-material.
Footnotes
1Tamassia et al., 2021, in preparation
References
Banks, K., Larson, M., Aymergen, C., and Zhang, B. (2008). “James webb space telescope mid-infrared instrument cooler systems engineering,” in Modeling, systems engineering, and project management for astronomy III, Editors George, Z. A., and Martin, J. C. (Bellingham, WA: International Society for Optics and Photonics), 7017, 70170A.
Belloche, A., Müller, H. S. P., Garrod, R. T., and Menten, K. M. (2016). Exploring molecular complexity with ALMA (EMoCA): deuterated complex organic molecules in Sagittarius B2(N2). Astron. Astrophys. 587, A91. doi:10.1051/0004-6361/201527268
Bénilan, Y., Jolly, A., Raulin, F., and Guillemin, J.-C. (2006). IR band intensities of DC3N and HC315N: implication for observations of Titan’s atmosphere. Planet. Space Sci. 54, 635–640. doi:10.1016/j.pss.2006.01.006
Bizzocchi, L., Tamassia, F., Laas, J., Esposti, C. D., Dore, L., Melosso, M., et al. (2017). Rotational and high-resolution infrared spectrum of HC3N: global ro-vibrational analysis and improved line catalog for astrophysical observations. Astrophys. J. Suppl. Ser. 233, 11. doi:10.3847/1538-4365/aa9571
Ceccarelli, C., Caselli, P., Bockelée-Morvan, D., Mousis, O., Pizzarello, S., Robert, F., et al. (2014). “Deuterium fractionation: the ariadne’s thread from the precollapse phase to meteorites and comets today,” in Protostars and Planets VI, 859–882. doi:10.2458/azu_uapress_9780816531240-ch037
Diouf, M. L., Cozijn, F. M. J., Darquié, B., Salumbides, E. J., and Ubachs, W. (2019). Lamb-dips and lamb-peaks in the saturation spectrum of hd. Opt. Lett. 44, 4733–4736. doi:10.1364/ol.44.004733
Dore, L., Bizzocchi, L., and Degli Esposti, C. (2012). Accurate rotational rest-frequencies of CH2NH at submillimetre wavelengths. Astron. Astrophys. 544, A19. doi:10.1051/0004-6361/201219674
Esplugues, G. B., Cernicharo, J., Viti, S., Goicoechea, J. R., Tercero, B., Marcelino, N., et al. (2013). Combined IRAM and Herschel/HIFI study of cyano(di)acetylene in Orion KL: tentative detection of DC3N. Astron. Astrophys. 559, A51. doi:10.1051/0004-6361/201322073
Gordon, I. E., Rothman, L. S., Hill, C., Kochanov, R. V., Tan, Y., Bernath, P. F., et al. (2017). The HITRAN2016 molecular spectroscopic database. J. Quant. Spectrosc. Ra. 203, 3–69. doi:10.1016/j.jqsrt.2017.06.038
Howe, D. A., Millar, T. J., Schilke, P., and Walmsley, C. M. (1994). Observations of deuterated cyanoacetylene in dark clouds. Mon. Not. R. Astron. Soc. 267, 59–68. doi:10.1093/mnras/267.1.59
Hua, T. P., Sun, Y. R., Wang, J., Liu, A. W., and Hu, S. M. (2019). Frequency metrology of molecules in the near-infrared by nice-ohms. Opt. Express 27, 6106–6115. doi:10.1364/oe.27.006106
Jolly, A., Benilan, Y., and Fayt, A. (2007). New infrared integrated band intensities for HC3N and extensive line list for the ν5 and ν6 bending modes. J. Mol. Spectrosc. 242, 46–54. doi:10.1016/j.jms.2007.01.008
Langer, W. D., Schloerb, F. P., Snell, R. L., and Young, J. S. (1980). Detection of deuterated cyanoacetylene in the interstellar cloud TMC 1. Astrophys. J. 239, L125–L128. doi:10.1086/183307
Łodyga, W., Kreglewski, M., Pracna, P., and Urban, Š. (2007). Advanced graphical software for assignments of transitions in rovibrational spectra. J. Mol. Spectrosc. 243, 182–188. doi:10.1016/j.jms.2007.02.004
Mallinson, P. D., and Fayt, A. (1976). High resolution infra-red studies of HCCCN and DCCCN. Mol. Phys. 32, 473–485. doi:10.1080/00268977600103231
McGuire, B. A. (2018). 2018 census of interstellar, circumstellar, extragalactic, protoplanetary disk, and exoplanetary molecules. Astrophys. J. Suppl. S. 239, 17. doi:10.3847/1538-4365/aae5d2
Melosso, M., Bizzocchi, L., Adamczyk, A., Canè, E., Caselli, P., Colzi, L., et al. (2020). Extensive ro-vibrational analysis of deuterated-cyanoacetylene (DC3N) from millimeter-wavelengths to the infrared domain. J. Quant. Spectrosc. Radiat. Transf. 254, 107221. doi:10.1016/j.jqsrt.2020.107221
Melosso, M., Bizzocchi, L., Tamassia, F., Degli Esposti, C., Canè, E., and Dore, L. (2019a). The rotational spectrum of 15ND. Isotopic-independent Dunham-type analysis of the imidogen radical. Phys. Chem. Chem. Phys. 21, 3564–3573. doi:10.1039/c8cp04498h
Melosso, M., Conversazioni, B., Esposti, C. D., Dore, L., Cané, E., Tamassia, F., et al. (2019b). The pure rotational spectrum of 15ND2 observed by millimetre and submillimetre-wave spectroscopy. J. Quant. Spectrosc. Radiat. Transf. 222, 186–189. doi:10.1016/j.jqsrt.2018.10.028
Pickett, H. M. (1991). The fitting and prediction of vibration-rotation spectra with spin interactions. J. Mol. Spectrosc. 148, 371–377. doi:10.1016/0022-2852(91)90393-o
Rivilla, V. M., Colzi, L., Fontani, F., Melosso, M., Caselli, P., Bizzocchi, L., et al. (2020). DC3N observations towards high-mass star-forming regions. Mon. Not. R. Astron. Soc. 496, 1990–1999. doi:10.1093/mnras/staa1616
Stoppa, P., Tasinato, N., Baldacci, A., Charmet, A. P., Giorgianni, S., Tamassia, F., et al. (2016). FTIR spectra of CH2F2 in the 1000–1300 cm−1 region: rovibrational analysis and modeling of the Coriolis and anharmonic resonances in the ν3, ν5, ν7, ν9 and 2ν4 polyad. J. Quant. Spectrosc. Ra. 175, 8–16. doi:10.1016/j.jqsrt.2016.01.035
Tamassia, F., Melosso, M., Dore, L., Pettini, M., Canè, E., Stoppa, P., et al. (2020). Spectroscopy of a low global warming power refrigerant. Infrared and millimeter-wave spectra of trifluoroethene (HFO-1123) in the ground and some vibrational excited states. J. Quant. Spectrosc. Ra. 248, 106980. doi:10.1016/j.jqsrt.2020.106980
Western, C. M. (2017). PGOPHER: a program for simulating rotational, vibrational and electronic spectra. J. Quant. Spectrosc. Radiat. Transf. 186, 221–242. doi:10.1016/j.jqsrt.2016.04.010
Yamada, K., Best, R., and Winnewisser, G. (1983). Diode laser spectrum of HCCCN: CN stretching band. Z. Naturforsch. A. 38, 1296–1308. doi:10.1515/zna-1983-1205
Yamada, K., Schieder, R., Winnewisser, G., and Mantz, A. W. (1980). Diode laser spectrum of HCCCN near 5 μm. Z. Naturforsch. A. 35, 690–693. doi:10.1515/zna-1980-0705
Keywords: cyanoacetylene, interstellar: matter, rovibrational spectroscopy, spectral analysis, infrared spectroscopy
Citation: Jiang N, Melosso M, Tamassia F, Bizzocchi L, Dore L, Canè E, Fedele D, Guillemin J-C and Puzzarini C (2021) High-Resolution Infrared Spectroscopy of DC3N in the Stretching Region. Front. Astron. Space Sci. 8:656295. doi: 10.3389/fspas.2021.656295
Received: 20 January 2021; Accepted: 16 February 2021;
Published: 13 April 2021.
Edited by:
Ryan C. Fortenberry, University of Mississippi, United StatesReviewed by:
Jennifer Van Wijngaarden, University of Manitoba, CanadaShanshan Yu, NASA Jet Propulsion Laboratory (JPL), United States
Copyright © 2021 Jiang, Melosso, Tamassia, Bizzocchi, Dore, Canè, Fedele, Guillemin and Puzzarini. This is an open-access article distributed under the terms of the Creative Commons Attribution License (CC BY). The use, distribution or reproduction in other forums is permitted, provided the original author(s) and the copyright owner(s) are credited and that the original publication in this journal is cited, in accordance with accepted academic practice. No use, distribution or reproduction is permitted which does not comply with these terms.
*Correspondence: Mattia Melosso, bWF0dGlhLm1lbG9zc28yQHVuaWJvLml0