 E. B. Amôres1*
 R. S. Levenhagen2
- 1Departamento de Física, Universidade Estadual de Feira de Santana (UEFS), Feira de Santana, Brazil
- 2Departamento de Física, Universidade Federal de São Paulo, Diadema, Brazil
Despite the impressive advances in Galactic structure studies, thanks to the large astronomical surveys, there remain several open questions. Although at low distances, optical surveys can bring us important information, the potential of NIR surveys, combined with the optical data, should be considered. In the present work, we explore the stellar distribution through the most recent NIR surveys toward low latitudes (|b| < 2° for 20° ≤ ℓ ≤ 346°) in the Galactic disk, such as 2MASS (entire plane), UKIDSS (20° ≤ ℓ ≤ 231°), and VVV-PSF data (295° ≤ ℓ ≤ 346°), avoiding directions toward the Galactic bar and bulge. Our final compilation contains nearly 140 million stars. We used this sample to perform total star counts at different longitudes, obtaining longitudinal profiles that are compared with those of other authors. For some directions, we obtained the stellar density as a function of distance to investigate the stellar distribution in the Galactic disk. As an example, the variation of the counts toward the Scutum arm tangential direction reveals the stellar content of two spiral arms, e.g., Sagittarius and Scutum. These are the preliminary results of a study that will cover a large extension of the Galactic disk.
1 Introduction
Star counts prove to be an essential tool to investigate the structure and the evolution of our Galaxy (Robin et al., 2003) as well as their components, such the bulge, halo, bar, spiral arms, and other structures as warp, flare, ripples, and tidal stream, among others. Thanks to near-infrared surveys, such as 2MASS (Skrutskie et al., 2006), UKIDSS (Lucas et al., 2008), and VVV (Saito et al., 2012), a large development of our knowledge about the Galactic structure is possible. Despite the several works related to the Galactic structure made using the two last surveys that are at least two to three magnitudes deeper than 2MASS, there is not yet a work using both surveys and Gaia data to study the spiral arms’ density for the entire Galactic plane.
The investigation of star counts in the Galactic plane is relevant to study the spiral arms to obtain interstellar extinction maps and parameters of models that reproduce the MW structure. In this regard, the elaboration of star counts’ maps and their analysis can reveal essential structures. For instance, at low Galactic latitudes in the disk, the peaks of longitudinal profiles (i.e., the variation of counts with longitude for a given latitude) are related to the spiral arms’ tangential directions. Here, we mention some works that either analyze or intend to reproduce the tangential direction of those profiles in the inner Galactic disk.
Ortiz and Lépine (1993, hereafter OL) developed a model called PINGAS1 to reproduce the counts in the R, I (both in Johnson’s system), J, H, K, L, 12 and 25 μm bands. The model also incorporates a four arms spiral pattern with tangential directions in agreement with some tracers. Later, Polido et al. (2013) compared the star counts model developed by OL to 2MASS data (J, H, and Ks) for the whole sky. Lépine and Leroy (2000) established a model with four spiral arms and the bar to describe the Galaxy’s sky brightness distribution. They reproduced the infrared brightness predicting tangential directions for instance for ℓ = 30o and 326o.
Drimmel (2000) analyzed the longitudinal profiles pertaining to the region within |b| < 3o and |b| < 9o at K and 240 μm bands using the COBE/DIRBE data (Kelsall et al., 1998). They argued that the tangential directions for the stellar component are compatible with a two-armed structure while the profile of 240 μm, which traces the dust, indicates a pattern of four spiral arms. They also found that two spiral arm patterns are consistent with the old stellar population emission in the K band. Amôres and Lépine, (2005) elaborated two models to describe the interstellar extinction in our Galaxy. In one of them (the spiral model), the extinction grows by step each time the spiral arm crosses. They derived spiral arms representations for HI and HII regions by reproducing the longitude-velocity diagram and the longitudinal profiles for CO, IRAS 100 μm and HI.
Benjamin et al. (2005) performed stellar counts at [4.5] μm using GLIMPSE data and found tangential directions by analyzing stellar counts’ maps. Later, Churchwell et al. (2009) combined GLIMPSE data with 2MASS and identified tangential directions and performed a sketch of our Galaxy’s face-on view. Francis and Anderson (2012) analyzed 2MASS data and developed longitudinal profiles for star counts in the Ks filter for inner Galaxy (b < 1o) as well as produced a sample of stars with kinematic data in order to reproduce the spiral pattern. They argued that MW is a two-armed grand-design bi-symmetric spiral. Hou and Han (2015) performed a detailed study of the spiral structure including the offsets between the density peaks of gas and old stars for spiral arms. They also investigated the longitudinal profiles of star counts in the NIR and MIR.
The longitudinal profiles allow for identifying the tangential directions to the spiral arms and the inter-arm regions. Moreover, the analysis of star counts as a function of distance for a sufficiently wide range of Galactic longitudes around the tangent directions should allow a better understanding and characterization of the stellar density variation in those regions and to map the stellar density contribution of a given spiral arm. The primary purpose of the current article is to present a compilation of the deep near-infrared surveys in the Galactic plane and its application to investigate how the star counts change with the Galactic longitude toward a region near the Scutum’s tangential direction.
We organize this article as follows. Section 2 shows the data from 2MASS + UKIDSS + VVV and Gaia used in the present work. The method of star counts is presented in Section 3. The analysis of the results with the study of the longitudinal profiles and detailed counts of Scutum’s spiral arm is presented in Section 4. Finally, we present the conclusions and perspectives in Section 5.
2 The Dataset
In order to compile the complete dataset in the near-infrared for the Galactic plane, we have used the UKIDSS-DR102 (Lucas et al., 2008) for 19o ≤ ℓ ≤ 105o and 141o ≤ ℓ ≤ 231o and VVV-PSF3 (Alonso-García et al., 2018) for 295o ≤ ℓ ≤ 346o and 2MASS data (Skrutskie et al., 2006), hereafter 2MASS + UKIDSS + VVV data. Each field has a solid angle equal to 0.0625 square degrees (0.25o x 0.25o). The intervals of longitudes were 0.5o and 1.0o for the inner (ℓ ≤ 100o) and outer parts of the Galaxy, respectively. The coverage in the Galactic latitude is |b| ≤ 2o which represents the range of Galactic latitudes in which the bulk of contribution of stellar density takes place (Freudenreich, 1998). In total, there are 8,240 fields, a total coverage of approximately 515 square degrees.
To obtain and select these data, we adopted the recipes in the leading papers of each one of those surveys cited above. For the VVV, we use the VVV-PSF photometry (Alonso-García et al., 2018). We adopted the 2MASS data to complement data for brighter sources and regions with no data in the UKIDSS and VVV coverage. The selection criteria adopted to obtain 2MASS data were the same as those presented in Amôres et al. (2017). As the observations for the UKIDSS survey were performed using the Wide Field Camera (WFCAM) photometric system, we needed to transform their magnitudes into the 2MASS system. We used the relations provided by Wegg et al. (2015; see their Appendix A1). Concerning VVV, as its photometric system is closer to that of 2MASS, we performed cross-matching of 2MASS and unsaturated VVV stars for regions of 0.25 square degrees, and we calibrated the magnitudes o the VVV stars using the 2MASS ones, as also proposed by Wegg et al. (2015). For the record, for most of the fields, the zero-points were approximately 0.02–0.05 mag, and only for a few cases it reached ∼ 0.1 mags; this occurred mostly in the H filter. In our final sample, there are not too many 2MASS stars; this only affects our marginal star counts.
Next, we matched UKIDSS and VVV data with 2MASS for each field of 0.0625 square degrees of area. We have adopted a pairing distance equal to 1 arcsec. However, we noticed that most of the paired sources have distances smaller than 0.2 arcsec. For sources with an entry for both 2MASS + UKIDSS and 2MASS + VVV, we adopted the source identification by either UKIDSS or VVV.
Lucas et al. (2008) mentioned that toward the anti-center, the completeness limit in the K band is 17.0 mag, while it is lower towards crowded regions in the inner Galaxy. In the study of the Galactic bar, Cabrera-Lavers et al. (2008) pointed out a completeness limit of K = 16.0 in the crowded fields. In the present work, we adopt a conservative value equal to K = 16.0 and 17.0 mag toward the inner and outer Galaxy fields, respectively. For the VVV−PSF, we also adopted Ks = 17.0 mag, around at least one magnitude deeper than the aperture values as pointed out by Saito et al. (2012). For 2MASS, we have considered the completeness limits equal to in the J (15.8 mag), H (15.3 mag), and Ks (14.3 mag), respectively. For the record, there are 14,180,077; 42,732,152; and 84,467,872 in our final catalogue observed by 2MASS, UKIDSS, and VVV, respectively, totaling 141,380,101 stars. The total number of 2MASS stars refers to 2MASS stars without counterparts for both UKIDSS and VVV surveys.
To obtain distances, we have used Gaia data. Up to the moment, the Gaia survey has delivered three data releases with data of more than one billion stars, including parallax (ϖ) measurements. However, those data present issues in the determination of one parameter, the parallax (Luri et al., 2018). In order to have a good estimator of distance, we have considered in the present work only stars with a positive parallax and with relative uncertainty in the distance 1/ϖ smaller than 20% (Antoja et al., 2018; Luri et al., 2018). We also have used the Gaia–EDR3 data (Gaia Collaboration, 2020). As Gaia observations were made at optical wavelengths, their data are affected by considerable extinction, causing a decrease in the number of sources with valid properties. For instance, in our study, for approximately 80 fields located at 30o ≤ ℓ < 32o (|b| ≤ 2o) covering five square degrees there are only 3.8% of the sources satisfying the quality condition above.
3 Star Counts and Extinction Correction
The completeness limits were obtained elaborating histograms (star counts as a function of magnitude) for each filter with a bin size equal to 0.2 mag. The bin situated just before the peak of the distribution gives the respective completeness limit. If this limit is greater than the surveys’ completeness limit, we adopted the previous section’s values.
One of the possibilities to correct the magnitudes from the effects of interstellar extinction consists in performing a star by star correction. A general use of this method has being adopted into several works (López-Corredoira et al., 2001; Alard, 2001; Babusiaux and Gilmore, 2005; Cabrera-Lavers et al., 2008; Amôres et al., 2013; Wegg et al., 2015, among others). The main difference among the works resides in the filters in which the correction is applied and the colors and extinction laws, which implies in different extinction correction factors. The discussion of those different factors is outside of the scope of the current article.
We have used a relation that corrects the effects of the interstellar extinction using the color J–Ks. This relation was used by Babusiaux and Gilmore (2005) and Cabrera-Lavers et al. (2008), among the others. So, the corrected magnitude is:
in which Kobs is the magnitude observed and CK = 0.60, the same value obtained by Amôres et al. (2013).
4 Results and Discussion
We performed star counts for all directions considering extinction corrections as described above. To have a compromise between a large number of stars and completeness, we did some tests which were considered limit magnitude, K0, values ranging from 11.0 to 13.5. The comparison between the counts with and without the interstellar extinction correction is outside of the scope of the current article.
Figure 1 shows the star counts map using the interstellar extinction correction. We can see that the main contours are related to the tangent to spiral arms, as indicated in the figure. Another characteristic is an asymmetry between positive and negative longitudes. As pointed out above, the Galactic bulge and bar regions were not involved in the present work. One can partially attribute the the irregularities in the star counts distribution in some regions to the PSF photometry used in VVV data instead of the aperture ones available for UKIDSS data.
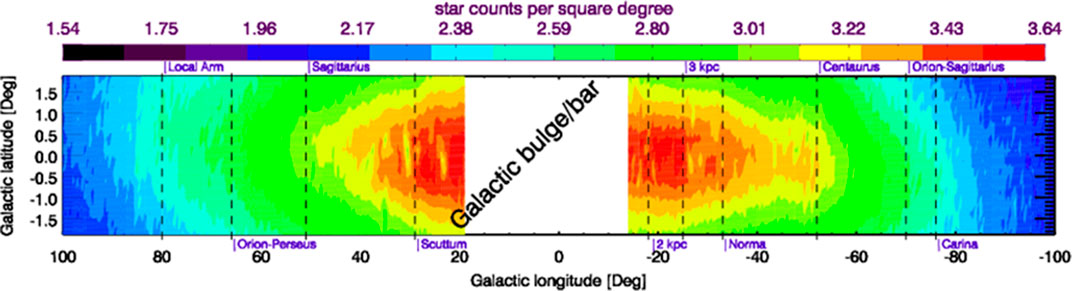
FIGURE 1. Star counts map considering the interstellar extinction correction (counts up to Ks = 11.5 mag). The dashed vertical lines represent the longitude of tangential directions. The name of each one is presented at the top and bottom of the figure.
We notice in the figure, the presence of narrow strips of smaller stellar densities, elongated in the latitude direction, like for instance at ℓ = 33° and ℓ = 25°, approximately. Such strips are possibly due to the presence of dust lanes seen in tangential directions. With such geometry, the line-of sight crosses the dust lane along a long path, giving rise to a large extinction and a decrease in the number of counted stars. Since the dust lanes, as seen in external galaxies, are normally located on the side of a spiral am, the tangential directions of the dust lane and of the arm should not be distant in longitude. Note that the two directions that we are discussing can be seen as valleys in Figure 2.
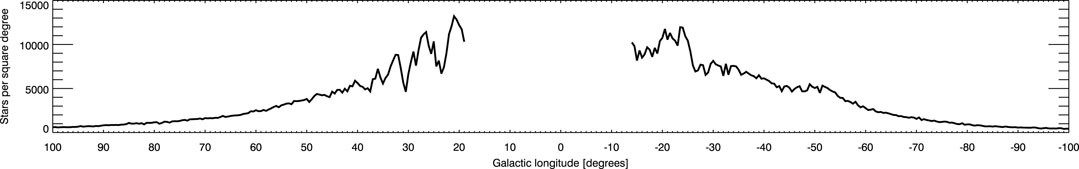
FIGURE 2. Longitudinal profiles (counts up to K0 = 11.5 mag) for |b| ≤ 0.5o.
The VVV survey coverage ends toward ℓ ∼ -65°, and for this reason, there is a significant decrease in the stellar counts toward this longitude. With the VVVX (Minniti, 2016) which is expanding the VVV observations in the Galactic disk and in the bulge, it will be possible to perform more studies of these regions in the future. We also noticed that the Carina arm, with a peak at ℓ ∼ -81°, is also consistent with the value of ℓ ∼ -82° found by OL.
Another way to analyze those maps consists of dividing the Galactic latitudes into sections. Figure 2 shows the longitudinal profiles (|b| ≤ 0.50o) for the inner Galaxy. Next, we discuss some features observed in this profile. Starting the analysis at negative longitudes (Figure 2), a double peak is related to the 3 kpc-arm (ℓ ∼ -25° to -20°). In comparison with Francis and Anderson (2012) the peak for this direction is not so pronounced in their work; also, the number of stars (only 2MASS) is reduced compared to what we obtained. In Churchwell et al. (2009), this peak is also visible, and the range of Galactic longitude is also broader than that found by us, while OL obtained ℓ ∼ -23°.
The Norma spiral arm feature can be seen from ℓ ∼ -40° to -30° in Figure 2. Vallée (2014) pointed out that the tangential direction (from several tracers) is ranging from ℓ equal to -37° to -28°, while for Francis and Anderson (2012) the range is -40° to -36° (our second peak in the middle panel), for both Benjamin et al. (2005) and Churchwell et al. (2009) this feature is from ℓ -35° to -28° and ℓ = -34° (OL).
In our profile, the Sagittarius tangential direction is located at ℓ ∼ 42°. Our value is consistent to ℓ ∼ 43° found by Francis and Anderson (2012). On the other hand, Churchwell et al. (2009) and Benjamin et al. (2005) placed it from 45° < ℓ < 50° and OL at ℓ ∼ 55.3°. The Local Arm tangential direction is located at ℓ ∼ 80° in our profile and for Drimmel (2000).
The peak at ℓ ∼ 28° is related to the Galactic bar positive extremity (Cabrera-Lavers et al., 2008). The tangential direction to the Scutum tangential direction is pointed out by Francis and Anderson (2012) at ℓ ∼ -29°, while the authors placed the inner/outer limits at 26° and 34°. However, as we mentioned, the inner limit is related to the Galactic bar’s positive edge. We showed that this arm feature expands from 30° to 35° with a peak at ℓ ∼ 32° that is also in agreement with the values pointed out by Vallée (2014) and Hou and Han (2015). In addition, OL found a tangential direction at ℓ ∼ 30.1°. Hou and Han (2015) also found that the stellar arms are exterior to the gas arms, traced for instance by HI and CO.
To carry out a better study of the stellar density excess associated with a given spiral arms, it is important to analyze the star counts as a function of distance over a range of Galactic longitudes. This would allow, in principle, to observe the variation of the distance of the arm with the longitude, which is a way of mapping the “stellar” arm. Furthermore, if the arm presents a tangential direction, this should be detectable as a large excess of counts, presenting a significant contrast in the density compared to the neighboring regions, that is, before and after this direction. However, if there is a tangential direction toward a dust lane, we expect a significant decrease in the star counts. To prepare for such a deeper study of a wide region around the tangential direction to the Scutum spiral arm, which we are willing to present as an example, we have considered the longitudinal range from 29° to 35°.
Figure 3 shows the counts as a function of distances for this region for intervals of 0.5 degrees. It is considered all-stars for |b| ≤ 0.5 degrees and within ± 0.125 degrees of the center of Galactic longitude shown at the top of each panel. We have used our sample with common stars identified in the match NIR surveys and Gaia-EDR3. As the longitude increases from ℓ = 30.5°, there is also an increase in the counts, reaching a maximum at ℓ= 32.0o, decreasing after this direction, see the discussion below.
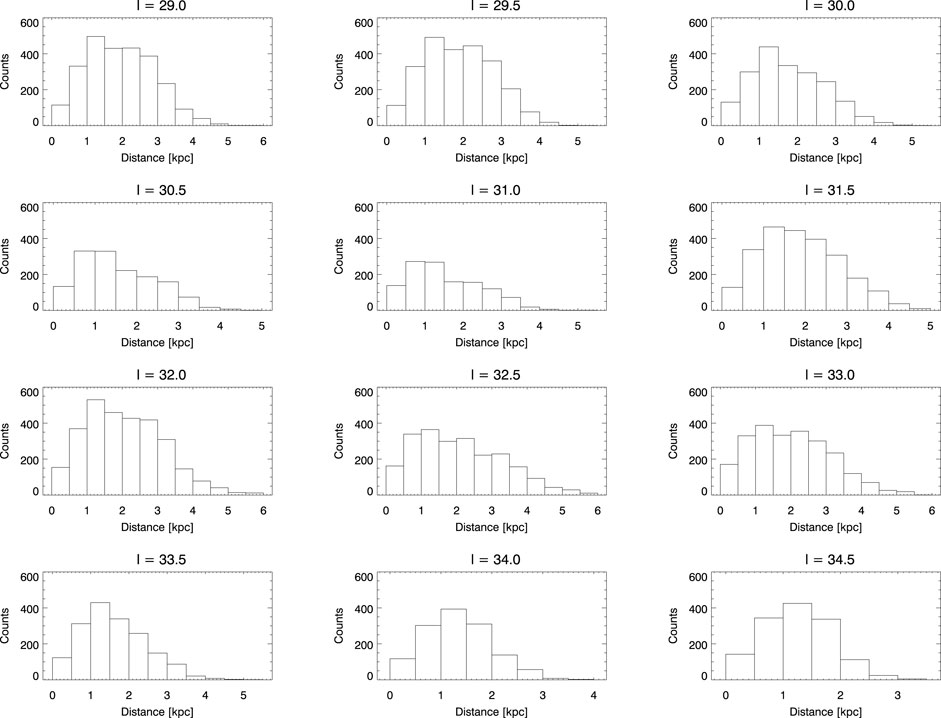
FIGURE 3. Histograms of counts for distances (for |b| ≤ 0.5o) in Gaia-EDR3. The Galactic longitudes (± 0.250) are shown in the title of each panel.
It can be seen in Figure 4 that the three curves rise quickly in a similar way as we go farther from the Sun. This happens because the effective area of the bins increase, and the stellar density in the Galactic disk grows exponentially toward the Galactic center. The first event that occurs along these line-of-sights is the crossing of the Sagittarius–Carina arm, at a distance of about 1.4 kpc. We chose all these line-of sights going along the latitude b = -1°, to take into account that the Sun is situated at about z = 20 pc above the Galactic plane. Although it is a small angle, it favored the star counts at the Sagittarius arm distance. The 1.4 kpc distance coincides with the region where the incompleteness of the Gaia sample starts to be effective and to return the curves to flat and then to negative slopes, as seen at 2 kpc, for instance. However, at 1.4 kpc, the incompleteness is only starting and the density peak due to the Sagittarius arm is still visible.
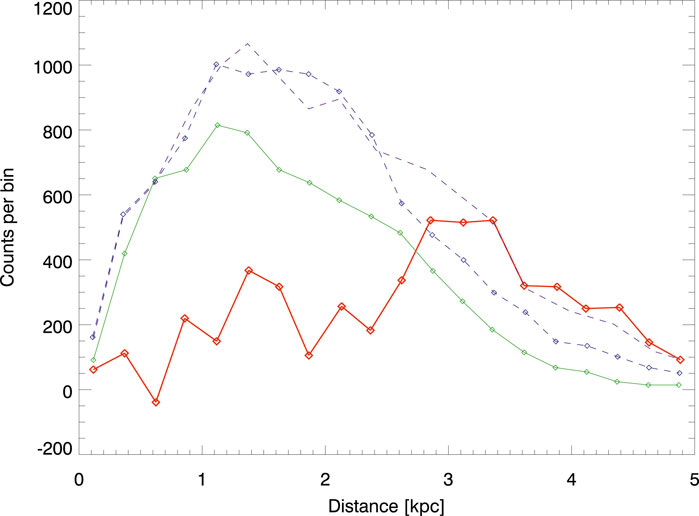
FIGURE 4. Star counts as a function of distance from the Sun, for 3 close Galactic longitudes, ℓ = 30.5° (green), 32.0° (violet), and 33.5° (blue). The red curve represents the counts ℓ32 after subtraction of the mean of the other two line-of-sights, (ℓ30.5 + ℓ33.5)/2. The counts of the red line where multiplied by 2 for better visibility.
The next event should be the tangential direction to the Scutum arm, expected at 5 kpc from the Sun. At such distance the star counts drop to zero due to total incompleteness. Nevertheless, a peak appears in the red curve at about 3.4 kpc. This red curve was obtained by subtracting the “background” defined by ℓ = 30.5° and ℓ = 33.5°. Indeed, this peak is related only to the ℓ = 32.0° direction, which favors its identification with the tangential direction the Scutum arm. Possible explanations for the presence of an excess of stellar density at 3.3 kpc is that the tangential point is not really point-like; in a tangential direction, the line of sight and the spiral arm are almost coincident over an interval of distance. Furthermore, the Scutum arm could be at a slightly larger Galactic radius than the one that we adopted, as this radius and the exact shape of the arm are poorly determined. Note that the background that we subtract is not symmetric, since the counts at ℓ = 30.5° are lower than at ℓ = 32.0°. The ℓ = 30.5° line of sight is possibly affected by a dust lane, as already discussed.
We can also investigate the density distribution as a function of Galactic longitude, elaborating color-magnitude diagrams, Ks, J—Ks. Babusiaux and Gilmore (2005) pointed out that by adopting a reddening independent magnitude, the effect of the extinction and distance can be separated, a star of a given spectral type moves vertically with distance and horizontally with extinction. Figure 5 shows the color-magnitude diagrams for several longitudes for |b| ≤ 0.5. One can also see how the density increases, also reaching a maximum at ℓ = 32.0°.
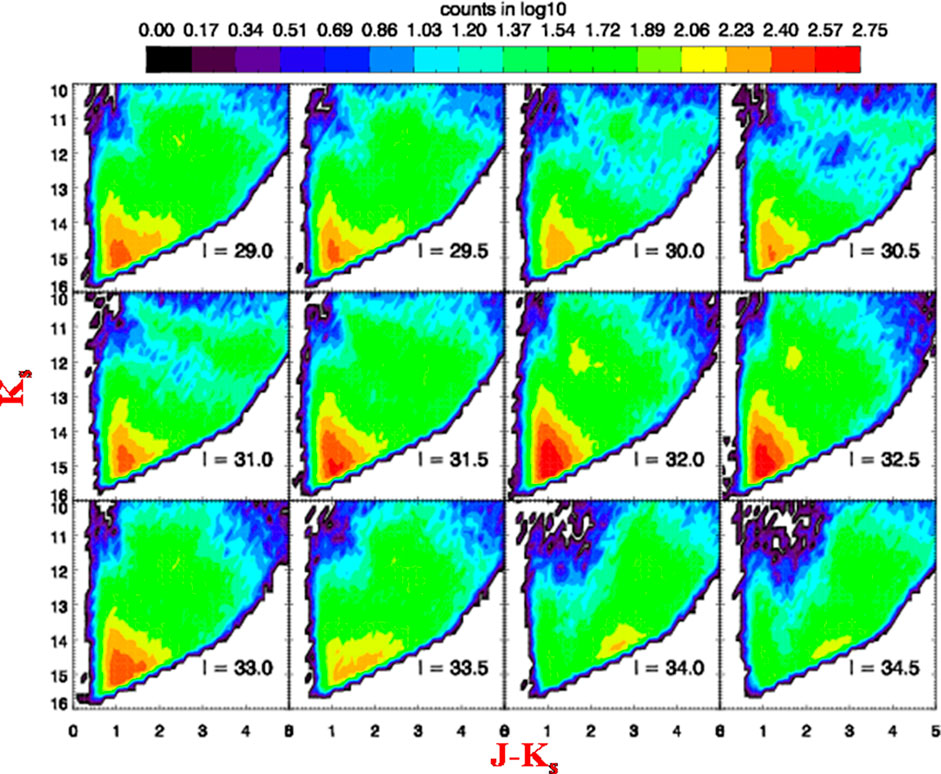
FIGURE 5. Color-magnitude diagrams for Galactic longitudes from ℓ = 29°–34.5°.The Galactic longitudes (±0.250°) are shown in each panel.
5 Conclusions
The Galactic plane study is critical to better describe some Galactic structure properties, as the spiral arms positions and densities. We have compiled a large deep NIR catalogue combined with Gaia-EDR3 data based on public surveys that allow us to perform star counts in the present work. We have analyzed the star counts in the Galactic plane, identifying by mapping and from a longitudinal profile of the tangential directions to the spiral arms in the Galaxy. From those directions, we have concentrated our study in the Scutum tangential direction (ℓ = 32.0o) in a preliminary study. By using Gaia-EDR3 distances and color-magnitude diagrams we have presented the count’s variation toward this direction.
Data Availability Statement
Publicly available datasets were analyzed in this study. These data can be found here: 2MASS (https://cdsarc.unistra.fr/viz-bin/cat/II/246), UKIDSS (https://dataverse.harvard.edu/dataverse/UKIDSS), VVV (http://horus.roe.ac.uk/vsa/) and a Gaia-EDR3 data.
Author Contributions
These authors have contributed equally to this work.
Conflict of Interest
The authors declare that the research was conducted in the absence of any commercial or financial relationships that could be construed as a potential conflict of interest.
Publisher’s Note
All claims expressed in this article are solely those of the authors and do not necessarily represent those of their affiliated organizations, or those of the publisher, the editors and the reviewers. Any product that may be evaluated in this article, or claim that may be made by its manufacturer, is not guaranteed or endorsed by the publisher.
Acknowledgments
We are very grateful to JL for the invitation to participate in this Edition, the encouraging and insightful discussions. We also thank you very much to both referees for the handy comments that helped us improve the paper quality and the staff of Frontiers for all support. We gratefully acknowledge use of data from the ESO Public Survey program ID 179.B-2002 taken with the VISTA telescope, data products from the Cambridge Astronomical Survey Unit, and funding from the FONDAP Center for Astrophysics 15010003, the BASAL CATA Center for Astrophysics and Associated Technologies PFB-06, the MILENIO Milky Way Millennium Nucleus from the Ministry of Economy’s ICM grant P07-021-F, and the FONDECYT from CONICYT. This publication made use of data products from the Two Micron All Sky Survey, which is a joint project of the University of Massachusetts and the Infrared Processing and Analysis Center/California Institute of Technology, funded by the National Aeronautics and Space Administration and the National Science Foundation. This work is based in part on observations made with the Spitzer Space Telescope, which is operated by the Jet Propulsion Laboratory, California Institute of Technology under a contract with NASA. This work is based in part on data obtained as part of the UKIRT Infrared Deep Sky Survey. This work presents results from the European Space Agency (ESA) space mission Gaia. Gaia data are being processed by the Gaia Data Processing and Analysis Consortium (DPAC). Funding for the DPAC is provided by national institutions, in particular the institutions participating in the Gaia MultiLateral Agreement (MLA). The Gaia mission website is https://www.cosmos.esa.int/gaia. The Gaia archive website is https://archives.esac.esa.int/gaia. This research has made use of the VizieR catalogue access tool, CDS, Strasbourg, France.
Footnotes
1http://www.astro.iag.usp.br/∼jacques/pingas.html.
2http://wsa.roe.ac.uk/index.html.
3http://horus.roe.ac.uk/vsa/index.html.
References
Alard, C. (2001). Another Bar in the Bulge. Astron. Astrophysics 379, L44–L47. doi:10.1051/0004-6361:20011487
Alonso-García, J., Saito, R. K., Hempel, M., Minniti, D., Pullen, J., Catelan, M., et al. (2018). Milky Way Demographics with the VVV Survey. Astron. Astrophysics 619, A4. doi:10.1051/0004-6361/201833432
Amôres, E. B., and Lépine, J. R. D. (2005). Models for Interstellar Extinction in the Galaxy. Astron. J. 130 2, 659–673. doi:10.1086/430957 https://ui.adsabs.harvard.edu/abs/2005AJ....130..659A
Amôres, E. B., López-Corredoira, M., González-Fernández, C., Moitinho, A., Minniti, D., and Gurovich, S. (2013). The Long Bar as Seen by the VVV Survey. Astron. Astrophysics 559, A11. doi:10.1051/0004-6361/201219846
Amôres, E. B., Robin, A. C., and Reylé, C. (2017). Evolution over Time of the Milky Way's Disc Shape. Astron. Astrophysics 602, A67. doi:10.1051/0004-6361/201628461
Antoja, T., Helmi, A., Romero-Gómez, M., Katz, D., Babusiaux, C., Drimmel, R., et al. (2018). A Dynamically Young and Perturbed Milky Way Disk. Nature 561, 360–362. doi:10.1038/s41586-018-0510-7
Babusiaux, C., and Gilmore, G. (2005). The structure of the Galactic bar. Monthly Notices Roy. Astron. Soc. 358, 1309–1319. doi:10.1111/j.1365-2966.2005.08828.x
Benjamin, R. A., Churchwell, E., Babler, B. L., Indebetouw, R., Meade, M. R., Whitney, B. A., et al. (2005). First GLIMPSE Results on the Stellar Structure of the Galaxy. ApJ 630, L149–L152. doi:10.1086/491785
Cabrera-Lavers, A., González-Fernández, C., Garzón, F., Hammersley, P. L., and López-Corredoira, M. (2008). The Long Galactic Bar as Seen by UKIDSS Galactic Plane Survey. Astron. Astrophysics 491, 781–787. doi:10.1051/0004-6361:200810720
Churchwell, E., Babler, B. L., Meade, M. R., Whitney, B. A., Benjamin, R., Indebetouw, R., et al. (2009). TheSpitzer/GLIMPSE Surveys: A New View of the Milky Way. Publ. Astron. Soc. Pac. 121, 213–230. doi:10.1086/597811
Drimmel, R. (2000). Evidence for a Two-Armed Spiral in the Milky Way. Astron. Astrophysics 358, L13–L16.
Francis, C., and Anderson, E. (2012). Evidence of a Bisymmetric Spiral in the Milky Way. MNRAS 422, 1283–1293. doi:10.1111/j.1365-2966.2012.20693.x
Freudenreich, H. T. (1998). ACOBEModel of the Galactic Bar and Disk. ApJ 492, 495–510. doi:10.1086/305065
Gaia Collaboration (2020). VizieR Online Data Catalog: Gaia EDR3 (Gaia Collaboration, 2020). VizieR Online Data Catalog: I/350.
Hou, L. G., and Han, J. L. (2015). Offset between Stellar Spiral Arms and Gas Arms of the Milky Way. Mon. Not. R. Astron. Soc. 454, 626–636. doi:10.1093/mnras/stv1904
Kelsall, T., Weiland, J. L., Franz, B. A., Reach, W. T., Arendt, R. G., Dwek, E., et al. (1998). The Cobe Diffuse Infrared Background Experiment Search for the Cosmic Infrared Background. II. Model of the Interplanetary Dust Cloud. ApJ 508, 44–73. doi:10.1086/306380
Lépine, J. R. D., and Leroy, P. (2000). A New Model for the Infrared Brightness of the Galaxy. Monthly Notices R. Astronomical Soc. 313, 263–270. doi:10.1046/j.1365-8711.2000.03227.x
López-Corredoira, M., Hammersley, P. L., Garzón, F., Cabrera-Lavers, A., Castro-Rodríguez, N., Schultheis, M., et al. (2001). Searching for the in-plane Galactic bar and ring in DENIS. Extragalactic Astron. 373, 139–152. doi:10.1051/0004-6361:20010560
Lucas, P. W., Hoare, M. G., Longmore, A., Schröder, A. C., Davis, C. J., Adamson, A., et al. (2008). The UKIDSS Galactic Plane Survey. Monthly Notices R. Astronomical Soc. 391, 136–163. doi:10.1111/j.1365-2966.2008.13924.x
Luri, X., Brown, A. G. A., Sarro, L. M., Arenou, F., Bailer-Jones, C. A. L., Castro-Ginard, A., et al. (2018). Gaia Data Release 2. Astron. Astrophysics 616, A9. doi:10.1051/0004-6361/201832964
Minniti, D. (2016). “VVVX: A New Survey of the Milky Way Bulge, Disk and Inner Halo,” in Galactic Surveys: New Results on Formation, Evolution, Structure and Chemical Evolution of the Milky Way, Proceedings of the Conference Held 25-29 January, 2016 in Sesto (BZ) Italy (Sexten: The SAO/NASA Astrophysics Data System), 10.
Ortiz, R., and Lépine, J. R. D. (1993). A model of the galaxy for predicting star counts in the infrared. Astron. Astrophys. 279, 90–106.
Polido, P., Jablonski, F., and Lépine, J. R. D. (2013). A Galaxy Model from Two Micron All Sky Survey Star Counts in the Whole Sky, Including the Plane. ApJ 778, 32. doi:10.1088/0004-637X/778/1/32
Robin, A. C., Reylé, C., Derrière, S., and Picaud, S. (2003). A Synthetic View on Structure and Evolution of the Milky Way. Astron. Astrophys. 409, 523–540. doi:10.1051/0004-6361:20031117
Saito, R. K., Hempel, M., Minniti, D., Lucas, P. W., Rejkuba, M., Toledo, I., et al. (2012). VVV DR1: The First Data Release of the Milky Way Bulge and Southern Plane from the Near-Infrared ESO Public Survey VISTA Variables in the Vía Láctea. Astron. Astrophysics 537, A107. doi:10.1051/0004-6361/201118407
Skrutskie, M. F., Cutri, R. M., Stiening, R., Weinberg, M. D., Schneider, S., Carpenter, J. M., et al. (2006). The Two Micron All Sky Survey (2MASS). Astron. J. 131, 1163–1183. doi:10.1086/498708
Vallée, R. B. (2014). Catalog of Observed Tangents to the Spiral Arms in the Milky Way Galaxy Apjs 215. doi:10.1088/0067-0049/215/1/1
Keywords: Galactic structure, star counts, near-infrared, interstellar extinction, large surveys, spiral arms
Citation: Amôres EB and Levenhagen RS (2021) Deep NIR Surveys in the Galactic Plane: A General Overview and the Study of Scutum’s Spiral Arm. Front. Astron. Space Sci. 8:665059. doi: 10.3389/fspas.2021.665059
Received: 07 February 2021; Accepted: 31 August 2021;
Published: 29 October 2021.
Edited by:
Jacques R D Lépine, University of São Paulo, BrazilReviewed by:
J. Allyn Smith, Austin Peay State University, United StatesVadim Vadimovich Bobylev, Pulkovo Observatory (RAS), Russia
Copyright © 2021 Amôres and Levenhagen. This is an open-access article distributed under the terms of the Creative Commons Attribution License (CC BY). The use, distribution or reproduction in other forums is permitted, provided the original author(s) and the copyright owner(s) are credited and that the original publication in this journal is cited, in accordance with accepted academic practice. No use, distribution or reproduction is permitted which does not comply with these terms.
*Correspondence: E. B. Amôres, ZWJhbW9yZXNAdWVmcy5icg==