 Viviane Pierrard
 Edith Botek1
 Fabien Darrouzet
- 1Royal Belgian Institute for Space Aeronomy, Solar-Terrestrial Center of Excellence (STCE) and Space Physics, Brussels, Belgium
- 2Center for Space Radiations (CSR) and Georges Lemaître Center for Earth and Climate Research (TECLIM), Earth and Life Institute (ELI), Université catholique de Louvain (UCLouvain), Louvain-la-Neuve, Belgium
In this perspective paper, we review and discuss different ways that can be used to improve the predictions of the models of the plasmaspheric region. The density of the background cold plasma and the plasmapause position are very important to determine the formation and propagation of waves and interactions with the other regions of the magnetosphere. Improvement of predictions includes refinement of the forecast of the geomagnetic indices that influence the density and the temperature of the particles in some models. Progress is also necessary for the understanding of the physical processes that affect the position of the plasmapause and its thickness since this boundary is not always very sharp, especially during low geomagnetic activity. These processes include the refilling after geomagnetic storms and substorms, the links with the ionosphere, and the expanding plasmaspheric wind during prolonged quiet periods. Using observations from in situ satellites like Van Allen Probes (EMFISIS and HOPE instruments), empirical relations can be determined to improve the dependence of the density and the temperature as a function of the radial distance, the latitude, and the magnetic local time, inside and outside the plasmasphere. This will be the first step for the improvement of our 3D dynamic SWIFF plasmaspheric model (SPM).
Introduction
The plasmasphere is the extension of the ionosphere at low and mid-latitudes and is filled by low-energy plasma (Lemaire and Gringauz, 1998). Observations of Cluster and IMAGE (Imager for Magnetopause-to-Aurora Global Exploration) spacecraft have provided a new insight into this region (Darrouzet et al., 2009), recently completed by the measurements of Van Allen Probes (Ren et al., 2018). Different empirical and physics-based models have been developed to reproduce the inner region of the magnetosphere and its boundary called the “plasmapause” [see Pierrard et al. (2009) for a review]. It is quite difficult to compare all the existing models, since some are purely empirical (e.g., Sheeley et al., 2001), based on data assimilation; some are an amalgam of different analytical relations (e.g., Gallagher et al., 2000), and others more physics based, e.g., the Dynamic Global Core Plasma Model (DGCPM) of Ober et al. (1997), the fluid model SAMI3 (Huba et al., 2008), or the Ionosphere-Plasmasphere IP model (Maruyama et al., 2016)]. The physical mechanisms can vary in different models, following the theoretical approaches, including the formation of the plasmapause (Lemaire and Pierrard, 2008). Moreover, the results of the models may depend on the magnetic and electric fields used (Pierrard et al., 2008; Reinisch et al., 2009). Any progress in the understanding of the physical processes and in the magnetic/electric fields is thus relevant to any plasmasphere model advance. Recent developments to model the plasmasphere include monitoring tools based on VLF transmitters (Koronczay et al., 2018). Improvement of any plasmaspheric model means reaching higher precision and sophistication to give the most realistic reproduction of this cold region of the magnetosphere, but the computing time has to be kept sufficiently low to make manageable predictions.
Since each model has advantages and disadvantages, in the present perspective paper, we will not make intercomparisons but focus on the advances that would be useful for any model. These developments are in progress or are planned for the physics-based SWIFF Plasmasphere Model (SPM), a 3D dynamic kinetic model of the plasmasphere first developed by Pierrard and Stegen (2008) and that will be used here to illustrate the results. The SPM model is based on physical mechanisms, including interchange instability for the formation of the plasmapause (Pierrard and Lemaire, 2004), and provides the density and the temperature of the electrons, protons, and other ions, both inside and outside the plasmasphere. Semi-empirical relations derived from previous spacecraft observations are used to determine the electric field from geomagnetic activity indices (Pierrard et al., 2008) and calculate the plasmapause position and the plasmaspheric density. The input of the model is the date that determines the geomagnetic indices Kp and Dst. These indices may be predicted values when forecasting is required, or definitive observed values when past events are simulated. They determine also the convection electric field. The outputs of the model are the plasmapause positions, densities, and temperatures of the different particles in 3D at any position (inside and outside the plasmasphere), defined by the McIlwain (1966) parameter L in Earth radii (Re), the geomagnetic latitude and the magnetic local time (MLT), in geocentric solar magnetospheric (GSM) coordinates, at any required UT time.
The plasmasphere model has been coupled with the ionosphere, using the empirical International Reference Ionosphere, IRI, (Bilitza, 2018) as a boundary condition (Pierrard and Voiculescu, 2011) in the framework of the SWIFF (Space Weather Integrated Forecasting Framework) project that allowed coupling of models for different regions of the magnetosphere (Lapenta et al., 2013). SPM simulations are provided on a near-real-time basis at the ESA SSA (Space Situational Awareness) website (https://swe.ssa.esa.int/space-radiation) since January 2017. Data produced since then are archived and available for visualization from the site. This product enables a continued and quick assessment of electron density plasmasphere conditions, which is critical to monitor the spacecraft's electronic performances when traversing or staying at orbits nearby the Earth. The model will also be made available on the Virtual Space Weather Modeling Center (https://esa-vswmc.eu/) and on the H2020 PITHIA-NRF (Plasmasphere Ionosphere Thermosphere Integrated Research Environment and Access services: a Network of Research Facilities) platform, collecting data and models for the ionosphere and plasmasphere.
Table 1 summarizes the main characteristics of the SPM model, its strengths and weaknesses, as well as the possibilities of improvement that will be explained in more detail in the next sections. These ways to improve the SPM model may be applicable also to other plasmaspheric models. The progress possibilities first explore advances in the relations based on new satellite observations with higher resolution and precision (section Improvement of the Physical Relations by Comparing With New Satellite Data), followed by the refinements of predictions of geomagnetic activity (section Improve Predictions of Kp and Other Geomagnetic Indices), then the evaluation of the thickness of the plasmapause (PP) boundary related to the refilling and plasmaspheric wind (section Thickness of the Plasmapause Associated to Refilling and Plasmaspheric Wind), and, finally, the coupling with the ionosphere, influencing the composition and the temperature (section Coupling With the Ionosphere, Composition, and Temperature). In addition to the plasmasphere, the consideration of the low density in the region of the plasma trough is important to model because of the development of waves interacting with the other regions of the magnetosphere. We discuss and summarize all these possibilities in the last section—section Discussion and Conclusions.
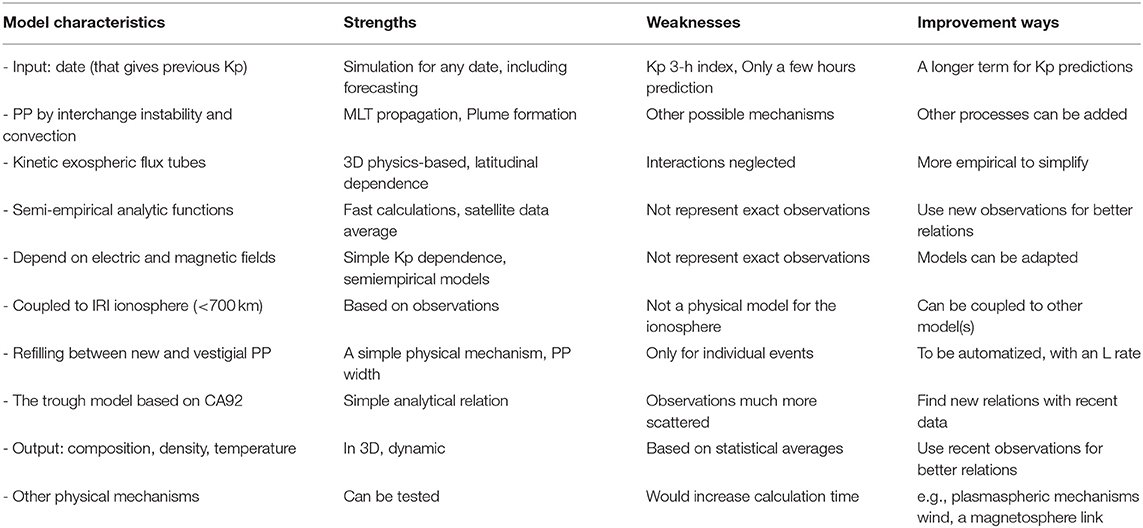
Table 1. Main characteristics of the SPM model, its present strengths and weaknesses, and the possibilities for improvements.
Improvement of the Physical Relations by Comparing With New Satellite Data
The SPM electron density calculations correspond to continuous predictions in a space-time coordinate system. Note that high precision in the coordinate system (and in the eventual changes of coordinates) is important to simulate correctly any space region of the magnetosphere. The model calculates the density every half hour for any L value (in Re), longitude (MLT), and latitude. The main way of validation and improvement of the model consists in the refinement of the semiempirical relations, linking the densities and temperatures with the geomagnetic indices at different positions. The SPM model has been already compared and validated against different spacecraft observations: global views of the plasmasphere obtained from the satellite IMAGE have shown that the model well-reproduced the formation of plumes in the dusk sector during geomagnetic storms (Pierrard and Cabrera, 2005, 2006; Darrouzet et al., 2008); CRRES observations have shown that the plasmasphere density as a function of the geomagnetic activity indices is realistic in the model (Bandic et al., 2016); the MLT propagation of plasmapause structures (Bandic et al., 2017, 2020) was also confirmed by studies based on the observations of the satellites Cluster (Darrouzet et al., 2006, 2013; Verbanac et al., 2015) and THEMIS (Bandic et al., 2017; Verbanac et al., 2018), for instance.
The high-resolution measurements of the Van Allen Probes (VAP), previously called “Radiation Belt Storm Probes” (RBSP), provide new possibilities to validate and improve the empirical relations used in a plasmasphere model, and, especially, in the plasma trough region where the low densities made hard previous observations. VAP was a mission of two spacecraft (A and B) launched in 2012 in tandem along a highly elliptic orbit (perigee of 618 km and apogee of 30,414 km), with 10.2° of inclination and a period of around 9 h (Mauk et al., 2013). The two spacecraft carry identical instruments: the Electric and Magnetic Field Instrument Suite and Integrated Science (EMFISIS) that contains the Waves instrument, a triaxial search coil magnetometer, and sweep frequency receiver. It provides a single electric field component of waves from 10 to 400 kHz in order to measure the spectrum of electron cyclotron harmonic emissions and to measure the frequency of the upper hybrid resonance band, thereby providing an accurate determination of the electron density (Kurth et al., 2015). Data are available at https://emfisis.physics.uiowa.edu/Flight/ from 2012 to 2019. The spacecraft have finished operations in October 2019.
Electron density data obtained by EMFISIS are used for comparison and improvement of the model by filtering out values >2,000 cm−3. This threshold is related to the limited response above 400 kHz of the Waves instrument (Kletzing et al., 2013).
The top left panel of Figure 1 illustrates the electron densities Ne in cm−3, determined by Van Allen Probe A during a typical month, here chosen to be June 2015, as a function of the corresponding SPM simulations at the same times and positions, using definitive Kp values as input (bottom panel, in green). The color scale corresponds to the McIlwain L values in Re. Due to the upper frequency limit of EMFISIS, comparisons between the model and the data are only made for locations L > 2. One can see that the data are located close to the 1:1 diagonal in the range L ≈ 2–4.5, which principally scans the plasmasphere density, indicating a good global performance of the model in this L range. The clear distinction between low L-high densities and high L-low densities corresponds to a bimodal distribution with a plasmapause separating the plasmasphere and the plasma trough. In this plasma trough region, i.e., beyond the plasmapause limit (typically for L > 5.5 during quiet times), the model uses analytical equations deduced by Carpenter and Anderson (1992) (CA92). The density of the trough model is often too low and less scattered in comparison to VAP data, which is not surprising since the simulated trough densities are obtained from averaged statistical results, while the EMFISIS observations concern event intervals that are strongly dependent on the strength of the most recent erosion. The CA92 model represents better the observed trough when Kp is high. This early model and other subsequent models of trough and plasmasphere density can now be revisited, using the new and extensive EMFISIS dataset, taking more into account the MLT and geomagnetic activity dependence, even if during high disturbances the observations can be affected by noise in the low-density plasmatrough [see discussions in Kurth et al. (2015) about the complexity of distinguishing between wavebands]. Other spacecraft, like Arase (Kasahara et al., 2018) for instance, can also be used for comparison and improvement of the models inside and outside the plasmasphere, but measurement errors are also significant in the low-density trough region.
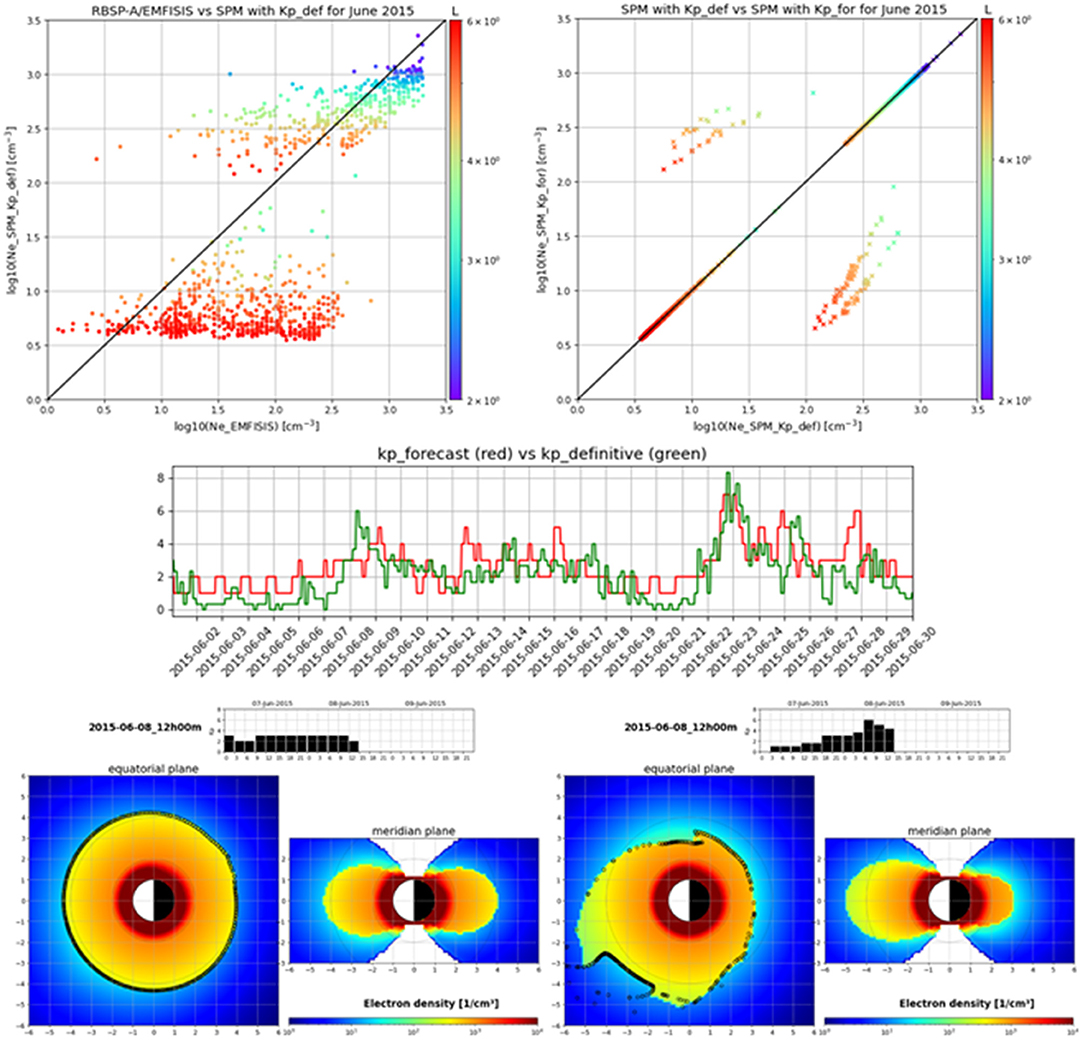
Figure 1. Top left: A scatter plot of the electron densities Ne in cm−3 in logarithmic scale observed by VAP-A/EMFISIS satellite for June 2015 (x-axis) as a function of the corresponding simulated data (y-axis), evaluated by the SPM model at the same times and positions and using the definitive Kp indices. The color scale corresponds to the McIlwain L values. Top right: A scatter plot of the electron densities Ne in cm−3 in logarithmic scale of the SPM model, using the definitive Kp (x-axis) as a function of those obtained with the predicted Kp (y-axis). Middle panel: Comparison between the Kp forecast from NOAA (red) and the corresponding definitive values from POTSDAM (green) during June 2015. Bottom panels: Density of the electrons (color scale), obtained with the SPM model for 8 June 2015 at 12h00, with the Kp values as predicted (left panels) and with Kp as observed (right panels). The SPM model shows the density in the geomagnetic equatorial plane and in the meridian plane. Kp during the previous 36 h is also illustrated.
Improve Predictions of KP and Other Geomagnetic Indices
The time variations of the plasmasphere mainly depend on the geomagnetic activity level, determined mainly by activity indices like the planetary Bartels index Kp and Dst (Disturbed Storm Time). High-precision predictions of the plasmasphere model need thus a first realistic forecast of these indices. Figure 1 (middle panel) illustrates in red the Kp forecast (https://www.swpc.noaa.gov/products/3-day-geomagnetic-forecast), compared with the definitive indexes (ftp://ftp.gfz-potsdam.de/pub/home/obs/kp-ap/tab/) in green (that were used in the model simulations of Figure 1, top left panel). Locally huge discordances between forecasted and definitive Kp can sometimes be observed; for example, around June 8th or 25th, 2015. Despite predictions present strong deviations, the whole forecast of the month represents, in general, a good estimation of the geomagnetic perturbations. The top right panel of Figure 1 shows the scatter plot of the electron densities obtained with the SPM model, using the definitive Kp (x-axis) as a function of those obtained with the predicted Kp (y-axis). In a period of 1 month, the overall prediction performance of the model is only slightly reduced when the forecasted Kp is used instead of the definitive indices. Only a few points are modified since the Kp of the previous 24 h mainly determines the convection and thus the plasmapause position as a function of the MLT in the model.
Bottom panels of Figure 1 show typical results of the model, i.e., the density of the electrons obtained by the model in the geomagnetic equatorial plane and in the meridian plane with the predicted Kp values (two left bottom panels), while the two right panels show the results of the model, using the observed Kp, here for June 8, 2015, at 12h00. The black diamonds show the position of the plasmapause in the equatorial plane. One can see that an increase of Kp (as observed on June 8, 2015, see bottom right panels) leads to the formation of a plume with L > 5 in the afternoon-dusk MLT sector and a low plasmapause in the postmidnight sector. The plasmasphere erosion due to (sub)storms starts at the nightside evolves during the morning, and the associated formation of plumes and their rotation occur at afternoon and evening MLT times. These mechanisms depend strongly on the geomagnetic activity level.
A constant Kp (as obtained from Kp predictions on June 8) gives an almost circular plasmapause in the equatorial plane. When Kp is misestimated, major differences are thus obtained with the model in the region close to the plasmapause, with high overestimation or underestimation if the position is just below or just above the actual plasmapause position, as illustrated in the top right panel of Figure 1. For particular events, the differences can be high, as illustrated in the bottom panels. Of course, any model driven by indices such as Kp or Dst, or any other empirically derived average inputs will never be able to reproduce each individual observation, simply because the inputs to the model are purely empirical averages. But realistic simulations can be obtained, especially when initial conditions correspond to observations.
Thickness of the Plasmapause Associated to Refilling and Plasmaspheric Wind
The model provides the radial distance of the plasmapause in the geomagnetic equatorial plane. This is crucial because the density can be very different, depending on if the spacecraft is located below or above the plasmapause. But the plasmapause is not always a sharp frontier. A thin plasmasphere boundary layer (PBL), where the plasma density starts to decrease exponentially with L below the plasmapause limit allows taking into account the width of the PBL, which is observed to linearly depend on the time elapsed since the most recent maximum value of Kp (Kotova et al., 2018). This happens especially during refilling periods after geomagnetic storms, as taken indeed into account by the model (see Pierrard and Stegen, 2008). Refilling is taken into account, using vestigial (during the last 24 h) and new positions of the plasmapause, located further when Kp decreases. Refilling rates can be refined from measurements (Gallagher et al., 2005, 2021; Sandel and Denton, 2007), and dependence on the radial distance can be improved in the model when unsolved problems concerning refilling will be clearer (Gallagher and Comfort, 2016).
Also, often, a sharp plasmapause is not really visible, since the density decreases continuously with the distance, especially during prolonged quiet periods. This can be related to plasmaspheric wind leading to an outward expansion of the plasmasphere perpendicularly to the magnetic field during prolonged quiet periods (Lemaire and Schunk, 1992). Such expansion was confirmed by Cluster observations (Dandouras, 2013) and is planned to be included in the model in the future. This would need Kp variations during several days before the date to be simulated.
Coupling With the Ionosphere, Composition, and Temperature
The model is coupled to the ionosphere using, for the values under 700 km, the IRI model (Bilitza, 2018) based on ionosondes, incoherent scatter radars, topside sounders, and in situ spacecraft observations. The ionosphere plays also an important role as boundary conditions. The simulations allow us to choose to consider (or not) a possible sub-corotation lag of the plasmasphere that can sometimes reach 85% of corotation as observed by Burch et al. (2004), caused by a corresponding corotation lag in the upper ionosphere.
Any improvement of the ionosphere model that we use would help to improve plasmaspheric models. A coupling with a physical model of the ionosphere would help to go beyond a statistical representation and include physical mechanisms in this region as well. This influences also the composition of the plasmasphere, where not only electrons are present but also protons, helium, and O+ ions, which can be very important in the outer plasmasphere during refilling. The helium ions were detected by the EUV (Extreme UltraViolet) instrument onboard the satellite IMAGE and allowed the first global views of the plasmasphere above the North pole between 2000 and 2006 (Burch, 2000; Sandel et al., 2000, 2001). The composition predicted by the model highly depends on the conditions provided by the ionospheric model. Mass density is an important influence on the threshold for wave-particle instabilities and wave propagation. The advancement of measuring and then modeling O+ in the plasmasphere would be particularly important for understanding the role of the plasmaspheric plasma in the energization and scattering loss of ring current and radiation belt ions, which are especially important space-weather hazards. The density determines the type of waves circulating inside and outside the plasmasphere, and this has a strong influence on the other regions of the magnetosphere like the radiation belts (Pierrard et al., 2020, 2021). The H2020 SafeSpace project (https://www.safespace-h2020.eu/) needs high-precision densities from the SPM model, in view to determine the waves in the magnetosphere. That is why we initiate the improvement of our model in the plasma trough region where high variability is observed.
Even if less is used, the temperature in the plasmasphere is also provided by the SPM model (and by IRI). It is different for the different particle species and slightly increases with the radial distance (Pierrard and Stegen, 2008). The temperature, ranging typically between 2,000 and 20,000 K, is also measured by the VAP instrument HOPE (Genestreti et al., 2016), and such measurements can be used to improve the temperature in the model as well.
The SPM model also includes high-latitude regions, where the polar wind reduces the ion density [Tam et al. (2007) for a review; Pierrard and Borremans (2012)]. These regions are also subject to improvements since they have been less compared with observations for validation. The latitudinal dependence inside and outside the plasmasphere is assumed to follow the motion of the particles along the magnetic field lines. Latitudinal verifications (Pierrard and Stegen, 2008) were made with data observations of the IMAGE Radio Plasma Imager (RPI) measurements (Reinisch et al., 2001) that provided the first nearly instantaneous electron densities along the magnetic field lines between the satellite and the nearest hemisphere. Moreover, the global meridian views of the KAGUYA satellite have shown that the main mechanism of plasmapause formation takes place first in the equatorial plane during storms, like in the SPM model (Murakami et al., 2016).
Discussion and Conclusions
In summary, the SPM simulations globally reproduce the satellite measurements of VAP/EMFISIS electron density in the plasmasphere in general for the regions L = 2–5 for quiet and active times. Inside the plasmasphere, and even more in the plasma trough, some further improvements can be performed, using new relations obtained from VAP. This will be the priority in the improvement of the model, to use these high-resolution observations to refine the relations between the density and L, MLT, latitude, and Kp. Model improvement involves the search of refined analytical equations, parameterized with observations, to obtain a better forecast. In this context, the whole data of EMFISIS (2012–2019) can be used to obtain better statistics, in particular for the plasma trough. Following these changes, an improved version of the SPM model should be available for release into the ESA network in the near future, together with the ionosphere–plasmasphere coupling, already available since its implementation in 2011.
The instrument HOPE onboard VAP can also be used to improve the temperature and composition. Moreover, a comparison study between the observations and the results of the model shows also the interest to consider the plasmapause as a layer with a thickness, especially during the refilling period. The plasmaspheric wind, appearing during very quiet time periods, is also a process that could improve the model in the long term by explaining high densities sometimes observed at large radial distances.
Other improvements depend on the inclusion or refinement of additional physical mechanisms, like coupling the plasmasphere to the energetic plasma of the magnetosphere or include polar wind escape, for instance. Additional investigations for plasmaspheric model improvements can concern the models used for the plasmasphere simulations, like the magnetic field, the electric field, the space coordinates, and the forecast (including indices like Kp, Dst, or even simulations based on direct solar wind predictions).
Data Availability Statement
Publicly available datasets were analyzed in this study. This data can be found at: https://emfisis.physics.uiowa.edu/Flight/.
Author Contributions
VP has written this article and has developed the SPM model. EB has made the figures to compare the results of the model with VAP observations. EB and FD have reviewed and improved the paper. All authors contributed to the article and approved the submitted version.
Funding
The SafeSpace project has received funding from the European Union's Horizon 2020 research and innovation program under Grant Agreement No. 870437. The PITHIA-NRF project has received funding from the European Union's Horizon 2020 research and innovation programme under grant agreement No. 101007599. The authors thank the project VSWMC and BIRA-IASB for its support.
Conflict of Interest
The authors declare that the research was conducted in the absence of any commercial or financial relationships that could be construed as a potential conflict of interest.
Acknowledgments
The authors thank the editors for their invitation to contribute to this special issue about Cold-Ion Populations and Cold-Electron Populations in the Earth's Magnetosphere and Their Impact on the System. The authors acknowledge the providers of the geophysical indices used in the study: Kp forecast (https://www.swpc.noaa.gov/products/3-day-geomagnetic-forecast) and definitive Kp (ftp://ftp.gfz-potsdam.de/pub/home/obs/kp-ap/tab/) and the experimental data VAP/EMFISIS (https://emfisis.physics.uiowa.edu/Flight/). They acknowledge also the team of the HOPE instrument on Van Allen Probes and the team of the ARASE satellite that can provide useful plasmaspheric measurements.
References
Bandic, M., Verbanac, G., Moldwin, M., Pierrard, V., and Piredda, G. (2016). MLT dependence in the relationship between plasmapause, solar wind and geomagnetic activity based on CRRES: 1990-1991. J. Geophys. Res. Space Phys. 121, 4397–4408. doi: 10.1002/2015JA022278
Bandic, M., Verbanac, G., and Pierrard, V. (2020). Relationship between global plasmapause characteristics and plasmapause structures in the frame of interchange instability mechanism. J. Geophys. Res. Space Phys. 125:e2019JA026768. doi: 10.1029/2019JA026768
Bandic, M., Verbanac, G., Pierrard, V., and Cho, J. (2017). Evidence of MLT propagation of the plasmapause inferred from THEMIS data. J. Atmosph. Solar Terrest. Phys. 161, 55–63. doi: 10.1016/j.jastp.2017.05.005
Bilitza, D. (2018). IRI the international standard for the ionosphere. Adv. Radio Sci. 16, 1–11. doi: 10.5194/ars-16-1-2018
Burch, J. L., Goldstein, J., and Sandel, B. R. (2004). Cause of plasmasphere corotation lag. Geophys. Res. Lett. 31:L05802. doi: 10.1029/2003GL019164
Carpenter, D. L., and Anderson, R. R. (1992). An ISEE/whistler model of equatorial electron density in the magnetosphere. J. Geophys. Res. Space Phys. 97, 1097–1108. doi: 10.1029/91JA01548
Dandouras, I. (2013). Detection of a plasmaspheric wind in the Earth's magnetosphere by the cluster spacecraft. Ann. Geophys. 31, 1143–1153. doi: 10.5194/angeo-31-1143-2013
Darrouzet, F., De Keyser, J., Décréau, P. M. E., El Lemdani-Mazouz, F., and Vallières, X. (2008). Statistical analysis of plasmaspheric plumes with CLUSTER/WHISPER observations. Ann. Geophys. 26, 2403–2417. doi: 10.5194/angeo-26-2403-2008
Darrouzet, F., De Keyser, J., Décréau, P. M. E., Gallagher, D. L., Pierrard, V., Lemaire, J. F., et al. (2006). Analysis of plasmaspheric plumes: CLUSTER and IMAGE observations. Ann. Geophys. 24, 1737–1758. doi: 10.5194/angeo-24-1737-2006
Darrouzet, F., De Keyser, J., and Pierrard, V., (Eds.). (2009). The Earth's Plasmasphere: Cluster and IMAGE – A Modern Perspective. New York, NY: Springer. doi: 10.1007/978-1-4419-1323-4
Darrouzet, F., Pierrard, V., Benck, S., Lointier, G., Cabrera, J., Borremans, K., et al. (2013). Links between the plasmapause and the radiation belt boundaries as observed by the instruments CIS, RAPID and WHISPERonboard cluster. J. Geophys. Res. Space Phys. 118, 4176–4188. doi: 10.1002/jgra.50239
Gallagher, D. L., Adrian, M. L., and Liemohn, M. W. (2005). Origin and evolution of deep plasmaspheric notches. J. Geophys. Res. Space Phys. 110:A09201. doi: 10.1029/2004JA010906
Gallagher, D. L., and Comfort, R. H. (2016). Unsolved problems in plasmasphere refilling. J. Geophys. Res. Space Phys. 121, 1447–1451. doi: 10.1002/2015JA022279
Gallagher, D. L., Comfort, R. H., Katus, R. M., Sandel, B. R., Fung, S. F., and Adrian, M. L. (2021). The breathing plasmasphere: erosion and refilling. J. Geophys. Res. Space Phys. 126:e2020JA028727. doi: 10.1029/2020JA028727
Gallagher, D. L., Craven, P. D., and Comfort, R. H. (2000). Global core plasma model. J. Geophys. Res. 105, 18819–18833. doi: 10.1029/1999JA000241
Genestreti, K. J., Goldstein, J., Corley, G. D., Farner, W., Kistler, L. M., Larsen, B. A., et al. (2016). Temperature of the plasmasphere from Van Allen Probes HOPE. J. Geophys. Res. Space Phys. 122, 310–323. doi: 10.1002/2016JA023047
Huba, J. D., Joyce, G., and Krall, J. (2008). Three-dimensional equatorial spread F modeling. Geophys. Res. Lett. 35:L10102. doi: 10.1029/2008GL033509
Kasahara, Y., Kasaba, Y., Kojima, H., Yagitani, S., Ishisaka, K., Kumamoto, A., et al. (2018). The plasma wave experiment (PWE) on board the Arase (ERG) satellite. Earth Planets Space. 70, 1–28. doi: 10.1186/s40623-018-0842-4
Kletzing, C. A., Kurth, W. S., Acuna, M., MacDowall, R. J., Torbert, R. B., Averkamp, T., et al. (2013). The Electric and Magnetic Field Instrument Suite and Integrated Science (EMFISIS) on RBSP. Space Sci. Rev. 179, 127–181. doi: 10.1007/s11214-013-9993-6
Koronczay, D., Lichtenberger, J., Juhasz, L., Steinbach, P., and Hospodarsky, G. (2018). VLF transmitters as tools for monitoring the plasmasphere. J. Geophys. Res. Space Phys. 123, 9312–9324. doi: 10.1029/2018JA025802
Kotova, G., Verigin, M., Lemaire, J., Pierrard, V., Bezrukikh, V., and Smilauer, J. (2018). Experimental study of the plasmasphere boundary layer using MAGION 5 data. J. Geophys. Res. Space Phys. 123, 1251–1259. doi: 10.1002/2017JA024590
Kurth, W. S., De Pascuale, S., Faden, J. B., Kletzing, C. A., Hospodarsky, G. B., Thaller, S., et al. (2015). Electron densities inferred from plasma wave spectra obtained by the Waves instrument on Van Allen Probes. J. Geophys. Res. Space Phys. 120. 904–914. doi: 10.1002/2014JA020857
Lapenta, G., Pierrard, V., Poedts, S., Sebek, O., Travnicek, P. M., Henri, P., et al. (2013). SWIFF: space weather integrated forecasting framework. J. Space Weather Space Clim. 3, 1–17. doi: 10.1051/swsc/2013027
Lemaire, J., and Gringauz, K. I. (1998). The Earth's Plasmasphere. Cambridge: Cambridge University Press. doi: 10.1017/CBO9780511600098
Lemaire, J., and Pierrard, V. (2008). Comparison between two theoretical mechanisms for the formation of the plasmapause and relevant observations. Geomagn. Aeronomy 48, 553–570. doi: 10.1134/S0016793208050010
Lemaire, J., and Schunk, R. W. (1992). Plasmaspheric wind. J. Atmosph. Solar Terrestrial Phys. 54, 467–477. doi: 10.1016/0021-9169(92)90026-H
Maruyama, N., Sun, Y.-Y., Richards, P. G., Middlecoff, J., Fang, T.-W., Fuller-Rowell, T. J., et al. (2016). A newsource of the midlatitude ionospheric peak density structure revealed by a new ionosphere-plasmasphere model. Geophys. Res. Lett. 43, 2429–2435. doi: 10.1002/2015GL067312
Mauk, B., Fox, N., Kanekal, S., Kessel, R., Sibeck, D., and Ukhorskiy, A. (2013). Science objectives and rationale for the radiation belt storm probes mission. Space Sci. Rev. 179, 3–27. doi: 10.1007/s11214-012-9908-y
Murakami, G., Yoshioka, K., Yamazaki, A., Nishimura, Y., Yoshikawa, I., and Fujimoto, M. (2016). The plasmause formation seen from meridian perspective by KAGUYA. J. Geophys. Res. Space Phys. 121, 11973–11984. doi: 10.1002/2016JA023377
Ober, D. M., Horwitz, J. L., and Gallagher, D. L. (1997). Formation of density troughs embedded in the outer plasmasphere by subauroral ion drift events. J. Geophys. Res. 102, 14595–14602. doi: 10.1029/97JA01046
Pierrard, V., and Borremans, K. (2012). “The ionosphere coupled to the plasmasphere and polar wind models,” in Numerical Modeling of Space Plasma Flows: Astronum-2011, ASP Conference series, eds N. V. Pogorelov, J. A. Font, E. Audit, and G. P. Zank [Orem, UT: Astronomical Society of the Pacific (ASP)].
Pierrard, V., Botek, E., Ripoll, J.-F., and Cunningham, G. S. (2020). Electron dropout events and flux enhancements associated with geomagnetic storms observed by PROBA-V/EPT from 2013 to 2019. J. Geophys. Res. Space Phys. 125:e2020JA028487. doi: 10.1029/2020JA028487
Pierrard, V., and Cabrera, J. (2005). Comparisons between EUV/IMAGE observations and numerical simulations of the plasmapause formation. Ann. Geophys. 23, 2635–2646. doi: 10.5194/angeo-23-2635-2005
Pierrard, V., and Cabrera, J. (2006). Dynamical simulations of plasmapause deformations. Space Sci. Rev. 122, 119–126. doi: 10.1007/s11214-006-5670-3
Pierrard, V., Goldstein, J., André, N., Jordanova, V. K., Kotova, G. A., Lemaire, J. F., et al. (2009). Recent progress in physics-based models of the plasmasphere. Space Sci. Rev. 145, 193–229. doi: 10.1007/s11214-008-9480-7
Pierrard, V., Khazanov, G., Cabrera, J., and Lemaire, J. (2008). Influence of the convection electric field models on predicted plasmapause positions during the magnetic storms. J. Geophys. Res. Space Phys. 113, 1–21. doi: 10.1029/2007JA012612
Pierrard, V., and Lemaire, J. (2004). Development of shoulders and plumes in the frame of the interchange instability mechanism for plasmapause formation. Geophys. Res. Lett. 31, L05809–L05811. doi: 10.1029/2003GL018919
Pierrard, V., Ripoll, J.-F., Cunningham, G., Botek, E., Santolik, O., Thaller, S., et al. (2021). Observations and simulations of dropout events and flux enhancements in October 2013: Comparing MEO equatorial with LEO polar orbit. J. Geophys. Res. Space Phys.
Pierrard, V., and Stegen, K. (2008). A three dimensional dynamic kinetic model of the plasmasphere. J. Geophys. Res. Space Phys. 113:A10209. doi: 10.1029/2008JA013060
Pierrard, V., and Voiculescu, M. (2011). The 3D model of the plasmasphere coupled to the ionosphere. Geophys. Res. Lett. 38:L12104. doi: 10.1029/2011GL047767
Reinisch, B. W., Huang, X., Song, P., Sales, G. S., Fung, S. F., Green, J. L., et al. (2001). Plasma density distribution along the magnetospheric field: RPI observations from IMAGE. Geophys. Res. Lett. 28, 4521–4524. doi: 10.1029/2001GL013684
Reinisch, B. W., Moldwin, M. B., Denton, R. E., Gallagher, D. L., Matsui, H., Pierrard, V., et al. (2009). Augmented Empirical models of the plasmaspheric density and electric field using IMAGE and CLUSTER data. Space Sci. Rev. 145, 231–261. doi: 10.1007/s11214-008-9481-6
Ren, J., Zong, Q. G., Miyoshi, Y., Rankin, R., Spence, H. E., Funsten, H. O., et al. (2018). A comparative study of ULF waves' role in the dynamics of charged particles in the plasmasphere: Van Allen Probes observation. J. Geophys. Res. Space Phys. 123, 5334–5343. doi: 10.1029/2018JA025255
Sandel, B. R., Broadfoot, A. L., Curtis, C. C., King, R. A., Stone, T. C., Hill, R. H., et al. (2000). The extreme ultraviolet imager investigation for the IMAGE mission. Space Sci. Rev. 91:197. doi: 10.1023/A:1005263510820
Sandel, B. R., and Denton, M. H. (2007). Global view of refilling of the plasmasphere. Geophys. Res. Lett. 34:L17102. doi: 10.1029/2007GL030669
Sandel, B. R., King, R. A., Forrester, W. T., Gallagher, D. L., Broadfoot, A. L., and Curtis, C. C. (2001). Initial results from the IMAGE extreme ultraviolet imager. Geophys. Res. Lett. 28:1439. doi: 10.1029/2001GL012885
Sheeley, B. W., Moldwin, M. B., Rassoul, H. K., and Anderson, R. R. (2001). An empirical plasmasphere and trough density model: CRRES observations. J. Geophys. Res. 106, 631–641. doi: 10.1029/2000JA000286
Tam, S. W. Y., Chang, T., and Pierrard, V. (2007). Kinetic modeling of the polar wind. J. Atmosph. Sol. Terr. Phys. 69, 1984–2027. doi: 10.1016/j.jastp.2007.08.006
Verbanac, G., Bandic, M., and Pierrard, V. (2018). MLT plasmapause characteristics: comparison between THEMIS observations and numerical simulations. J. Geophys. Res. Space Phys. 123, 2000–2017. doi: 10.1002/2017JA024573
Keywords: plasmasphere, plasmapause, model, improvements, trough, ionosphere
Citation: Pierrard V, Botek E and Darrouzet F (2021) Improving Predictions of the 3D Dynamic Model of the Plasmasphere. Front. Astron. Space Sci. 8:681401. doi: 10.3389/fspas.2021.681401
Received: 16 March 2021; Accepted: 13 April 2021;
Published: 07 May 2021.
Edited by:
Joseph Eric Borovsky, Space Science Institute, United StatesReviewed by:
Michael Denton, Space Science Institute, United StatesDennis Gallagher, National Aeronautics and Space Administration (NASA), United States
Copyright © 2021 Pierrard, Botek and Darrouzet. This is an open-access article distributed under the terms of the Creative Commons Attribution License (CC BY). The use, distribution or reproduction in other forums is permitted, provided the original author(s) and the copyright owner(s) are credited and that the original publication in this journal is cited, in accordance with accepted academic practice. No use, distribution or reproduction is permitted which does not comply with these terms.
*Correspondence: Viviane Pierrard, dml2aWFuZS5waWVycmFyZEBhZXJvbm9taWUuYmU=