 Erika Palmerio1,2*
 Nariaki V. Nitta3
 Tamitha Mulligan4
 Marilena Mierla5,6
 Jennifer O’Kane7
 Ian G. Richardson8,9
 Suvadip Sinha10
 Nandita Srivastava11
 Stephanie L. Yardley7
 Andrei N. Zhukov5,12
- 1Space Sciences Laboratory, University of California, Berkeley, CA, United States
- 2CPAESS, University Corporation for Atmospheric Research, Boulder, CO, United States
- 3Lockheed Martin Solar and Astrophysics Laboratory, Palo Alto, CA, United States
- 4Space Sciences Department, The Aerospace Corporation, Los Angeles, CA, United States
- 5Solar–Terrestrial Centre of Excellence, Royal Observatory of Belgium, Brussels, Belgium
- 6Institute of Geodynamics of the Romanian Academy, Bucharest, Romania
- 7Mullard Space Science Laboratory, University College London, Dorking, United Kingdom
- 8Department of Astronomy, University of Maryland, College Park, MD, United States
- 9Heliospheric Physics Division, NASA Goddard Space Flight Center, Greenbelt, MD, United States
- 10CESSI, Indian Institute of Science Education and Research Kolkata, Mohanpur, India
- 11Udaipur Solar Observatory, Physical Research Laboratory, Udaipur, India
- 12Skobeltsyn Institute of Nuclear Physics, Moscow State University, Moscow, Russia
Eruptions of coronal mass ejections (CMEs) from the Sun are usually associated with a number of signatures that can be identified in solar disc imagery. However, there are cases in which a CME that is well observed in coronagraph data is missing a clear low-coronal counterpart. These events have received attention during recent years, mainly as a result of the increased availability of multi-point observations, and are now known as “stealth CMEs.” In this work, we analyze examples of stealth CMEs featuring various levels of ambiguity. All the selected case studies produced a large-scale CME detected by coronagraphs and were observed from at least one secondary viewpoint, enabling a priori knowledge of their approximate source region. To each event, we apply several image processing and geometric techniques with the aim to evaluate whether such methods can provide additional information compared to the study of “normal” intensity images. We are able to identify at least weak eruptive signatures for all events upon careful investigation of remote-sensing data, noting that differently processed images may be needed to properly interpret and analyze elusive observations. We also find that the effectiveness of geometric techniques strongly depends on the CME propagation direction with respect to the observers and the relative spacecraft separation. Being able to observe and therefore forecast stealth CMEs is of great importance in the context of space weather, since such events are occasionally the solar counterparts of so-called “problem geomagnetic storms.”
1 Introduction
Coronal mass ejections (CMEs) are powerful solar eruptions containing large amounts of plasma and magnetic field that are regularly expelled from the Sun into the heliosphere. They were first identified in white light in the early 1970s (Tousey, 1973; Gosling et al., 1974) in images from the
However, it was not long before this picture was shown to not always hold true. Studies of CMEs detected in situ near Earth noted that a large number of such events lacked clear solar associations (e.g., Cane and Richardson, 2003; Richardson and Cane, 2010). Specifically, Schwenn et al. (2005), reported that 20% of interplanetary CMEs could not be linked to a front-sided (partial or full) halo CME source, and Zhang et al. (2007) reported that 11% of CME-driven storms with minimum
During the last decade, routine observations of the solar disc have advanced considerably due to the high temporal and spatial resolution of data from the Solar Dynamics Observatory (SDO; Pesnell et al., 2012), launched in 2010. Nevertheless, despite the improvement of EUV observations with respect to previous instrumentation, stealth CMEs continue to be reported (e.g., Nitta and Mulligan, 2017). It has been suggested that apparently stealth CMEs result from observational limitations such as instrument sensitivity and bandwidth issues, even in the SDO era (Howard and Harrison, 2013), and that advanced image processing techniques may reveal hard-to-observe signatures in both solar disc and coronagraph imagery (Alzate and Morgan, 2017; O’Kane et al., 2019). Additionally, some studies have applied geometric triangulation and reconstruction techniques to data from complementary viewpoints in order to trace stealth CMEs back to an approximate source region on the disc (Pevtsov et al., 2012; O’Kane et al., 2019; Talpeanu et al., 2020). These methods, however, have not been tested on a large number of events and hence it is not known whether they are suitable to all circumstances or whether they can be applied only to a limited number of cases. To complicate things further, there is currently no formal definition describing what a stealth CME is or defining the “observational limit” below which a CME can be considered to be stealthy.
In this paper, we contemplate the following question: Since stealth CMEs can present diverse characteristics, is it possible that there exists a class of “extremely stealth” CMEs that cannot be revealed even with the aid of state-of-the-art techniques? In order to address this issue, this work aims to investigate the efficacy of various techniques applied to remote-sensing data in revealing the signatures of CMEs that are elusive on the solar disc. We test such techniques on four well-studied stealth CMEs for which the “true” source is more or less known because of the availability of remote-sensing imagery from additional viewpoints. This will ensure that any solar activity that is observed away from the expected source region will not be mistakenly interpreted as a signature of the stealth CME under analysis. This manuscript is organized as follows. In Section 2, we present and describe the imaging and geometric techniques that we employ in this study to analyze stealth CMEs. In Section 3, we apply these techniques to four case studies and compare them with information that can be retrieved from plain inspection of intensity images only. Finally, in Section 4 we discuss our results and present our conclusions.
2 Techniques Employed
This section summarizes the remote-sensing techniques that are used throughout this work to analyze the four elusive CMEs under study. Imaging techniques are described in Section 2.1, while geometric techniques are presented in Section 2.2.
2.1 Imaging Techniques
2.1.1 Image Differencing
The image differencing technique simply consists of subtracting from an image a preceding one, so that changes in total intensity over time appear as patches that are either dark (denoting an intensity decrease) or bright (denoting an intensity increase). This method has been long used in solar physics applications for both on-disc and coronagraph observations (e.g., Burlaga et al., 1982; Hudson et al., 1992). The commonly used nomenclature for the technique is that subtracting a pre-event image yields a “base difference” image, while subtracting successive images yields a “running difference” image. Base-difference images are often used to highlight transient phenomena that develop over larger time scales, such as coronal dimmings (e.g., Attrill and Wills-Davey, 2010), while running-difference images are often used to highlight short-term transient features such as EUV waves (e.g., Attrill et al., 2007). Since stealth CMEs tend to be slow, i.e. they erupt and accelerate over the course of several hours, their evolution is not expected to be captured in running-difference images, hence we focus in this work on using image differencing over longer time scales. In particular, Nitta and Mulligan. (2017) noted that in the case of stealth CMEs, difference images with “long enough” temporal separations (of the order of
2.1.2 Wavelet Packets Equalization
The Wavelet Packets Equalization (WPE; Stenborg and Cobelli, 2003; Stenborg et al., 2008) technique is a multi-resolution image processing method that can be applied to enhance features based on their multi-scale nature. In the WPE technique, an image is first decomposed over both dimensions using spatially localized functions known as wavelets. We have implemented the Stenborg and Cobelli (2003) procedure using a 2D à trous wavelet transform (e.g., Shensa, 1992), where the scaling function is a
2.1.3 Multi-Scale Gaussian Normalization
The Multi-scale Gaussian Normalization (MGN; Morgan and Druckmüller, 2014) technique, similarly to the WPE method described in Section 2.1.2, is based on a multi-scale normalization algorithm. In the MGN technique, a set of 2D Gaussian kernels of different scale lengths are used to locally normalize an image using a set of local mean and standard deviation values. A weighted combination of the normalized components is then used to obtain a weighted mean locally normalized image, which is finally superposed to the corresponding global gamma-transformed image. This results in an enhancement of the local intensity fluctuations within the images. The MGN image processing tool has been applied to EUV images to identify the low-coronal signatures associated with stealth events in both on-disc and off-limb observations (Alzate and Morgan, 2017; O’Kane et al., 2019, 2021b).
2.2 Geometric Techniques
2.2.1 Latitude Projection
Since all CMEs investigated in this study have been observed off limb from at least one additional perspective, a simple approach to adopt when triangulation is not possible (i.e., when only one “non-stealthy” viewpoint is available) is to project the approximate latitude from which the CME originated onto the “stealthy” field of view. Considering a “classic” three-part CME structure in coronagraph imagery (Illing and Hundhausen, 1985), we trace back to the solar disc the approximate latitude of the central, bright core that is observed off limb. We note that not all CMEs feature a three-part structure (e.g., Vourlidas et al., 2013), but stealth CMEs often belong to the streamer blowout category, in which flux rope signatures tend to occur at a higher rate than in the general CME population (Vourlidas and Webb, 2018). The projected latitude of the source region from the off-limb viewpoint naturally focuses the search for any possible faint or ambiguous on-disc signature to a more localized area. This enhances the potential to find any low-coronal signatures or dynamics that, by themselves, would not have necessarily been interpreted as being eruption-related.
2.2.2 Tie-Point Technique
The Tie-point (TP) triangulation technique was formulated by Inhester. (2006) and first employed by Thompson. (2009) to study a Sun-grazing comet. The principle on which the TP technique is based is that two separate observers and the point of interest in space (to be triangulated) form a plane called “epipolar plane,” which is reduced to a line (“epipolar line”) in image projections. A point identified in an image from the first observer must lie on the same epipolar line in the corresponding image from the second observer. Larger-scale features can be tracked by finding correspondences between different pixels along epipolar line pairs in images from both spacecraft. The 3D reconstruction or triangulation is then achieved by finding the intersection of the two lines of sight (for each pixel of interest) along the corresponding epipolar plane, which is unambiguously defined. In solar physics applications, the TP method has been used to evaluate the 3D morphology of erupting filaments (e.g., Bemporad et al., 2011; Thompson et al., 2012; Panasenco et al., 2013; Palmerio et al., 2021) and the evolution of CME fronts or cores in coronagraph data (e.g., Mierla et al., 2008, 2009; Srivastava et al., 2009; Liewer et al., 2011).
2.2.3 Graduated Cylindrical Shell
The Graduated Cylindrical Shell (GCS; Thernisien et al., 2006, Thernisien et al., 2009; Thernisien, 2011) model is a reconstruction technique usually applied to white-light coronagraph images. In the GCS model, a wireframe describing the geometry of flux ropes is used to fit CMEs from one or more simultaneous viewpoints. Within a single reconstruction, six free parameters (latitude, longitude, axis tilt, apex height, half-angle, and aspect ratio) can be adjusted until they best match the CME morphology observed in one or more images. The geometry of the model itself is often referred to as a “hollow croissant” and consists of a half-torus frontal part with two conical legs connected to the Sun. The resulting shape, reminiscent of a croissant, is “hollow” in the sense that the electron density is placed uniquely on the shell of the model. Thus, fits performed with the GCS model can provide information on the morphology of CMEs, but not on their magnetic field structure. The GCS technique is widely used in solar physics and space weather applications to determine geometric and kinematic parameters of CMEs and their shocks through the corona (e.g., Mierla et al., 2010; Shi et al., 2015; Schmidt et al., 2016), also in the case of stealth CMEs (e.g., Lynch et al., 2010; He et al., 2018). More recently, O’Kane et al. (2019), and Freiherr von Forstner et al. (2021) used the inferred propagation latitude and longitude from GCS reconstructions to obtain an approximate location for the source region of the stealth CMEs they analyzed. The full list of GCS-reconstructed parameters for all CMEs studied in this work can be found in Supplementary Table S1.
3 Analysis of Sample Stealth Events
We present in this section the remote-sensing analysis of four CMEs with elusive on-disc signatures: 2008 June 1, 2011 March 3, 2012 February 4, and 2016 October 8. These events were selected based on two main factors. First of all, they were all observed as classic three-part CMEs including a flux rope by at least one spacecraft, i.e., they do not belong to the so-called “jet” and/or “blob” categories. Furthermore, each event was observed from at least one additional viewpoint, enabling estimation of its approximate source region on the solar disc. Such observations are provided for each case study as supplementary videos in which EUV data have been enhanced with a radial filter, in order to bring out off-limb emission. The reader is invited to initially rapidly move the video player slider back and forth, so that the motion catches the eye. As stealth CMEs are usually slower than average, it may be difficult to identify erupting structures that evolve over extremely long time scales when played at the speeds shown in the videos (i.e., 2–4 h per second). Additionally, kinematic (height–time) plots for each event based on observations from these additional viewpoints are provided in Supplementary Figure S1.
3.1 Event 1: 2008 June 1
The first CME that we focus on in this study (Event 1) erupted on 2008 June 1 and was a stealth event as seen from STEREO-B. This CME was first reported by Robbrecht et al. (2009) and its eruption was later modeled by Lynch et al. (2016). As mentioned in the Introduction, this event marked the first direct observation of a CME that left “no trace behind” in EUV imagery from one viewpoint, hence we treat it here as a “stealth CME prototype.” At the time of this event, STEREO-A was located
EUVI images from STEREO-B for the eruption period processed with different techniques are shown in Figure 1 and Supplementary Video S2. It is clear that the succession of images in Figure 1 does not show any strong indication that an eruption has occurred. Nevertheless, it is possible to note two extremely faint dimmings (indicated with arrows) developing in the southern hemisphere starting around 15:00 UT on June 1 (see also Supplementary Video S2). These dimmings are not straightforward to identify even in difference data, possibly because they are rather weak and hence appear “camouflaged” by other intensity fluctuations on the solar disc. We also note that these signatures appear equally visible in images produced using the other three methods (i.e., intensity, WPE, and MGN). The dimmings seem to be spatially consistent with the approximate CME source region deduced from STEREO-A imagery (see Supplementary Video S1), but because they are so faint it is not possible to draw strong conclusions as to their association with the 2008 June 1 CME.
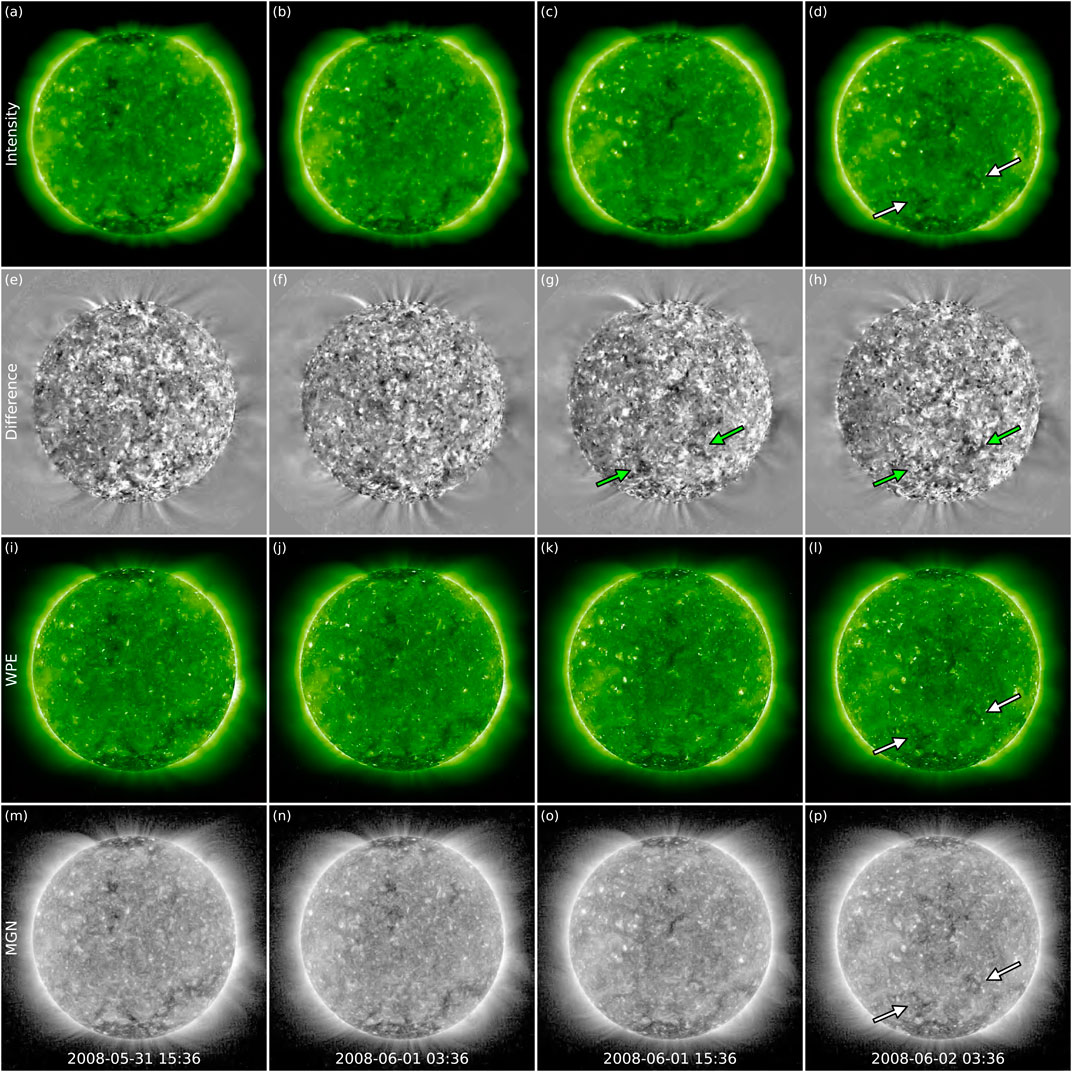
FIGURE 1. Imaging techniques applied to the 2008 June 1 CME (Event 1). STEREO/SECCHI/EUVI-B 195Å images are shown at four different times and processed with four different methods. (A–D) Intensity images. (E–H) Difference images with fixed
Results from the application of geometric techniques to Event 1 are shown in Figure 2. In the top row, the approximate latitude of the footpoints of the flux rope structure seen in off-limb imagery from STEREO-A (marked with an arrow in Figure 2A, see also Supplementary Video S1) is projected onto the solar disc from all three available viewpoints. The flux rope lifted off from
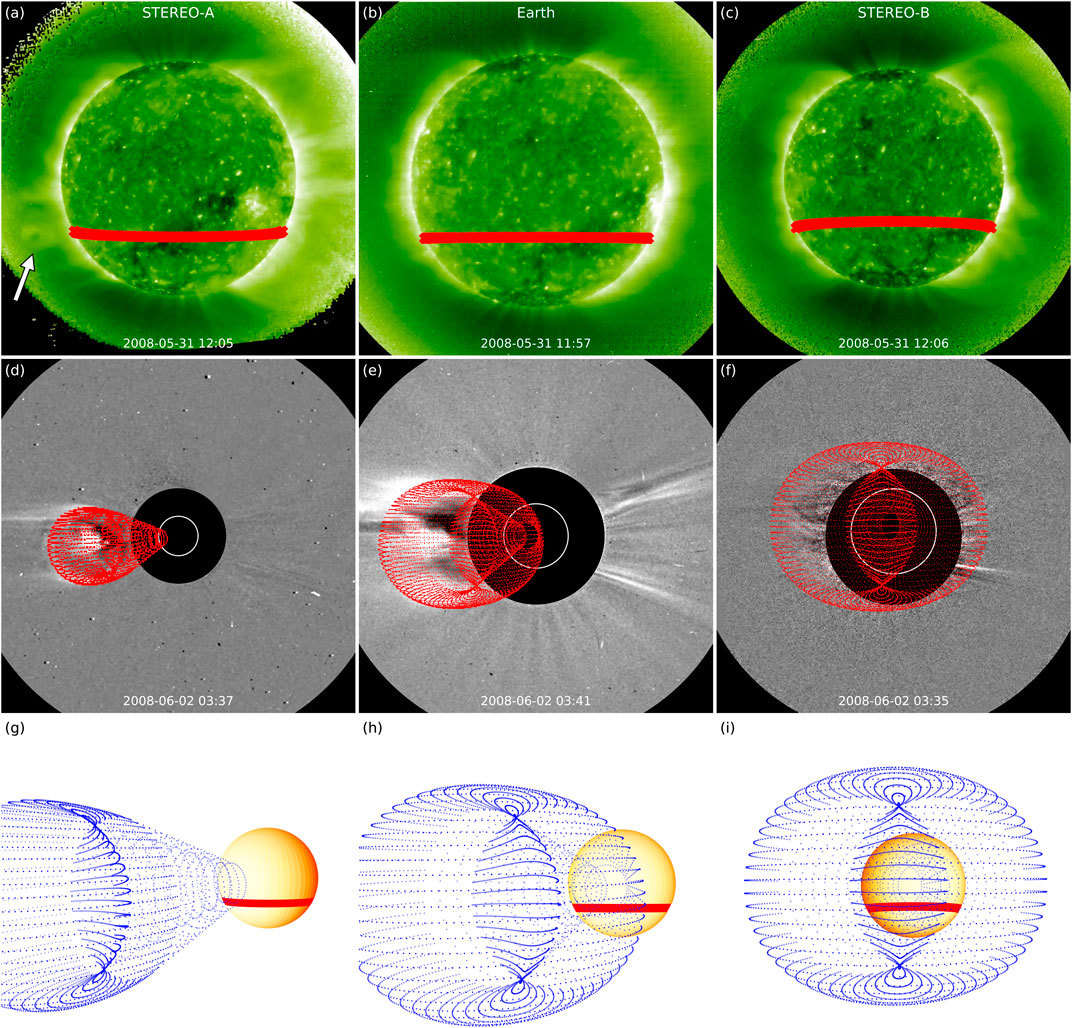
FIGURE 2. Geometric techniques applied to the 2008 June 1 CME (Event 1). (A–C) Latitude (thick red line) of the CME core (indicated with an arrow) projected onto the solar disc as seen by STEREO-A, SOHO, and STEREO-B. (D–F) GCS reconstruction applied to the white-light structure seen in STEREO-A, SOHO, and STEREO-B imagery. (G–I) The GCS-reconstructed CME displayed together with the “source latitude” in a 3D representation and shown from the three viewpoints of STEREO-A, Earth, and STEREO-B.
3.2 Event 2: 2011 March 3
The second CME that we analyze in this work (Event 2) erupted on 2011 March 3 and was a stealth event as seen from Earth. This case study was previously analyzed by Pevtsov et al. (2012), Nitta and Mulligan. (2017), O’Kane et al. (2019), and O’Kane et al. (2021b), who all placed the CME source region in the vicinity of active region AR 11165, located close to the central meridian from Earth’s perspective. Hence, we investigate this event as a possible case of a more localized, active region stealth CME. At the time of this eruption, STEREO-A was located
Images from the Atmospheric Imaging Assembly (AIA; Lemen et al., 2012) instrument onboard SDO corresponding to the eruption period are shown in Figure 3 and Supplementary Video S4. While the intensity, MGN, and WPE images do not show strong eruptive signatures, the difference images in the second row display clearer signs of activity on the solar disc. First of all, an extended pair of dimmings and flare loops at the southern periphery of a large coronal hole in the western hemisphere can be observed in Figure 3E (indicated with arrows). These are found to be associated with a filament eruption that occurred on March 1, which possibly destabilized the nearby active region fields and thus triggered the later stealth CME. The successive panels are characterized by a series of dimmings (starting around 22:00 UT on March 2 and marked in panels (F) and (G)) and a strong brightening (starting around 01:00 UT on March 3 and marked in panel (H)) around AR 11165 (indicated with a circle in the first column of Figure 3). It can be seen that initially, a pair of dimmings develops north–south of the active region and later a third, more diffuse dimming appears to the east of the fading southern one. Corresponding images obtained with other techniques, on the other hand, show more elusive signatures. A faint pair of dimmings north and south of AR 11165 can be seen in Supplementary Video S4 (the northern dimming is marked in panels (C), (K), and (O) of Figure 3), together with the appearance of a set of loops that seem to correspond to the post-eruption arcade seen by STEREO-A (marked in panels (D), (L), and (P) of Figure 3). We emphasize that these signatures are rather weak, and thus without prior knowledge of an eruption having occurred they would have been easily overlooked. Furthermore, we note that although the arcade is well observed in all non-differenced data (i.e., intensity, WPE, and MGN), its fine structure is more easily revealed in images processed with advanced techniques.
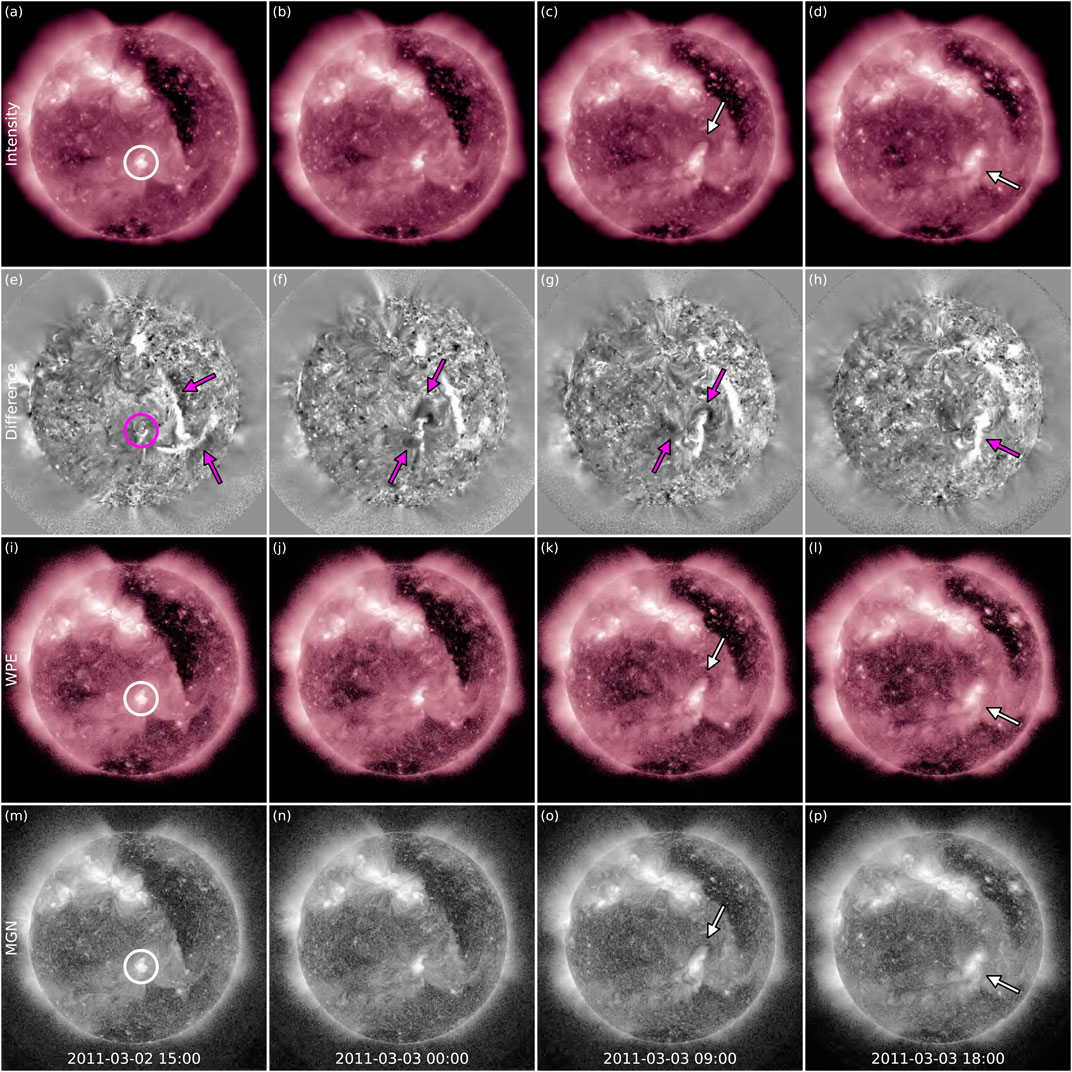
FIGURE 3. Imaging techniques applied to the 2011 March 3 CME (Event 2). SDO/AIA 211Å images are shown at four different times and processed with four different methods. (A–D) Intensity images. (E–H) Difference images with fixed
Results from the application of geometric techniques to Event 2 are shown in Figure 4. Since the pre-eruptive structure was well observed by both STEREO spacecraft, we analyze it using the TP technique. The triangulated balloon-shaped feature is overlaid onto EUVI images in panels (A) and (C). However, despite the favourable viewing perspective of nearly quadrature with Earth from both observers, it is not possible to obtain a meaningful triangulation of the loop onto the solar disc imaged by SDO. This is because the uncertainty associated with the TP technique depends on the angle between the observing spacecraft, and specifically is proportional to the inverse of the sine of the separation angle (Inhester, 2006). In the case of this event, the separation of
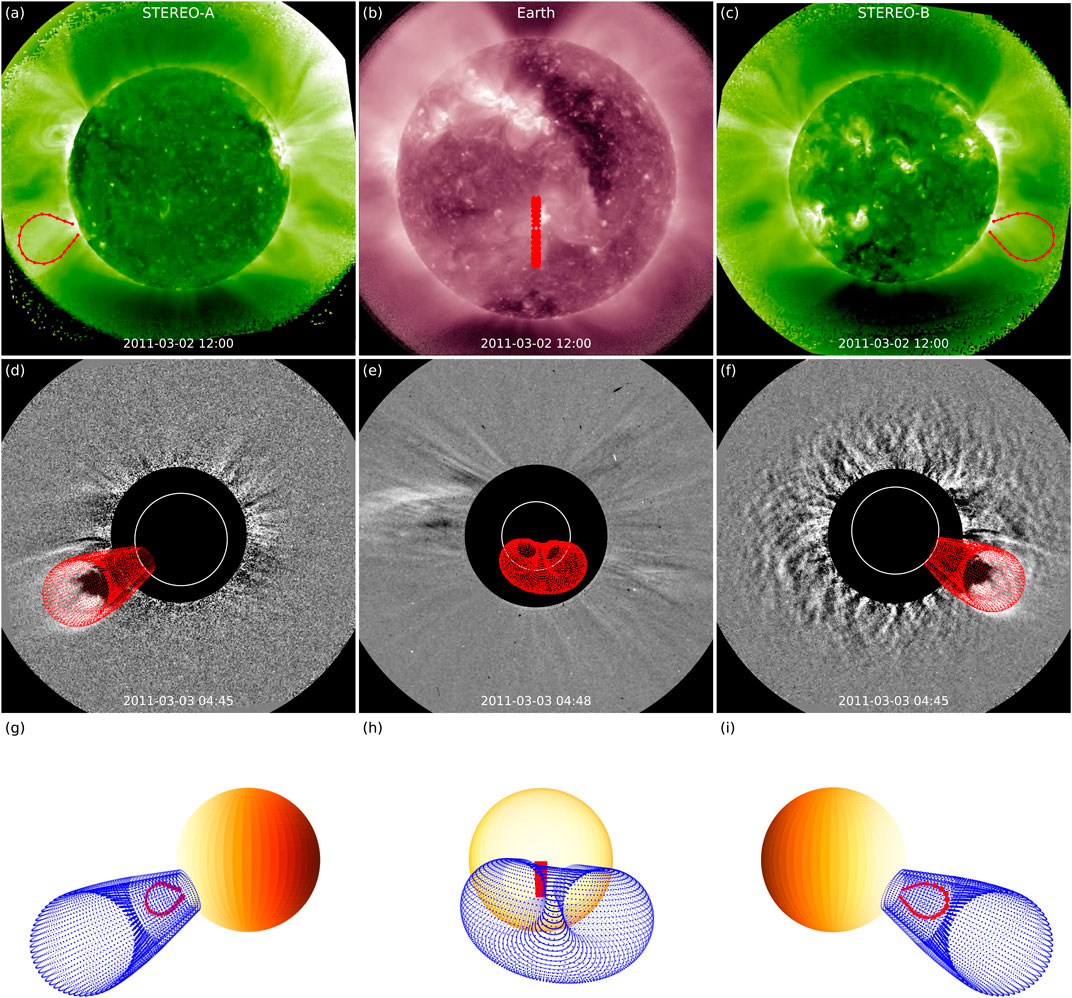
FIGURE 4. Geometric techniques applied to the 2011 March 3 CME (Event 2). (A–C) Application of the TP technique to the pre-eruptive structure. The technique is applied to STEREO-A and STEREO-B images and the latitudinal extent of the triangulated loop is projected onto the SDO/AIA field of view (and displayed over the central meridian). (D–F) GCS reconstruction applied to the white-light structure seen in STEREO-A, SOHO, and STEREO-B imagery. (G–I) Results of the TP and GCS reconstruction techniques displayed together in a 3D representation and shown from three viewpoints: STEREO-A, Earth, and STEREO-B.
3.3 Event 3: 2012 February 4
The third CME that we analyze in this work (Event 3) erupted on 2012 February 4 and was a stealth event as seen from Earth. This CME was first reported by D’Huys et al. (2014) and was further analyzed by Alzate and Morgan. (2017). This event was also well observed off limb by both STEREO spacecraft, with STEREO-A being located
SDO/AIA images corresponding to the eruption period are shown in Figure 5 and Supplementary Video S6. As is often the case for stealth CMEs, these data do not show “explosive” eruption signatures that are more typical of active-region CMEs. Nevertheless, it is possible to distinguish rather clear indications that an eruption occurred, as marked with arrows in the difference image in Figure 5H. Specifically, we observe an elongated pair of brightenings attributable to flare ribbons, the first being rather prominent and close to the northwestern limb and the second being more diffuse and culminating in the vicinity of the solar north pole, with faint loops reminiscent of a post-eruption arcade in between. These features start to develop around 12:00 UT on February 4. In non-differenced images, the westernmost ribbon appears significantly less prominent and the more diffuse one is not visible at all. The structure that we recognized as a post-eruption arcade based on difference images is somewhat visible, but less clearly attributable to a post-eruption arcade. Although all these coronal features can be observed in intensity images as well, their structure appears sharper in WPE- and MGN-processed data. Furthermore, all images reveal an especially faint dimming region close to the solar north pole (with onset around 06:00 UT on February 4 and indicated with arrows in Figure 5D,L,P. This darkening feature appears equally visible in intensity, MGN, and WPE images. Supplementary Video S6 demonstrates that while it is not possible to establish with certainty whether a large-scale eruption occurred from intensity images alone, the development of the various brightening features in difference images unambiguously links the CME seen off limb from the twin STEREOs to a rather defined source region on the Earth-facing disc.
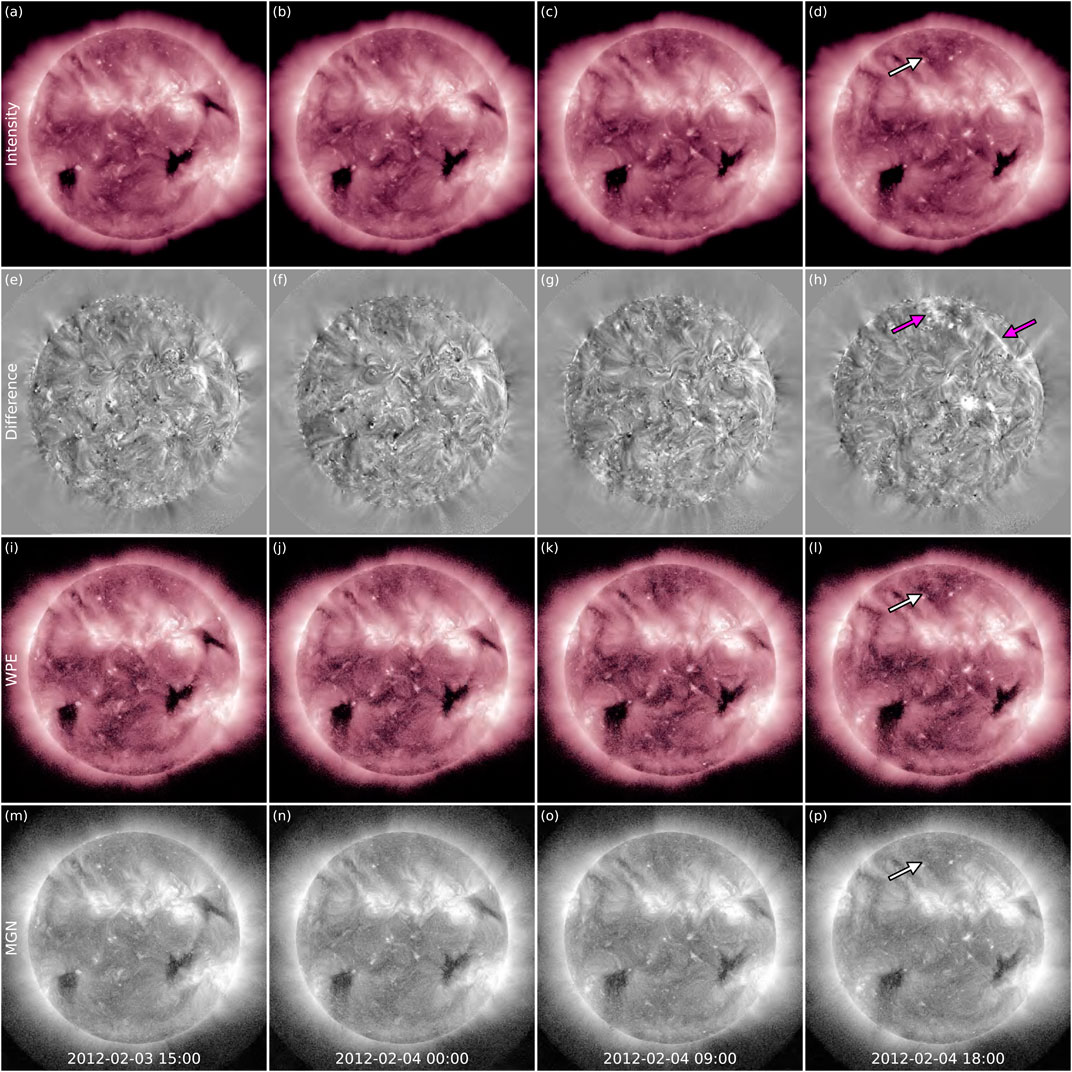
FIGURE 5. Imaging techniques applied to the 2012 February 4 CME (Event 3). SDO/AIA 211Å images are shown at four different times and processed with four different methods. (A–D) Intensity images. (E–H) Difference images with fixed
Figure 6 shows the results of the geometric techniques applied to Event 3. Being well-observed off limb from two different perspectives, the 2012 February 4 CME is well suited to be analyzed using the TP technique. Furthermore, the
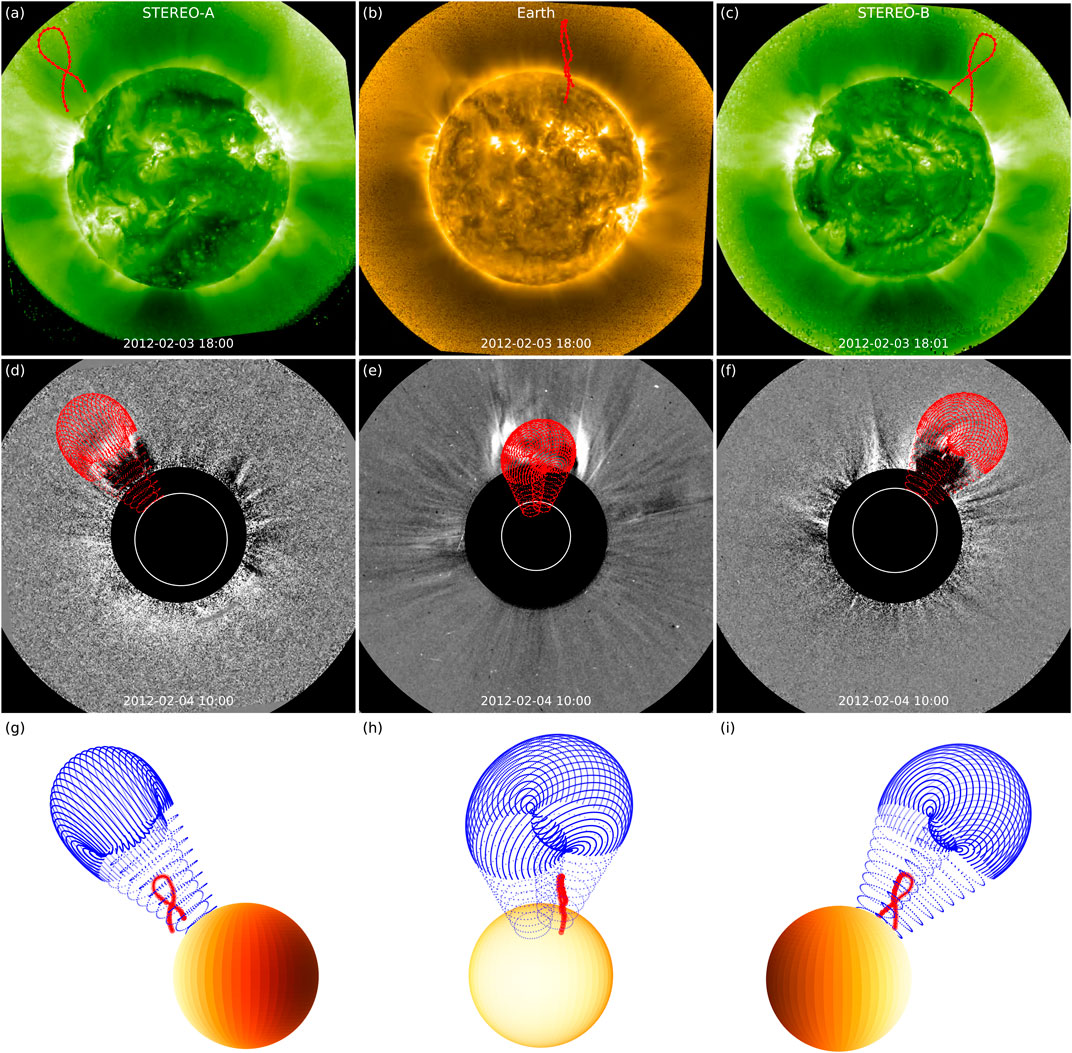
FIGURE 6. Geometric techniques applied to the 2012 February 4 CME (Event 3). (A–C) Application of the TP technique to the pre-eruptive loop structure. The technique is applied to STEREO-A and STEREO-B images and then projected into the PROBA2 field of view. (D–F) GCS reconstruction applied to the white-light structure seen in STEREO-A, SOHO, and STEREO-B imagery. (G–I) Results of the TP and GCS reconstruction techniques displayed together in a 3D representation and shown from the viewpoints of STEREO-A, Earth, and STEREO-B.
3.4 Event 4: 2016 October 9
The fourth CME that we analyze in this work (Event 4) erupted on 2016 October 8 and was a stealth event as seen from Earth. This CME was first reported by Nitta and Mulligan. (2017) and was further analyzed by He et al. (2018). Having taken place in 2016, only the viewpoint from STEREO-A located
Images from SDO/AIA corresponding to the eruption period are shown in Figure 7 and Supplementary Video S8. It is possible to discern signatures of two different eruptions in the presented data. The first can be noted clearly in the figure in difference images (indicated with an arrow in panel (E)) and in all panels in Supplementary Video S8, and corresponds to a small filament eruption from the northeastern quadrant. Despite the rather evident low-coronal signatures, this eruption does not correspond to the CME seen off limb in STEREO-A imagery (see Supplementary Video S7) because of its timing (∼14:00 UT on October 8, several hours too early compared to its first appearance in COR1), its source region (
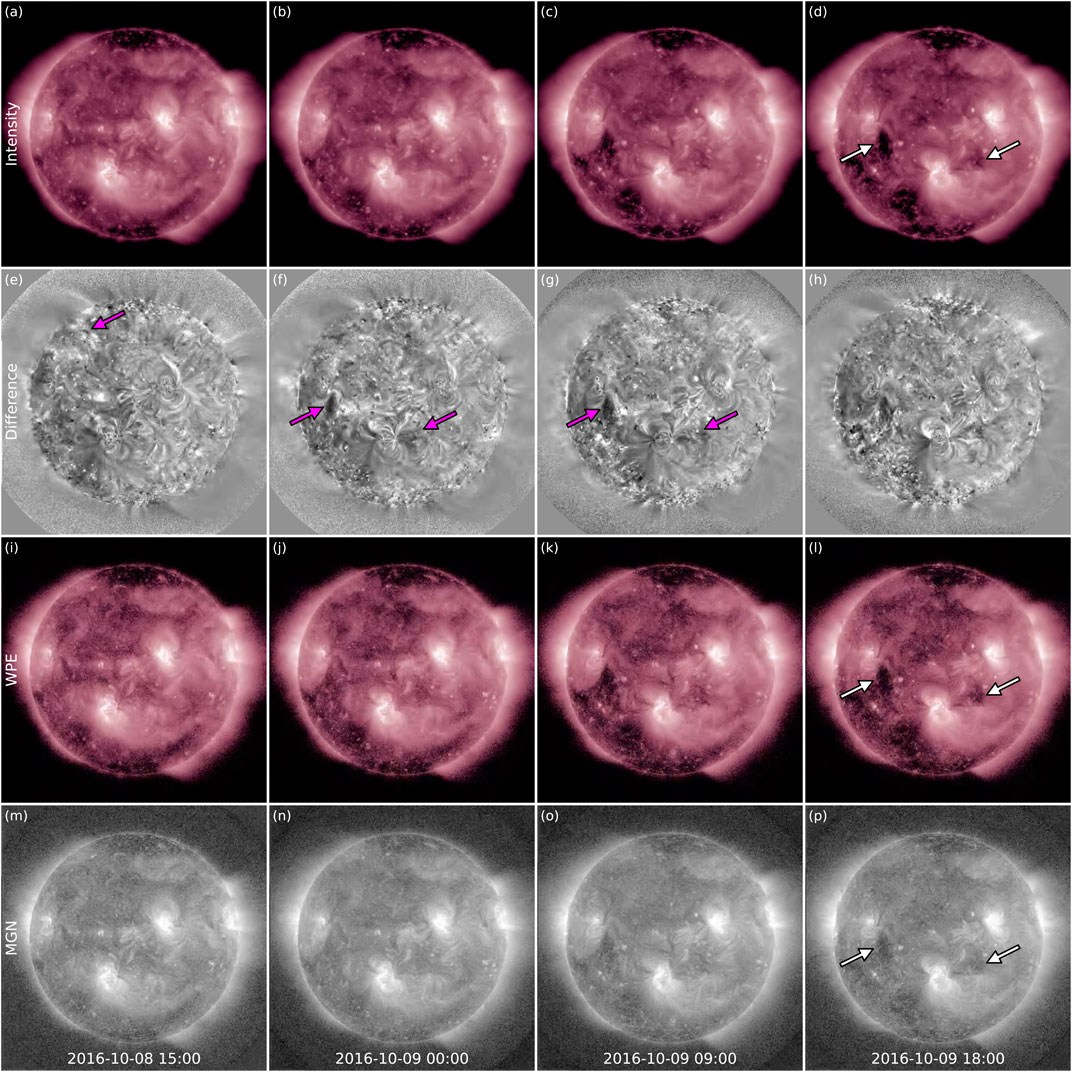
FIGURE 7. Imaging techniques applied to the 2016 October 8 CME (Event 4). SDO/AIA 211Å images are shown at four different times and processed with four different methods. (A–D) Intensity images. (E–H) Difference images with fixed
Results from applying geometric techniques to Event 4 are shown in Figure 8. In the top row, the red line indicates the approximate latitude of the CME core as derived from STEREO-A observations (marked with an arrow in Figure 8A, see also Supplementary Video S7) projected onto the solar disc from both available viewpoints. The latitude of ∼S02° is rather consistent with the dimming locations, but less compatible with the GCS reconstruction shown in the middle row of Figure 8, which gives a CME apex propagation direction of N12°E05°, indicating a significant deflection and/or non-radial propagation of the structure toward the north after eruption (this aspect can also be noted in Supplementary Video S8). The dimmings covered a longitudinal span of E44°–W22° at the time of the GCS reconstruction, highlighting the large-scale nature of the event, and were centered around E12°, i.e., well within the GCS uncertainties mentioned in Section 3.3. As was the case for Event 2 and Event 3, this eruption can be convincingly linked to low-coronal signatures (albeit weak), and as was the case for Event 1, relying uniquely on coronagraph imagery and GCS reconstructions would have resulted in a somewhat misleading estimated source region. The fact that this CME was a full halo as seen by SOHO and that only two viewpoints were available certainly contributed to the late reconstruction time, when the apex was already at
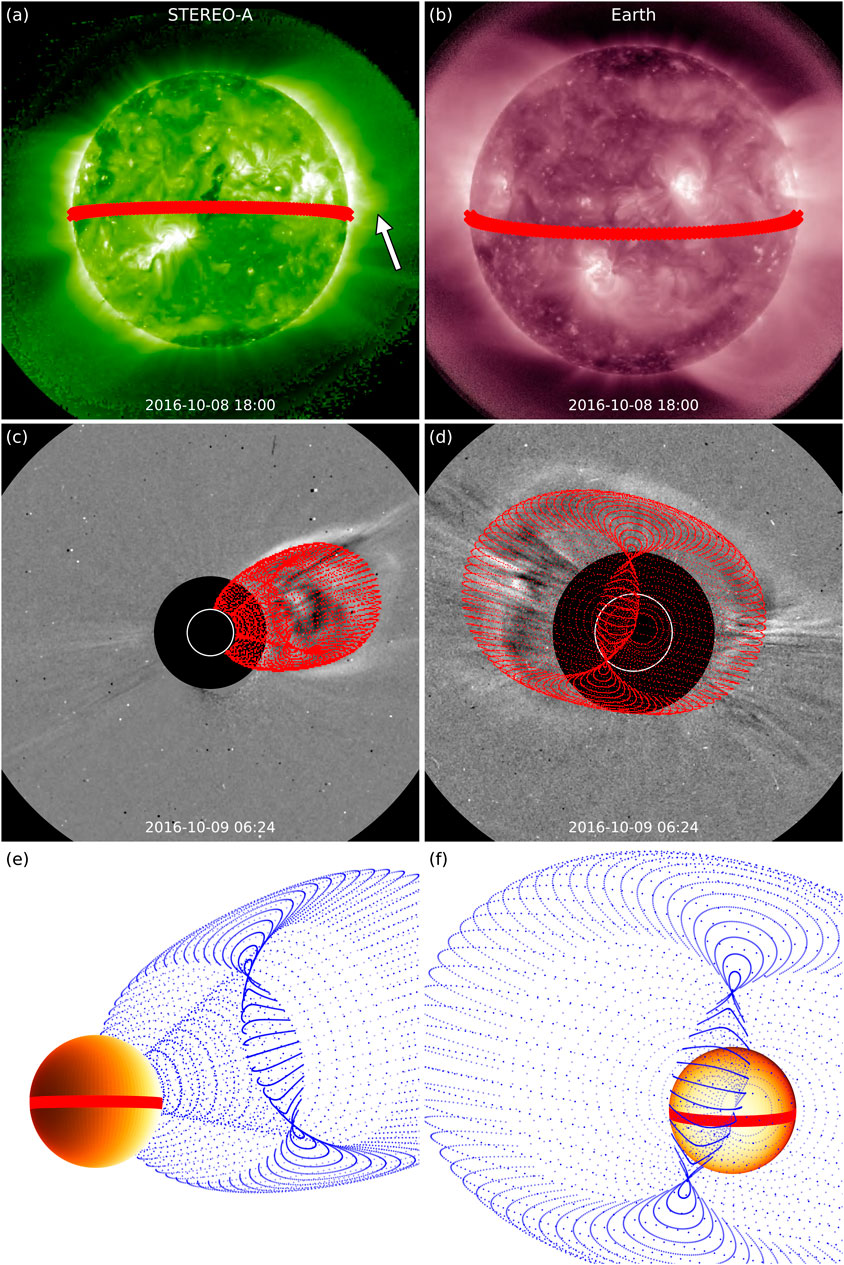
FIGURE 8. Geometric techniques applied to the 2016 October 8 CME (Event 4). (A–B) Latitude (thick red line) of the CME core (indicated with an arrow) projected onto the solar disc as seen by STEREO-A and SDO. (C–D) GCS reconstruction applied to the white-light structure seen in STEREO-A and SOHO. (E–F) The GCS-reconstructed CME displayed together with the “source latitude” from (A) and (B) in a 3D representation and shown from the two viewpoints of STEREO-A and Earth.
4 Discussion and Conclusion
In this work, we have presented and analyzed four stealth CMEs that presented diverse characteristics: a classic streamer blowout (Event 1), a CME originating from an active region (Event 2), a flux rope lying at unusually high altitudes prior to eruption (Event 3), and a significantly large-scale event (Event 4). These case studies were also characterized by different viewing geometries between the “stealthy perspective” (on the solar disc) and the off-limb observer(s): Event 1 had STEREO-A
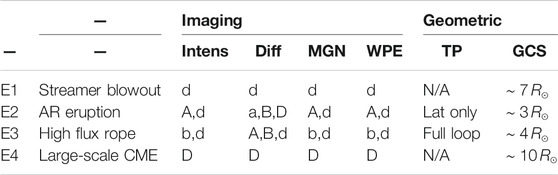
TABLE 1. Results from applying different imaging and geometric techniques to the events under study. For the imaging techniques, the observed eruption signatures are indicated, with A = arcade, B = brightening, and D = dimming. The upper cases denote strong signatures, while the lower cases denote only weak signatures. For the geometric techniques, it is indicated whether the TP method could be applied (N/A for events that only had one off-limb view available) and which features could be triangulated, as well as the radial distance from the Sun of the CME apex at which the earliest meaningful GCS reconstruction could be performed. The “latitude projection” scheme could in principle be applied to all events under study, since it only requires one off-limb viewpoint of the eruption, hence it is not shown here.
Analysis of solar disc imagery with various image processing techniques revealed the presence of signatures for all events, as shown in Table 1, albeit with different confidence levels. The most convincing evidence was found for Event 2 and Event 3, while Event 4 was associated with weak but reasonable signatures and Event 1 was characterized by the largest uncertainties. At least according to the small sample investigated here, it seems that the main factor contributing to the level of “stealthiness” is the spatial extent of the eruption rather than the altitude from which a CME lifts off (in particular, compare the size of the on-disc signatures for Event 1 and Event 4 with those for Event 2 and Event 3, which are significantly more localised). Another aspect to note is that the eruption associated with the weakest signatures (Event 1) was also the only event that did not feature a nearby active region or area of strong magnetic fields. Regarding the image processing techniques used, it is evident that difference images with large temporal separations revealed the clearest eruptive signatures, as was also reported by Nitta and Mulligan. (2017). Moreover, we note that even if dimmings are often evident enough in intensity data, brightenings tend to appear overwhelmingly clearer in difference images (see Event 2 and Event 3). In this work, we have used a fixed
Analysis of the events in this study with the aid of various geometric techniques has revealed that triangulation and reconstruction methods can help trace an eruption back to its source as long as they are used when the CME is as close as possible to the Sun. Given that most CME deflections and other non-radial propagation effects take place below a few solar radii (e.g., Kay et al., 2015; Kay and Opher, 2015; Liewer et al., 2015), it is crucial to determine the geometric parameters before the most dramatic evolution has occurred. In this sense, the CME propagation direction with respect to the observers plays a central role, as can be seen from the reconstructed CME apex heights shown in Table 1: among the cases investigated here, the best scenario was achieved for Event 2 and Event 3, in which the CMEs were propagating in directions well away from at least two viewpoints, enabling a meaningful GCS reconstruction to be made early on. The least favourable configuration happened for Event 4, where the CME was a full halo from one viewpoint and only a second observer was available, thus the apex was already at
The four events analyzed here took place during different stages of the solar cycle, with Event 1 happening at solar minimum, Event 2 and Event 3 close to solar maximum, and Event 4 in the midst of the descending phase of the cycle. Together with the different characteristics of each eruption summarized in Table 1, this indicates that stealth CMEs are not restricted to a particular set of source regions or solar activity period. Hence, although the long-standing question on the fundamental nature of stealth CMEs has not been officially answered yet, this study emphasizes that the characteristics of these events can be as diverse as those of “ordinary” eruptions. Other methods that may help advance current understanding of stealth CMEs include the study of the coronal environment from which these eruptions originate, as was done by O’Kane et al. (2021b) for Event 2 in this work. The authors concluded that flux emergence and magnetic reconnection episodes were observed in the CME source region prior to eruption, which led to the formation of the structure that later left the Sun as a stealth event, and that a high-altitude null point was revealed by photospheric magnetic field extrapolations of the pre-eruptive configuration. Moreover, images of the solar disc taken closer than 1 AU may more easily reveal the eruptive signatures of stealth CMEs. The Solar Orbiter (Müller et al., 2020) spacecraft, launched in February 2020 to orbit the Sun as close as
Data Availability Statement
All the solar data available in this study can be accessed at the Virtual Solar Observatory (http://sdac.virtualsolar.org/cgi/search). These data were visualised, processed, and analysed using Python's SunPy package (SunPy Community et al., 2020), IDL SolarSoft (Freeland and Handy, 1998), and the ESA JHelioviewer software (Müller et al., 2017). The original contributions presented in the study are included in the article/Supplementary Material, further inquiries can be directed to the corresponding author.
Author Contributions
EP and NN selected the events examined in this study and organized the various aspects of the analysis. EP led the investigation and wrote the draft manuscript. All authors participated in the discussions, read and critically reviewed the manuscript, approved the final version, and agreed to be accountable for all aspects of the work.
Funding
EP was supported by the NASA Living With a Star Jack Eddy Postdoctoral Fellowship Program, administered by UCAR’s Cooperative Programs for the Advancement of Earth System Science (CPAESS) under award no. NNX16AK22G. NN and TM acknowledge support from NASA grant no. NNX17AB73G. NN was partially supported by the NASA AIA contract no. NNG04EA00C and the NASA STEREO mission under NRL contract no. N00173-02-C-2035. MM and AZ thank the European Space Agency (ESA) and the Belgian Federal Science Policy Office (BELSPO) for their support in the framework of the PRODEX Programme. JO thanks the STFC for support via funding given in her PHD studentship. IR was supported by the STEREO mission and NASA program NNH17ZDA001N-LWS. SY would like to acknowledge NERC for funding via the SWIMMR Aviation Risk and Modelling (SWARM) Project, grant no. NE/V002899/1.
Conflict of Interest
The authors declare that the research was conducted in the absence of any commercial or financial relationships that could be construed as a potential conflict of interest.
Acknowledgments
The authors are pleased to acknowledge the International Space Science Institute (ISSI) for their support of International Team no. 415, “Understanding the Origins of Problem Geomagnetic Storms” (https://www.issibern.ch/teams/geomagstorm/), from which this work originated.
Supplementary Material
The Supplementary Material for this article can be found online at: https://www.frontiersin.org/articles/10.3389/fspas.2021.695966/full#supplementary-material
Footnotes
1Note that a halo CME is not necessarily Earth-directed, and a CME does not need to be a halo in order to impact Earth.
2CMEs have been called by various names since their discovery, ranging from “coronal transient phenomena” (MacQueen et al., 1974) to “mass ejections from the Sun” (Gosling et al., 1974). The term “coronal mass ejection” was first introduced by Gosling. (1975), but came into common usage only in the early 1980s.
References
Alzate, N., and Morgan, H. (2017). Identification of Low Coronal Sources of “Stealth” Coronal Mass Ejections Using New Image Processing Techniques. Astrophys. J. 840, 103. doi:10.3847/1538-4357/aa6caa
Attrill, G. D. R., Harra, L. K., van Driel-Gesztelyi, L., and Démoulin, P. (2007). Coronal “Wave”: Magnetic Footprint of a Coronal Mass Ejection? Astrophys. J. 656, L101–L104. doi:10.1086/512854
Attrill, G. D. R., and Wills-Davey, M. J. (2010). Automatic Detection and Extraction of Coronal Dimmings from SDO/AIA Data. Sol. Phys. 262, 461–480. doi:10.1007/s11207-009-9444-4
Bemporad, A., Mierla, M., and Tripathi, D. (2011). Rotation of an Erupting Filament Observed by the STEREO EUVI and COR1 Instruments. Astron. Astrophys. 531, A147. doi:10.1051/0004-6361/201016297
Bemporad, A. (2021). Possible Advantages of a Twin Spacecraft Heliospheric Mission at the Sun-Earth Lagrangian Points L4 and L5. Front. Astron. Space Sci. 8, 627576. doi:10.3389/fspas.2021.627576
Brueckner, G. E., Howard, R. A., Koomen, M. J., Korendyke, C. M., Michels, D. J., Moses, J. D., et al. (1995). The Large Angle Spectroscopic Coronagraph (LASCO). Sol. Phys. 162, 357–402. doi:10.1007/BF0073343410.1007/978-94-009-0191-9_10
Burlaga, L. F., Klein, L., Sheeley, N. R., Howard, R. A., Koomen, M. J., et al. (1982). A Magnetic Cloud and a Coronal Mass Ejection. Geophys. Res. Lett. 9, 1317–1320. doi:10.1029/GL009i012p01317
Cane, H. V., and Richardson, I. G. (2003). Interplanetary Coronal Mass Ejections in the Near-Earth Solar Wind during 1996-2002. J. Geophys. Res. 108, 1156. doi:10.1029/2002JA009817
SunPy Community, , , Barnes, W. T., Bobra, M. G., Christe, S. D., Freij, N., Hayes, L. A., et al. (2020). The SunPy Project: Open Source Development and Status of the Version 1.0 Core Package. Astrophys. J. 890, 68. doi:10.3847/1538-4357/ab4f7a
D'Huys, E., Seaton, D. B., Poedts, S., and Berghmans, D. (2014). Observational Characteristics of Coronal Mass Ejections without Low-Coronal Signatures. Astrophys. J. 795, 49. doi:10.1088/0004-637X/795/1/49
Delaboudinière, J.-P., Artzner, G. E., Brunaud, J., Gabriel, A. H., Hochedez, J. F., Millier, F., et al. (1995). EIT: Extreme-Ultraviolet Imaging Telescope for the SOHO Mission. Sol. Phys. 162, 291–312. doi:10.1007/BF00733432
Demastus, H. L., Wagner, W. J., and Robinson, R. D. (1973). Coronal Disturbances. Sol. Phys. 31, 449–459. doi:10.1007/BF00152820
Domingo, V., Fleck, B., and Poland, A. I. (1995). The SOHO Mission: an Overview. Sol. Phys. 162, 1–37. doi:10.1007/BF00733425
Freeland, S. L., and Handy, B. N. (1998). Data Analysis with the SolarSoft System. Sol. Phys. 182, 497–500. doi:10.1023/A:1005038224881
Freiherr von Forstner, J. L., Dumbović, M., Möstl, C., Guo, J., Papaioannou, A., Elftmann, R., et al. (2021). Radial Evolution of the April 2020 Stealth Coronal Mass Ejection between 0.8 and 1 AU. Comparison of Forbush Decreases at Solar Orbiter and Near the Earth. Astron. Astrophys.. doi:10.1051/0004-6361/202039848
Gibson, S. E., Foster, D., Burkepile, J., de Toma, G., and Stanger, A. (2006). The Calm before the Storm: The Link between Quiescent Cavities and Coronal Mass Ejections. Astrophys. J. 641, 590–605. doi:10.1086/500446
Gibson, S. E., Vourlidas, A., Hassler, D. M., Rachmeler, L. A., Thompson, M. J., Newmark, J., et al. (2018). Solar Physics from Unconventional Viewpoints. Front. Astron. Space Sci. 5, 32. doi:10.3389/fspas.2018.00032
Gosling, J. T., Hildner, E., MacQueen, R. M., Munro, R. H., Poland, A. I., and Ross, C. L. (1974). Mass Ejections from the Sun: A View from Skylab. J. Geophys. Res. 79, 4581–4587. doi:10.1029/JA079i031p04581
Gosling, J. T. (1975). Large-scale Inhomogeneities in the Solar Wind of Solar Origin. Rev. Geophys. 13, 1053–1058. doi:10.1029/RG013i003p01053
Green, L. M., Kliem, B., Török, T., van Driel-Gesztelyi, L., and Attrill, G. D. R. (2007). Transient Coronal Sigmoids and Rotating Erupting Flux Ropes. Sol. Phys. 246, 365–391. doi:10.1007/s11207-007-9061-z
Halain, J.-P., Berghmans, D., Seaton, D. B., Nicula, B., De Groof, A., Mierla, M., et al. (2013). The SWAP EUV Imaging Telescope. Part II: In-Flight Performance and Calibration. Sol. Phys. 286, 67–91. doi:10.1007/s11207-012-0183-6
He, W., Liu, Y. D., Hu, H., Wang, R., and Zhao, X. (2018). A Stealth CME Bracketed between Slow and Fast Wind Producing Unexpected Geoeffectiveness. Astrophys. J. 860, 78. doi:10.3847/1538-4357/aac381
Howard, R. A., Michels, D. J., Sheeley, N. R. J., and Koomen, M. J. (1982). The Observation of a Coronal Transient Directed at Earth. Astrophys. J. 263, L101–L104. doi:10.1086/183932
Howard, R. A., Moses, J. D., Vourlidas, A., Newmark, J. S., Socker, D. G., Plunkett, S. P., et al. (2008). Sun Earth Connection Coronal and Heliospheric Investigation (SECCHI). Space Sci. Rev. 136, 67–115. doi:10.1007/s11214-008-9341-4
Howard, T. A., and Harrison, R. A. (2013). Stealth Coronal Mass Ejections: A Perspective. Sol. Phys. 285, 269–280. doi:10.1007/s11207-012-0217-0
Hudson, H. S., Acton, L. W., Hirayama, T., and Uchida, Y. (1992). White-light Flares Observed by YOHKOH. Pub. Astron. Soc. Jpn. 44, L77–L81.
Hudson, H. S., and Cliver, E. W. (2001). Observing Coronal Mass Ejections without Coronagraphs. J. Geophys. Res. 106, 25199–25214. doi:10.1029/2000JA90402610.1029/2000ja004026
Illing, R. M. E., and Hundhausen, A. J. (1985). Observation of a Coronal Transient from 1.2 to 6 Solar Radii. J. Geophys. Res. 90, 275–282. doi:10.1029/JA090iA01p00275
Isavnin, A., Vourlidas, A., and Kilpua, E. K. J. (2014). Three-Dimensional Evolution of Flux-Rope CMEs and its Relation to the Local Orientation of the Heliospheric Current Sheet. Sol. Phys. 289, 2141–2156. doi:10.1007/s11207-013-0468-4
Kahler, S. W., and Hudson, H. S. (2001). Origin and Development of Transient Coronal Holes. J. Geophys. Res. 106, 29239–29247. doi:10.1029/2001JA000127
Kaiser, M. L., Kucera, T. A., Davila, J. M., St. Cyr, O. C. O. C., Guhathakurta, M., and Christian, E. (2008). The STEREO Mission: An Introduction. Space Sci. Rev. 136, 5–16. doi:10.1007/s11214-007-9277-0
Kay, C., Opher, M., and Evans, R. M. (2015). Global Trends of CME Deflections Based on CME and Solar Parameters. Astrophys. J. 805, 168. doi:10.1088/0004-637X/805/2/168
Kay, C., and Opher, M. (2015). The Heliocentric Distance where the Deflections and Rotations of Solar Coronal Mass Ejections Occur. Astrophys. J. 811, L36. doi:10.1088/2041-8205/811/2/L36
Kilpua, E. K. J., Mierla, M., Zhukov, A. N., Rodriguez, L., Vourlidas, A., and Wood, B. (2014). Solar Sources of Interplanetary Coronal Mass Ejections during the Solar Cycle 23/24 Minimum. Sol. Phys. 289, 3773–3797. doi:10.1007/s11207-014-0552-4
Koomen, M. J., Detwiler, C. R., Brueckner, G. E., Cooper, H. W., and Tousey, R. (1975). White Light Coronagraph in OSO-7. Appl. Opt. 14, 743–751. doi:10.1364/AO.14.000743
Lavraud, B., Liu, Y., Segura, K., He, J., Qin, G., Temmer, M., et al. (2016). A Small mission Concept to the Sun-Earth Lagrangian L5 point for Innovative Solar, Heliospheric and Space Weather Science. J. Atmos. Solar-Terrestrial Phys. 146, 171–185. doi:10.1016/j.jastp.2016.06.004
Lemen, J. R., Title, A. M., Akin, D. J., Boerner, P. F., Chou, C., Drake, J. F., et al. (2012). The Atmospheric Imaging Assembly (AIA) on the Solar Dynamics Observatory (SDO). Sol. Phys. 275, 17–40. doi:10.1007/s11207-011-9776-8
Liewer, P. C., Hall, J. R., Howard, R. A., De Jong, E. M., Thompson, W. T., and Thernisien, A. (2011). Stereoscopic Analysis of STEREO/SECCHI Data for CME Trajectory Determination. J. Atmos. Solar-Terrestrial Phys. 73, 1173–1186. doi:10.1016/j.jastp.2010.09.004
Liewer, P. C., Qiu, J., Vourlidas, A., Hall, J. R., and Penteado, P. (2021). Evolution of a Streamer-Blowout CME as Observed by Imagers on Parker Solar Probe and the Solar Terrestrial Relations Observatory. Astron. Astrophys. 650, A32. doi:10.1051/0004-6361/202039641
Liewer, P., Panasenco, O., Vourlidas, A., and Colaninno, R. (2015). Observations and Analysis of the Non-radial Propagation of Coronal Mass Ejections Near the Sun. Sol. Phys. 290, 3343–3364. doi:10.1007/s11207-015-0794-9
Lynch, B. J., Li, Y., Thernisien, A. F. R., Robbrecht, E., Fisher, G. H., Luhmann, J. G., et al. (2010). Sun to 1 AU Propagation and Evolution of a Slow Streamer-Blowout Coronal Mass Ejection. J. Geophys. Res. 115, A07106. doi:10.1029/2009JA015099
Lynch, B. J., Masson, S., Li, Y., DeVore, C. R., Luhmann, J. G., Antiochos, S. K., et al. (2016). A Model for Stealth Coronal Mass Ejections. J. Geophys. Res. Space Phys. 121 (10677–10), 697. doi:10.1002/2016JA023432
Ma, S., Attrill, G. D. R., Golub, L., and Lin, J. (2010). Statistical Study of Coronal Mass Ejections with and without Distinct Low Coronal Signatures. Astrophys. J. 722, 289–301. doi:10.1088/0004-637X/722/1/289
MacQueen, R. M., Eddy, J. A., Gosling, J. T., Hildner, E., Munro, R. H., Newkirk, G. A. J., et al. (1974). The Outer Solar Corona as Observed from Skylab: Preliminary Results. Astrophys. J. Lett. 187, L85. doi:10.1086/181402
Martin, S. F. (1979). Study of the Post-Flare Loops on 1973JULY29 - Part Three - Dynamics of the Hα Loops. Sol. Phys. 64, 165–176. doi:10.1007/BF00151125
McAllister, A. H., Dryer, M., McIntosh, P., Singer, H., and Weiss, L. (1996). A Large Polar crown Coronal Mass Ejection and a “Problem” Geomagnetic Storm: April 14-23, 1994. J. Geophys. Res. 101, 13497–13516. doi:10.1029/96JA00510
Michels, D. J., Howard, R. A., Koomen, M. J., Sheeley, J., and N, R. (1980). “Satellite Observations of the Outer corona Near sunspot Maximum,”. E. Gergely. Radio Physics of the Sun, IAS Symposium. Editors M. R. Kundu, and T. Kundu, 86, 439–442. doi:10.1017/S007418090003719010.1007/978-94-010-9722-2_62
Mierla, M., Davila, J., Thompson, W., Inhester, B., Srivastava, N., Kramar, M., et al. (2008). A Quick Method for Estimating the Propagation Direction of Coronal Mass Ejections Using STEREO-COR1 Images. Sol. Phys. 252, 385–396. doi:10.1007/s11207-008-9267-8
Mierla, M., Inhester, B., Antunes, A., Boursier, Y., Byrne, J. P., Colaninno, R., et al. (2010). On the 3-D Reconstruction of Coronal Mass Ejections Using Coronagraph Data. Ann. Geophys. 28, 203–215. doi:10.5194/angeo-28-203-2010
Mierla, M., Inhester, B., Marqué, C., Rodriguez, L., Gissot, S., Zhukov, A. N., et al. (2009). On 3D Reconstruction of Coronal Mass Ejections: I. Method Description and Application to SECCHI-COR Data. Sol. Phys. 259, 123–141. doi:10.1007/s11207-009-9416-8
Morgan, H., and Druckmüller, M. (2014). Multi-Scale Gaussian Normalization for Solar Image Processing. Sol. Phys. 289, 2945–2955. doi:10.1007/s11207-014-0523-9
Möstl, C., Farrugia, C. J., Temmer, M., Miklenic, C., Veronig, A. M., Galvin, A. B., et al. (2009). Linking Remote Imagery of a Coronal Mass Ejection to its In Situ Signatures at 1 AU. Astrophys. J. Lett. 705, L180–L185. doi:10.1088/0004-637X/705/2/L180
Müller, D., Cyr, St. O. C., Zouganelis, I., Gilbert, H. R., Marsden, R., Nieves-Chinchilla, T., et al. (2020). The Solar Orbiter MIssion: Science Overview. Astron. Astrophys. 642, A1. doi:10.1051/0004-6361/202038467
Müller, D., Nicula, B., Felix, S., Verstringe, F., Bourgoignie, B., Csillaghy, A., et al. (2017). JHelioviewer. Time-dependent 3D Visualisation of Solar and Heliospheric Data. Astron. Astrophys. 606, A10. doi:10.1051/0004-6361/201730893
Munro, R. H., Gosling, J. T., Hildner, E., MacQueen, R. M., Poland, A. I., and Ross, C. L. (1979). The Association of Coronal Mass Ejection Transients with Other Forms of Solar Activity. Sol. Phys. 61, 201–215. doi:10.1007/BF00155456
Nieves-Chinchilla, T., Gómez-Herrero, R., Viñas, A. F., Malandraki, O., Dresing, N., Hidalgo, M. A., et al. (2011). Analysis and Study of the In Situ Observation of the June 1st 2008 CME by STEREO. J. Atmos. Solar-terr. Phys. 73, 1348–1360. doi:10.1016/j.jastp.2010.09.026
Nieves-Chinchilla, T., Vourlidas, A., Stenborg, G., Savani, N. P., Koval, A., Szabo, A., et al. (2013). Inner Heliospheric Evolution of a “Stealth” CME Derived from Multi-View Imaging and Multipoint In Situ Observations. I. Propagation to 1 AU. Astrophys. J. 779, 55. doi:10.1088/0004-637X/779/1/55
Nitta, N. V., and Mulligan, T. (2017). Earth-Affecting Coronal Mass Ejections without Obvious Low Coronal Signatures. Sol. Phys. 292, 125. doi:10.1007/s11207-017-1147-7
Ogawara, Y., Takano, T., Kato, T., Kosugi, T., Tsuneta, S., Watanabe, T., et al. (1991). The SOLAR-A Mission: An Overview. Sol. Phys. 136, 1–16. doi:10.1007/BF00151692
O’Kane, J., Green, L., Long, D. M., and Reid, H. (2019). Stealth Coronal Mass Ejections from Active Regions. Astrophys. J. 882, 85. doi:10.3847/1538-4357/ab371b
O’Kane, J., Green, L. M., Davies, E. E., Möstl, C., Hinterreiter, J., von Forstner, J. L. F., et al. (2021a). Solar Origins of a strong Stealth CME Detected by Solar Orbiter. Astron. Astrophys. doi:10.1051/0004-6361/202140622
O’Kane, J., Mac Cormack, C., Mandrini, C. H., Démoulin, P., Green, L. M., Long, D. M., et al. (2021b). The Magnetic Environment of a Stealth Coronal Mass Ejection. Astrophys. J. 908, 89. doi:10.3847/1538-4357/abd2bf
Palmerio, E., Kilpua, E. K. J., James, A. W., Green, L. M., Pomoell, J., Isavnin, A., et al. (2017). Determining the Intrinsic CME Flux Rope Type Using Remote-Sensing Solar Disk Observations. Sol. Phys. 292, 39. doi:10.1007/s11207-017-1063-x
Palmerio, E., Kilpua, E. K. J., Witasse, O., Barnes, D., Sánchez-Cano, B., Weiss, A. J., et al. (2021). CME Magnetic Structure and IMF Preconditioning Affecting SEP Transport. Space Weather 19, e2020SW002654. doi:10.1029/2020SW002654
Panasenco, O., Martin, S. F., Velli, M., and Vourlidas, A. (2013). Origins of Rolling, Twisting, and Non-radial Propagation of Eruptive Solar Events. Sol. Phys. 287, 391–413. doi:10.1007/s11207-012-0194-3
Pesnell, W. D., Thompson, B. J., and Chamberlin, P. C. (2012). The Solar Dynamics Observatory (SDO). Sol. Phys. 275, 3–15. doi:10.1007/s11207-011-9841-3
Pevtsov, A. A., Panasenco, O., and Martin, S. F. (2012). Coronal Mass Ejections from Magnetic Systems Encompassing Filament Channels without Filaments. Sol. Phys. 277, 185–201. doi:10.1007/s11207-011-9881-8
Richardson, I. G., and Cane, H. V. (2010). Near-Earth Interplanetary Coronal Mass Ejections during Solar Cycle 23 (1996 - 2009): Catalog and Summary of Properties. Sol. Phys. 264, 189–237. doi:10.1007/s11207-010-9568-6
Robbrecht, E., Patsourakos, S., and Vourlidas, A. (2009). No Trace Left behind: STEREO Observation of a Coronal Mass Ejection without Low Coronal Signatures. Astrophys. J. 701, 283–291. doi:10.1088/0004-637X/701/1/283
Rust, D. M., and Bar, V. (1973). Magnetic fields, Loop Prominences and the Great Flares of August, 1972. Sol. Phys. 33, 445–459. doi:10.1007/BF0015243210.1007/bf00152391
Rust, D. M., and Kumar, A. (1996). Evidence for Helically Kinked Magnetic Flux Ropes in Solar Eruptions. Astrophys. J. Lett. 464, L199. doi:10.1086/310118
Rust, D. M., Nakagawa, Y., and Neupert, W. M. (1975). EUV Emission, Filament Activation and Magnetic Fields in a Slow-Rise Flare. Sol. Phys. 41, 397–414. doi:10.1007/BF00154077
Rust, D. M., and Webb, D. F. (1977). Soft X-ray Observations of Large-Scale Coronal Active Region Brightenings. Sol. Phys. 54, 403–417. doi:10.1007/BF00159932
Santandrea, S., Gantois, K., Strauch, K., Teston, F., Tilmans, E., Baijot, C., et al. (2013). PROBA2: Mission and Spacecraft Overview. Sol. Phys. 286, 5–19. doi:10.1007/s11207-013-0289-5
Schmidt, J. M., Cairns, I. H., Xie, H., Cyr, St. O. C., and Gopalswamy, N. (2016). CME Flux Rope and Shock Identifications and Locations: Comparison of white Light Data, Graduated Cylindrical Shell Model, and MHD Simulations. J. Geophys. Res. Space Phys. 121, 1886–1906. doi:10.1002/2015JA021805
Schwenn, R., dal Lago, A., Huttunen, E., and Gonzalez, W. D. (2005). The Association of Coronal Mass Ejections with Their Effects Near the Earth. Ann. Geophys. 23, 1033–1059. doi:10.5194/angeo-23-1033-2005
Seaton, D. B., Berghmans, D., Nicula, B., Halain, J. P., De Groof, A., Thibert, T., et al. (2013). The SWAP EUV Imaging Telescope Part I: Instrument Overview and Pre-flight Testing. Sol. Phys. 286, 43–65. doi:10.1007/s11207-012-0114-6
Sheeley, J., N. R., Bohlin, J. D., Brueckner, G. E., Purcell, J. D., Scherrer, V. E., Tousey, R., et al. (1975). Coronal Changes Associated with a Disappearing Filament. Sol. Phys. 45, 377–392. doi:10.1007/BF00158457
Shensa, M. J. (1992). The Discrete Wavelet Transform: Wedding the a Trous and Mallat Algorithms. IEEE Trans. Signal. Process. 40, 2464–2482. doi:10.1109/78.157290
Shi, T., Wang, Y., Wan, L., Cheng, X., Ding, M., and Zhang, J. (2015). Predicting the Arrival Time of Coronal Mass Ejections with the Graduated Cylindrical Shell and Drag Force Model. Astrophys. J. 806, 271. doi:10.1088/0004-637X/806/2/271
Srivastava, N., Inhester, B., Mierla, M., and Podlipnik, B. (2009). 3D Reconstruction of the Leading Edge of the 20 May 2007 Partial Halo CME. Sol. Phys. 259, 213–225. doi:10.1007/s11207-009-9423-9
Stenborg, G., and Cobelli, P. J. (2003). A Wavelet Packets Equalization Technique to Reveal the Multiple Spatial-Scale Nature of Coronal Structures. Astron. Astrophys. 398, 1185–1193. doi:10.1051/0004-6361:20021687
Stenborg, G., Vourlidas, A., and Howard, R. A. (2008). A Fresh View of the Extreme-Ultraviolet Corona from the Application of a New Image-Processing Technique. Astrophys. J. 674, 1201–1206. doi:10.1086/525556
Talpeanu, D. C., Chané, E., Poedts, S., D’Huys, E., Mierla, M., Roussev, I., et al. (2020). Numerical Simulations of Shear-Induced Consecutive Coronal Mass Ejections. Astron. Astrophys. 637, A77. doi:10.1051/0004-6361/202037477
Thernisien, A. F. R., Howard, R. A., and Vourlidas, A. (2006). Modeling of Flux Rope Coronal Mass Ejections. Astrophys. J. 652, 763–773. doi:10.1086/508254
Thernisien, A. (2011). Implementation of the Graduated Cylindrical Shell Model for the Three-Dimensional Reconstruction of Coronal Mass Ejections. Astrophys. J. Suppl. 194, 33. doi:10.1088/0067-0049/194/2/33
Thernisien, A., Vourlidas, A., and Howard, R. A. (2009). Forward Modeling of Coronal Mass Ejections Using STEREO/SECCHI Data. Sol. Phys. 256, 111–130. doi:10.1007/s11207-009-9346-5
Thompson, B. J., Cliver, E. W., Nitta, N., Delannée, C., and Delaboudinière, J.-P. (2000). Coronal Dimmings and Energetic CMEs in April-May 1998. Geophys. Res. Lett. 27, 1431–1434. doi:10.1029/1999GL003668
Thompson, B. J., Plunkett, S. P., Gurman, J. B., Newmark, J. S., Cyr, St. O. C., and Michels, D. J. (1998). SOHO/EIT Observations of an Earth-Directed Coronal Mass Ejection on May 12, 1997. Geophys. Res. Lett. 25, 2465–2468. doi:10.1029/98GL50429
Thompson, W. T. (2009). 3D Triangulation of a Sun-Grazing Comet. Icarus 200, 351–357. doi:10.1016/j.icarus.2008.12.011
Thompson, W. T., Kliem, B., and Török, T. (2012). 3D Reconstruction of a Rotating Erupting Prominence. Sol. Phys. 276, 241–259. doi:10.1007/s11207-011-9868-5
Tousey, R. (1977). Apollo-telescope Mount of Skylab: An Overview. Appl. Opt. 16, 825–836. doi:10.1364/AO.16.000825
Tripathi, D., Bothmer, V., and Cremades, H. (2004). The Basic Characteristics of EUV post-eruptive Arcades and Their Role as Tracers of Coronal Mass Ejection Source Regions. Astron. Astrophys. 422, 337–349. doi:10.1051/0004-6361:20035815
Tsuneta, S., Acton, L., Bruner, M., Lemen, J., Brown, W., Caravalho, R., et al. (1991). The Soft X-ray Telescope for the SOLAR-A mission. Sol. Phys. 136, 37–67. doi:10.1007/BF00151694
Vourlidas, A., Colaninno, R., Nieves-Chinchilla, T., and Stenborg, G. (2011). The First Observation of a Rapidly Rotating Coronal Mass Ejection in the Middle Corona. Astrophys. J. Lett. 733, L23. doi:10.1088/2041-8205/733/2/L23
Vourlidas, A., Lynch, B. J., Howard, R. A., and Li, Y. (2013). How Many CMEs Have Flux Ropes? Deciphering the Signatures of Shocks, Flux Ropes, and Prominences in Coronagraph Observations of CMEs. Sol. Phys. 284, 179–201. doi:10.1007/s11207-012-0084-8
Vourlidas, A. (2015). Mission to the Sun-Earth L Lagrangian Point: An Optimal Platform for Space Weather Research. Space Weather 13, 197–201. doi:10.1002/2015SW001173
Vourlidas, A., and Webb, D. F. (2018). Streamer-blowout Coronal Mass Ejections: Their Properties and Relation to the Coronal Magnetic Field Structure. Astrophys. J. 861, 103. doi:10.3847/1538-4357/aaca3e
Yurchyshyn, V., Abramenko, V., and Tripathi, D. (2009). Rotation of White-light Coronal Mass Ejection Structures as Inferred from LASCO Coronagraph. Astrophys. J. 705, 426–435. doi:10.1088/0004-637X/705/1/426
Zhang, J., Richardson, I. G., Webb, D. F., Gopalswamy, N., Huttunen, E., Kasper, J. C., et al. (2007). Solar and Interplanetary Sources of Major Geomagnetic Storms (Dst nT) during 1996-2005. J. Geophys. Res. 112, A10102. doi:10.1029/2007JA012321
Keywords: sun, coronal mass ejection, stealth coronal mass ejection, solar corona, space weather, remote-sensing analysis
Citation: Palmerio E, Nitta NV, Mulligan T, Mierla M, O’Kane J, Richardson IG, Sinha S, Srivastava N, Yardley SL and Zhukov AN (2021) Investigating Remote-Sensing Techniques to Reveal Stealth Coronal Mass Ejections. Front. Astron. Space Sci. 8:695966. doi: 10.3389/fspas.2021.695966
Received: 15 April 2021; Accepted: 14 June 2021;
Published: 05 July 2021.
Edited by:
Xueshang Feng, State Key Laboratory of Space Weather, National Space Science Center (CAS), ChinaReviewed by:
Huw Morgan, Aberystwyth University, United KingdomMing Xiong, National Space Science Center (CAS), China
Copyright © 2021 Palmerio, Nitta, Mulligan, Mierla, O’Kane, Richardson, Sinha, Srivastava, Yardley and Zhukov. This is an open-access article distributed under the terms of the Creative Commons Attribution License (CC BY). The use, distribution or reproduction in other forums is permitted, provided the original author(s) and the copyright owner(s) are credited and that the original publication in this journal is cited, in accordance with accepted academic practice. No use, distribution or reproduction is permitted which does not comply with these terms.
*Correspondence: Erika Palmerio, ZXBhbG1lcmlvQGJlcmtlbGV5LmVkdQ==