 Jen-Iu Lo
 Rana Ghosh
 Hsiao-Chi Lu1
 Bing-Ming Cheng
- 1Department of Medical Research, Hualien Tzu Chi Hospital, Buddhist Tzu Chi Medical Foundation, Hualien, Taiwan
- 2Department of Chemistry, National Taiwan Normal University, Taipei, Taiwan
- 3Tzu-Chi University of Science and Technology, Hualien, Taiwan
The thermal variation of absorption spectra of icy ethene in wavelength range 105–220 nm was measured from 13 to 100 K using a synchrotron as light source. Sublimation of icy ethene began above 62 K, resulting in decreasing absorption. The absorption of icy ethene increased at wavelengths less than about 150 nm with increasing temperature from 13 to 60 K, but decreased beyond above 150 nm. According to detailed examination, the absorption spectra of icy ethene intersected at isosbestic point 147.0 nm from 13 to 17 K, whereas those varied absorption profiles crossed at another point, 150.6 nm, from 23 to 60 K. These results indicate that ethene ices might exhibit three structures within temperature range 13–60 K. This work enhances our understanding of the spectra of icy ethene at low temperatures and our knowledge of its astrochemistry and astrophysics in cold astro-environments.
Introduction
Absorption spectra of condensed and gaseous molecules typically exhibit profiles that depend on the response to the presence or absence of interaction of the molecule with other adjacent molecules. The gaseous molecule behaves as isolated, with no perturbation from other molecules; its spectral profile hence reveals the intrinsic properties of a single molecule. In contrast, the molecules in condensed phases are inevitably involved in intermolecular interactions with adjacent molecules; their spectra hence invariably involve the collective effects of the molecules in the condensed state (Lu et al., 2005; Chou et al., 2018; Lo et al., 2018).
The absorption spectra of molecules might exhibit a temperature effect associated with the couplings of vibrational and rotational transitions; the thermal variations of spectra of molecules are thus interesting for both research and applications. The thermal spectral responses of condensed and gaseous molecules might thus differ with or without the interaction of adjacent molecules. The thermal variation of absorption for a molecule in the gaseous phase (Lu et al., 2010; Cheng et al., 2011) is generally greater than that in a condensed state; for the thermal effect on spectra, attention has been devoted much to the gaseous molecule and little to condensed molecules. For this reason, an investigation of the thermal absorption for molecules in condensed phases is lacking, and needs to be established.
Ethene, C2H4, is the simplest stable hydrocarbon molecule with a double bond. It has been detected in Jupiter, Saturn, Titan, Neptune, Pluto, comets and star IRC +10216 (Encrenaz et al., 1975; Betz, 1981; Hanel et al., 1981; Goldhaber et al., 1987; Kostiuk et al., 1993; Schulz et al., 1999; Fonfría et al., 2017); observations of icy ethene have been reported elsewhere in cold space. Vacuum-ultraviolet (VUV) radiation is an important driving force for the evolution in the universe of astro-molecules. To understand the VUV photochemistry of ethene in cold astro-environments, it is first necessary to study the VUV absorption of icy ethene in the laboratory. The melting point of pure ethene is 104 K; condensed solid ethene can thus exist below 100 K in cold space. To investigate this system, we thus recorded the VUV absorption spectra of icy ethene in wavelength range 105–220 nm from 13 to 100 K; for explanation the results, we suggest that ethene ices might contain three icy structures at low temperature. Besides the UV/VUV data, also IR absorption spectra are presented to strengthen the discussion about the changes in the icy structure, by comparison with available literature (Hudson et al., 2014). The results enhance our understanding of the spectra of icy ethene in cold astro-environments.
Materials and Methods
We recorded the absorption spectra of pure solid C2H4 in the ultraviolet (UV) and vacuum-ultraviolet region to the limit of transmission of optical components, about 105 nm. The apparatus is described elsewhere (Lu et al., 2005; Chou et al., 2014). In short, the UV/VUV absorption spectra were recorded at an end station attached to synchrotron beamline 03 (BL03), which was coupled to the 1.5 GeV storage ring at Taiwan Light Source (TLS) in National Synchrotron Radiation Research Center (NSRRC). The BL03 is appended a cylindrical-grating monochromator (CGM, 6 m) equipped with four gratings; in this work, we used a grating (450 L/mm) to provide light suitable for wavelength range 100–250 nm. The intensity of the UV/VUV light was monitored with a gold mesh transmitting about 90% and recorded with an electrometer (Keithley 6512). The radiation was incident on samples in a beam of nearly rectangular cross section, ∼8 × 5 mm2, which delivers a mean flux 2 × 10¹¹ photons s−1 after passage through a LiF window as harmonic filter. The storage ring of the synchrotron was operated to maintain a constant beam current of electrons by means of injection of a few electrons into the ring every minute; the electron current hence maintained 99.5 percent stability.
The light dispersed from BL03 irradiated the icy sample on a LiF window cooled with a cryostat. The UV/VUV light was incident on the icy sample in a perpendicular beam. The transmitted light impinged on a glass window coated with sodium salicylate; the fluorescence was detected with a photomultiplier tube (Hamamatsu R943) in a photon-counting mode (Lu et al., 2020). The absorption spectra were recorded at spectral resolution 0.2 nm. C2H4 was deposited onto the LiF window, attached to a rotary cryostat (APD HC-DE204S), which could be cooled to 13 K as minimum temperature. A turbo-molecular pump backed with a scroll pump evacuated the chamber of the end station to a pressure less than 8 μPa. For UV/VUV absorption measurement, the gaseous C2H4 was deposited onto the LiF substrate at 13 K. The quantity of deposition was regulated at the pressure 25 μPa for a period of 60 s; the sample film was estimated in thickness less than 0.3 μm.
For IR absorption measurement, the spectra were recorded with the end-station attached to the beamline BL21A2 at TLS (Lo et al., 2014; Lo et al., 2019). A closed-cycle cryogenic refrigerator (Janis RDK-415) employed to cool the KBr substrate; in which, the cryo-chamber was evacuated with a turbomolecular pump under the pressure less than 4 μPa. The rate of deposition was regulated at 2.2 μmol s−1 for a period of 160 s; the thickness of the film was estimated about 2 μm. IR spectra were recorded at various temperatures with an interferometric spectrometer (Bomem DA8) equipped with a HgCdTe detector to cover the spectral range 500–4,000 cm−1 at resolution 0.5 cm−1; typically, the IR spectra were accumulated with 400 scans. We recorded spectra at the minimum temperature 8 K and then after increasing the temperature to selected values; which were controlled by a temperature controller (LakeShore 340) with a rising rate 1 K/min.
Gaseous C2H4 was purchased from Matheson Gases with a nominal purity 99.99%; by passing through a cold trap maintained at 180 K, the gaseous C2H4 were deposited onto the LiF and the KBr substrates at 13 and 8 K, respectively.
Results and Discussion
Figure 1A displays the absorption spectrum, in terms of cross section (Mb = 10–18 cm2/molecule), of gaseous C2H4 in wavelength range 105–185 nm at 298 K. Gaseous C2H4 possesses strong absorption in the VUV region (Lu et al., 2004); the absorption curve exhibits characteristic features associated with Rydberg transitions in series in wavelength range 105–185 nm. Among these absorption lines, the features in wavelength region 150–180 nm are due to the 3s Rydberg transition with maximum cross section 58 Mb at 170 nm, whereas those occurring in region 130–140 nm correspond to 3d and 4d Rydberg transitions. Absorption lines from 130 to 118 nm are attributed to overlapping transitions to 4d, 5d, 5s, and 6s Rydberg states (Zelikoff and Watanabe, 1953; Wilkinson and Mulliken, 1955; Person and Nicole, 1968; McDiarmid, 1980; Xia et al., 1991; Holland et al., 1997). The absorption cross sections of gaseous ethene was measured by Wu et al. in the wavelength region 118–180 nm at 370, 330, 295, 200, and 140 K (Wu et al., 2004); compared to their data, our absorption curve obtained at 298 K is in satisfactory agreement with theirs recorded at 295 K. Wu et al. reported that significant temperature effects of absorption cross sections for gaseous ethene were observed in several regions; for example, the cross sections of the hot bands in the 190 nm region decreases by an order of magnitude from 370 to 140 K. Thus, it is interesting to study the absorption spectrum of ethene at lower temperatures.
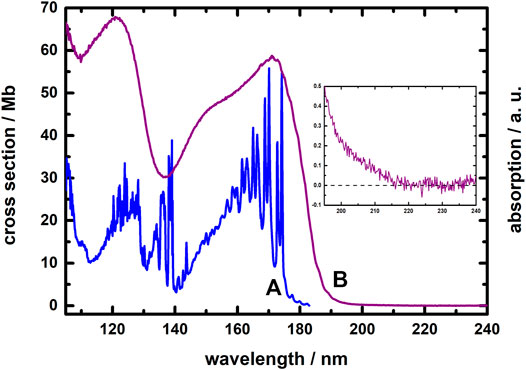
FIGURE 1. Absorption spectra of C2H4; (A) gaseous phase in the wavelength region 105–185 nm at 298 K; (B) solid state in the wavelength region 105–240 nm near 10 K. The insert shows the threshold region of solid C2H4.
Figure 1B depicts the absorption spectrum of solid C2H4 in wavelength range 105–240 nm near 10 K. From a comparison of the two spectra in Figure 1, the absorption profiles for gaseous and solid C2H4 reveal great differences. In contrast to the gaseous absorption features, the absorption of solid C2H4 near 10 K appears as a continuous curve without distinct lines. The absorption threshold wavelength of solid C2H4 occurs about 220 nm as shown in the insert of Figure 1; at a wavelength shorter than that threshold in region 105–200 nm, the absorption of solid C2H4 comprises two broad bands, with maxima about 172 nm (with a shoulder about 150 nm) and 125 nm. A weak vibronic progression of the solid C2H4 appears in the wavelength region 190–165 nm; the average separation of this progression is about 670 ± 70 cm−1.
The spectral profile of the absorption of icy C2H4 might exhibit a thermal effect, but no thermal variation of its spectra has been reported, despite the need of its establishment. Considering that the melting point of C2H4 is 104 K, we thus measured the thermal variation of VUV absorption spectra of icy C2H4 from 13 to 100 K; as a result of sublimation of icy C2H4, the intensity of the absorption began to decrease, by about half at 65 K, with none remaining at 80 K. As little sublimation of icy C2H4 occurred in range 13–60 K (see Supplementary Figure S1 in Supplementary Material), we thus could examine the thermal variation of its VUV absorption in this temperature range. Figure 2 displays the VUV absorption spectra of icy C2H4 recorded at temperatures 13, 15, 17, 19, 23, 25, 35, 45, 55, and 60 K, in wavelength range 105–245 nm. Notably, the VUV absorption spectra of icy C2H4 was not constant but exhibited a significant thermal effect in temperature range 13–60 K, as shown in Figure 2. Unexpectedly, the thermal variation of the absorptions of icy C2H4 revealed two distinct trends in wavelength range 105–200 nm: the intensity of absorption for a wavelength less than about 150 nm increased with temperature increasing from 13 to 60 K, whereas absorption beyond about 150 nm decreased as the temperature was analogously raised.
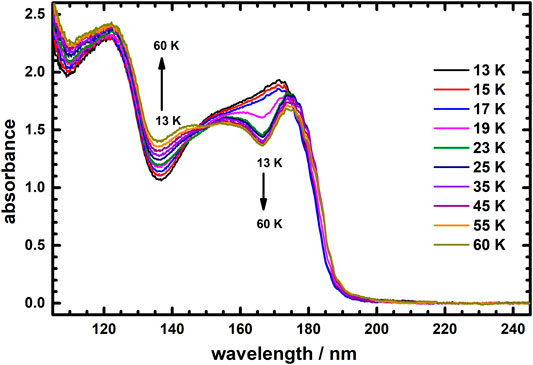
FIGURE 2. Absorption spectra of icy C2H4 recorded at temperatures 13, 15, 17, 19, 23, 25, 35, 45, 55, and 60 K in wavelength range 105–245 nm.
Upon close examination, the thermal variation of absorption profiles for icy C2H4 could be divided into two temperature ranges 13–17 K and 23–60 K. Figure 3 presents the absorption spectra of icy C2H4 at temperatures 13, 15 and 17 K. Remarkably, these three absorption curves intersect at wavelength 147.0 nm, which is thus an isosbestic point of thermal variation of absorption spectra for icy C2H4 in temperature range 13–17 K. This result hints that C2H4 ices might possess two distinct structures in temperature range 13–17 K, which could exchange under an equilibrium condition in this temperature range.
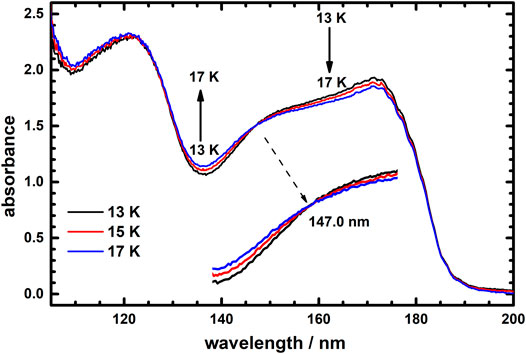
FIGURE 3. Vacuum ultraviolet absorption spectra of icy C2H4 recorded at temperatures 13, 15, and 17 K in the wavelength range 105–200 nm.
Figure 4 presents the absorption spectra of icy C2H4 at temperatures 23, 25, 35, 45, 55, and 60 K. Extraordinarily, these absorption spectra intersect at 150.6 nm, which becomes another isosbestic point of thermal variation of absorption spectra of icy C2H4 in temperature range 23–60 K. This result indicates that C2H4 ices might also have two distinct structures in temperature range 23–60 K; in this temperature range, the structures of these two ices could also interconvert in an equilibrium condition. The thermal variations of absorption profiles of Figures 3, 4 thus display separate isosbestic points 147.0 and 150.6 nm; these results imply that ices of the two kinds involved in each equilibrium condition in these two temperature ranges might not be the same.
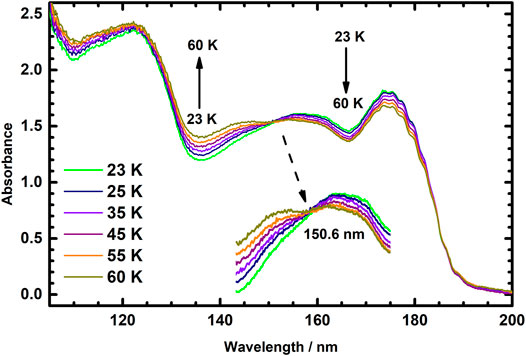
FIGURE 4. Vacuum ultraviolet absorption spectra of icy C2H4 recorded at temperatures 23, 25, 35, 45, 55, and 60 K in the wavelength range 105–200 nm.
To rationalize these observations of the thermal variation of absorption spectra of icy C2H4 in temperature range 13–60 K as shown in Figures 2–4, we propose that there are structures of icy C2H4 of three kinds, so C2H4 (iceI), C2H4 (iceII), and C2H4 (iceIII) could form in temperature range 13–60 K. The VUV absorptions of C2H4 (iceI), C2H4 (iceII), and C2H4 (iceIII) might have their own features and be dissimilar. After deposition, the total number of icy C2H4 molecules (Nice) should be the same in the entire range 13–60 K; the total number of these three structures of ices -- NiceI, NiceII and NiceIII -- is constant and is equal to Nice at all temperatures of 13–60 K in this system as Eq. 1.
As displayed in Figures 3, 4, all curves intersect at only one point in each case in these absorption spectra for varied temperature; these phenomena indicate that only two species exist in a condition of rapid equilibrium upon thermal changes in each of Figures 3, 4. In range 13–17 K of Figure 3, only C2H4 (iceI) and C2H4 (iceII) might occur in equilibrium as in Eq. 2.
In this range 13–17 K, as no C2H4 (iceIII) ice could form, NiceIII is zero; the mass Eq. 1 thus becomes Eq. 3.
In contrast, only C2H4(iceII) and C2H4(iceIII) might exist in Figure 4 as in Eq. 4 in temperature range 23–60 K; mass Eq. 1 then becomes Eq. 5.
Consequently, C2H4 (iceII) might persist in the entire temperature range 13–60 K, but C2H4 (iceI) could exist simply below 23 K whereas C2H4 (iceIII) might barely survive above 17 K. In the temperature range 13–17 K, C2H4 (iceI) and C2H4 (iceII) contributed the varied absorption spectra with conditions of Eqs. 2, 3; as a result, these spectral curves intersect at 147.0 nm as shown in Figure 3. C2H4 (iceII) and C2H4 (iceIII) exhibited their thermal spectra merely in conditions according to Eqs. 4, 5 in temperature range 23–60 K; these absorption curves intersect at 150.6 nm as shown in Figure 4.
Based on this scheme, ices C2H4 (iceI), C2H4 (iceII) and C2H4 (iceIII) coexist in temperature range 17–23 K; accordingly, the absorption curve of icy C2H4 measured at 19 K as shown in Figure 2 belonged to neither the group as displayed in Figure 3 nor that in Figure 4.
Icy C2H4 (iceI), C2H4 (iceII) and C2H4 (iceIII) respond to their own characteristic spectral features; which might also be occurred in the IR spectroscopy. Figure 5 displays the IR absorption spectra of icy C2H4 recorded at temperatures (a) 8 K, (b) 10 K, (c) 12 K, (d) 14 K, (e) 18 K, (f) 20 K, (g) 30 K, (h) 40 K, (i) 50 K, (j) 55 K, (k) 60 K, (l) 65 K and (m) 70 K, respectively. Compared the IR absorption intensity at 65 K (Figure 5L) to at 60 K (Figure 5K), its value decreased; the result hints that the icy C2H4 could sublime above 60 K and explains that no IR signal was detected due to total evaporation away at 70 K as shown in Figure 5M. From Figure 5A, the positions of vibrational lines with greatest absorbance for icy C2H4 are at 941.6/949.6 (ν7), 1,435.0/1,436.5/1,440.3 (ν12), 2,972.8 (ν11) and 3,088.1 (ν9) cm−1 at 8 K. Increasing the temperature, the IR lines of C2H4 shift to blue with a narrowing effect from 8 to 60 K; for examples, the positions of the maximum intensity for the ν9 and ν11 modes appear to be 3,088.1 cm−1 (width 2.76 cm−1) and 2,972.8 cm−1 (width 1.90 cm−1), respectively, at 8 K (see Supplementary Figures S2, S3 in the Supplementary Material); those values shift to 3,088.4 cm−1 (width 1.95 cm−1) and 2,973.2 cm−1 (width 0.99 cm−1) at 60 K. For the ν12 mode at 8 K as shown in the insert of Figure 5, a broad triple were observed at 1,435.0, 1,436.5 and 1,440.3 cm−1; those gradually congested to a doublet at 1,436.4 and 1,440.6 cm−1 above 55 K and reveals the sharpest at 60 K.
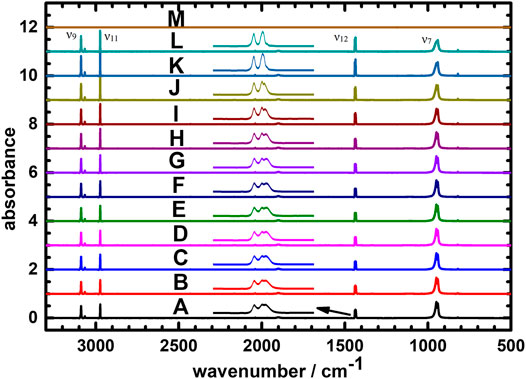
FIGURE 5. IR absorption spectra of icy C2H4 recorded at temperatures (A) 8 K, (B) 10 K, (C) 12 K, (D) 14 K, (E) 18 K, (F) 20 K, (G) 30 K, (H) 40 K, (I) 50 K (J) 55 K (K) 60 K (L) 65 K, and (M) 70 K.
Investigations of the structural changes for the icy C2H4 have been reported at different temperatures previously (Hudson et al., 2014; Satorre et al., 2017). For this purpose, Hudson et al. measured the IR spectra of the icy C2H4 at 12, 20, 30, 35, 40, 50, and 60 K (Hudson et al., 2014); our IR spectra recorded at various low temperatures are in satisfactory agreements with theirs. Hudson et al. concluded that the icy C2H4 could form in amorphous, metastable, and crystalline structures; which are dominate at 12–20 K, 20–40 K and 50–60 K, respectively. Figure 5 supports their conclusion that there are three structures for icy C2H4 at low temperature. Accordingly, we suggest that the icy C2H4 possesses the amorphous structure at 8–20 K; increasing the temperature, the icy structure might involve the metastable phase at 15–50 K and change in most crystalline form above 55 K.
Based on the thermal variation of VUV absorptions of icy C2H4, we propose that structural ices C2H4 (iceI), C2H4 (iceII) and C2H4 (iceIII) of these three kinds existed in temperature range 13–60 K as discussed above. Our results indicate that ices C2H4 (iceI), C2H4 (iceII) and C2H4 (iceIII) might exhibit their presence in temperature ranges 13–23 K, 13–60 K and 17–60 K, respectively. Referred to the Hudson et al’s work, the structures of C2H4 (iceI), C2H4 (iceII) and C2H4 (iceIII) might be in amorphous, metastable, and crystalline structures. The relative contents of these ices thus depend on the specific temperature. The chemical and physical properties of C2H4 (iceI), C2H4 (iceII) and C2H4 (iceIII) might respond to their own characteristic features; these properties might influence the astrophysical and astrochemical reactions of icy C2H4 in cold space. In future, it is then interesting to investigate the chemical and physical properties of C2H4 (iceI), C2H4 (iceII) and C2H4 (iceIII) individually.
Summary
We measured the absorption spectra of icy ethene in wavelength region 105–245 nm in temperature range 13–100 K using light from a synchrotron. We observed the curves for the thermal variation of spectra of icy ethene to intersect at 147.0 and 150.6 nm in temperature ranges 13–17 K and 23–60 K, respectively. Our results indicate that ices of three kinds C2H4 (iceI), C2H4 (iceII) and C2H4 (iceIII), exist in temperature range 13–60 K; these ices might have their own absorption curves and are distinct. This work enhances our perception of icy ethene at low temperatures; we suggest to investigate this issue for its impact on astrochemistry and astrophysics in cold astro-environments.
Data Availability Statement
The original contributions presented in the study are included in the article/Supplementary Material, further inquiries can be directed to the corresponding author.
Author Contributions
J-IL, RG, and H-CL performed most of the experiments and analytical measurements. H-CL, W-HH and B-MC participated in the analysis and wrote the paper.
Funding
Ministry of Science and Technology of Taiwan (grant 109-2113-M-303-001) provided support for this research.
Conflict of Interest
The authors declare that the research was conducted in the absence of any commercial or financial relationships that could be construed as a potential conflict of interest.
Acknowledgments
We thank NSRRC for providing beamlines and instruments for the measurements.
Supplementary Material
The Supplementary Material for this article can be found online at: https://www.frontiersin.org/articles/10.3389/fspas.2021.700641/full#supplementary-material
References
Cheng, B.-M., Chen, H-F., Lu, H.-C., Chen, H.-K., Alam, M. S., Chou, S.-L., et al. (2011). Absorption Cross Section of Gaseous Acetylene at 85 K in Wavelength Range 110-155 Nm. Astrophys. J. Suppl. Ser. 196 (6pp), 3. doi:10.1088/0067-0049/196/1/3
Chou, S.-L., Lo, J.-I., Lin, M.-Y., Peng, Y.-C., Lu, H.-C., and Cheng, B.-M. (2014). Production of N3upon Photolysis of Solid Nitrogen at 3 K with Synchrotron Radiation. Angew. Chem. Int. Ed. 53, 738–741. doi:10.1002/anie.201306876
Chou, S.-L., Lo, J.-I., Peng, Y.-C., Lu, H.-C., Cheng, B.-M., and Ogilvie, J. F. (2018). Photolysis of O2 Dispersed in Solid Neon with Far-Ultraviolet Radiation. Phys. Chem. Chem. Phys. 20, 7730–7738. doi:10.1039/c8cp00078f
Encrenaz, T., Combes, M., Zeau, Y., Vapillon, L., and Berezne, J. (1975). A Tentative Identification of C2H4 in the Spectrum of Saturn. Astron. Astrophys. 42, 355–356.
Fonfría, J. P., Hinkle, K. H., Cernicharo, J., Richter, M. J., Agúndez, M., and Wallace, L. (2017). The Abundance of C2H4in the Circumstellar Envelope of IRC+10216. ApJ 835, 196. doi:10.3847/1538-4357/835/2/196
Goldhaber, D. M., Betz, A. L., and Ottusch, J. J. (1987). New Lines of Ethylene and a Search for Methylene in IRC + 10216. ApJ 314, 356–362. doi:10.1086/165066
Hanel, R., Conrath, B., Flasar, F. M., Kunde, V., Maguire, W., Pearl, J., et al. (1981). Infrared Observations of the Saturnian System from Voyager 1. Science 212, 192–200. doi:10.1126/science.212.4491.192
Holland, D. M. P., Shaw, D. A., Hayes, M. A., Shpinkova, L. G., Rennie, E. E., Karlsson, L., et al. (1997). A Photoabsorption, Photodissociation and Photoelectron Spectroscopy Study of C2H4 and C2D4. Chem. Phys. 219, 91–116. doi:10.1016/s0301-0104(97)00090-6
Hudson, R. L., Gerakines, P. A., and Moore, M. H. (2014). Infrared Spectra and Optical Constants of Astronomical Ices: II. Ethane and Ethylene. Icarus 243, 148–157. doi:10.1016/j.icarus.2014.09.001
Kostiuk, T., Romani, P., Espenak, F., Livengood, T. A., and Goldstein, J. J. (1993). Temperature and Abundances in the Jovian Auroral Stratosphere: 2. Ethylene as a Probe of the Microbar Region. J. Geophys. Res. 98, 18823–18830. doi:10.1029/93je01332
Lo, J.-I., Chou, S.-L., Peng, Y.-C., Lin, M.-Y., Lu, H.-C., and Cheng, B.-M. (2014). Photochemistry of Solid Interstellar Molecular Samples Exposed to Vacuum-Ultraviolet Synchrotron Radiation. J. Electron Spectrosc. Relat. Phenomena 196, 173–176. doi:10.1016/j.elspec.2013.12.014
Lo, J.-I., Chou, S.-L., Peng, Y.-C., Lu, H.-C., and Cheng, B.-M. (2018). Photodissociation Threshold and Emission with 220 Nm of Icy Ethene. Icarus 302, 261–265. doi:10.1016/j.icarus.2017.11.015
Lo, J.-I., Chou, S.-L., Peng, Y.-C., Lu, H.-C., and Cheng, B.-M. (2019). Thermal Reaction and Luminescence of Long-Lived N 2D in N2 Ice. Proc. Natl. Acad. Sci. USA 116, 24420–24424. doi:10.1073/pnas.1910647116
Lu, H.-C., Chen, H.-K., Chen, H.-F., Cheng, B.-M., and Ogilvie, J. F. (2010). Absorption Cross Section of Molecular Oxygen in the Transition E3Σu-V= 0 - X3Σg-V= 0 at 38 K. A&A 520, A19. doi:10.1051/0004-6361/2010139984
Lu, H.-C., Chen, H.-K., and Cheng, B.-M. (2004). Analysis of C2H4 in C2H6 and C2H5D with VUV Absorption Spectroscopy and a Method to Remove C2H4 from C2H6 and C2H5D. Anal. Chem. 76, 5965–5967. doi:10.1021/ac0494679
Lu, H.-C., Chen, H.-K., Cheng, B.-M., Kuo, Y.-P., and Ogilvie, J. F. (2005). Spectra in the Vacuum Ultraviolet Region of CO in Gaseous and Solid Phases and Dispersed in Solid Argon at 10 K. J. Phys. B: Mol. Opt. Phys. 38, 3693–3704. doi:10.1088/0953-4075/38/20/006
Lu, H.-C., Lo, J.-I., Peng, Y.-C., Chou, S.-L., Cheng, B.-M., and Chang, H.-C. (2020). Nitrogen-Vacancy Centers in Diamond for High-Performance Detection of Vacuum Ultraviolet, Extreme Ultraviolet, and X-Rays. ACS Appl. Mater. Inter. 12, 3847–3853. doi:10.1021/acsami.9b18372
McDiarmid, R. (1980). A Reinvestigation of the Absorption Spectrum of Ethylene in the Vacuum Ultraviolet. J. Phys. Chem. 84, 64–70. doi:10.1021/j100438a016
Person, J. C., and Nicole, P. P. (1968). Isotope Effects in the Photoionization Yields and the Absorption Cross Sections for Ethylene andn‐Butane. J. Chem. Phys. 49, 5421–5426. doi:10.1063/1.1670067
Satorre, M. Á., Millán, C., Molpeceres, G., Luna, R., Maté, B., Domingo, M., et al. (2017). Densities and Refractive Indices of Ethane and Ethylene at Astrophysically Relevant Temperatures. Icarus 296, 179–182. doi:10.1016/j.icarus.2017.05.005
Schulz, B., Encrenaz, Th., Bézard, B., Romani, P. N., Lellouch, E., and Atreya, S. K. (1999). Detection of C2H4 in Neptune from ISO/PHT-S Observations. Astron. Astrophys. 350, L13–L17.
Wilkison, P. G., and Mulliken, R. S. (1955). Far Ultraviolet Spectra of Ethylene and Ethylene-D4. J. Chem. Phys. 23, 1895–1907. doi:10.1063/1.1740601
Wu, C. Y. R., Chen, F. Z., and Judge, D. L. (2004). Temperature-dependent Photoabsorption Cross Sections in the VUV-UV Region: Ethylene. J. Geophys. Res. 109, E07S15. doi:10.1029/2003je002180
Xia, T. J., Chien, T. S., Wu, C. Y. R., and Judge, D. L. (1991). Photoabsorption and Photoionization Cross Sections of NH3, PH3, H2S, C2H2, and C2H4 in the VUV Region. J. Quantitative Spectrosc. Radiative Transfer 45, 77–91. doi:10.1016/0022-4073(91)90102-v
Keywords: vacuum-ultraviolet absorption, synchrotron, ethene, ice, far-ultraviolet radiation
Citation: Lo J-I, Ghosh R, Lu H-C, Hung W-H and Cheng B-M (2021) Vacuum-Ultraviolet Absorption Spectra of Icy C2H4 at 13–60 K. Front. Astron. Space Sci. 8:700641. doi: 10.3389/fspas.2021.700641
Received: 26 April 2021; Accepted: 25 May 2021;
Published: 10 June 2021.
Edited by:
Ankan Das, Indian Center for Space Physics, IndiaReviewed by:
Barbara Michela Giuliano, Max Planck Institute for Extraterrestrial Physics, GermanyMasashi Tsuge, Hokkaido University, Japan
Copyright © 2021 Lo, Ghosh, Lu, Hung and Cheng. This is an open-access article distributed under the terms of the Creative Commons Attribution License (CC BY). The use, distribution or reproduction in other forums is permitted, provided the original author(s) and the copyright owner(s) are credited and that the original publication in this journal is cited, in accordance with accepted academic practice. No use, distribution or reproduction is permitted which does not comply with these terms.
*Correspondence: Bing-Ming Cheng, Ym1jaGVuZzczMjNAZ21haWwuY29t