 John C. Foster
 Philip J. Erickson
- Massachusetts Institute of Technology Haystack Observatory, Westford, MA, United States
The geospace plume couples the ionosphere, plasmasphere, and magnetosphere from sub-auroral regions to the magnetopause, on polar field lines, and into the magnetotail. We describe Van Allen Probes observations of ionospheric O+ ions at altitudes of 3–6 RE in the near vicinity of the geospace plume in the noon and post-noon sector. The temporal variation of warm ion fluxes observed as a function of time on a moving spacecraft is complicated by changing spacecraft position and complex ion drift paths and velocities that are highly sensitive to ion energy, pitch angle and L value. In the “notch” region of lower density plasma outside the morning-side plasmapause, bi-directionally field aligned fluxes of lower energy (<5 keV) ions, following corotation-dominated drift trajectories from the midnight sector, are excluded from geospace plume field lines as they are deflected sunward in the plume flow channel. In general, O+ at ring current energies (∼10 keV) is bi-directionally field aligned on plume field lines, while lower energy O+ (<3 keV) are absent. The observation of ion plumes with energies increasing from ∼1 keV–>20 keV in the dusk sector outer plasmasphere is interpreted as evidence for localized ionospheric O+ outflow at the outer edge of the geospace plume with subsequent O+ acceleration to >50 keV in <30 min during the ions’ sunward drift.
Introduction
Spatially extended, sunward-convecting ionospheric density enhancements are noted in incoherent scatter radar observations immediately equatorward of the dusk-sector ionospheric trough. Regularly seen during disturbed geomagnetic conditions, these were termed storm enhanced density (SED) by Foster (1993). Altitude profiles indicated that SED is characterized by a significant increase in F region scale height and peak altitude (Foster, 1993), and occasionally with strong upward O+ plasma velocity (>1 km s−1) in the topside F region (Yeh and Foster, 1990; Erickson et al., 2010; Zhang et al., 2017). Combining ground and space-based plasma imaging techniques, Foster et al. (2002) demonstrated that the ionospheric SED plumes were magnetically-connected low-altitude signatures of the drainage plumes (plasmaspheric tails) associated with the stormtime erosion of the outer plasmasphere.
Subsequent studies developed a more comprehensive picture of the redistribution of cold (<1 eV) plasma from the ionosphere and inner magnetosphere to the cusp, magnetopause, polar cap, and into the nightside auroral ionosphere. The nomenclature describing various aspects of these phenomena has varied according to feature identification and scope, and has been largely dependent on the characteristics and location of the separate measurements. Moldwin et al. (2016) synthesized recent plume measurements in different regions and concluded that those structures are involved in a causal chain of plasma redistribution throughout the magnetosphere-ionosphere system. In their recent review, Foster et al. (2020) proposed the recognition of disturbance-related cold plasma redistribution as a unified global phenomenon—the geospace plume.
For cold plasmas of ionospheric origin in the plasmasphere boundary layer (PBL) (Carpenter and Lemaire, 2004), ExB redistribution entrains both low altitude ions (O+ in the ionospheric F region) and high-altitude ions (plasmaspheric and topside H+, He+) on the same geomagnetic flux tube. In this way, an active plume advection channel simultaneously drives sunward ion motion at all altitudes from the ionosphere to the apex of the field lines, creating a convection-defined drift shell. A detailed description of the geospace plume at ionospheric heights (the SED plume) has been presented by Foster et al. (2020). A comprehensive statistical analysis of plasmaspheric plumes has been presented by Darrouzet et al. (2008). The appearance and impact of geospace plume plasma at high altitudes in the dayside magnetosphere (Su et al., 2001) and in the reconnection region at the dayside magnetopause (Borovsky, 2014; Walsh et al., 2014) has been described previously.
Van Allen Probes Observations of the Geospace Plume
The instrumentation and orbit of the Van Allen Probes [the Radiation Belt Storm Probes (RBSP); Mauk et al. (2013)] are well designed for in situ investigations of geospace plume and outer plasmasphere characteristics and processes in the equatorial region at L ∼ 3–6. Wave electric and magnetic field observations made with the Electric and Magnetic Field Instrument and Integrated Science (EMFISIS) instrument (Kletzing et al., 2012) provide plasma density and local magnetic field information. In this study, we concentrate on RBSP observations made with the Helium, Oxygen, Proton, and Electron (HOPE) mass spectrometer (Funsten et al., 2013), measuring low energy ions and electrons (0.9 eV–56 keV) in the dusk and post-noon sector PBL where energetic ring current ions overlap the outer plasmasphere.
Figure 1 (from Foster et al., 2020) presents a spatially aligned relationship of RBSP Electric Field and Waves [EFW, Wygant et al. (2013)] observations, showing the sub-auroral polarization stream [SAPS; Foster and Burke (2002)] electric field, HOPE ring current ion observations, and the geospace plume observed in cold plasma density at L ∼3 by RBSP-A. These observations occurred as the spacecraft’s near-equatorial outbound orbit crossed the plasmasphere boundary layer at 18 MLT during a strong disturbance event on March 17, 2015 (Dst was −106 nT at 16 UT and reached −222 nT at 23 UT on 17 March). Our identification of the PBL spans L shells from the inward extent of the SAPS electric fields at L ∼ 2.8 to the outer extent of the geospace plume near L ∼ 3.15. The close interrelationship of the plasmapause, SAPS, plume, and ion boundaries is clearly seen in this example. Such coordinated multi-instrument observations of the inner magnetosphere and radiation belt environment are a major accomplishment of the Van Allen Probes program, revealing previously undiscovered facets of the system and leading to a clearer understanding of the underlying physical processes and system level effects.
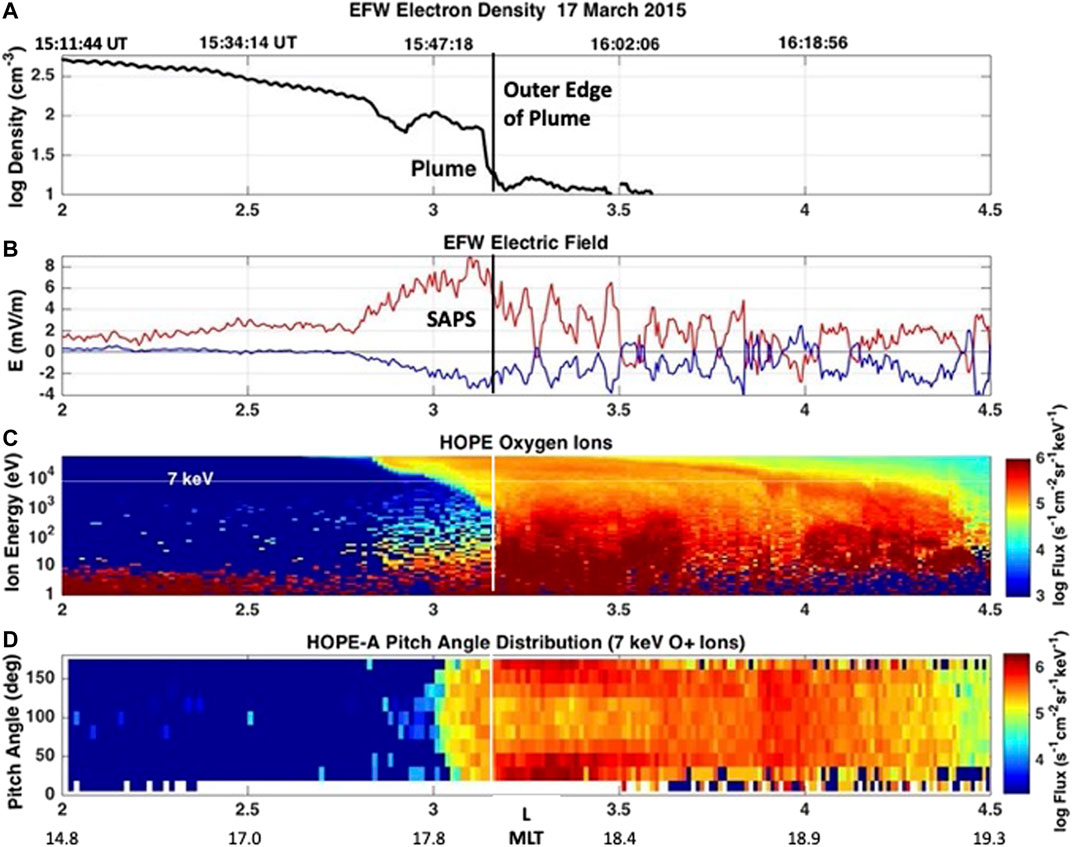
FIGURE 1. Van Allen Probes A observations crossing the disturbed plasmasphere boundary layer. (A)In situ cold plasma density observations (EFW boom potential technique). (B) Red curve: radially outward EFW electric field (blue curve: azimuthal component). (C) HOPE O+ fluxes (10 eV—∼60 keV) are shown. O+ with energies <3 keV largely is excluded from plume field lines. A “nose” of hot ring current O+ ions (>10 keV) extended across the SAPS. (D) Bi-directional field aligned O+ fluxes at energies up to ∼10 keV (7 keV fluxes shown) were seen immediately adjacent to the outer extent of the geospace plume. [After Foster et al. (2020)].
O+ in the Magnetosphere
Earth’s ionosphere is the source of singly ionized oxygen ions (O+) in the magnetosphere (e.g. Fuselier et al., 2019). O+ accelerated to beyond 10 keV populates the main ring current (e.g. Kistler et al., 2016). During disturbed conditions O+ with 10 s keV energy can constitute the dominant ion in the ring current. The source locations and mechanisms associated with the acceleration of the cold (<1 eV) ionospheric O+ ions to multi-keV energies are topics of active investigation. Cusp outflow of ionospheric O+ ions is believed to be the dominant source of enhanced O+ in the storm time ring current (Kistler et al., 2016). At ∼1 keV final energy, O+ beams streaming away from a source in the cusp have been seen in the tail lobes and ultimately in the plasma sheet (Kistler et al., 2010; Liao et al., 2010). Ionospheric O+ outflow reaching nightside field lines can be accelerated along drift trajectories in the magnetotail, reappearing in the inner magnetosphere within the warm plasma cloak (WPC) (Chappell et al., 2008). At energies <∼3 keV, ions accelerated earthward from the tail primarily follow eastward corotational drift trajectories, while ions ≥3 keV experience curvature drift westward into the pre-midnight sector. As discussed below, O+ ions following these source/trajectory paths are observed adjacent to the plume and plasmapause in both the noontime and the dusk sectors.
In this study we use in situ Van Allen Probes observations to investigate the role played by the geospace plume and processes at the PBL in the source, dynamics, and evolution of O+ in the inner magnetosphere (L < 6). In O + Pitch Angle Distributions Across the Geospace Plume we present a schematic equatorial-plane picture of the geospace plume orientation and the configuration of the RBSP orbits for two disturbance events in October 2013. For the lower energy O+ WPC ions we investigate pitch angle distributions and dawn side drift trajectories around the plasmasphere, and their encounter with the geospace plume near noon. In O+ Outflow at the Geospace Plume and the Plasmapause we concentrate on O+ ions at the outer boundary of the plasmasphere and plume on the dusk side. Our study finds strong fluxes of <1 keV O+ are present immediately outside the plume, but absent at those energies on plume field lines, while multiple populations of >10 keV ions are observed on plume field lines in the dusk sector. EMIC Waves describes our observation of strong helium-band EMIC waves located immediately inside the outer plume boundary for the cases examined in O+ Outflow at the Geospace Plume and the Plasmapause. The keV O+ Plume: Evidence for Ion Acceleration on Geospace Plume Field Lines presents evidence for <1 keV O+ outflow at the outer boundary of the geospace plume, with subsequent acceleration to 50 keV energies and the formation of a sunward drifting keV O+ plume. Acceleration of the keV O+ Plume addresses potential acceleration mechanisms for the keV O+ plume. Finally, Conclusion presents our conclusions.
Observations
O+ Pitch Angle Distributions Across the Geospace Plume
Figure 2 presents a schematic introduction to the October 15, 2013 event, using magnetically mapped GPS-derived total electron content measurements as a guide to boundaries of plume regions in the magnetospheric equatorial plane. The Van Allen Probe-A orbit crossed the geospace plume at ∼07 UT in the dusk sector after sampling (at ∼05 UT) a region of lower density cold plasma observed along the spacecraft outbound orbit between the morning-side plasmapause and the inner boundary of the geospace plume. This was a moderate storm event during which the main phase Dst index reached −49 nT at 04 UT on 15 October. Early IMAGE/EUV studies (Gallagher et al., 2005) identified distinct radial structure in imagery of the outer plasmasphere boundary, terming these depressions and crenulations “notches” [see Darrouzet et al. (2009) for a review of plasmasphere structure]. For the orbital configuration shown in Figure 2, the outbound Van Allen Probes orbit can exit the morning-side plasmasphere and then intersect the geospace plume as it is extended sunward towards the magnetopause. In this study we refer to this intervening region between the dawn side plasmapause and the plume as “the notch.” As shown below, we observe specific characteristics of O+ fluxes in this notch region.
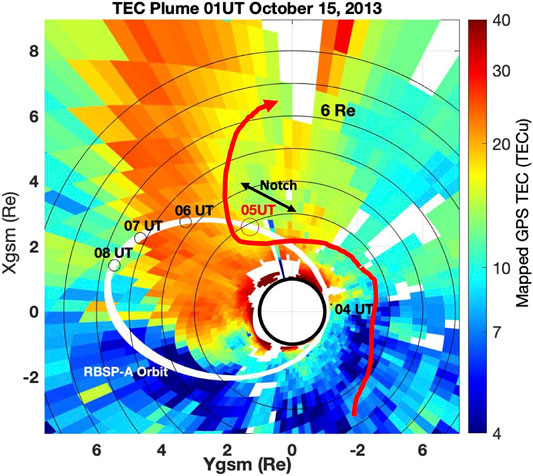
FIGURE 2. RBSP-A orbit and orbital position at 05 UT on October 15, 2013 are superimposed on an equatorial-plane projection of ground-based GPS TEC observations. These latter are not indicative of absolute plasmaspheric density, but serve to trace boundaries of the geospace plume in the dayside magnetosphere [Foster et al. (2002)]. A schematic drift trajectory for <10 keV ions injected sunward from the magnetotail is shown as a red curve. Crossing the “notch” between the outbound crossing of the dawnside plasmapause and the plume, the spacecraft intersects the injection trajectory of ions of a fixed energy at two separate radial distances leading to the observation of a wedge-shaped ion flux distribution (e.g. Ebihara et al., 2001).
During disturbed conditions, warm ions (H+, O+) injected earthward from the magnetotail with energies (<∼10 keV) below the zero-energy Alfvenic boundary, ZEAB (Ejiri, 1978), follow corotation-dominated drift trajectories from the midnight sector that approach the morning side of the geospace plume. As discussed by Ebihara et al. (2001), these ions follow convolved trajectories determined by gradient drift, corotation and convection electric fields. As a result, the temporal variation of warm ion fluxes observed as a function of time on moving spacecraft is complicated by changing spacecraft position and complex ion drift paths that are highly sensitive to ion energy, pitch angle and L value. As the sunward drifting ions encounter convection electric fields carrying the plume toward the dayside magnetopause, their trajectories are deflected sunward. As a result, the spacecraft can intersect the drift path of a given energy ion at multiple times and positions along its orbit. This effect causes the spacecraft to observe a wedge-shaped ion distribution as described by Ebihara et al. (2001) and as seen in the notch in Figure 3A during the outbound orbit of RBSP-A (cf. Figure 2). During this event, RBSP-A exited the highly eroded plasmasphere at ∼04:45 UT (L ∼ 2.4; 13 MLT) on its outbound orbital trajectory. A wedge-like notch O+ ion distribution, as described by Ebihara et al. (2001), then was observed between L ∼ 3 and L ∼ 5 until the inner edge of the plume was encountered at ∼06:45 UT (L ∼ 5.3; 16.2 MLT). The ZEAB is seen as the narrow, slanting, low ion flux separatrix between the notch ions and the overlying higher energy ring current. EFW cold electron density (cm−3) is overplotted on the ion spectrogram as a white curve. Plume fluxes were encountered between 06:45 and 07:20 UT. A black horizontal line marks the O+ fluxes at 13 keV. Pitch angle distributions (PADs) for the 13 keV ring current O+ ions are presented in Figure 3B. The 90° pitch angle ions penetrate most deeply [e.g. Ejiri (1978)] into the inner magnetosphere (05:30 UT, L = 3.8, 14.7 MLT), while O+ at this energy on plume field lines (07:02 UT, L = 5.5, 16.6 MLT) is distinctly bi-directionally field aligned. Black vertical lines on panel A mark these times for reference with Figure 4.
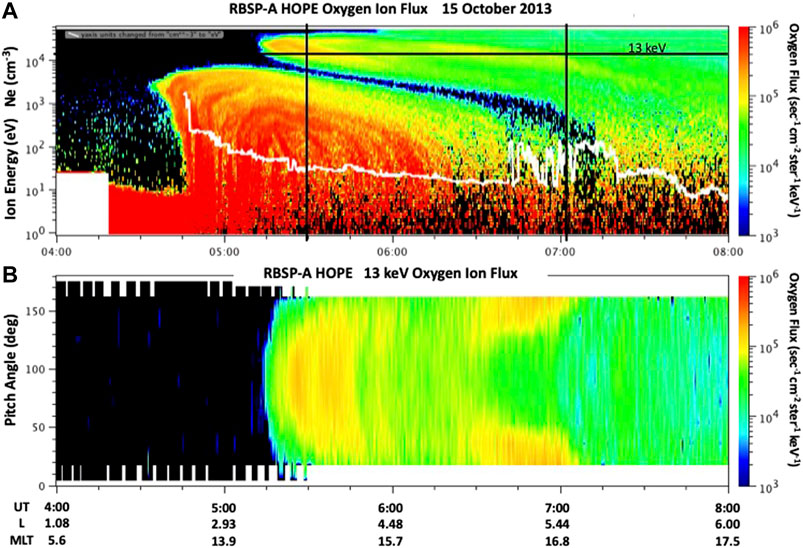
FIGURE 3. (A) HOPE O+ spectrogram [white curve: EFW electron density (cm−3)] for the outbound orbit of RBSP-A shown in Figure 2. Probe A exits the plasmasphere at ∼04:45 UT, observes a wedge-like spectrogram at energies below the ZEAB as it crosses the morningside notch between the plasmapause and the geospace plume, and encounters the plume at 06:45 UT. For reference with Figure 4, two fiducial black vertical lines are shown at 05:30 and 07:02 UT. RBSP-A exited the dusk side of the plume at 07:20 UT. (B) Pancake PADs (peaked at 90°) characterize the nose of the ring current O+ ions first observed at 05:15 UT near L ∼ 3.5 (13 keV ions are shown). As the morning side of the plume was encountered, the 13 keV O+ ions changed character significantly, becoming bi-directionally field aligned.
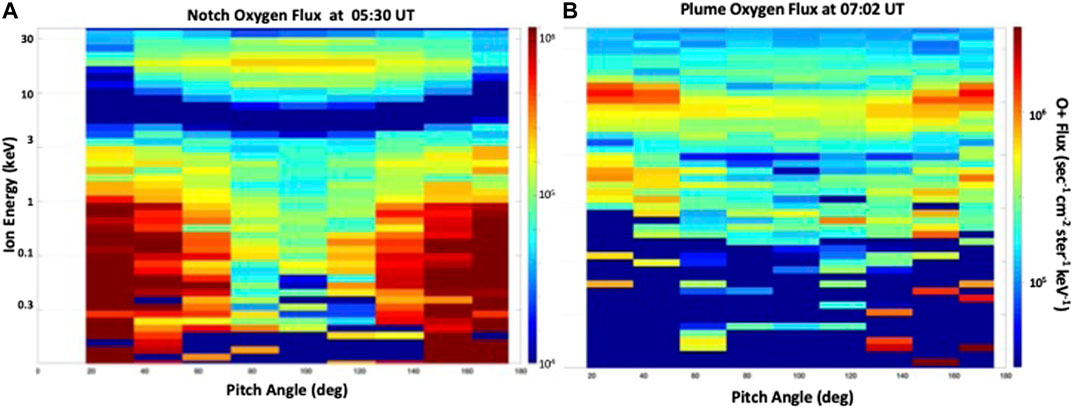
FIGURE 4. RBSP-A observed O+ pitch angle spectra are shown for the full range of HOPE ion energies on October 15, 2013 for the times indicated in Figure 3A. (A) In the region between the morning-side plasmapause and the plume (05:30 UT in Figure 3A), notch O+ at energies <3 keV tend toward bi-directional field alignement, while ring current O+ (∼10 keV) exhibit a pancake PAD. (B) On plume field lines (07:02 UT), O+ at ring current energies around 10 keV is bi-directionally field aligned while the lower energy O+ (<5 keV) largely is absent.
In Figure 4 we present the full HOPE energy range of O+ PADs observed on RBSP-A at the times indicated in Figure 3A in the notch (panel A) at 05:30 T, and in the plume (panel B) at 07:02 UT. For the notch pitch angle spectra, those ring current O+ ions above the ZEAB that propagate azimuthally in the anti-corotation direction exhibit pancake distributions peaked at 90°. In sharp contrast, the lower energy (<3 keV) O+ ions in the wedge population below the ZEAB have pronounced bi-directional field alignment consistent with the description of the warm plasma cloak given by Chappell et al. (2008). As also seen in Figure 3A, the PADs observed crossing the plume shown in Figure 4B indicate that the lower energy O+ ion population seen in the notch largely was absent from plume field lines. In contrast, on this crossing of the geospace plume at L ∼ 5 (Figure 4B), ring current O+ fluxes at energies 8–15 keV were locally enhanced and bi-directionally field aligned.
O+ Outflow at the Geospace Plume and the Plasmapause
Van Allen Probes observations during a separate, earlier 8–9 October 2013 interplanetary shock event reported by Foster et al. (2015) provided an excellent characterization of the ion populations around dusk sector plume field lines during a moderately disturbed storm. Dst reached -69 nT at 02 UT on 9 October. This event featured an interplanetary shock impacting the magnetosphere at ∼20:21 UT on 8 October while RBSP-A was outbound in the dayside plasmasphere at L ∼3 and 13 MLT. For the next 5 h, RBSP-A followed an orbital path nearly identical to that shown for the October 15, 2013 event in Figure 2, remaining inside the perturbed plasmasphere and developing plume. Figure 5 presents RBSP-A HOPE O+ and H+ fluxes across this region for the 8–9 October event, with in situ cold electron density superimposed on the ion spectra as a white trace. Regularly-decreasing outer plasmasphere density was observed until ∼22:00 UT. A density increase at ∼ 23:00 UT (L ∼ 6; 16 MLT) then marked the entry into the developing geospace plume in the outer regions of the plasmasphere. The spacecraft remained in the plume as it passed apogee and then exited the plume at ∼01:30 UT on 9 October (L ∼ 5.5; 18.7 MLT). Strong fluxes of 10 eV to >1 keV O+, H+, and He+ (not shown) were observed in the region immediately outside the plume. The final crossing of the structured plume/plasmapause on the inbound orbit was encountered at 02:45 UT (L = 4.1, 19.8 MLT). Subsequently, on the outbound orbit, the contracted plasmapause was crossed at ∼ 05:30 UT (L = 3.2, 14.6 MLT). Wedge-like ion distributions were observed in the notch beyond the plasmapause until the plume was encountered at 07:00 UT (L ∼ 5; 16 MLT). Similar to 15 October (cf. Figure 4), O+ and H+ fluxes with energies 10 eV–>1 keV were absent from dusk sector plume field lines.
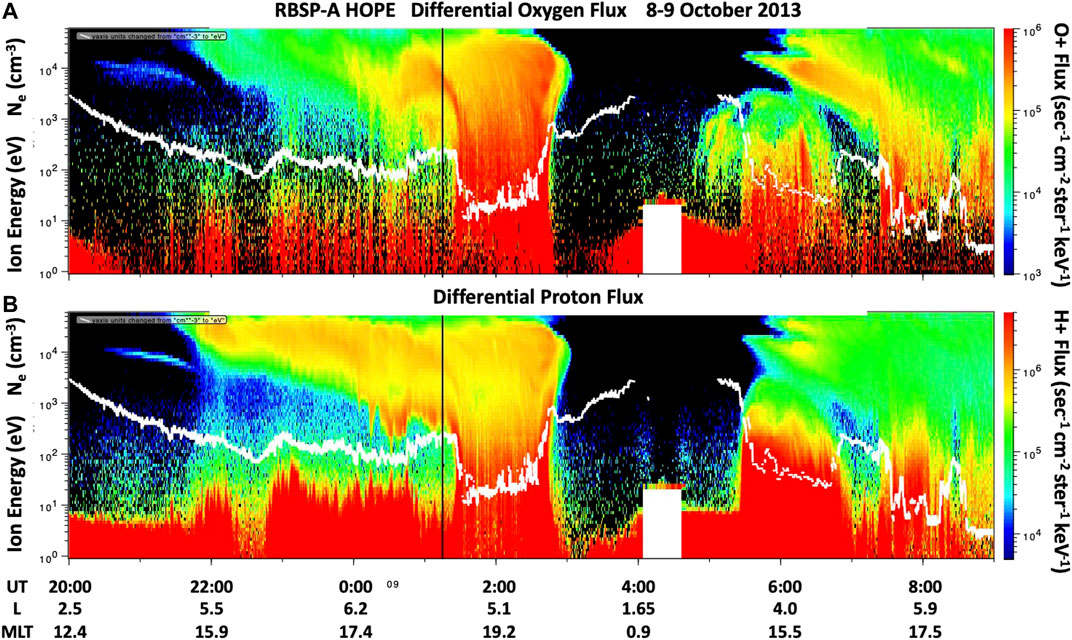
FIGURE 5. RBSP-A oxygen (A) and proton (B) ion differential flux spectra are shown for an 8–October 9, 2013 pass following an orbital trajectory (not shown) similar to that shown in Figure 2. In situ plasma density derived from EMFISIS observations is superimposed as the white curves. RBSP-A traversed the outer region of the evening sector plume from 23:00 to 01:30 UT (apogee at 23:40 UT at 17 MLT). After exiting the plume at ∼01:30 UT (L ∼ 5.3, 18.5 MLT), the plasmasphere was reentered at ∼ 05:30 UT (L = 3.2, 14.6 MLT). Black vertical lines indicate the times of plume O+ and H+ PADs shown in Figure 6.
Ion PADs observed in the outer portion of the plume on 9 October at ∼01:15 UT are shown in Figure 6. The strong fluxes of O+ (panel A) with energies <1 keV observed immediately outside the plume (cf. Figure 5) were excluded from plume field lines. At higher energies >3 keV, robust fluxes of O+ exhibited an increasing tendency toward bi-directional field alignment as the energy of their observation increased from 3 to 10 keV. Strong 200 eV–3 keV proton fluxes (panel B) also were observed in this region with similar configurations in pitch angle, moving toward bi-directional field alignment with increasing energy. Finally, at higher energies 3–10 keV, H+ exhibited a butterfly PAD symmetrically peaked off 90°.
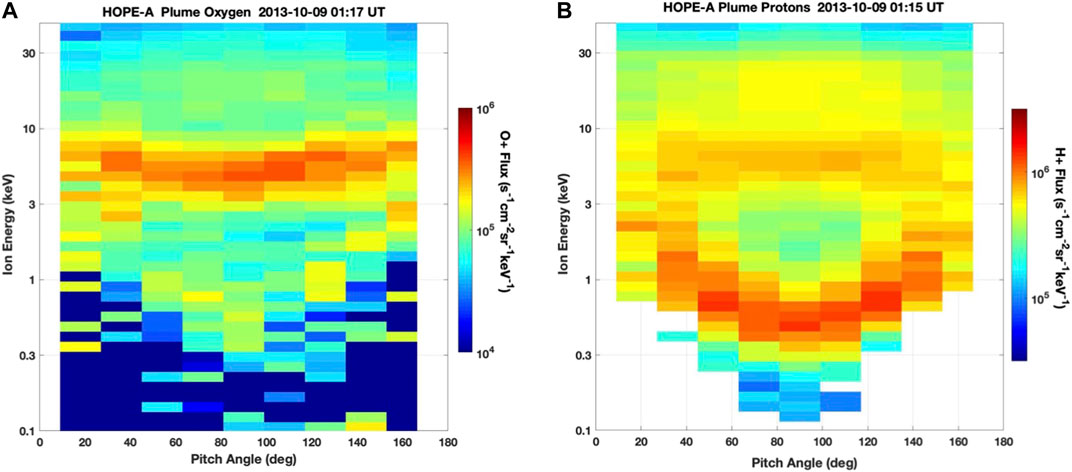
FIGURE 6. Ion PADs for O+ (A) and H+ (B) are shown for the RBSP-A plume crossing on October 9, 2013 at the time (at ∼01:15 UT) shown by vertical black lines in Figure 5A,B. (A) O+ with energies <1 keV was not observed on plume field lines, while at higher energies O+ fluxes moved toward a bi-directional field aligned configuration as energy increased from 1 to 10 keV. (B) Strong 200 eV–3 keV proton fluxes were also observed in this region with similar configurations in pitch angle, moving to ward bi-directional field alignment with increasing energy. At higher energies 1–10 keV, H+ exhibited a butterfly PAD.
HOPE oxygen ion fluxes were independently observed by Van Allen Probe B during the October 9, 2013 event as presented in Figure 7A. In particular, Probe B preceded Probe A by ∼1 h along the same orbital track and also remained in the outer plasmasphere and plume until 01:15 UT (L ∼ 4.5; 19.6 MLT). At this point, the spacecraft exited and reentered the geospace plume several times, crossing the outer boundary of the plume six times over a 20 min span. At each plume boundary crossing, consistent ion flux and pitch angle signatures were observed in a configuration similar to those seen by Probe A. Subsequently, as the B spacecraft moved rapidly toward perigee, it reentered the plume for the final time at ∼ 01:33 UT (L ∼ 4.0; 20.0 MLT) and then smoothly entered the somewhat lower density of the outer plasmasphere at ∼01:40 UT (L ∼ 3.8; 20.3 MLT).
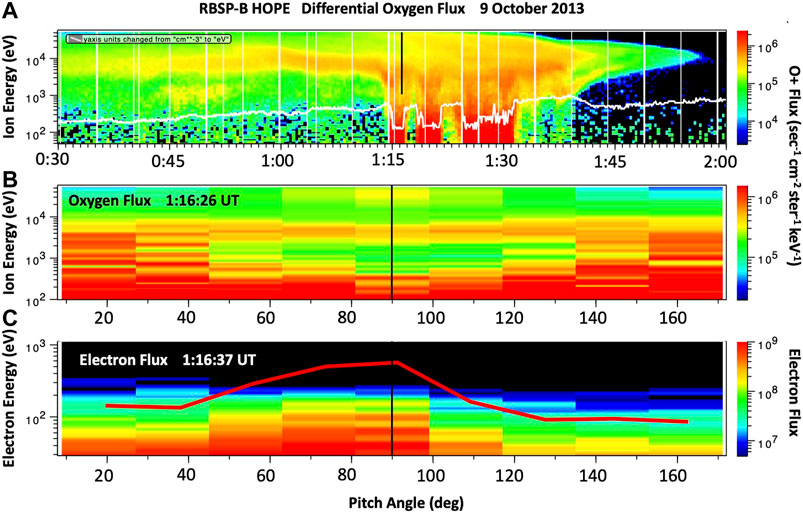
FIGURE 7. RBSP-B O+ flux observations are plotted from HOPE data for the inbound orbit, showing a crossing of the outer boundary of the plume multiple times beginning at ∼01:15 UT on October 9, 2013. (A) At each crossing, strong O+ fluxes with energies 10 eV to >5 keV characterized the region immediately beyond the edge of the plume. In situ EFW measurements of cold plasma density are shown by the white curve. (B) O+ PADs at the edge of the plume are shown for the time indicated by the fiducial black line in Figure 5A. (C) HOPE electron PADs indicate downflowing electron fluxes at energies up to 300 eV. The PAD for 105 eV electrons is shown as the red curve (black fiducial line indicates 90° pitch angle).
The O+ PADs at 01:16:26 UT shown in Figure 7B [at the fiducial line in (A)] are typical of the observations immediately outside plume field lines made by RBSP-B during its multiple crossings of that region. Whereas Figure 6A demonstrated the exclusion of lower energy O+ (100 eV—3 keV) from interior plume field lines, strong bi-directionally field aligned O+ fluxes in that energy range were observed immediately outside the plume (B). There, the higher energy population of ring current O+ at 5–10 keV exhibited a butterfly PAD. The HOPE electron PADs shown in Figure 7C indicate downflowing electron fluxes at energies up to 300 eV in this region at the outer edge of the geospace plume. Their potential association with ion acceleration by dispersive Alfven waves (Chaston et al., 2015) will be discussed in The keV O+ Plume: Evidence for Ion Acceleration on Geospace Plume Field Lines below.
Figure 8 plots selected individual RBSP-B ion flux profiles as a function of ion energy for the three species (O+, He+, H+) near 01:15 UT on October 9, 2013 (cf. Figure 7A) for locations immediately outside (red) and inside (black) the outer edge of the geospace plume. Regardless of species, plume regions are nearly devoid of strong ion fluxes in the 10 eV–1 keV range. By contrast, exterior to the plume, PADs for O+ across the 50 eV–1 keV energy range are bi-directionally field aligned (cf. Figure 7B).
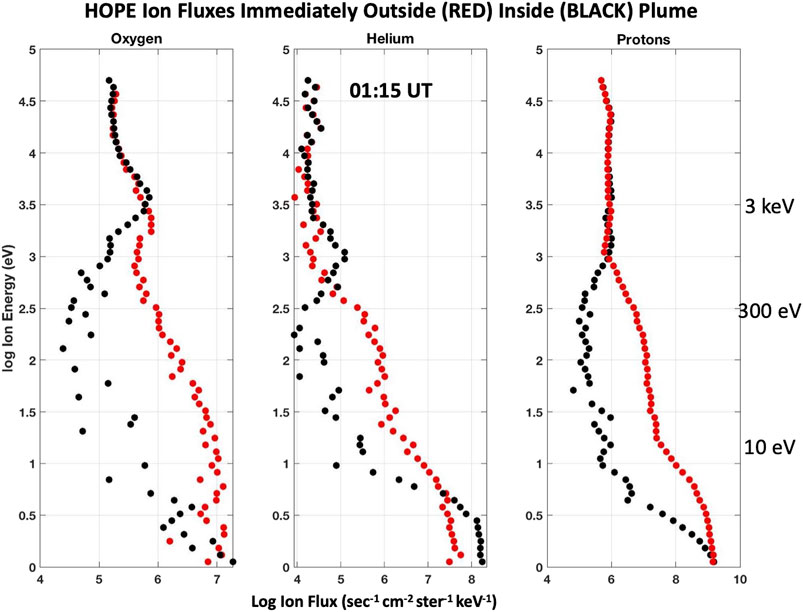
FIGURE 8. Individual RBSP-B ion fluxes immediately outside (red) and inside (black) the outer edge of the geospace plume are shown versus ion energy for the time indicated by the black vertical line in Figure 7A. The strong fluxes of 10 eV–1 keV O+ (A), He+ (B), and H+ (C) seen just outside the plume are excluded from adjacent plume field lines. As shown above in Figure 7B, the 50 eV–1 keV O+ fluxes immediately exterior to the plume are bi-directionally field aligned.
Discussion
Electromagnetic Ion Cyclotron (EMIC)
Usanova et al. (2016) outlined the potential importance of the plasmapause for EMIC wave growth and ducting, showing that EMIC wave activity is often observed to be generated in radially narrow regions, just inside the plasmapause. De Soria-Santacruz et al. (2013), using a model reproducing the radial cold plasma density irregularities typical of the storm-time plasmaspheric plume, found that EMIC wave growth was observed only in the helium band, between the oxygen crossover and the helium cyclotron frequency. We have performed a 1,024 point FFT (sliding window, 2/3 overlap) on EMFISIS high resolution magnetic field observations to produce a spectrogram of waves in the EMIC frequency band (∼1–10 Hz). As seen in Figure 9, He-band EMIC waves were observed immediately inside the plume outer boundary on each successive boundary crossing by RBSP-B. (The white curve shows plasma density (divided by 100) derived from EMFISIS upper hybrid frequency observations. Red curves denote the helium and oxygen cyclotron frequencies.) Figure 9 shows the absence of EMIC waves in the three regions of strong fluxes of 10 eV–1 keV O+ just outside the plume, as shown in Figure 7A. Strong EMIC waves occurred in a narrow region on adjacent plume field lines where such lower energy O+ was excluded. Denton et al. (2014) have found that a large O+ concentration limits the frequency range of, or even totally quenches, EMIC waves. Our observations are consistent with these theoretical studies of EMIC wave occurrence. A potential role for EMIC waves in the acceleration of ionospheric O+ to ring current energies (>10 keV) is discussed below.
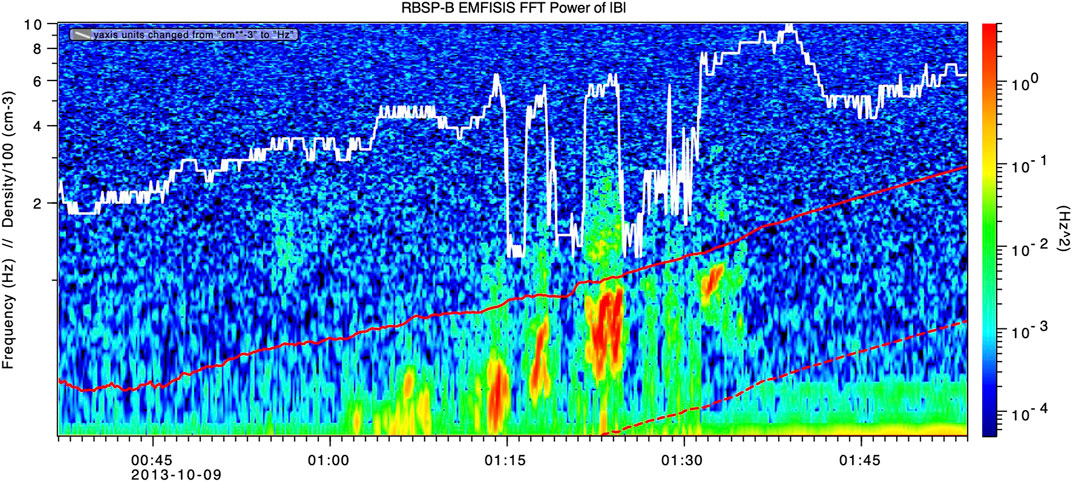
FIGURE 9. He-band EMIC waves were observed immediately inside the plume outer boundary on each successive boundary crossing by RBSP-B (cf. Figure 7). Superimposed are the He+ and O+ ion cyclotron frequencies (red solid and dashed curves) and the EMFISIS plasma density (divided by 100; white) to delineate the plume crossings.
The keV O+ Plume: Evidence for Ion Acceleration on Geospace Plume Field Lines
The presence of strong He-band EMIC waves suggests that ion acceleration processes may be at work in creating the position-dependent energy spectra presented previously, and that we analyze further here. An arched band of O+ at energies >1 keV was observed between 01:00 and 01:30 UT on plume field lines as RBSP-A approached the outer boundary of the geospace plume (cf. Figure 5A). As the spacecraft approached the outer edge of the plume, this keV O+ plume appeared to merge smoothly with the narrow region of bi-directionally field aligned 50 eV–1 keV O+ fluxes at the plume outer boundary observed at 01:30 UT. Similar ion plumes were observed for H+ (cf. Figure 5B) and He+ (not shown), and associated with the multiple plume boundary crossings by RBSP-B (cf. Figure 7, Figure 8). In Figure 10A we plot the O+ plume fluxes of Figure 5A on a linear energy scale between 0.9 and 50 keV as a function of time, along with a solid black curved line marking the upper energy bound of O+ plume fluxes observed as the spacecraft approached the geospace plume outer boundary. At this position in its orbit (L ∼ 5.5; 18 MLT), RBSP-A had a ∼100 km/min velocity in the negative XGSM (anti-sunward) direction, while the O+ ions with energies between 1 and 50 keV drifted in the +XGSM direction with velocities varying from 20 to 1,000 km/min depending on energy and pitch angle. We use relativistic computational formulas for ion or electron drift times/velocities as a function of L, particle energy, and pitch angle derived from their description in Schultz and Lanzerotti (1974). For a given energy, ions with more field-aligned equatorial pitch angles have slower sunward (westward) drift velocities and will arrive at a given distance from their source later than 90° pitch angle ions of the same energy. The highest energy ions observed at a given observation time on the moving spacecraft (i.e. distance from their source) as denoted by the black line in Figure 10A will have the most field-aligned pitch angles. In the following we will refer to the ions at the upper energy extent of the keV O+ plume as 10° pitch angle ions. For example, the highest O+ plume energy observed at ∼01:17 UT was ∼8 keV, and we have shown in Figure 6A that those 8 keV ions were the most bi-directionally field aligned. RBSP-A crossed the geospace plume outer boundary at ∼01:30 UT some 13 min later. Traveling at an assumed constant 100 km/min, the distance from the observation point at 01:17 UT to the apparent source of the plume O+ ions was ∼1,300 km.
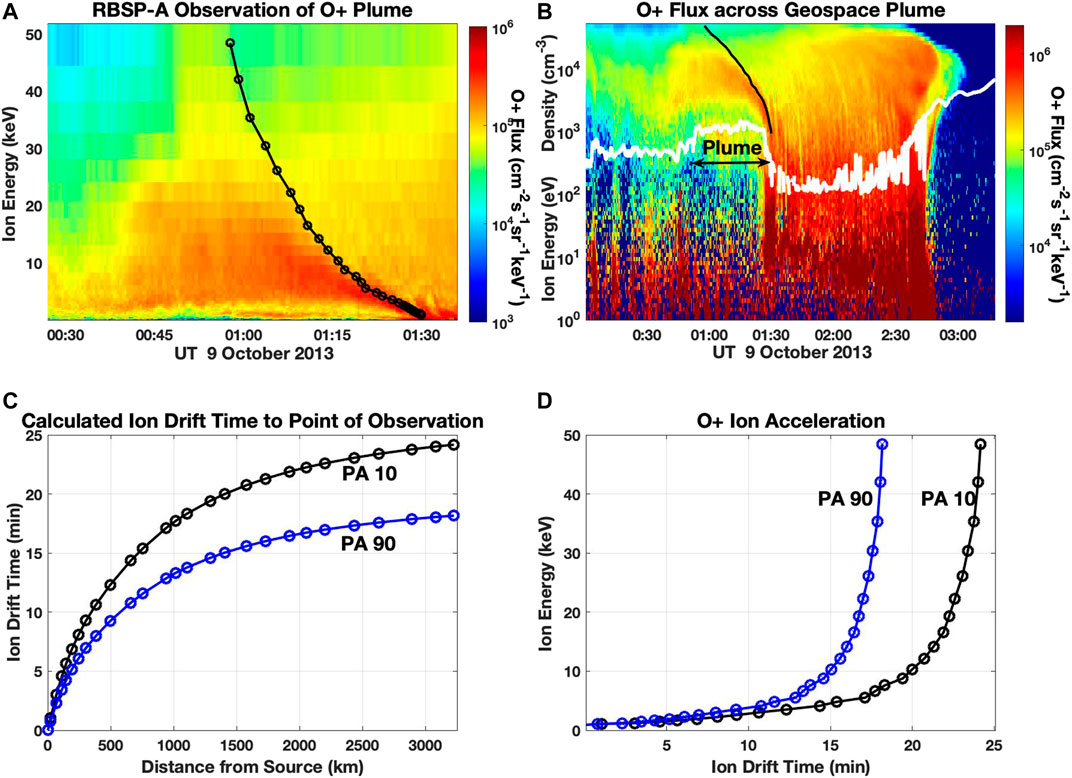
FIGURE 10. (A) The O+ fluxes on geospace plume field lines shown in Figure 5A are replotted on a linear energy scale highlighting a pronounced >1 keV O+ plume with a time-dependent upper energy boundary. The black curve marks the upper energy boundry of the O+ plume fluxes. Circles denote the discrete ion energy channels of the HOPE instrument. (B) O+ fluxes and the black boundary line of Panel (A) are replotted versus logarithmic ion energy to emphasize the O+ plume’s origin at the outer edge of the geospace plume. EFW cold plasma density is plotted as a white line. (C) Calculated O+ drift times to their points of observation (TN, see text) are plotted versus distance from their source at the plume for ions of a given energy for two values of pitch angle (see text). (D) The increase of O+ energy with drift time derived from the observed high energy boundary line shown in (A) is shown, indicating the rate of ion acceleration within the O+ plume for two values of ion pitch angle. Comparing the two pitch angle curves for constant drift time away from the ion source it is seen that pitch angles increase with energy during the keV O+ plume acceleration.
It is important to note that no reoccurrence of higher energy ions above the black line boundary was observed as time progressed and the distance to the geospace plume outer boundary decreased. This indicates that the ions in the keV O+ plume were being accelerated continually as they propagated away from their source. We replot the O+ fluxes and black plume boundary line in Figure 10B on a logarithmic energy scale for a better comparison with earlier figures.
To proceed with analysis, we know both the spacecraft velocity (100 km/min) and the oppositely-directed ion drift velocity as a linear function of ion energy for constant L = 5.5 and 10° pitch angle. (For computational simplicity we assume that L is constant. Near apogee, L at RBSP-A varied from 5.8 to 5.5 between 01:00 and 01:30 UT.) Using Eq. 1, we first convert the black curve of observation time (UTn) vs. ion energy (En) to a set of discrete values of drift distance (Dn) versus ion energy at their point of observation (En), assuming that the ions originated with 1 keV energy from a source at the outer boundary of the geospace plume crossed by the spacecraft at 01:30 UT (UTsource).
The drift velocity of the ions (Vdn) varies with their energy and pitch angle as they propagate away from their source, so that the propagation time (TN) to the point of last observation of ions of energy En is approximated by the simple piecewise integration of Eq. 2.
The calculated set of ion drift times TN is presented in Figure 10C as a function of distance from the source (Dn) for ions with 10° pitch angle (black curve) and 90° pitch angle (blue curve). Because of their faster drift speed, 90° pitch angle ions arrive at a given distance from the boundary earlier than 10° pitch angle ions of the same energy. We now have discrete arrays of En, Dn, and TN, all derived from the observed black boundary curve (En, UTn) of Figure 10A. In Figure 10D we plot the calculated values of O+ ion energy (En) versus ion drift time (TN) for 10° (black) and 90° (blue) pitch angle O+ ions, illustrating the time rate of energization for ions in the O+ keV plume. Under this model, for the case observed on October 9, 2013, 10° pitch angle O+ ions with a source population <1 keV were accelerated to 50 keV in ∼24 min along their sunward drift trajectory across geospace plume field lines.
The observations presented in Figure 5 through Figure 10 indicate O+ ion outflow and rapid (mins) acceleration to multi-keV energies at the outer boundary of the geospace plume in the dusk sector. Strong fluxes of <100 eV ions are observed immediately outside the plume boundary, but are not observed on plume field lines at those energies. Rather, discrete populations of O+, H+, and He+, ion plumes, are observed drifting sunward on geospace plume field lines with energies increasing to 10s keV over <30 min. With increasing drift distance sunward of the geospace plume outer boundary, the ion plume populations are characterized by increasingly bi-directionally field aligned PADs at the highest ion plume energies observed at any given time (cf Figure 5, Figure 6).
Acceleration of the keV O+ Plume
In this paper we do not attempt to identify or describe an acceleration mechanism for the keV O+ plume. Yue et al. (2019) reported dayside observations during geomagnetically active times of fluxes of H+ at ring current energies of ∼30–50 keV that had an additional field-aligned population overlapping the usual pancake population. That study suggested that ions in this energy range with field-aligned PADs probably were accelerated in the post-noon sector, in association with ionospheric disturbances that were triggered by tail injections. Chaston et al. (2015) describe a mechanism that self-consistently drives ionospheric outflow and energization based on storm time measurement of intense broadband low-frequency electromagnetic dispersive Alfvén waves (DAW) on ring current field lines. Hull et al. (2019) found that DAW activity and O+ outflow/energization is a characteristic feature of the inner magnetosphere during active conditions and that these correlated features are most intense during geomagnetic storms. Waves of this kind accelerate electrons parallel to the geomagnetic field and ions in the perpendicular direction. The ions arrive in the equatorial plane with pitch angles that increase with energy over a range from 10 eV to >50 keV, while the electrons are field aligned at up to ∼1 keV. Consistent with the DAW model, Figure 7C identified downflowing electron fluxes at energies up to 300 eV along with bi-directional field-aligned ∼1 keV ions at the immediate outer edge of the geospace plume. The O+ PADs on geospace plume field lines shown in Figure 4B, Figure 6A exhibit decreasing pitch angle with energy that appears to be inconsistent with the DAW mechanism. However, those PADs were observed on the spacecraft at a fixed point in space and time. When the energy—pitch angle spectrum of the accelerated ions is examined for a fixed time after leaving their source (drift time), as can be done by comparing the 10 and 90° pitch angle curves of Figure 10D, it is seen that pitch angles increase with energy during the O+ plume acceleration. Thus, these features of our observations are consistent with Alfvénic ion acceleration associated with the presence of dispersive Alfvén waves as discussed by Chaston et al. (2015), Chaston et al. (2016). That study further calculated that this mechanism could accelerate ions to >50 keV as they gradient drift into the noon sector, as we have shown in this study. Such an outflow and ion acceleration mechanism could indeed account for the field-aligned 10–50 keV ion populations observed on the dayside by Yue et al. (2019) and the characteristics of the keV ion plumes we report here.
Conclusion
The temporal variation of warm ion fluxes observed as a function of time on a moving spacecraft is complicated by changing spacecraft position and complex ion drift paths and velocities that are highly sensitive to ion energy, pitch angle and L value. The coordinated multi-instrument observations of the inner magnetosphere and radiation belt environment, as shown in this and similar studies, are a major accomplishment of the Van Allen Probes program.
In the dawn to noon sector, the drift paths of lower energy (<5 keV) corotation-dominated O+ ions are deflected sunward as they encounter the geospace plume flow channel and thus, effectively, are excluded from plume field lines. Within the plume on the dayside, O+ ions with ring current energies >10 keV are observed to be locally enhanced and nearly bi-directionally field aligned.
In the dusk sector, at 3–4 RE altitude, strong fluxes of O+ ions with energies up to ∼1 keV energy are observed immediately outside the geospace plume outer boundary. The outflowing ions begin to be accelerated immediately as their sunward drift carries them onto plume field lines, with the result that <1 keV O+ ions appear to be excluded from plume field lines. As these ions continue their sunward drift, they are observed to be accelerated to energies approaching 50 keV. In this way a keV O+ ion plume is formed with a discrete limiting upper energy that increases with increasing distance from the outflowing O+ ions’ source at the outer boundary of the geospace plume. Because of the pitch angle dependence of the ions’ sunward drift velocities, the highest energy O+ plume ions observed at any distance away from their source are seen to be nearly bi-directionally field aligned. However, when the energy—pitch angle spectrum of the accelerated ions is examined for a fixed time after leaving their source (the ion drift time), we find that pitch angles increase with energy during the keV O+ plume acceleration, consistent with description of (Chaston et al., 2015).
Data Availability Statement
Publicly available datasets were analyzed in this study. This data can be found here: Van Allen Probes observations used in this study can be obtained through instrument websites (EMFISIS wave data: http://emfisis.physics.uiowa.edu; EFW electric field and density data: http://www.space.umn.edu/rbspefw-data/; MagEIS and HOPE particle data: https://rbsp-ect.lanl.gov/rbsp_ect.php.
Author Contributions
JF and PE shared in the conception and design of the study and in the analysis of the observations. JF drafted the discussion and conclusions and prepared the manuscript. All authors have reviewed the final manuscript and approve it for publication.
Funding
Research at the MIT Haystack Observatory was supported by the NASA Van Allen Probes (RBSP) funding provided under NASA prime contract NAS5‐01072, including the EFW investigation (PI: J.R. Wygant, University of Minnesota), and the ECT investigation (PI: H. Spence, University of New Hampshire).
Conflict of Interest
The authors declare that the research was conducted in the absence of any commercial or financial relationships that could be construed as a potential conflict of interest.
References
Borovsky, J. E. (2014). Feedback of the Magnetosphere. Science 343, 1086–1087. doi:10.1126/science.1250590
Carpenter, D. L., and Lemaire, J. (2004). The Plasmasphere Boundary Layer. Ann. Geophys. 22, 4291–4298. doi:10.5194/angeo-22-4291-2004
Chappell, C. R., Huddleston, M. M., Moore, T. E., Giles, B. L., and Delcourt, D. C. (2008). Observations of the Warm Plasma Cloak and an Explanation of its Formation in the Magnetosphere. J. Geophys. Res. 113 (A09206), 1–21. doi:10.1029/2007JA012945
Chaston, C. C., Bonnell, J. W., Reeves, G. D., and Skoug, R. M. (2016). Driving Ionospheric Outflows and Magnetospheric O+ Energy Density with Alfvén Waves. Geophys. Res. Lett. 43, 4825–4833. doi:10.1002/2016GL069008
Chaston, C. C., Bonnell, J. W., Wygant, J. R., Kletzing, C. A., Reeves, G. D., Gerrard, A., et al. (2015). Extreme Ionospheric Ion Energization and Electron Heating in Alfvén Waves in the Storm Time Inner Magnetosphere. Geophys. Res. Lett. 42 (24), 10531–10540. doi:10.1002/2015GL066674
Darrouzet, F., De Keyser, J., Décréau, P. M. E., El Lemdani-Mazouz, F., and Vallières, X. (2008). Statistical Analysis of Plasmaspheric Plumes with Cluster/WHISPER Observations. Ann. Geophys. 26, 2403–2417. doi:10.5194/angeo-26-2403-2008
Darrouzet, F., Gallagher, D. L., André, N., Carpenter, D. L., Dandouras, I., Décréau, P. M. E., et al. (2009). Plasmaspheric Density Structures and Dynamics: Properties Observed by the CLUSTER and IMAGE Missions. Space Sci. Rev. 145 (1-2), 55–106. doi:10.1007/s11214-008-9438-910.1007/978-1-4419-1323-4_4
de Soria‐Santacruz, M., Spasojevic, M., and Chen, L. (2013). EMIC Waves Growth and Guiding in the Presence of Cold Plasma Density Irregularities. Geophys. Res. Lett. 40, 1940–1944. doi:10.1002/grl.50484
Denton, R. E., Jordanova, V. K., and Fraser, B. J. (2014). Effect of Spatial Density Variation and O+ Concentration on the Growth and Evolution of Electromagnetic Ion Cyclotron Waves. J. Geophys. Res. Space Phys. 119, 8372–8395. doi:10.1002/2014JA020384
Ebihara, Y., Yamauchi, M., Nilsson, H., Lundin, R., and Ejiri, M. (2001). Wedge-like Dispersion of Sub-keV Ions in the Dayside Magnetosphere: Particle Simulation and Viking Observation. J. Geophys. Res. 106 (A12), 29571–29584. doi:10.1029/2000JA000227
Erickson, P. J., Goncharenko, L. P., Nicolls, M. J., Ruohoniemi, M., and Kelley, M. C. (2010). Dynamics of North American Sector Ionospheric and Thermospheric Response During the November 2004 Superstorm. J. Atmos. Solar-Terrestrial Phys. 72 (4), 292–301. doi:10.1016/j.jastp.2009.04.001
Ejiri, M. (1978). Trajectory Traces of Charged Particles in the Magnetosphere. J. Geophys. Res. 83 (A10), 4798–4810. doi:10.1029/JA083iA10p04798
Foster, J. C., and Burke, W. J. (2002). SAPS: A New Categorization for Sub-auroral Electric Fields. Eos Trans. AGU 83, 393–394. doi:10.1029/2002EO000289
Foster, J. C., Erickson, P. J., Coster, A. J., Goldstein, J., and Rich, F. J. (2002). Ionospheric Signatures of Plasmaspheric Tails. Geophys. Res. Lett. 29 (13), 1–1–1–4. doi:10.1029/2002GL015067
Foster, J. C., Erickson, P. J., Walsh, B. M., Wygant, J. R., Coster, A. J., and Zhang, Q. H. (2020). “Multi‐Point Observations of the Geospace Plume,” in Dayside Magnetosphere Interactions, Geophysical Monograph Series 248. Editors Q. Zong, P. Escoubet, D. Sibeck, G. Le, and H. Zhang (New York, NY: John Wiley & Sons), 243–264. doi:10.1002/9781119509592.ch14
Foster, J. C. (1993). Storm Time Plasma Transport at Middle and High Latitudes. J. Geophys. Res. 98, 1675–1689. doi:10.1029/92JA02032
Foster, J. C., Wygant, J. R., Hudson, M. K., Boyd, A. J., Baker, D. N., Erickson, P. J., et al. (2015). Shock-Induced Prompt Relativistic Electron Acceleration in the Inner Magnetosphere. J. Geophys. Res. Space Phys. 120, 1661–1674. doi:10.1002/2014JA020642
Funsten, H. O., Skoug, R. M., Guthrie, A. A., MacDonald, E. A., Baldonado, J. R., Harper, R. W., et al. (2013). Helium, Oxygen, Proton, and Electron (HOPE) Mass Spectrometer for the Radiation Belt Storm Probes Mission. Space Sci. Rev. 179, 423–484. doi:10.1007/s11214-013-9968-7
Fuselier, S. A., Trattner, K. J., Petrinec, S. M., Denton, M. H., Toledo‐Redondo, S., André, M., et al. (2019). Mass Loading the Earth's Dayside Magnetopause Boundary Layer and its Effect on Magnetic Reconnection. Geophys. Res. Lett. 46, 6204–6213. doi:10.1029/2019GL082384
Gallagher, D. L., Adrian, M. L., and Liemohn, M. W. (2005). Origin and Evolution of Deep Plasmaspheric Notches. J. Geophys. Res. 110, A09201. doi:10.1029/2004JA010906
Hull, A. J., Chaston, C. C., Bonnell, J. W., Wygant, J. R., Kletzing, C. A., Reeves, G. D., et al. (2019). Dispersive Alfvén Wave Control of O+ Ion Outflow and Energy Densities in the Inner Magnetosphere. Geophys. Res. Lett. 46, 8597–8606. doi:10.1029/2019GL083808
Kistler, L. M., Mouikis, C. G., Klecker, B., and Dandouras, I. (2010). Cusp as a Source for Oxygen in the Plasma Sheet During Geomagnetic Storms. J. Geophys. Res. 115 (A03209), 1–14. doi:10.1029/2009JA014838
Kistler, L. M., Mouikis, C. G., Spence, H. E., Menz, A. M., Skoug, R. M., Funsten, H. O., et al. (2016). The Source of O+ in the Storm Time Ring Current. J. Geophys. Res. Space Phys. 121, 5333–5349. doi:10.1002/2015JA022204
Kletzing, C. A., Kurth, W. S., Acuna, M., MacDowall, R. J., Torbert, R. B., Averkamp, T., et al. (2013). The Electric and Magnetic Field Instrument Suite and Integrated Science (EMFISIS) on RBSP. Space Sci. Rev. 179, 127–181. doi:10.1007/s11214-013-9993-6
Liao, J., Kistler, L. M., Mouikis, C. G., Klecker, B., Dandouras, I., and Zhang, J.-C. (2010). Statistical Study of O+ transport from the Cusp to the Lobes with Cluster CODIF Data. J. Geophys. Res. 115 (A00J15), 1–13. doi:10.1029/2010JA015613
Mauk, B. H., Fox, N. J., Kanekal, S. G., Kessel, R. L., Sibeck, D. G., and Ukhorskiy, A. (2013). Science Objectives and Rationale for the Radiation Belt Storm Probes Mission. Space Sci. Rev. 179, 3–27. doi:10.1007/s11214-012-9908-y
Moldwin, M. B., Zou, S., and Heine, T. (2016). The story of Plumes: the Development of a New Conceptual Framework for Understanding Magnetosphere and Ionosphere Coupling. Ann. Geophys. 34, 1243–1253. doi:10.5194/angeo-34-1243-2016
Schultz, M., and Lanzerotti, L. J. (1974). Particle Diffusion in the Radiation Belts, Physics and Chemistry in Space, Vol. 7. New York: Springer-Verlag. 978-3-642-65675-0.
Su, Y.-J., Thomsen, M. F., Borovsky, J. E., and Foster, J. C. (2001). A Linkage Between Polar Patches and Plasmaspheric Drainage Plumes. Geophys. Res. Lett. 28, 111–113. doi:10.1029/2000GL012042
Usanova, M. E., Mann, I. R., and Darrouzet, F. (2016). “EMIC Waves in the Inner Magnetosphere,” in Low-Frequency Waves in Space Plasmas, Geophysical Monograph 216. Editors A. Keiling, D.-H. Lee, and V. Nakariakov. First Edition (New York, NY: John Wiley & Sons), 65–78. doi:10.1002/9781119055006.ch5
Walsh, B. M., Foster, J. C., Erickson, P. J., and Sibeck, D. G. (2014). Simultaneous Ground- and Space-Based Observations of the Plasmaspheric Plume and Reconnection. Science 343, 1122–1125. doi:10.1126/science.1247212
Wygant, J. R., Bonnell, J. W., Goetz, K., Ergun, R. E., Mozer, F. S., Bale, S. D., et al. (2013). The Electric Field and Waves Instruments on the Radiation Belt Storm Probes Mission. Space Sci. Rev. 179, 183–220. doi:10.1007/s1124-013-0013-710.1007/s11214-013-0013-7
Yeh, H.-C., and Foster, J. C. (1990). Storm Time Heavy Ion Outflow at Mid-latitude. J. Geophys. Res. 95, 7881–7891. doi:10.1029/JA095iA06p07881
Yue, C., Bortnik, J., Zou, S., Nishimura, Y., Foster, J. C., Coppeans, T., et al. (2020). Episodic Occurrence of Field‐Aligned Energetic Ions on the Dayside. Geophys. Res. Lett. 47, e2019GL086384. doi:10.1029/2019GL086384
Keywords: oxygen ions, geospace plume, plasmasphere, ring current, ion acceleration, plasmapause, ion drift, ion outflow
Citation: Foster JC and Erickson PJ (2021) Van Allen Probes Observations of Oxygen Ions at the Geospace Plume. Front. Astron. Space Sci. 8:705637. doi: 10.3389/fspas.2021.705637
Received: 05 May 2021; Accepted: 09 July 2021;
Published: 22 July 2021.
Edited by:
Elena Kronberg, Ludwig Maximilian University of Munich, GermanyReviewed by:
Matina Gkioulidou, Johns Hopkins University, United StatesFabien Darrouzet, Belgian Institute for Space Aeronomy, Belgium
Copyright © 2021 Foster and Erickson. This is an open-access article distributed under the terms of the Creative Commons Attribution License (CC BY). The use, distribution or reproduction in other forums is permitted, provided the original author(s) and the copyright owner(s) are credited and that the original publication in this journal is cited, in accordance with accepted academic practice. No use, distribution or reproduction is permitted which does not comply with these terms.
*Correspondence: John C. Foster, amNmb3N0ZXJAbWl0LmVkdQ==