 J. Krall1*
 J. D. Huba2
- 1Plasma Physics Division, Naval Research Laboratory, Washington, DC, United States
- 2Syntek Technologies, Fairfax, VA, United States
The Naval Research Laboratory (NRL) Sami3 is Also a Model of the Ionosphere (SAMI3) ionosphere/plasmasphere code is used to examine H+, He+, N+, and O+ thermal outflows during a storm. Here, H+ and He+ outflows are associated with refilling while O+ and N+ outflows are associated with ring current heating. An improved model of counterstreaming H+ outflows from the two hemispheres is presented, using an implementation of SAMI3 with two fluid species for H+. The two-fluid H+ model avoids nonphysical high-altitude “top-down refilling” density peaks seen in one-fluid H+ simulations. Counterstreaming cold ion populations are found in all cases. In these fully three-dimensional simulations with realistic magnetosphere boundary conditions, nonphysical top-down refilling density peaks were milder than those found in previous single-field-line or single-magnetic-longitude simulations. In the present two-fluid H+ case, “bottom-up refilling” density peaks were so mild as to be difficult to detect. For O+ and N+, the nonphysical high-altitude density peak is a brief (1–2 h) transient that occurs when heating-driven northward and southward flows first meet. In general, He+ outflows mimic H+ outflows while N+ outflows mimic O+ outflows.
1 Introduction
Because the plasmasphere (Carpenter, 1966; Nishida, 1966) is an important component of space weather (Lichtenberger et al., 2013), there is significant interest (Gallagher and Comfort, 2016) in the development of predictive models. First-principles plasmasphere simulations, beginning with single field-line models (Banks et al., 1971; St.-Maurice and Schunk, 1977; Richards et al., 1983) and progressing to global simulations (Bailey et al., 1997; Huba et al., 2005; Codrescu et al., 2012; Maruyama et al., 2016), commonly employ fluid equations, with one fluid representing each ion species. In single-field-line simulations, multi-fluid (Rasmussen and Schunk, 1988), semi-kinetic (Lin et al., 1992; Wilson et al., 1992; Wang et al., 2015), and kinetic (Liemohn et al., 1999; Marchaudon and Blelly, 2015) approaches have also been used.
One problem with fluid-code plasmasphere simulations is that the H+ fluid tends to outflow from the north and south, colliding nonphysically near the apex (Banks et al., 1971; Richards et al., 1983; Singh et al., 1986). These outflows occur during the refilling of plasmasphere flux tubes (Sojka and Wrenn, 1985; Su et al., 2001; Dent et al., 2006; Sandel and Denton, 2007) following the erosion (Park, 1973; Foster et al., 2014) of the plasmasphere by a geomagnetic storm. In fact, the two outflowing proton streams normally pass through each other (Rasmussen and Schunk, 1988). In a single-fluid description of H+, the northward and southward velocities cancel when the two streams collide near the apex of the field line, producing a nonphysical density peak (Singh et al., 1986). While a comparison of fluid and semi-kinetic modeling (Singh et al., 1994) shows that this is a problem only during early-stage refilling, it is still a problem. Test runs (Krall and Huba, 2019) using the Naval Research Laboratory (NRL) Sami2 is Another a Model of the Ionosphere (SAMI2) ionosphere/plasmasphere code (Huba et al., 2000b) code show that a two-fluid description of H+ dramatically improves modeling of early-stage refilling in comparison to the usual one-fluid description.
In this brief study, we revisit this issue using the NRL Sami3 is Also a Model of the Ionosphere (SAMI3) global ionosphere/plasmasphere code (Huba and Krall, 2013). We consider SAMI3 simulations of a specific storm event, including plasmasphere erosion, refilling, and H+, He+, N+ and O+ outflows. In these simulations, O+ (and N+) outflows are driven by ring-current heating, as in Krall et al. (Krall et al., 2020). These results confirm past findings (Roberts et al., 1987; Craven et al., 1995) that the He+ density generally mimics H+ (Craven et al., 1997; Goldstein et al., 2003) and that N+ generally mimics O+ (Ilie and Liemohn, 2016).
We seek answers to the following two questions: does a two-fluid description of H+ improve SAMI3 modeling of early-stage refilling? and do single-fluid model O+ outflows, like single-fluid model H+ outflows, collide nonphysically?
We answer “yes” to both questions. In the simulations presented below, we show that two-fluid H+ does indeed improve the modeling, but the effect is not as dramatic as that found in the test-case modeling of Krall and Huba 2019 and the prior single-field-line simulations of Banks et al. 1971 and Singh et al. (1986). We also show that, model O+ outflows do collide nonphysically as outflows from the north and south meet each other at high altitudes. The result is a transient high-altitude density enhancement that fades within 1–2 h. Coincident N+ outflows similarly collide, producing a brief transient.
2 The 7 October 2015 Storm
Figure 1 shows ground-based observations, Kp and Dst indices, for the October 7, 2015 (day 280) geomagnetic storm. Also shown is the extreme ultraviolet (EUV) F10.7 index and its 81-days average, F10.7A. These indices affect the strength of the ionosphere and the state of the background thermosphere.
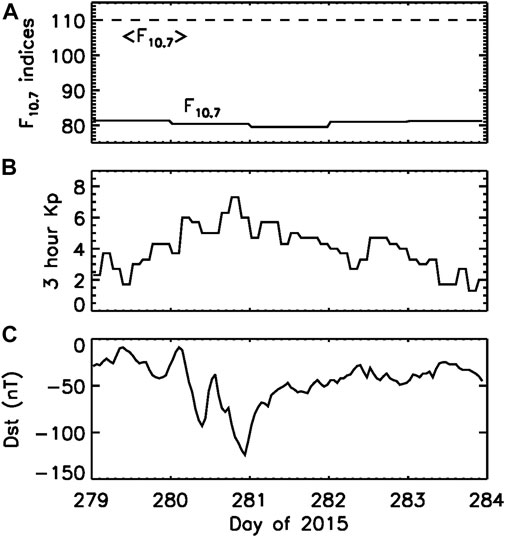
FIGURE 1. Simulation inputs (A)F10.7 EUV index and F10.7A, its 81-days average value, (B) decimal Kp index, and (C) Dst index. During the model storm, magnetospheric convection is driven by Kp and ring-current heating of electrons is driven by Dst.
Figure 1 represents some of the inputs used in the SAMI3 modeling presented below. In addition to the EUV indices already described, the Kp index is used to determine the stormtime convection potential as in Volland (Volland, 1973), Stern (Stern, 1975) and Maynard and Chen (Maynard and Chen, 1975). The Dst index is used to determine ring-current heating of ionosphere and plasmasphere electrons as in Krall et al. (Krall et al., 2020).
3 SAMI3 Results: Hydrogen and Helium Ions
We now present SAMI3 simulations of the 5-days pre-storm, storm, and recovery period shown in Figure 1. SAMI3 (Huba et al., 2005; Huba and Krall, 2013) simulates H+, He+, O+, N+,
The storm simulated here is the same as that in Krall et al. (2020). To ensure that the only differences between SAMI3 and two-stream SAMI3 reflect an updated treatment of the H+ ions, we began by repeating that previous work with the latest version of the SAMI3 code. We then modified the code to implement two-fluid H+ and repeated the simulation. As expected, the new SAMI3 run of the same storm is virtually identical to that presented in Krall et al. (2020). Because, as we shall see below, the effect of counterstreaming is not dramatic, results from the new two-stream SAMI3 run are also quite similar to those presented in Krall et al. (2020). However, our attention in that prior work was on O+, not H+.
Let us now turn our attention to H+ and He+. Figure 2 compares SAMI3 (left column) to two-stream SAMI3 (right column) at identical times. Shown are color contours of electron density ne at longitude 0. Each plot is near midnight local time, where “empty” flux tubes convect in from the tailward boundary. Based on model-data comparisons at geosynchronous orbit (Krall et al., 2018), the H+ density boundary value is set to 0.1 cm−3. These times are chosen to include the peak of the storm, panels (b) and (f), where and when counterstreaming H+ outflows from the ionosphere are strongest.
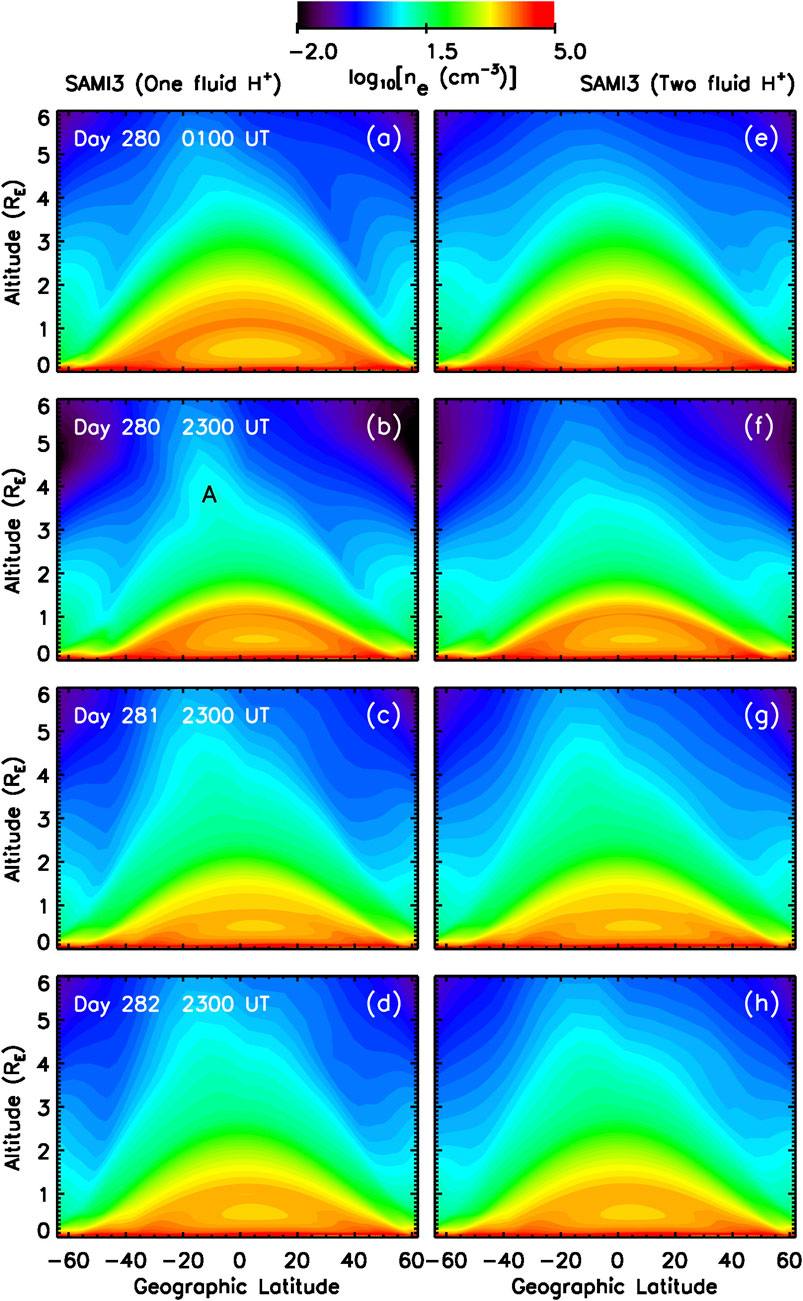
FIGURE 2. Color contours of the log of the electron density are shown at times (A,E) 0100 UT Day 280 (before the storm), (B,F) 2300 UT Day 280 (during the storm), (C,G) 2300 UT Day 281 and (D,H) 2300 UT Day 282. Plots (A–D) are from SAMI3; plots (E–H) are from two-stream SAMI3. The density peak (‘A’) in panel (B) is caused by colliding H+ streams from the two hemispheres. While a weaker version of feature A seems to be present in the two-stream SAMI3 result, panel (F), analysis shows that panel (F) also includes a second, much weaker peak. Two days later, panels (D) and (H), SAMI3 and two-stream SAMI3 come into closer agreement.
Figure 2, panel (b), shows the one-fluid colliding upflow effect, with a prominent peak in the electron density near the apex of the geomagnetic field for altitudes > 3RE. This peak, labeled “A” in panel (b), appears to be significantly reduced (and shifted slightly southward) in the two-stream SAMI3 result, panel (f). This will be examined further below. Two days after the storm, panels (d, h), SAMI3 and two-stream SAMI3 give nearly identical results. Because these plots are near local midnight, the topside ionosphere electron hole described by Huba et al. (2000a) is evident at altitude 0.5 RE in each panel.
We now consider plots versus position along an L = 5 field line at the same fixed longitude, where L is the McIlwain parameter (McIlwain, 1961). Figure 3 shows the colliding-upflow effect, with a peak in the H+ density, panel (a), at latitude −10°. This is the same as feature A in Figure 2B. The corresponding velocity, panel (b), shows a region of near-zero H+ velocity between high-speed (8 km/s) upflows from the north and south. Here, a positive velocity is northward.
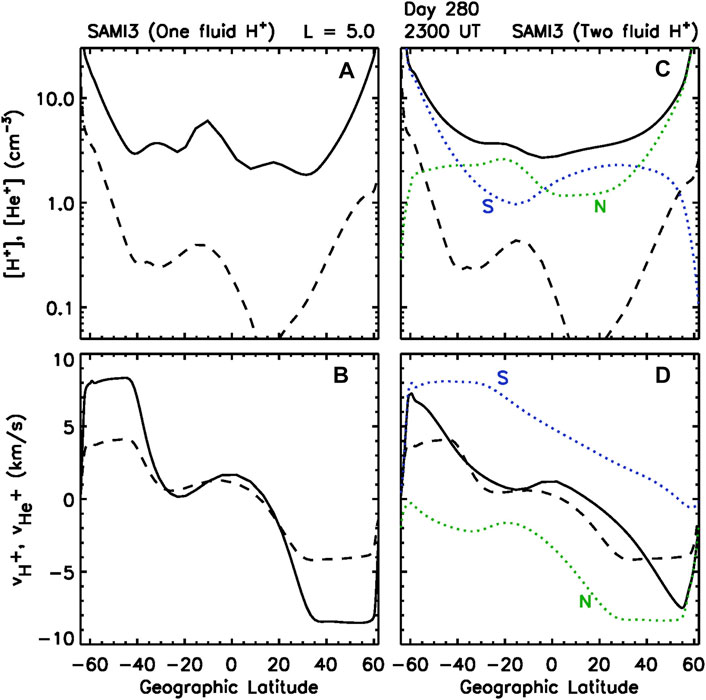
FIGURE 3. (A, C) H+ (solid) and He+ (dashed) ion densities and (B, D) H+ (solid) and He+ (dashed) ion velocities plotted versus latitude along a fixed-longitude (0.3°) L = 5 field line from (A, B) SAMI3 and (C, D) two-stream SAMI3. The density peak near the equator (-10°) in panel (A) largely disappears in the two-stream SAMI3 simulation (C). Panels (C, D) also show the separate
Dashed lines in Figure 3 indicate He+. These show that, as expected from past modeling and observations, the He+ density is generally coincident with the H+ density. Interestingly, this coincidence includes the nonphysical, but likely insignificant, He+ density peak at latitude −12° in panel (a). Similar to the way that the He+ density mimics the H+ density in panel (a), the He+ velocity mimics the H+ velocity in panel (b).
Two-stream SAMI3 results are shown in Figures 3C,D. Here, separate south and north components of H+ are shown as dotted curves. In panels (c, d), we see that H+ from the north (green dotted curve) moves southward at a high velocity. The velocity falls to zero as it moves southward. As a result, H+ ions from the north accumulate in the south, creating a peak at latitude −20°. This is the density peak, seen in Figure 2F that appears to correspond to the much stronger peak of Figure 2B. In fact this peak in
4 SAMI3 Results: Oxygen and Nitrogen Ions
Figure 4 again compares SAMI3 (left column) to two-stream SAMI3 (right column) at the same times as in Figure 2. Shown are color contours of O+ density at longitude 0. In both cases O+ is represented by a single fluid; in two-stream SAMI3, only H+ is represented by two fluids.
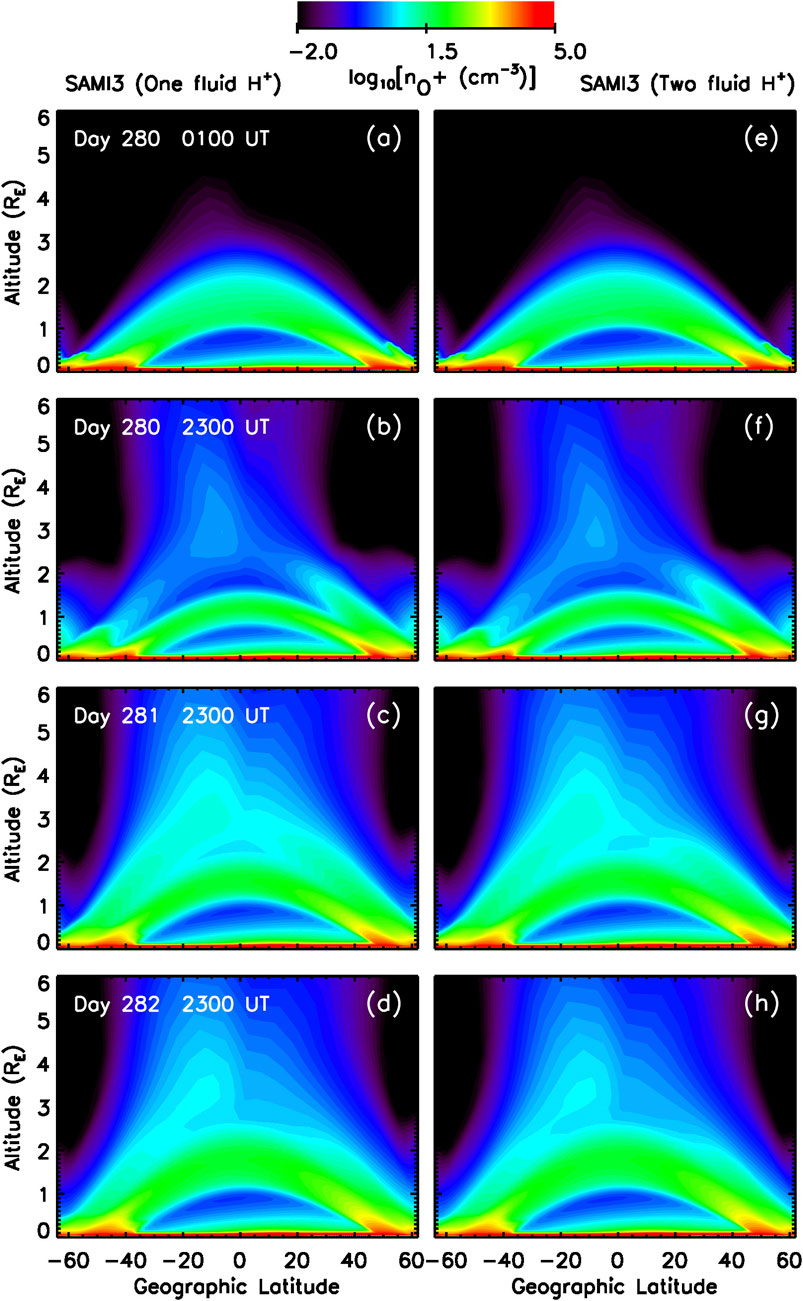
FIGURE 4. Color contours of the log of the O+ density are shown at the same times as in Panel 2 for SAMI3 (left column) and two-stream SAMI3 (right column). While the density peak at high altitude implies that O+ is also affected by the colliding-fluid issue, analysis shows that this is not the case.
Figure 4 shows a weak, local O+ density peak at nearly the same latitude as the H+ peak of Figure 2B. This seems to suggest that converging O+ outflows from the north and south are colliding at this point, but this is misleading. In fact, these plots are near local midnight, where O+ velocities are often downward. Unsurprisingly, a comparison between the left hand panels (SAMI3) and the right hand panels (two-stream SAMI3) of Figure 4 shows that the two-fluid treatment of H+ has little effect on O+. For this reason, we presently focus our analysis of O+ dynamics on the SAMI3 results.
Figure 4C shows significant O+ density at L > 3.5, with densities exceeding 100 cm−3. This is the O+ “shell/torus” (Horwitz et al., 1986; Roberts et al., 1987) that was first identified (Chappell, 1982) using the Retarding Ion Mass Spectrometer (RIMS) instrument on the Dynamics Explorer (DE) spacecraft. This aspect of these model results was discussed at length in Krall et al. (2020) [note: Krall et al. (2020) incorrectly states that the heating was applied only at high altitudes; in fact the heating was applied along the entirety of each field line; this issue will be explored further in the near future].
To discern the source of the high-altitude peak in the O+ density, Figure 4B, we examine the dynamics along an L = 4 field line at the time of Figure 4B and at a time 14.5 h later, when ring-current heating of ionosphere and plasmasphere electrons is driving significant O+ outflows. Figure 5 shows O+ and N+ densities and velocities along an L = 4 field line at these two times. In the afternoon sector and soon after the peak of the storm, Figures 5C,D, the ring current heating of plasmasphere electrons via Coulomb collisions with ring current ions is strongest. At this time the tendency of O+ to be contained by gravity is overcome and upflows from the north and south are evident in panel (d). The converging velocity pattern and the local jump in the O+ and N+ densities at latitude 22° in Figures 5C,D suggest that these outflows might be better described using two fluids, as with H+ in two-stream SAMI3. This will be discussed further below.
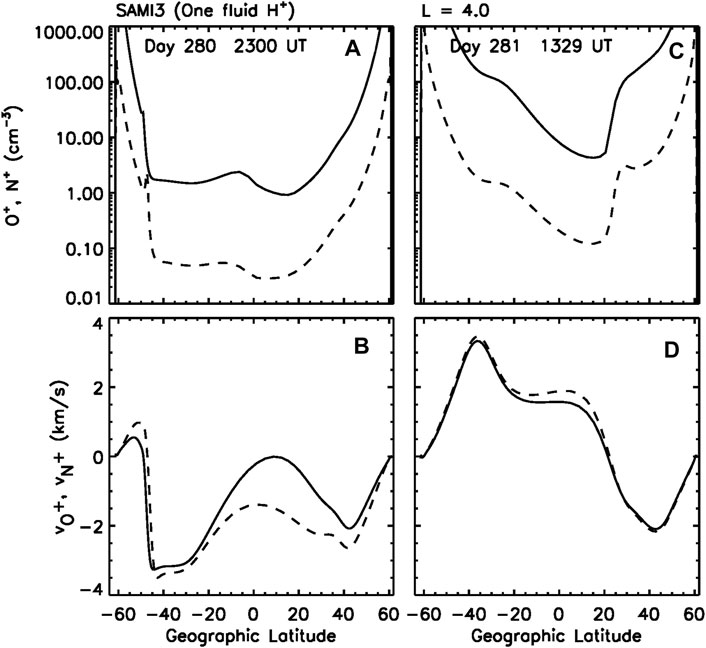
FIGURE 5. O+ (solid) and N+ (dashed) ion densities (A, C) and velocities (B, D) plotted versus latitude along a fixed-longitude (0.5°) L = 4 field line at Day 280 2300 UT (A,B) and Day 281 1329 UT (C, D) from the SAMI3 (one fluid H+) simulation. Panels (A, B) are at the same time as panel (B) of Panel 4. The weak high altitude density peak in panel (A) (and Panel 4B) occurs at a time when the upward daytime flows have not yet entirely reversed, panel (B).
After dusk, velocities in the south reverse, panel (b). Here, downward flows in the south are growing while upward flows in the north persist. Near the apex, the velocity is close to zero. Profiles of O+ density and velocity in Figures 5A,B show that the density peak near the apex, visible only in panel (a), is not associated with simultaneous converging upflows. We speculate that the O+ density peak near the apex of the field line in Figures 4B, 5A represents density that is slowest to descend at night. Dashed lines in Figure 5 show that N+ generally mimics O+, but with a lower density.
5 Discussion: Bottom-Up Refilling
Based on past work, we expect a two-stream treatment of H+ to replace “top-down” refilling, seen in one-fluid models (Banks et al., 1971), with “bottom-up” refilling (Rasmussen and Schunk, 1988). With top-down refilling, the initial peak is at high altitude. With bottom-up refilling, two initial peaks occur at lower altitude. In Figure 3, the top-down peak is in panel (a) at latitude −10°. In the two-stream SAMI3 result, panel (c), only one peak is clearly visible; it is located at −20°. In fact, there are two H+ peaks in panel (c), the northern peak being at 25°. This can be seen in Figure 3, panel (c), where the separate
In Figure 3C,
It is notable that neither the one top-down peak, Figure 3A, nor the two bottom-up peaks, Figure 3C, are nearly as dramatic as the corresponding features found in test-case numerical models of refilling [e.g. 42, 23]. In fact, differences between these SAMI3 and two-stream SAMI3 results are confined to the midnight sector at high altitudes where the top-down density peak in SAMI3 exceeds the two-stream SAMI3 density by only a factor of 2. Otherwise, results from the two simulations are quite similar. While observations of low-energy ion outflows (Sagawa et al., 1987; Liemohn et al., 2005) and plumes (Borovsky et al., 2014; Lee et al., 2016) often show counterstreaming ion populations, corresponding “bottom-up” (or discredited “top-down”) density enhancements have yet to be detected.
These runs illustrate the importance of multidimensional simulations for the purpose of accurately simulating refilling events. Specifically, our present runs differ from prior one-dimensional (single field line) simulations [e.g. 42, 37] and our own prior two-dimensional SAMI2 (one magnetic longitude) simulations (Krall et al., 2008; Krall and Huba, 2019) in that the low-density pre-refilling conditions imposed in those low-dimensionality simulations are not present here. The “empty” field lines that are convected into a global plasmasphere simulation are not empty at all. They instead represent the cold plasma component of the tailward magnetosphere. In this case, we represented that plasma by imposing a minimum density of 0.1 cm−3. Further, these inward-convecting field lines develop low-density counterstreaming ion flows as soon as they enter the simulation. While it might be possible to capture some of these features by imposing convection drifts and a tailward boundary condition on a SAMI2 simulation, a complete numerical description, including zonal convection drifts, are obtainable only via three-dimensional simulation. Ultimately, such modeling will need to be placed into the context of a global magnetosphere simulation, such as by Glocer et al. (2020).
6 Discussion: Counterstreaming Outflows
To be clear, in this study of H+, He+, O+, and N+ counterstreaming outflows, only H+ counterstreaming is simulated, and only in the two-stream SAMI3 case. He+, O+, and N+ are represented using a single fluid per ion species. In the latter cases, would-be counterstreaming flows are indicated by simultaneous converging upflows, such as in Figures 3B, 5D, with corresponding density peaks, Figures 3A, 5C.
From previous studies, we expect that the He+ and H+ components of the plasmasphere are generally co-located. For example, remote and in situ measurements show that the He+ and H+ components of the plasmapause are closely aligned (Goldstein et al., 2003). These results, specifically Figure 3, are consistent with this past understanding. They suggest that counterstreaming He+ outflows, like H+ outflows, occur during refilling (Richards et al., 1983). However, given the lack of dramatic differences between these SAMI3 and two-stream SAMI3 results, and that the He+ density is typically less than 10% of the H+ density, we speculate that counterstreaming He+ outflows are not significant.
In the case of O+, we find simultaneous converging high-altitude upflows only during the day and during the storm, when the ring current heating outflow is further supported by the tendency of the ionosphere and plasmasphere to swell during the day (Galvan et al., 2008). In Figure 5D we find nearly identical converging upflow velocities for O+ (solid curve) and N+ (dashed curve). These converge at latitude 22°, where the field-aligned velocity crosses zero. At this point both the O+ and N+ densities jump by an order of magnitude and N+ has a local density peak. The O+ density curve at latitude 25° might also be interpreted as a local density peak.
Figure 6 further examines the colliding outflow that is apparent in Figure 5D. O+ density contours (left column) and corresponding O+ and N+ density profiles along the L = 4 field line (right column) show that the density jump of Figure 5C, also shown in Figure 6F, occurs just as the north and south O+ outflows meet at high altitude.
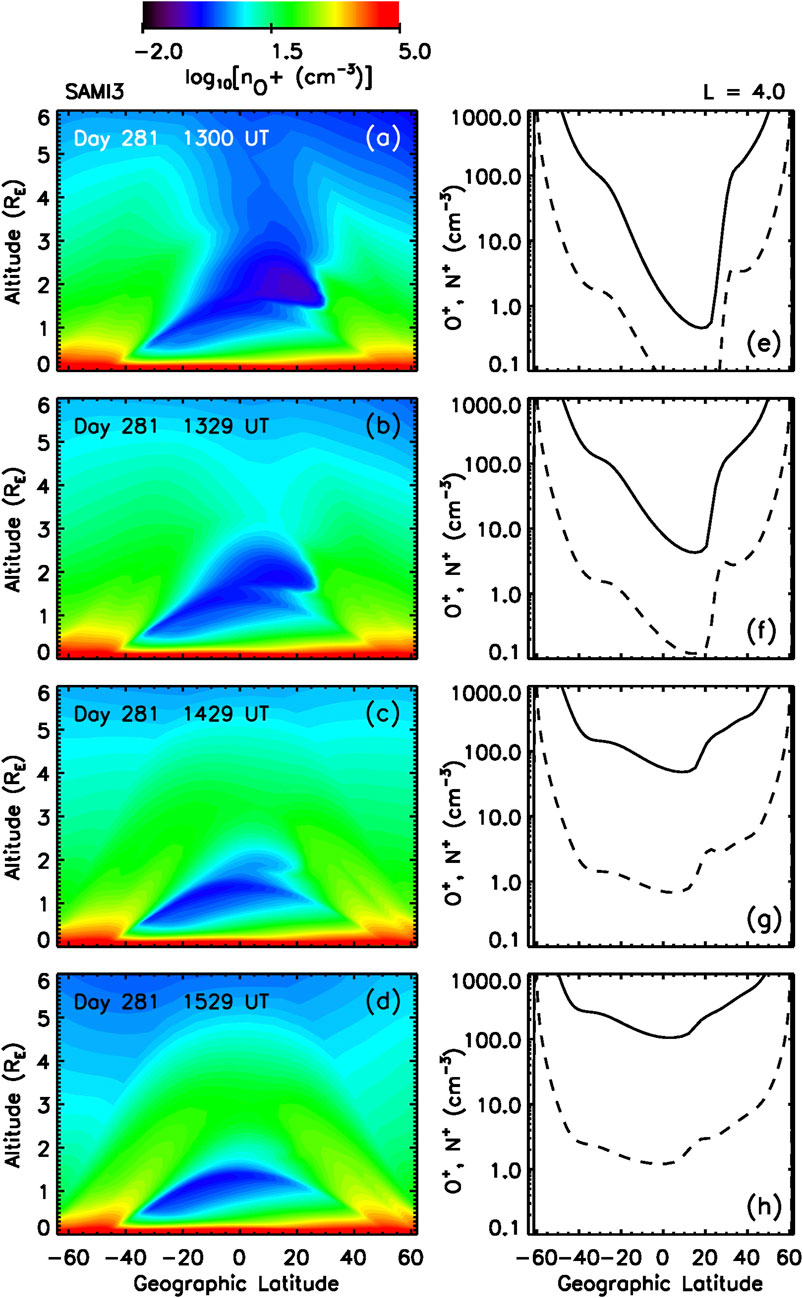
FIGURE 6. Color contours of the log of the O+ density (A–D) versus latitude and altitude and O+ (solid) and N+ (dashed) ion densities (E–H) versus latitude on an L = 4 field line at various times from the SAMI3 (one fluid H+) simulation. Panels (B,F) are at the same time as Panels 5C,D.
Figures 6A,E, 30 min earlier, shows that these two relatively high density (100 cm−3) outflows have not yet connected. Figures 6C,G, 1 hour later, and (d, h), 2 hours later, show that the localized density peak dissipates very quickly. Velocity profiles (not shown) at these same times demonstrate that the coincidence of the velocity zero-crossing and the local density peak, see in Figures 5C,D, does not persist.
These results suggest that counterstreaming O+ ions are both likely be present at high altitude during a storm and likely to be only a transient effect. We speculate that a two-fluid model of O+ might not exhibit the same density jump as in Figure 5D; instead one might obtain a different, but similarly brief, transient density structure.
Unfortunately these O (1 eV) outflows are very difficult to measure. For example, Sagawa et al. (1987) uses Dynamics Explorer 1 data to simultaneously measure composition and pitch angle distribution, but only for energies >10 eV. Using these same data, Lin et al. (1982) infer counterstreaming Maxwellian ion populations such as simulated here. Lee et al. (2016) uses measurements to infer numerous plume or outflow occurrences. However, because measurements used in that study cannot access ion energies below 5 eV, the cold plumes and outflows could not be described in detail. Nevertheless, even within the limitations of current observations, model/data comparison and analysis of well-measured events could provide a useful evaluation of these results.
7 Conclusion
As in past modeling studies (Richards et al., 1983), we find evidence for stormtime counterstreaming H+ and He+ outflows. In this global simulation of an actual storm, however, such counterstreaming is notable only in the midnight sector. Results also suggest the occurrence of stormtime, high-altitude O+ and N+ counterstreaming in the afternoon sector, where the ring-current heating that drives the outflow is strongest (Krall et al., 2020). In these simulations, where O+ and N+ are each modeled using a single fluid (only H+ was modeled using two fluids), converging O+ and N+ produce small density peaks (less than an order of magnitude over background values), Figure 6F. These density enhancements dissipate rapidly, Figures 6G,H. In Figure 6F, the local N+ density peak is on an L = 4 field line at latitude 28°.
While two-stream SAMI3 (SAMI3 with a two-fluid model of H+) leads to minor changes in the results at plasmasphere altitudes, the biggest effect is the avoidance of a small, nonphysical H+ density peak near the equator, in the midnight sector, during early-stage refilling. At lower altitudes (<2RE), this effect is less significant. For a strong storm, however, low-density flux tubes might convect in from the tail quickly enough to bring flux tubes to low L values while still undergoing early-stage refilling; this might produce stronger density peaks. In all cases simulated here, nonphysical high-altitude density peaks were quite mild, with the nonphysical density peak exceeding the expected result by less than a factor of 10. In this global simulation of an actual storm event, non-physical one-fluid-model density peaks were not nearly as pronounced as those seen in past refilling test-case studies (Singh et al., 1986; Rasmussen and Schunk, 1988; Krall et al., 2008; Krall and Huba, 2019).
Data Availability Statement
The datasets presented in this study can be found in online repositories. The names of the repository/repositories and accession number(s) can be found below: https://doi.org/10.5281/zenodo.4771210.
Author Contributions
Both authors, JK and JH contributed to this manuscript.
Funding
This research was supported by NRL base Funds, NASA Grand Challenge award NNH17AE97I, and NASA Living with a Star award 80NSSC19K0089.
Conflict of Interest
Author JH was employed by the company Syntek Technologies.
The remaining author declares that the research was conducted in the absence of any commercial or financial relationships that could be construed as a potential conflict of interest.
Publisher’s Note
All claims expressed in this article are solely those of the authors and do not necessarily represent those of their affiliated organizations, or those of the publisher, the editors and the reviewers. Any product that may be evaluated in this article, or claim that may be made by its manufacturer, is not guaranteed or endorsed by the publisher.
Acknowledgments
We thank Mei-Ching Fok of NASA Goddard Space Flight Center for helpful discussions.
References
Bailey, G. J., Balan, N., and Su, Y. Z. (1997). The Sheffield University Plasmasphere Ionosphere Model-A Review. J. Atmos. Solar-Terrestrial Phys. 59, 1541–1552. doi:10.1016/S1364-6826(96)00155-1
Banks, P. M., Nagy, A. F., and Axford, W. I. (1971). Dynamical Behavior of thermal Protons in the Mid-latitude Ionosphere and Magnetosphere. Planet. Space Sci. 19, 1053–1067. doi:10.1016/0032-0633(71)90104-8
Borovsky, J. E., Welling, D. T., Thomsen, M. F., and Denton, M. H. (2014). Long-lived Plasmaspheric Drainage Plumes: Where Does the Plasma Come from? J. Geophys. Res. Space Phys. 119, 6496–6520. doi:10.1002/2014JA02022810.1002/2014ja020228
Carpenter, D. L. (1966). Whistler Studies of the Plasmapause in the Magnetosphere: 1. Temporal Variations in the Position of the Knee and Some Evidence on Plasma Motions Near the Knee. J. Geophys. Res. 71, 693–709. doi:10.1029/JZ071i003p00693
Chappell, C. R. (1982). Initial Observations of thermal Plasma Composition and Energetics from Dynamics Explorer-1. Geophys. Res. Lett. 9, 929–932. doi:10.1029/GL009i009p00929
Codrescu, M. V., Negrea, C., Fedrizzi, M., Fuller-Rowell, T. J., Dobin, A., Jakowsky, N., et al. (2012). A Real-Time Run of the Coupled Thermosphere Ionosphere Plasmasphere Electrodynamics (CTIPe) Model. Space Weather 10, a–n. doi:10.1029/2011SW000736
Craven, P. D., Comfort, R. H., Richards, P. G., and Grebowsky, J. M. (1995). Comparisons of Modeled N+, O+, H+, and He+ in the Midlatitude Ionosphere with Mean Densities and Temperatures from Atmosphere Explorer. J. Geophys. Res. 100, 257–268. doi:10.1029/94JA02306
Craven, P. D., Gallagher, D. L., and Comfort, R. H. (1997). Relative Concentration of He+ in the Inner Magnetosphere as Observed by the DE 1 Retarding Ion Mass Spectrometer. J. Geophys. Res. 102, 2279–2289. doi:10.1029/96JA02176
Dent, Z. C., Mann, I. R., Goldstein, J., Menk, F. W., and Ozeke, L. G. (2006). Plasmaspheric Depletion, Refilling, and Plasmapause Dynamics: A Coordinated Ground-Based and IMAGE Satellite Study. J. Geophys. Res. 111, A03205. doi:10.1029/2005JA011046
Foster, J. C., Erickson, P. J., Coster, A. J., Thaller, S., Tao, J., Wygant, J. R., et al. (2014). Storm Time Observations of Plasmasphere Erosion Flux in the Magnetosphere and Ionosphere. Geophys. Res. Lett. 41, 762–768. doi:10.1002/2013GL059124
Gallagher, D. L., and Comfort, R. H. (2016). Unsolved Problems in Plasmasphere Refilling. J. Geophys. Res. Space Phys. 121, 1447–1451. doi:10.1002/2015JA02227910.1002/2015ja022279
Galvan, D. A., Moldwin, M. B., and Sandel, B. R. (2008). Diurnal Variations in Plasmaspheric He+ Inferred from Extreme Ultraviolet Images. J. Geophys. Res. Space Phys. 113, A09216. doi:10.1029/2007JA01301310.1029/2007ja013013
Glocer, A., Welling, D., Chappell, C. R., Toth, G., Fok, M. C., Komar, C., et al. (2020). A Case Study on the Origin of Near‐Earth Plasma. J. Geophys. Res. Space Phys. 125, e2020JA028205. doi:10.1029/2020JA028205
Goldstein, J., Spasojevic, M., Reiff, P. H., Sandel, B. R., Forrester, W. T., Gallagher, D. L., et al. (2003). Identifying the Plasmapause in IMAGE EUV Data Using IMAGE RPI In Situ Steep Density Gradients. J. Geophys. Res. 108, 1147. doi:10.1029/2002JA009475
Horwitz, J. L., Brace, L. H., Comfort, R. H., and Chappell, C. R. (1986). Dual-spacecraft Measurements of Plasmasphere-Ionosphere Coupling. J. Geophys. Res. 91, 11203–11216. doi:10.1029/JA091iA10p1120310.1029/ja091ia10p11203
Huba, J. D., Joyce, G., and Fedder, J. A. (2000). Sami2 Is Another Model of the Ionosphere (Sami2): A New Low-Latitude Ionosphere Model. J. Geophys. Res. 105, 23035–23053. doi:10.1029/2000JA00003510.1029/2000ja000035
Huba, J. D., Joyce, G., and Fedder, J. A. (2000). The Formation of an Electron Hole in the Topside Equatorial Ionosphere. Geophys. Res. Lett. 27, 181–184. doi:10.1029/1999GL010735
Huba, J. D., Joyce, G., Sazykin, S., Wolf, R., and Spiro, R. (2005). Simulation Study of Penetration Electric Field Effects on the Low- to Mid-latitude Ionosphere. Geophys. Res. Lett. 32, L23101. doi:10.1029/2005GL024162
Huba, J., and Krall, J. (2013). Modeling the Plasmasphere with Sami3. Geophys. Res. Lett. 40, 6–10. doi:10.1029/2012GL054300
Ilie, R., and Liemohn, M. W. (2016). The Outflow of Ionospheric Nitrogen Ions: A Possible Tracer for the Altitude‐dependent Transport and Energization Processes of Ionospheric Plasma. J. Geophys. Res. Space Phys. 121, 9250–9255. doi:10.1002/2015JA022162
Krall, J., Huba, J. D., and Borovsky, J. E. (2018). Sami3 Simulations of a Persistent Plasmasphere Plume. Geophys. Res. Lett. 45, 3374–3381. doi:10.1002/2017GL076448
Krall, J., Huba, J. D., and Fedder, J. A. (2008). Simulation of Field-Aligned H+ and He+ Dynamics during Late-Stage Plasmasphere Refilling. Ann. Geophys. 26, 1507–1516. doi:10.5194/angeo-26-1507-2008
Krall, J., Huba, J. D., and Fok, M. C. (2020). Does Ring Current Heating Generate the Observed O + Shell? Geophys. Res. Lett. 47, e2020GL088419. doi:10.1029/2020GL088419
Krall, J., and Huba, J. D. (2019). Simulation of Counterstreaming H + Outflows during Plasmasphere Refilling. Geophys. Res. Lett. 46, 3052–3060. doi:10.1029/2019GL082130
Lee, S. H., Zhang, H., Zong, Q. G., Otto, A., Rème, H., and Liebert, E. (2016). A Statistical Study of Plasmaspheric Plumes and Ionospheric Outflows Observed at the Dayside Magnetopause. J. Geophys. Res. Space Phys. 121, 492–506. doi:10.1002/2015JA021540
Lichtenberger, J., Clilverd, M. A., Heilig, B., Vellante, M., Manninen, J., Rodger, C. J., et al. (2013). The Plasmasphere during a Space Weather Event: First Results from the PLASMON Project. J. Space Weather Space Clim. 3, A23. doi:10.1051/swsc/2013045
Liemohn, M. W., Khazanov, G. V., Craven, P. D., and Kozyra, J. U. (1999). Nonlinear Kinetic Modeling of Early Stage Plasmaspheric Refilling. J. Geophys. Res. 104, 10295–10306. doi:10.1029/1999JA90010410.1029/1999ja900104
Liemohn, M. W., Moore, T. E., Craven, P. D., Maddox, W., Nagy, A. F., and Kozyra, J. U. (2005). Occurrence Statistics of Cold, Streaming Ions in the Near-Earth Magnetotail: Survey of Polar-TIDE Observations. J. Geophys. Res. 110, A07211. doi:10.1029/2004JA010801
Lin, C. S., Burch, J. L., Winningham, J. D., Menietti, J. D., and Hoffman, R. A. (1982). DE-1 Observations of Counterstreaming Electrons at High Altitudes. Geophys. Res. Lett. 9, 925–928. doi:10.1029/GL009i009p00925
Lin, J., Horwitz, J. L., Wilson, G. R., Ho, C. W., and Brown, D. G. (1992). A Semikinetic Model for Early Stage Plasmasphere Refilling: 2, Effects of Wave-Particle Interactions. J. Geophys. Res. 97, 1121–1134. doi:10.1029/91JA02729
Marchaudon, A., and Blelly, P. L. (2015). A New Interhemispheric 16‐moment Model of the Plasmasphere‐ionosphere System: IPIM. J. Geophys. Res. Space Phys. 120, 5728–5745. doi:10.1002/2015JA021193
Maruyama, N., Sun, Y. Y., Richards, P. G., Middlecoff, J., Fang, T. W., Fuller‐Rowell, T. J., et al. (2016). A New Source of the Midlatitude Ionospheric Peak Density Structure Revealed by a New Ionosphere‐Plasmasphere Model. Geophys. Res. Lett. 43, 2429–2435. doi:10.1002/2015GL067312
Maynard, N. C., and Chen, A. J. (1975). Isolated Cold Plasma Regions: Observations and Their Relation to Possible Production Mechanisms. J. Geophys. Res. 80, 1009–1013. doi:10.1029/JA080i007p01009
McIlwain, C. E. (1961). Coordinates for Mapping the Distribution of Magnetically Trapped Particles. J. Geophys. Res. 66, 3681–3691. doi:10.1029/JZ066i011p0368110.1029/jz066i011p03681
Nishida, A. (1966). Formation of Plasmapause, or Magnetospheric Plasma Knee, by the Combined Action of Magnetospheric Convection and Plasma Escape from the Tail. J. Geophys. Res. 71, 5669–5679. doi:10.1029/JZ071i023p05669
Park, C. G. (1973). Whistler Observations of the Depletion of the Plasmasphere during a Magnetospheric Substorm. J. Geophys. Res. 78, 672–683. doi:10.1029/JA078i004p00672
Rasmussen, C. E., and Schunk, R. W. (1988). Multistream Hydrodynamic Modeling of Interhemispheric Plasma Flow. J. Geophys. Res. 93, 14557–14565. doi:10.1029/JA093iA12p14557
Richards, P. G., Schunk, R. W., and Sojka, J. J. (1983). Large-scale Counterstreaming of H+and He+along Plasmaspheric Flux Tubes. J. Geophys. Res. 88, 7879–7886. doi:10.1029/JA088iA10p07879
Roberts, W. T., Horwitz, J. L., Comfort, R. H., Chappell, C. R., Waite, J. H., and Green, J. L. (1987). Heavy Ion Density Enhancements in the Outer Plasmasphere. J. Geophys. Res. 92, 13499–13512. doi:10.1029/JA092iA12p13499
Sagawa, E., Yau, A. W., Whalen, B. A., and Peterson, W. K. (1987). Pitch Angle Distributions of Low-Energy Ions in the Near-Earth Magnetosphere. J. Geophys. Res. 92, 12241–12254. doi:10.1029/JA092iA11p1224110.1029/ja092ia11p12241
Sandel, B. R., and Denton, M. H. (2007). Global View of Refilling of the Plasmasphere. Geophys. Res. Lett. 34, L17102. doi:10.1029/2007GL03066910.1029/2007gl030669
Singh, N., Schunk, R. W., and Thiemann, H. (1986). Temporal Features of the Refilling of a Plasmaspheric Flux Tube. J. Geophys. Res. 91, 13433–13454. doi:10.1029/JA091iA12p13433
Singh, N., Wilson, G. R., and Horwitz, J. L. (1994). Comparison of Hydrodynamic and Semikinetic Treatments for a Plasma Flow along Closed Field Lines. J. Geophys. Res. 99, 11495–11506. doi:10.1029/93JA0302710.1029/93ja03027
Sojka, J. J., and Wrenn, G. L. (1985). Refilling of Geosynchronous Flux Tubes as Observed at the Equator by GEOS 2. J. Geophys. Res. 90, 6379–6385. doi:10.1029/JA090iA07p06379
St.-Maurice, J.-P., and Schunk, R. W. (1977). Diffusion and Heat Flow Equations for the Mid-latitude Topside Ionosphere. Planet. Space Sci. 25, 907–920. doi:10.1016/0032-0633(77)90003-4
Stern, D. P. (1975). The Motion of a Proton in the Equatorial Magnetosphere. J. Geophys. Res. 80, 595–599. doi:10.1029/JA080i004p00595
Su, Y.-J., Thomsen, M. F., Borovsky, J. E., and Lawrence, D. J. (2001). A Comprehensive Survey of Plasmasphere Refilling at Geosynchronous Orbit. J. Geophys. Res. 106, 25615–25629. doi:10.1029/2000JA00044110.1029/2000ja000441
Volland, H. (1973). A Semiempirical Model of Large-Scale Magnetospheric Electric fields. J. Geophys. Res. 78, 171–180. doi:10.1029/JA078i001p0017110.1029/ja078i001p00171
Wang, Y., Tu, J., and Song, P. (2015). A New Dynamic Fluid‐kinetic Model for Plasma Transport within the Plasmasphere. J. Geophys. Res. Space Phys. 120, 8486–8502. doi:10.1002/2015JA021345
Keywords: ionosphere, plasmasphere, magnetosphere, oxygen torus, oxygen shell, cold plasma, ionosphere outflow
Citation: Krall J and Huba JD (2021) Counterstreaming Cold H+, He+, O+, and N+ Outflows in the Plasmasphere. Front. Astron. Space Sci. 8:712611. doi: 10.3389/fspas.2021.712611
Received: 20 May 2021; Accepted: 21 July 2021;
Published: 04 August 2021.
Edited by:
Scott Alan Thaller, University of Colorado Boulder, United StatesReviewed by:
W. K. Peterson, University of Colorado Boulder, United StatesIldiko Horvath, The University of Queensland, Australia
Copyright © 2021 Krall and Huba. This is an open-access article distributed under the terms of the Creative Commons Attribution License (CC BY). The use, distribution or reproduction in other forums is permitted, provided the original author(s) and the copyright owner(s) are credited and that the original publication in this journal is cited, in accordance with accepted academic practice. No use, distribution or reproduction is permitted which does not comply with these terms.
*Correspondence: J. Krall, am9uYXRoYW4ua3JhbGxAbnJsLm5hdnkubWls