 J. Krall1*
 J. D. Huba2
- 1Naval Research Laboratory, Plasma Physics Division, Washington, DC, United States
- 2Syntek Technologies, Fairfax, VA, United States
The Naval Research Laboratory (NRL) Sami2 is Another Model of the Ionosphere (SAMI2) and Sami3 is Also a Model of the Ionosphere (SAMI3) ionosphere/plasmasphere codes have shown that thermosphere composition and winds significantly affect H+ outflows from the topside ionosphere. In particular, O density inhibits upward diffusion of O+ from the ionosphere F layer, especially during solar maximum conditions. In addition, winds affect the quiet-time latitudinal extent of the F layer, affecting densities at mid-to-high latitudes that are the source of plasmasphere refilling outflows. Evidence for these effects is reviewed and prospects for forecasting these outflows are explored. Open questions for future research are highlighted.
1 Introduction
Light ions, H+ and He+, commonly flow upward from the topside ionosphere. At high latitudes, these ions constitute the classical polar wind (Bauer and Frihagen, 1966; Dessler and Michel, 1966). At lower latitudes, these outflows fill the plasmasphere (Park, 1970; Gallagher and Comfort, 2016). Because the polar wind and plasmasphere serve as a source and a sink, respectively, for geoeffective energetic ions, thermal (non-energized, Maxwellian) outflows are essential elements of space weather (Bortnik and Thorne, 2007; Millan and Thorne, 2007). Further, observations suggest significant day-to-day variability in thermosphere composition (Krall et al., 2016a; Cai et al., 2020) and winds (McDonald et al., 2015). In this brief review, we consider the effect of thermosphere composition and winds on refilling outflows. Thermosphere dynamics and ionosphere outflows at polar latitudes, a much bigger subject, will not be addressed.
Because the solar cycle so strongly affects thermosphere and exosphere composition, the variation of cold H+ refilling outflows with the solar cycle, specifically with the
where
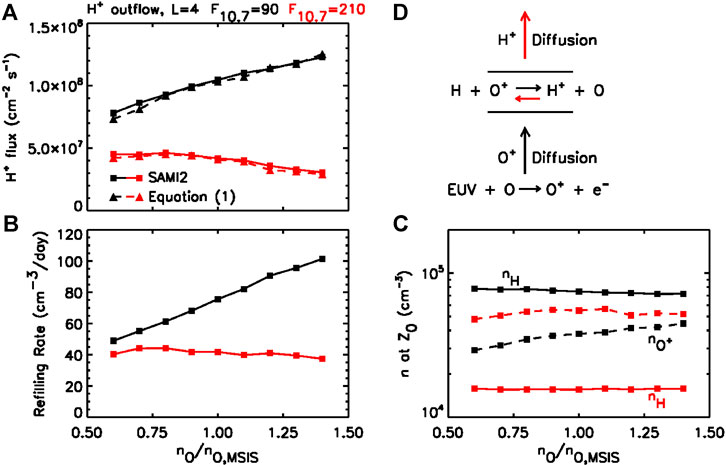
FIGURE 1. (A) H+ flux from SAMI2 and from Eq. 1 (B) refilling rate, and (C)
Let us consider the factors in Eq. 1. Relative to densities at solar minimum (low
In addition, the ionosphere F layer that is the source of these outflows is strongly affected by thermosphere winds (Rishbeth, 1998). Specifically, winds effect the degree to which the ionosphere, which is most strongly generated near the sub-solar point, is transported to the mid-to-high latitudes that are the source of the plasmasphere. While numerical simulations by Krall et al. (2014) demonstrate that plasmasphere morphology and refilling rates are impacted by thermosphere winds, these effects have yet to be directly observed. As it stands, measured post-storm plasmasphere refilling rates at any given height vary by as much as an order of magnitude (Denton et al., 2012), Figure 1. These variations are not yet fully explained.
This brief review is based on results from the Sami2 is Another Model of the Ionosphere (SAMI2) and Sami3 is Also a Model of the Ionosphere (SAMI3) ionosphere/plasmasphere codes (Huba et al., 2000; Huba and Krall, 2013). SAMI3 simulates the interaction between ionosphere and plasmasphere ion populations and the thermosphere (Huba and Liu, 2020) and magnetosphere (Huba et al., 2005; Huba and Sazykin, 2014). SAMI2 solves the same equations as SAMI3, but in only a single magnetic longitude. For the results included here, SAMI2 was modified to accommodate counterstreaming H+ outflows as in Krall and Huba (2019b).
In the next section, the effect of thermosphere composition, particularly the O density, will be demonstrated using SAMI2. This will be followed by SAMI3 results showing the effect of winds. We then discuss the challenge of forecasting these outflows, given observed day-to-day variability in thermosphere composition and winds. We close with a brief list of open questions for future research.
2 SAMI2 Results: Thermosphere Composition
In a recent simulation (Krall et al., 2016b) of post-storm plasmasphere refilling (Singh and Horwitz, 1992), it was found that model-data agreement was not attainable without careful attention to the thermosphere O density. In particular, O atoms tend to act as a barrier to the upward diffusion of O+ ions (Figure 1D). This effect, which is not explicit in Eq. 1, was recently illustrated using the SAMI2 code (Krall and Huba, 2019a). The SAMI2 code, which simulates a single magnetic-longitude plane, runs quickly enough to support parameter studies such as described here.
In a series of simulations of outflow and refilling following a model storm, the thermosphere O density was varied relative to values provided by the NRLMSISE-00 (Picone et al., 2002) version of the Magnetic Spectrometer Incoherent Scatter (MSIS) empirical atmosphere model (Hedin, 1987). This was done for solar maximum (
The results are presented in Figure 1. In Figure 1C,
Increased O levels in the thermosphere affect outflows in two ways, both of which are illustrated in Figures 1A,B. First, increased O increases the O supply in the ionosphere. At solar minimum (black curves), this effect dominates; note the increase in O+ in Figure 1C. Second, increased O slows the upward diffusion of O+. At solar maximum (red curves) the diffusion effect tends to dominate, slowing outflow and refilling. Further results (Krall and Huba, 2019a)], show that the O+ scale height falls with increasing
Good agreement between SAMI2 and Eq. 1, shown in Figure 1A, demonstrates that the effect of the O density is fully consistent with the outflow formulation of Richards and Torr (1985).
3 SAMI3 Results: Thermosphere Winds
We now consider the effect of thermosphere winds on plasmasphere refilling. As is well known (Rishbeth, 1998; Lühr et al., 2011), the wind-driven dynamo potential drives
In order to run SAMI3 (or SAMI2), thermosphere densities and winds must be specified. Typically, as in the SAMI2 runs above, we compute densities using MSIS (Hedin, 1987; Picone et al., 2002) and compute winds using the Horizontal Wind Model (Hedin, 1991; Drob et al., 2008; Drob et al., 2015). However, we can instead obtain a thermosphere specification from a first-principles model, such as the Thermosphere Ionosphere Mesosphere Electrodynamics General Circulation Model (TIMEGCM) (Roble and Ridley, 1994). For the results presented here TIMEGCM was driven, at the lower boundary, by climatological tides.
In each of the SAMI3 simulations of Krall et al. (2014), and Figure 2, we model five days of refilling following a geomagnetic storm on day 31 of 2001. Figure 2 (left column) shows refilling as globally averaged
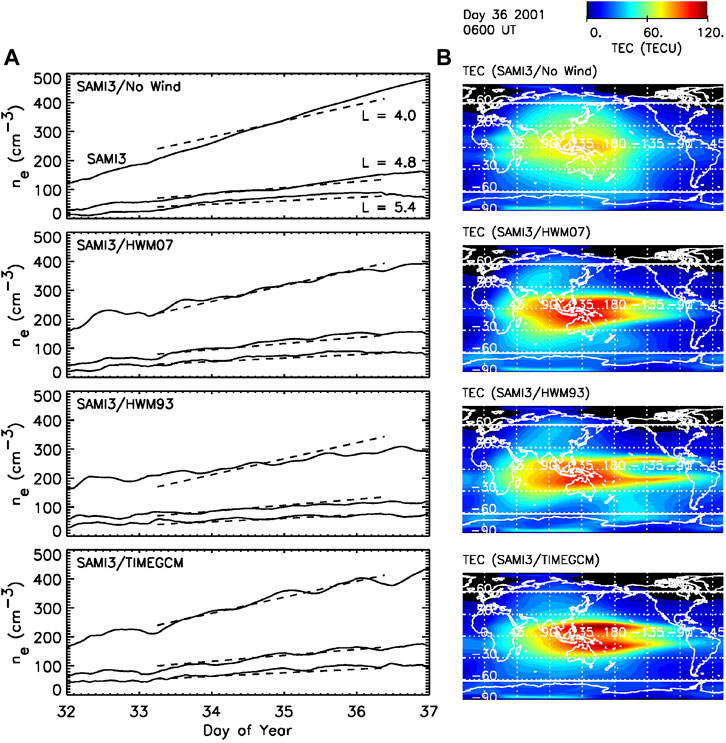
FIGURE 2. Left column: electron density averaged over longitude in the equatorial plane plotted vs. time for
The state of the ionosphere for each case is shown in the right-hand column, where Total Electron Content (vertically integrated
4 Discussion: Can These Effects Be Forecasted?
Any event that affects thermosphere O densities, exosphere H densities, or thermosphere winds on a global scale, such as a geomagnetic storm or a sudden stratosphere warming (SSW) (Chau et al., 2009; Oberheide et al., 2020), has the potential to affect global refilling rates. For example, Jones et al. (2020) suggests that both SSW events and magnetospheric cooling events affect the density of H atoms in the exobase. In order to understand and predict outflows, it is necessary to understand and predict these episodic events.
In addition, thermosphere observations (McDonald et al., 2015; Cai et al., 2020) suggest significant day-to-day variability. For example, satellite data can be used to estimate the globally averaged O density at altitude 400 km, where O is the dominant atom (Picone et al., 2005). In Krall et al. (2016a), Figure 3, we presented such data with a 4-day resolution, finding that global
Day-to-day variability of thermosphere winds can be observed in daily measurements of TEC. McDonald et al. (2015) presented such TEC data and showed that, when driven from below by assimilated data, a computer simulation of the thermosphere reproduces about 50% of the observed variability. This forcing from below (McCormack et al., 2017) and resulting impacts (Jones et al., 2014) are increasingly well-understood in terms of tides. Specific mechanisms, such as tidal amplification (Goncharenko et al., 2010; Klimenko et al., 2019) and specific ionosphere signatures (Immel et al., 2006) have been identified. While older simulations (Fang et al., 2013) support the finding that tidal forcing accounts for about one half of observed variability, recent work (Zawdie et al., 2020) comes closer to determining the state of the ionosphere-thermosphere system in enough detail to now-cast the upper-atmospheric source of refilling outflows.
While even less is known about day-to-day variability in the exosphere, recent results are suggestive. For example, climatological analysis of exosphere observations revealed both solar cycle dependence and significant scatter, perhaps indicative of variability (Joshi et al., 2019). Diurnal variability has been quantified (Qian et al., 2018), but does not necessarily imply day-to-day variability. Perhaps more to the point, Forbes et al. (2014) found that signatures of thermosphere tides are detectable in exosphere temperatures. This implies that day-to-day variability in thermosphere tides, which is known to be present for some tidal components, might be a cause of similar variability in exosphere H densities. If present, day-to-day variability in exosphere H densities could contribute to the observed scatter in refilling rates (Krall et al., 2018). Finally, we note that the exosphere could have structure (Hodges, 1994; Cucho-Padin and Waldrop, 2018) not present in these simulations, especially during a storm (Kuwabara et al., 2017; Qin et al., 2017; Zoennchen et al., 2017; Cucho-Padin and Waldrop, 2019).
Simulations suggest that variability in thermosphere winds also affects global
Finally, we should acknowledge that any forecast depends on accurate model inputs. Both satellite (Emmert, 2015) and Arecibo radar data (Joshi et al., 2018) show significant long-term deviations from the MSIS model. New observations of thermosphere winds on a global scale are presently coming from the NASA Ionospheric Connection Explorer (ICON) (Immel et al., 2018). ICON is equipped with a Michelson interferometer, built by the NRL, that measures winds and temperatures in the altitude range 90–300 km (Harding et al., 2021; Makela et al., 2021). We are hopeful that newly accurate thermosphere now-casting data products might be developed.
We close with a list of interesting open questions. What is the magnitude of day-to-day variability, if any, in the thermosphere O density? Does day-to-day variability of thermosphere densities, if any, imply similar variability in the exosphere? Do thermosphere winds truly shape the plasmasphere? How do high-latitude storm-driven winds affect the global wind-driven dynamo and refilling outflows?
Author Contributions
Both JK and JH contributed to this work.
Funding
This research was supported by NRL Base Funds, NASA Grand Challenge award NNH17AE97I, and NASA Living With a Star award 80NSSC19K0089. The research of JH was also supported by NSF grant AGS 1931415.
Conflict of Interest
Author JH was employed by Syntek Technologies.
The remaining author declares that the research was conducted in the absence of any commercial or financial relationships that could be construed as a potential conflict of interest.
Acknowledgments
We thank Lara Waldrop of University of Illinois at Urbana-Champaign, Susan M. Nossal of University of Wisconsin-Madison, McArthur Jones Jr of NRL, and Alan G. Burns of NCAR for helpful discussions. We thank both reviewers for helpful comments.
References
Bauer, S. J. (1966). “The Structure of the Topside Ionosphere,” in Electron Density Profiles in Ionosphere and Exosphere. Editor J. Frihagen (New York: North-Holland), 387.
Bishop, J., Harlander, J., Nossal, S., and Roesler, F. L. (2001). Analysis of Balmer α Intensity Measurements Near Solar Minimum. J. Atmos. Solar-Terrestrial Phys. 63, 341–353. doi:10.1016/S1364-6826(00)00212-1
Bishop, J., Mierkiewicz, E. J., Roesler, F. L., Gómez, J. F., and Morales, C. (2004). Data-model Comparison Search Analysis of Coincident PBO Balmer α, EURD Lyman β Geocoronal Measurements from March 2000. J. Geophys. Res. 109, 1–9. doi:10.1029/2003JA010165
Bortnik, J., and Thorne, R. M. (2007). The Dual Role of ELF/VLF Chorus Waves in the Acceleration and Precipitation of Radiation belt Electrons. J. Atmos. Solar-Terrestrial Phys. 69, 378–386. doi:10.1016/j.jastp.2006.05.030
Cai, X., Burns, A. G., Wang, W., Qian, L., Solomon, S. C., Eastes, R. W., et al. (2020). The Two-Dimensional Evolution of Thermospheric σO/N Response to Weak Geomagnetic Activity during Solar-Minimum Observed by GOLD. Geophys. Res. Lett. 47, e2020GL088838. doi:10.1029/2020GL088838
Chau, J. L., Fejer, B. G., and Goncharenko, L. P. (2009). Quiet Variability of Equatorial E x B Drifts during a Sudden Stratospheric Warming Event. Geophys. Res. Lett. 36, 1–4. doi:10.1029/2008GL036785
Cucho-Padin, G., and Waldrop, L. (2019). Time-dependent Response of the Terrestrial Exosphere to a Geomagnetic Storm. Geophys. Res. Lett. 46, 11661–11670. doi:10.1029/2019GL084327
Cucho-Padin, G., and Waldrop, L. (2018). Tomographic Estimation of Exospheric Hydrogen Density Distributions. J. Geophys. Res. Space Phys. 123, 5119–5139. doi:10.1029/2018JA025323
Denton, R. E., Wang, Y., Webb, P. A., Tengdin, P. M., Goldstein, J., Redfern, J. A., et al. (2012). Magnetospheric Electron Density Long Term ( Day) Refilling Rates Inferred from Passive Radio Emissions Measured by IMAGE RPI during Geomagnetically Quiet Times. J. Geophys. Res. 117, A03221. doi:10.1029/2011JA017274
Dessler, A. J., and Michel, F. C. (1966). Plasma in the Geomagnetic Tail. J. Geophys. Res. 71, 1421–1426. doi:10.1029/JZ071i005p01421
Drob, D. P., Emmert, J. T., Meriwether, J. W., Makela, J. J., Doornbos, E., Conde, M., et al. (2015). An Update to the Horizontal Wind Model (HWM): The Quiet Time Thermosphere. Earth Space Sci. 2, 301–319. doi:10.1002/2014EA000089
Drob, D. P., Emmert, T. J., Crowley, G., Picone, M. J., Shepherd, G. G., Skinner, W., et al. (2008). An Empirical Model of the Earth’s Horizontal Wind fields: HWM07. J. Geophys. Res. Space Phys. 113, A12304. doi:10.1029/2008JA013668
Emmert, J. T. (2015). Altitude and Solar Activity Dependence of 1967–2005 Thermospheric Density Trends Derived from Orbital Drag. J. Geophys. Res. Space Phys. 120, 2940–2950. doi:10.1002/2015JA021047
Fang, T.-W., Akmaev, R., Fuller-Rowell, T., Wu, F., Maruyama, N., and Millward, G. (2013). Longitudinal and Day-To-Day Variability in the Ionosphere from Lower Atmosphere Tidal Forcing. Geophys. Res. Lett. 40, 2523–2528. doi:10.1002/grl.50550
Fehsenfeld, F. C., and Ferguson, E. E. (1972). Thermal Energy Reaction Rate Constants for H and CO with O and NO. J. Chem. Phys. 56, 3066–3070. doi:10.1063/1.1677642
Forbes, J., Zhang, X., and Bruinsma, S. (2014). New Perspectives on Thermosphere Tides: 2. Penetration to the Upper Thermosphere. Earth, Planets and Space 66, 122. doi:10.1186/1880-5981-66-122
Gallagher, D. L., Comfort, R. H., Katus, R. M., Sandel, B. R., Fung, S. F., and Adrian, M. L. (2021). The Breathing Plasmasphere: Erosion and Refilling. J. Geophys. Res. Space Phys. 126, e2020JA028727. doi:10.1029/2020JA028727
Gallagher, D. L., and Comfort, R. H. (2016). Unsolved Problems in Plasmasphere Refilling. J. Geophys. Res. Space Phys. 121, 1447–1451. doi:10.1002/2015JA022279
Goncharenko, L. P., Chau, J. L., Liu, H.-L., and Coster, A. J. (2010). Unexpected Connections between the Stratosphere and Ionosphere. Geophys. Res. Lett. 37, 1-6. doi:10.1029/2010GL043125
Hanson, W. B., and Ortenburger, I. B. (1961). The Coupling between the Protonosphere and the normal F Region. J. Geophys. Res. 66, 1425–1435. doi:10.1029/JZ066i005p01425
Harding, B. J., Chau, J. L., He, M., Englert, C. R., Harlander, J. M., Marr, K. D., et al. (2021). Validation of ICON-MIGHTI Thermospheric Wind Observations: 2. Green-line Comparisons to Specular Meteor Radars. J. Geophys. Res. Space Phys. 126, e2020JA028947. doi:10.1029/2020JA028947
Hedin, A. E. (1987). MSIS-86 Thermospheric Model. J. Geophys. Res. Space Phys. 92, 4649–4662. doi:10.1029/JA092iA05p04649
Hedin, A. E. (1991). Revised Global Model of Thermosphere Winds Using Satellite and Ground-Based Observations. J. Geophys. Res. Space Phys. 96, 7657–7688. doi:10.1029/91JA00251
Hodges, R. R. (1994). Monte Carlo Simulation of the Terrestrial Hydrogen Exosphere. J. Geophys. Res. Space Phys. 99, 23229–23247. doi:10.1029/94JA02183
Horwitz, J. L., Comfort, R. H., and Chappell, C. R. (1990). A Statistical Characterization of Plasmasphere Density Structure and Boundary Locations. J. Geophys. Res. Space Phys. 95, 7937–7947. doi:10.1029/JA095iA06p07937
Huba, J. D., Joyce, G., and Fedder, J. A. (2000). Sami2 Is Another Model of the Ionosphere (Sami2): A New Low-Latitude Ionosphere Model. J. Geophys. Res. 105, 23035–23053. doi:10.1029/2000JA000035
Huba, J. D., and Joyce, G. (2014). Numerical Methods in Modeling the Ionosphere. Washington, DC: American Geophysical Union, 49–55. chap. 5. doi:10.1002/9781118704417.ch5
Huba, J. D., Joyce, G., Sazykin, S., Wolf, R., and Spiro, R. (2005). Simulation Study of Penetration Electric Field Effects on the Low- to Mid-latitude Ionosphere. Geophys. Res. Lett. 32, 1–4. doi:10.1029/2005GL024162
Huba, J. D., and Krall, J. (2013). Modeling the Plasmasphere with Sami3. Geophys. Res. Lett. 40, 6–10. doi:10.1029/2012GL054300
Huba, J. D., and Liu, H.-L. (2020). Global Modeling of Equatorial Spread F with Sami3/WACCM-X. Geophys. Res. Lett. 47, e2020GL088258. doi:10.1029/2020GL088258
Huba, J. D., and Sazykin, S. (2014). Storm Time Ionosphere and Plasmasphere Structuring: Sami3-RCM Simulation of the 31 March 2001 Geomagnetic Storm. Geophys. Res. Lett. 41, 8208–8214. doi:10.1002/2014GL062110
Immel, T. J., England, S. L., Mende, S. B., Heelis, R. A., Englert, C. R., Edelstein, J., et al. (2018). The Ionospheric Connection Explorer Mission: Mission Goals and Design. Space Sci. Rev. 214, 1–4. doi:10.1007/s11214-017-0449-2
Immel, T. J., Sagawa, E., England, S. L., Henderson, S. B., Hagan, M. E., Mende, S. B., et al. (2006). Control of Equatorial Ionospheric Morphology by Atmospheric Tides. Geophys. Res. Lett. 33. doi:10.1029/2006GL026161
Jones, M., Forbes, J. M., Hagan, M. E., and Maute, A. (2014). Impacts of Vertically Propagating Tides on the Mean State of the Ionosphere-Thermosphere System. J. Geophys. Res. Space Phys. 119, 2197–2213. doi:10.1002/2013JA019744
Jones, M., Siskind, D. E., Drob, D. P., McCormack, J. P., Emmert, J. T., Dhadly, M. S., et al. (2020). Coupling from the Middle Atmosphere to the Exobase: Dynamical Disturbance Effects on Light Chemical Species. J. Geophys. Res. Space Phys. 125, e2020JA028331. doi:10.1029/2020JA028331
Joshi, P. P., Phal, Y. D., and Waldrop, L. S. (2019). Quantification of the Vertical Transport and Escape of Atomic Hydrogen in the Terrestrial Upper Atmosphere. J. Geophys. Res. Space Phys. 124, 10468–10481. doi:10.1029/2019JA027057
Joshi, P. P., Waldrop, L. S., and Brum, C. G. M. (2018). Ionospheric O Momentum Balance through Charge Exchange with Thermospheric O Atoms. J. Geophys. Res. Space Phys. 123, 9743–9761. doi:10.1029/2018JA025821
Joshi, P., and Waldrop, L. (2019). Parametric Estimation of Neutral Hydrogen Density under Charge Exchange and Quantification of its Effect on Plasmasphere-Ionosphere Coupling. Earth Space Sci. Open Archive. doi:10.1002/essoar.10500701.1
Klimenko, M. V., Klimenko, V. V., Bessarab, F. S., Sukhodolov, T. V., Vasilev, P. A., Karpov, I. V., et al. (2019). Identification of the Mechanisms Responsible for Anomalies in the Tropical Lower Thermosphere/ionosphere Caused by the January 2009 Sudden Stratospheric Warming. J. Space Weather Space Clim. 9, A39. doi:10.1051/swsc/2019037
Krall, J., Emmert, J. T., Sassi, F., McDonald, S. E., and Huba, J. D. (2016a). Day-to-day Variability in the Thermosphere and its Impact on Plasmasphere Refilling. J. Geophys. Res. Space Phys. 121, 6889–6900. doi:10.1002/2015JA022328
Krall, J., Glocer, A., Fok, M.-C., Nossal, S. M., and Huba, J. D. (2018). The Unknown Hydrogen Exosphere: Space Weather Implications. Space Weather 16, 205–215. doi:10.1002/2017SW001780
Krall, J., Huba, J. D., Denton, R. E., Crowley, G., and Wu, T.-W. (2014). The Effect of the Thermosphere on Quiet Time Plasmasphere Morphology. J. Geophys. Res. Space Phys. 119, 5032–5048. doi:10.1002/2014JA019850
Krall, J., Huba, J. D., Jordanova, V. K., Denton, R. E., Carranza, T., and Moldwin, M. B. (2016b). Measurement and Modeling of the Refilling Plasmasphere during 2001. J. Geophys. Res. Space Phys. 121, 2226–2248. doi:10.1002/2015JA022126
Krall, J., and Huba, J. D. (2019b). Simulation of Counterstreaming H+ Outflows during Plasmasphere Refilling. Geophys. Res. Lett. 46, 3052–3060. doi:10.1029/2019GL082130
Krall, J., and Huba, J. D. (2019a). The Effect of Oxygen on the Limiting H Flux in the Topside Ionosphere. J. Geophys. Res. Space Phys. 124, 4509–4517. doi:10.1029/2018JA026252
Kuwabara, M., Yoshioka, K., Murakami, G., Tsuchiya, F., Kimura, T., Yamazaki, A., et al. (2017). The Geocoronal Responses to the Geomagnetic Disturbances. J. Geophys. Res. Space Phys. 122, 1269–1276. doi:10.1002/2016JA023247
Lawrence, D. J., Thomsen, M. F., Borovsky, J. E., and McComas, D. J. (1999). Measurements of Early and Late Time Plasmasphere Refilling as Observed from Geosynchronous Orbit. J. Geophys. Res. Space Phys. 104, 14691–14704. doi:10.1029/1998JA900087
Lei, J., Thayer, J. P., Forbes, J. M., Sutton, E. K., Nerem, R. S., Temmer, M., et al. (2008). Global Thermospheric Density Variations Caused by High-Speed Solar Wind Streams during the Declining Phase of Solar Cycle 23. J. Geophys. Res. Space Phys. 113, 1–8. doi:10.1029/2008JA013433
Lühr, H., Liu, H., Park, J., and Müller, S. (2011). New Aspects of the Coupling between Thermosphere and Ionosphere, with Special Regards to CHAMP Mission Results. Dordrecht: Springer Netherlands, 303–316. doi:10.1007/978-94-007-0326-1_22
Makela, J. J., Baughman, M., Navarro, L. A., Harding, B. J., Englert, C. R., Harlander, J. M., et al. (2021). Validation of ICON-MIGHTI Thermospheric Wind Observations: 1. Nighttime Red-Line Ground-Based Fabry-Perot Interferometers. J. Geophys. Res. Space Phys. 126, e2020JA028726. doi:10.1029/2020JA028726
McCormack, J., Hoppel, K., Kuhl, D., de Wit, R., Stober, G., Espy, P., et al. (2017). Comparison of Mesospheric Winds from a High-Altitude Meteorological Analysis System and Meteor Radar Observations during the Boreal winters of 2009–2010 and 2012–2013. J. Atmos. Solar-Terrestrial Phys. 154, 132–166. doi:10.1016/j.jastp.2016.12.007
McDonald, S. E., Sassi, F., and Mannucci, A. J. (2015). Sami3/SD-WACCM-X Simulations of Ionospheric Variability during Northern winter 2009. Space Weather 13, 568–584. doi:10.1002/2015SW001223
McIlwain, C. E. (1961). Coordinates for Mapping the Distribution of Magnetically Trapped Particles. J. Geophys. Res. 66, 3681–3691. doi:10.1029/JZ066i011p03681
Millan, R., and Thorne, R. (2007). Review of Radiation belt Relativistic Electron Losses. J. Atmos. Solar-Terrestrial Phys. 69, 362–377. doi:10.1016/j.jastp.2006.06.019
Nossal, S. M., Mierkiewicz, E. J., and Roesler, F. L. (2012). Observed and Modeled Solar Cycle Variation in Geocoronal Hydrogen Using NRLMSISE-00 Thermosphere Conditions and the Bishop Analytic Exosphere Model. J. Geophys. Res. Space Phys. 117, 3311. doi:10.1029/2011JA017074
Oberheide, J., Pedatella, N. M., Gan, Q., Kumari, K., Burns, A. G., and Eastes, R. W. (2020). Thermospheric Composition O/N Response to an Altered Meridional Mean Circulation during Sudden Stratospheric Warmings Observed by GOLD. Geophys. Res. Lett. 47, e2019GL086313. doi:10.1029/2019GL086313
Ozhogin, P., Song, P., Tu, J., and Reinisch, B. W. (2014). Evaluating the Diffusive Equilibrium Models: Comparison with the IMAGE RPI Field-Aligned Electron Density Measurements. J. Geophys. Res. Space Phys. 119, 4400–4411. doi:10.1002/2014JA019982
Park, C. G. (1970). Whistler Observations of the Interchange of Ionization between the Ionosphere and the Protonosphere. J. Geophys. Res. 75, 4249–4260. doi:10.1029/JA075i022p04249
Picone, J. M., Emmert, J. T., and Lean, J. L. (2005). Thermospheric Densities Derived from Spacecraft Orbits: Accurate Processing of Two-Line Element Sets. J. Geophys. Res. Space Phys. 110, A03301. doi:10.1029/2004JA010585
Picone, J. M., Hedin, A. E., Drob, D. P., and Aikin, A. C. (2002). NRLMSISE-00 Empirical Model of the Atmosphere: Statistical Comparisons and Scientific Issues. J. Geophys. Res. Space Phys. 107, 1–16. doi:10.1029/2002JA009430
Pierrard, V., and Stegen, K. (2008). A Three-Dimensional Dynamic Kinetic Model of the Plasmasphere. J. Geophys. Res. Space Phys. 113, 1–15. doi:10.1029/2008JA013060
Qian, L., Burns, A. G., Solomon, S. S., Smith, A. K., McInerney, J. M., Hunt, L. A., et al. (2018). Temporal Variability of Atomic Hydrogen from the Mesopause to the Upper Thermosphere. J. Geophys. Res. Space Phys. 123, 1006–1017. doi:10.1002/2017JA024998
Qin, J., Waldrop, L., and Makela, J. J. (2017). Redistribution of H Atoms in the Upper Atmosphere during Geomagnetic Storms. J. Geophys. Res. Space Phys. 122, 10686–10693. doi:10.1002/2017JA024489
Richards, P. G., and Torr, D. G. (1985). Seasonal, Diurnal, and Solar Cyclical Variations of the Limiting H Flux in the Earth’s Topside Ionosphere. J. Geophys. Res. Space Phys. 90, 5261–5268. doi:10.1029/JA090iA06p05261
Rishbeth, H. (1998). How the Thermospheric Circulation Affects the Ionospheric F2-Layer. J. Atmos. Solar-Terrestrial Phys. 60, 1385–1402. doi:10.1016/S1364-6826(98)00062-5
Roble, R. G., and Ridley, E. C. (1994). A Thermosphere-Ionosphere-Mesosphere-Electrodynamics General Circulation Model (TIME-GCM): Equinox Solar Cycle Minimum Simulations (30–500 Km). Geophys. Res. Lett. 21, 417–420. doi:10.1029/93GL03391
Singh, N., and Horwitz, J. L. (1992). Plasmasphere Refilling: Recent Observations and Modeling. J. Geophys. Res. Space Phys. 97, 1049–1079. doi:10.1029/91JA02602
Stancil, P. C., Schultz, D. R., Kimura, M., Gu, J.-P., Hirsch, G., and Buenker, R. J. (1999). Charge Transfer in Collisions of O with H and H with O. Astron. Astrophys. Suppl. Ser. 140, 225–234. doi:10.1051/aas:1999419
Waldrop, L. S., Kudeki, E., González, S. A., Sulzer, M. P., Garcia, R., Butala, M., et al. (2006). Derivation of Neutral Oxygen Density under Charge Exchange in the Midlatitude Topside Ionosphere. J. Geophys. Res. Space Phys. 111, 1–14. doi:10.1029/2005JA011496
Wang, Y., Tu, J., and Song, P. (2015). A New Dynamic Fluid-Kinetic Model for Plasma Transport within the Plasmasphere. J. Geophys. Res. Space Phys. 120, 8486–8502. doi:10.1002/2015JA021345
Zawdie, K. A., Dhadly, M. S., McDonald, S. E., Sassi, F., Coker, C., and Drob, D. P. (2020). Day-to-day Variability of the Bottomside Ionosphere. J. Atmos. Solar-Terrestrial Phys. 205, 105299. doi:10.1016/j.jastp.2020.105299
Keywords: ionosphere, plasmasphere, thermosphere, ionosphere outflow, cold plasma, exosphere
Citation: Krall J and Huba JD (2021) The Effect of the Thermosphere on Ionosphere Outflows. Front. Astron. Space Sci. 8:712616. doi: 10.3389/fspas.2021.712616
Received: 20 May 2021; Accepted: 23 June 2021;
Published: 16 July 2021.
Edited by:
Elena Kronberg, Ludwig Maximilian University of Munich, GermanyReviewed by:
Xuguang Cai, National Center for Atmospheric Research (UCAR), United StatesDimitry Pokhotelov, German Aerospace Center (DLR), Germany
Copyright © 2021 Krall and Huba. This is an open-access article distributed under the terms of the Creative Commons Attribution License (CC BY). The use, distribution or reproduction in other forums is permitted, provided the original author(s) and the copyright owner(s) are credited and that the original publication in this journal is cited, in accordance with accepted academic practice. No use, distribution or reproduction is permitted which does not comply with these terms.
*Correspondence: J. Krall, am9uYXRoYW4ua3JhbGxAbnJsLm5hdnkubWls