 Wageesh Mishra
  Urmi Doshi
  Nandita Srivastava
 - 1Indian Institute of Astrophysics, Bengaluru, India
- 2Department of Physics, The M S University of Baroda, Vadodara, India
- 3M P Birla Institute of Fundamental Research, Bengaluru, India
- 4Udaipur Solar Observatory, Physical Research Laboratory, Udaipur, India
We attempt to understand the influence of the heliospheric state on the expansion behavior of coronal mass ejections (CMEs) and their interplanetary counterparts (ICMEs) in solar cycles 23 and 24. Our study focuses on the distributions of the radial sizes and duration of ICMEs, their sheaths, and magnetic clouds (MCs). We find that the average radial size of ICMEs (MCs) at 1 AU in cycle 24 is decreased by ∼33% (∼24%) of its value in cycle 23. This is unexpected as the reduced total pressure in cycle 24 should have allowed the ICMEs in cycle 24 to expand considerably to larger sizes at 1 AU. To understand this, we study the evolution of radial expansion speeds of CME-MC pairs between the Sun and Earth based on their remote and in situ observations. We find that radial expansion speeds of MCs at 1 AU in solar cycles 23 and 24 are only 9% and 6%, respectively, of their radial propagation speeds. Also, the fraction of radial propagation speeds as expansion speeds of CMEs close to the Sun are not considerably different for solar cycles 23 and 24. We also find a constant (0.63 ± 0.1) dimensionless expansion parameter of MCs at 1 AU for both solar cycles 23 and 24. We suggest that the reduced heliospheric pressure in cycle 24 is compensated by the reduced magnetic content inside CMEs/MCs, which did not allow the CMEs/MCs to expand enough in the later phase of their propagation. Furthermore, the average radial sizes of sheaths are the same in both cycles, which is also unexpected, given the weaker CMEs/ICMEs in cycle 24. We discuss the possible causes and consequences of our findings relevant for future studies.
1 Introduction
Coronal mass ejections (CMEs) are the episodic release of large-scale magnetized plasma structures from the Sun into the heliosphere, and they are the primary drivers of space weather events (Hundhausen et al., 1984; Zhang et al., 2007; Webb and Howard, 2012). CMEs can be remotely observed in white-light observations close to the Sun by coronagraphs and by heliospheric imagers at large distances from the Sun (Brueckner et al., 1995; Eyles et al., 2009). They have also been observed in in situ observations at a certain location and time where they are often referred to as interplanetary coronal mass ejections (ICMEs) (Gosling et al., 1990). A CME propagating with speed high enough relative to ambient solar wind medium can drive a shock ahead of it. The ambient solar wind plasma piled-up and compressed between the shock and ICME front is termed the ICME sheath (Forsyth et al., 2006). A subset of ICMEs showing flux-rope structures in the in situ observations are classified as magnetic clouds (MCs) (Burlaga et al., 2002; Marubashi and Lepping, 2007). The kinematic and morphological evolutions of different structures of ICMEs have been the focus of several studies in the last 2 decades (Schwenn, 2006; Webb and Howard, 2012; Harrison et al., 2018). However, the dynamic evolution of ICMEs under varying conditions of solar wind medium and/or preconditioned ambient medium is not yet completely understood (Temmer et al., 2011; Vršnak et al., 2013; Mishra et al., 2014; Gopalswamy et al., 2015a; Sachdeva et al., 2015).
Solar activity via episodic and quasi-steady outflows of magnetized plasma can modulate the state of the heliosphere starting close to the Sun to several AU from the Sun. The magnetic activity on the Sun varies over an almost 11 years period consisting of three phases, an ascending phase, maximum, and declining phase of solar activity, which altogether is termed a solar cycle (Wolf, 1861; Mathew et al., 2007; Pesnell, 2016). The progress of the Sun through different phases of the solar cycle and/or different cycles is manifested in sunspots number, the occurrence rate of CMEs, flares, the intensity of X-ray flux, strength of solar wind, etc., (Solanki et al., 2008; Lamy et al., 2017). The studies on understanding CMEs/ICMEs over solar cycles 23 and 24 gathered attention since it was reported that cycle 23 became extremely quiet and was in deep minimum phase for an unusually longer time (Ramesh, 2010; Janardhan et al., 2011). Solar cycle 23 began in August 1996 and ended in December 2008 with its maximum around 2002 (Joselyn et al., 1997; Temmer et al., 2006). Following the minimum of cycle 23, solar cycle 24 began in December 2008 and ended in December 2019 reaching its maximum around mid of 2014 (Pesnell, 2008; Bisoi et al., 2020). Cycle 24 is found to be weaker than the previous cycle in terms of disturbances that appeared on the solar surface and in the heliosphere (Antia and Basu, 2010; Richardson, 2013). However, several studies have confirmed that the CME rate in solar cycle 24 did not decrease as strongly as the sunspot number from the maximum of cycle 23 to the next maximum (Gopalswamy et al., 2015a; Mishra et al., 2019).
The reduction in the CMEs activity relative to sunspot number (i.e., an apparent increase in CME rate per sunspot number) in a weaker cycle 24 than that in cycle 23 has been explained using different primary and secondary factors in previous studies. Gopalswamy et al. (2015a) suggested that an apparent increased rate of halo CMEs over cycle 24 is a direct consequence of the reduced total pressure in the heliosphere which allowed the CMEs to expand considerably and appear as halos. Petrie (2015) found an increased rate of CMEs from higher latitudes since 2003 (middle of solar cycle 23) due to the weakening of polar photospheric magnetic field which allowed the eruptions from higher latitudes. A similar finding is also reported in Mishra et al. (2019). However, some studies suggested that an apparent increase in the CME rate in cycle 24 is due to some artifacts such as cadence and over-counting of narrow and faint ejections in different automated and manual CMEs catalogs (Wang and Colaninno, 2014; Lamy et al., 2017). Furthermore, a recent study by Gopalswamy et al. (2020) shows that the reduced total pressure in the heliosphere allows CMEs in cycle 24 to appear as halos at a shorter distance from the Sun and also at a lower speed than that in cycle 23. The study reveals that the increased rate of halo CMEs in cycle 24 is not due to eruption characteristics itself, but it is the effect of the weakened state of the heliosphere.
The lateral expansion of CMEs during their heliospheric journey is often measured close to the Sun using imaging observations and far from the Sun using in situ observations taken by several spacecraft at different heliocentric distances. Such an expansion of a CME is due to a faster speed of the CME leading edge compared to its trailing edge and/or the higher pressure inside the CME than that in the ambient heliospheric medium (Liu et al., 2006; Jian et al., 2008; Mishra and Srivastava, 2015). The expansion causes an increase in the sizes of ICMEs to hundreds of solar radii in interplanetary medium from a size of few solar radii in the outer corona. One way to measure radial expansion speeds (also referred as expansion speeds) is by exploiting in situ observations of the selected ICMEs by several spacecraft located at different heliocentric distances from the Sun (Good and Forsyth, 2016). The other way to understand such an expansion is to track specific ICMEs continuously from the Sun to several solar radii distances exploiting coronagraphic and heliospheric imaging observations (Davies et al., 2009; Mishra and Srivastava, 2015; Mishra and Wang, 2018). However, the continuous tracking of each individual CME in remote observations is cumbersome and extremely difficult to mark the leading and trailing edges of the ICMEs structures (Howard and DeForest, 2012; DeForest et al., 2013). On the other hand, it is also rare to observe the same ICME from multiple widely separated in situ spacecraft at different distances from the Sun (Reisenfeld et al., 2003). Apart from the aforementioned approaches, one can study the radial expansion, radial sizes, and duration of ICMEs using a statistical approach (Liu et al., 2006). In this approach, the properties of ICMEs/ambient medium estimated over a large number of events/intervals are assumed to represent the dominant properties of an individual case/local medium.
The study of evolution characteristics of ICMEs is of great significance and is one of the challenging problems in heliospheric physics. In fact, the expansion behavior of ICMEs is responsible for the dilution of magnetic and heat content inside the CMEs (Gopalswamy et al., 2014; Mishra and Wang, 2018). The more rapid dilution of density and magnetic field in ICMEs than the solar wind can be modeled taking into account the expansion of ICMEs (Wang and Richardson, 2004). The different expansion rates of ICMEs can lead to different rates of change in plasma parameters inside and outside ICMEs. In addition to the expansion effect, Li et al. (2017) have shown that the magnetic strength inside ICMEs decreases more for the regions which are rich in Alfvénic fluctuations (AF) than that for the AF-lacking region. Earlier studies have shown that the distribution, evolution, and dissipation of AF inside ICMEs can help in probing the thermodynamic evolution of ICMEs during their propagation (Liu et al., 2006; Li et al., 2017). The difference in the time interval for which solar wind and ICME material are observed at larger distances from the Sun may depend on the expansion rate of ICMEs as well as the phase of the solar cycle. The physical state of the heliosphere influences the expansion behavior of ICMEs which in turn also affects their dimensional (radial sizes and duration) and geoeffective characteristics (Liu et al., 2006; Démoulin et al., 2016; Shen et al., 2017). The dimensional properties of both ICMEs and sheaths have been studied for the events observed near the Earth during solar cycle 23 (Zhang et al., 2008; Guo et al., 2010). In their study, the number of selected ICMEs was limited to ICMEs which gave rise to major geomagnetic storms. Kilpua et al. (2014) have found that ICMEs in minima and rising phase of cycle 24 are less geoeffective due to the lack of strong and long duration ICMEs. The study of mean magnetic field, proton temperature, speed, and duration of sheaths and ICMEs during cycle 23 is also discussed in Mitsakou and Moussas (2014). Recently, based on the statistical studies of ICMEs during the declining phase of cycles 23 and 24, Lawrance et al. (2020) have shown that the correlation between the ICMEs/sheaths sizes and storm strength is insignificant.
Thus, the earlier studies have focused on only a limited number of ICMEs due to the selection of either a particular cycle or a particular phase of either cycle, only geoeffective ICMEs, and/or only a particular feature (i.e., ICME, sheath, shock) of ICMEs. In this context, it would be an obvious next step to understand and compare the dimensional properties of different features of all the ICMEs identified at 1 AU during complete cycles of 23 and 24. It is known that ICMEs with different speeds may interact with ambient medium differently at different heliocentric distances (Manoharan, 2006; Sachdeva et al., 2015). This implies that some ICMEs may expand sufficiently close to the Sun itself while some ICMEs probably continue to expand upto larger distances from the Sun. Therefore, our study on ICMEs evolving into different heliospheric conditions over cycles 23 and 24 would provide insight into relative sizes of ICMEs and their expansion behavior.
Since the heliospheric state is found to change significantly over solar cycle 24, the expansion behavior of ICMEs in cycle 24 is expected to be different from those in the previous cycle 23. The relative distribution of ICMEs, sheaths of ICME, and MCs into different bins of radial sizes, duration, and speeds gives important information about their heliospheric evolution. In the present study, our focus is to estimate as well as compare the distribution of dimensional properties of Earth-arriving ICMEs and MCs over the last two solar cycles 23 and 24. Furthermore, we attempt to study the evolution of radial expansion speeds between the Sun and Earth for the associated CME-MC pairs to interpret their observed dimensional properties at 1 AU over both cycles. The selection of ICMEs/MCs from available in situ observations and the methodology of our approach are given in Section 2. The analysis and derived results are explained in Section 3 followed by the summary and discussion in Section 4.
2 Observations and Methodology
Our study focuses on understanding the duration and radial sizes of ICMEs at 1 AU near the Earth during solar cycles 23 and 24. The ICMEs have been routinely observed near the Earth by the in situ spacecraft Wind and Advanced Composition Explorer (ACE) (Ogilvie et al., 1995; Stone et al., 1998). However, the identification of ICMEs is based on several signatures, and there is often the situation that all of the signatures are not present in an individual ICME. Furthermore, even if several signatures are detected in an ICME, it is possible that the duration of these signatures is not the same, and also they are not coincident (Zurbuchen and Richardson, 2006). Therefore, the identification of ICMEs in the in situ observations is not straightforward. Due to this reason, different groups of researchers have considered some signatures as the primary and others as secondary identifiers of the ICMEs which resulted in several publicly available ICME catalogs (Richardson et al., 2000; Chi et al., 2016; Nieves-Chinchilla et al., 2018). Although these catalogs are broadly similar, differences in terms of the number of events, exact boundaries of ejecta have been noticed, due to subjective judgment in the identification of ICMEs. In the present study, we selected ICME catalog of Richardson and Cane (Richardson and Cane, 2010) (hereafter called RC catalog) (http://www.srl.caltech.edu/ACE/ASC/DATA/level3/icmetable2.htm), which has been extensively used in the literature (Zhang et al., 2007; Richardson, 2013; Li et al., 2018; Mishra et al., 2019). We find that the total number of ICMEs at 1 AU near the Earth is 520 during 1996 and 2019. There are 314 ICMEs listed in the catalog during 1996 and 2008 under solar cycle 23 while there are 206 ICMEs during 2009 and 2019 under solar cycle 24. Earlier studies have also found that ICME rate during cycle 24 decreased by 40% to that of the previous cycle except during the maximum of cycle 24 when it was the same as that in the cycle 23 (Li et al., 2018; Mishra et al., 2019).
The sizes of ICMEs are important to study as they can affect the performance and accuracy of several arrival time prediction methods. The ICMEs expand continuously during their heliospheric journey as they tend to achieve equilibrium with the surrounding solar wind plasma. Therefore, the radial sizes and duration of ICMEs are dictated by the expansion history of the ICMEs. Since the expansion speed of ICMEs is of the order of local Alfvén speed in the heliosphere (Jian et al., 2008), one can gain knowledge about the state of the heliosphere from their sizes at 1 AU. We attempt to understand the radial expansion speeds of ICMEs by comparing their dimensional properties, i.e., duration and radial sizes, in solar cycles 23 and 24. We estimate the radial size of each ICME by first estimating the time difference between the arrival of ICME leading and trailing edges, and then taking a product of this time difference with the average speed of the ICME. A similar approach has been followed in earlier studies (Mitsakou and Moussas, 2014; Lawrance et al., 2020). Other approaches involve integrating the solar wind speed with time during ICME passage through the spacecraft (Zhang et al., 2008; Jian et al., 2018). The start and end times of ICMEs leading and trailing boundaries, as listed in RC catalog, are based primarily on plasma and magnetic field observations. Importantly, the signatures of abnormally low proton temperatures are used for identifying ICMEs (Richardson and Cane, 1995). Such low-temperature plasma is identified by comparing, point by point, the in situ observed proton temperature (Tp) with the typical “expected” temperature (Tex) found for solar wind with the speed (Vsw) (Neugebauer et al., 2003). The ICME boundaries are identified for the interval of solar wind having Tp/Tex < 0.5 (Richardson and Cane, 1995). The arrival of shock and/or sheath region is based on the increase in the solar wind speed, magnetic field strength, and density followed by the interval of turbulent plasma ahead of ICME (Kilpua et al., 2017).
Besides estimating the sizes and duration of sheaths and ICMEs individually, we have also studied the sizes and duration of compressed sheaths region preceding an ICME and following a CME-driven shock wave (Forsyth et al., 2006). However, sometimes there may be neither a shock wave nor a sheath region preceding an ICME (Kilpua et al., 2017). We note that ∼16% and ∼26% of the total number of ICMEs in cycles 23 and 24, respectively, have no sheath region ahead of them. Such events are not excluded from the chosen sample as it would be interesting to note the relative influence of such cases in the distribution of duration and radial sizes of the sheaths and ICMEs in both solar cycles 23 and 24. The duration of sheaths and their radial sizes are estimated in the same way as it is done for ICMEs. In addition to studying the region of sheaths and ICMEs individually, we also estimate the duration and radial sizes of the entire ejecta combining the sheaths and the ICMEs.
Furthermore, our analysis includes the magnetic clouds (MCs) which are a subset of ICMEs identified to have flux-ropes structures in the in situ observations. Earlier studies have shown that the geometrical selection effect is responsible for the absence of flux-rope structures in about two-thirds of the total number of ICMEs observed in situ at 1 AU (Riley et al., 2006; Chi et al., 2016). The flux-rope structures are not detected in the in situ observations if the in situ spacecraft passes through the flank of ICMEs. Thus, in situ spacecraft can observe different features of ICMEs depending on their trajectory along a different part of ICMEs. The radial sizes, duration, and expansion speeds of MCs are expected to be different than that of ICMEs (Marubashi and Lepping, 2007; Li et al., 2018). Therefore, it is important to study the dimensional properties of MCs and compare them with that of ICMEs over solar cycles 23 and 24.
We use the list of MCs compiled by Gopalswamy et al. (2015b) which includes the MCs observed during 1996–2015 covering solar cycle 23 and half of cycle 24. For including the list of MCs observed after 2015, we have analyzed the in situ observations of ICMEs listed in the RC catalog to examine if the ICMEs satisfy the criteria of MCs defined by Burlaga et al. (1981). These include the signatures of the enhanced magnetic field, plasma β less than unity, and smooth rotation of magnetic field vector to characterize the ICMEs as MCs. We find that the number of MCs identified at 1 AU in solar cycles 23 and 24 is 107 and 94, respectively. These numbers of MCs are ∼34% and ∼45% of the total number of ICMEs in cycles 23 and 24.
To understand the measured radial sizes of all the ICMEs in terms of expansion, we compare the expansion speeds of CMEs close to the Sun and that of MCs at 1 AU. Our plan to estimate the radial expansion speeds is limited for only MCs because they suffer the least from the geometric selection effect in the in situ observations. The in situ measured expansion speeds over large ICMEs sample would have been underestimated differently depending on the extent of leg-flanks encounter by the in situ spacecraft, i.e., how far from the nose of the ICME does the spacecraft intercepts the ICME structure. We assume that the distribution of radial expansion speeds of MCs over both cycles, and our interpretation based on this, would also be valid for ICMEs over both cycles. For examining the evolution of expansion speeds between Sun and Earth, only those MCs are selected for which a clear association of their solar sources (CMEs) is established. Such associated CME and MC pairs over solar cycles 23 and 24 are expected to mimic the behavior of CME-ICME pairs in general.
We estimate the average radial propagation and expansion speeds for all the identified CME and MC pairs. We approximate the CME shape by a full ice-cream cone, with its curved-front base representing the CME leading edge and apex of the cone subtends a cone angle at the center of the Sun (Xie et al., 2004). We first determine the half-cone angular widths of selected CMEs using the established empirical relations between cone angular widths (W) and projected speeds (V) of CMEs as W = 0.11V + 24.3 for solar cycle 23 and W = 0.16V + 24.6 for solar cycle 24 (Gopalswamy et al., 2014). The projected speeds of CMEs are taken from CDAW catalog (Yashiro et al., 2004) based on Spectrometric COronagraph (LASCO) observations onboard Solar and Heliospheric Observatory (SOHO) (Brueckner et al., 1995). Furthermore, following equation (1) in Gopalswamy et al. (2010), i.e., Vrad = ( cos ω + sin ω)V/(cos ω cos θ + sin ω), we derive the radial propagation speeds (also referred as radial speeds) of CMEs (Vrad) using their projected speeds (V), half angular widths (ω), and direction of propagation (θ) which is assumed to be 90° from the plane of the sky for the Earth-directed CMEs associated with MCs. Finally, the near-Sun lateral expansion speeds (Vexp) of the CMEs are calculated using their half-cone angular widths and radial propagation speeds relationship as expressed in equation (5) of Gopalswamy et al. (2009), i.e., Vrad = (1/2) (1 + cot ω)Vexp. The radial expansion speeds of MCs are calculated taking half of the difference between the propagation speeds at the leading and trailing edges of MCs observed in the in situ observations (Owens et al., 2005).
The average speeds of MCs passing the near-Earth in situ spacecraft are taken as their radial propagation speeds at 1 AU. Our approach to understand the evolution of propagation and expansion speeds of CME/MCs is based on only two-point measurements, one close to the Sun and the other close to the Earth. Using the above-mentioned formula of Gopalswamy et al. (2009), we can estimate lateral expansion speeds of CMEs close to the Sun but not their radial expansion speeds. We assume that CMEs observed in the coronagraphic field of view reveal a self-similar expansion which implies that the radial and lateral expansions increase at the same rate (Schwenn et al., 2005). Therefore, we use lateral expansion speeds of CMEs as a proxy of their radial expansion speeds close to the Sun. However, some studies on CME and cavity evolution in high-cadence EUV imagery have reported fast lateral expansion of CMEs low in the corona (Patsourakos et al., 2010). In the present study, for comparing the expansion of associated CME-MC pairs, we have taken the lateral expansion of CMEs while the radial expansion speeds of MCs. The distribution of relative values of radial expansion speeds with respect to radial propagation speeds of associated CME and MC pairs over solar cycles 23 and 24 is examined to estimate the duration and radial sizes of ICMEs in both cycles.
3 Analysis and Results
3.1 Duration of ICMEs, Sheaths, and ICMEs Combined With Sheaths
The duration of an ICME structure at 1 AU can be a proxy for its radial expansion history in the interplanetary medium before reaching the Earth. Furthermore, the duration of ICMEs and their sheaths can provide information about the state of the heliosphere. Estimation of these durations at 1 AU is important to know as it is the interval in which Earth’s magnetosphere is likely to experience large perturbation responsible for geomagnetic storms (Zhang et al., 2008). The distributions of a fraction of ICMEs number with different duration of ICMEs, sheaths region, and entire transient (i.e., combined sheaths and ICMEs) region are shown in Figure 1 for both solar cycles 23 and 24.
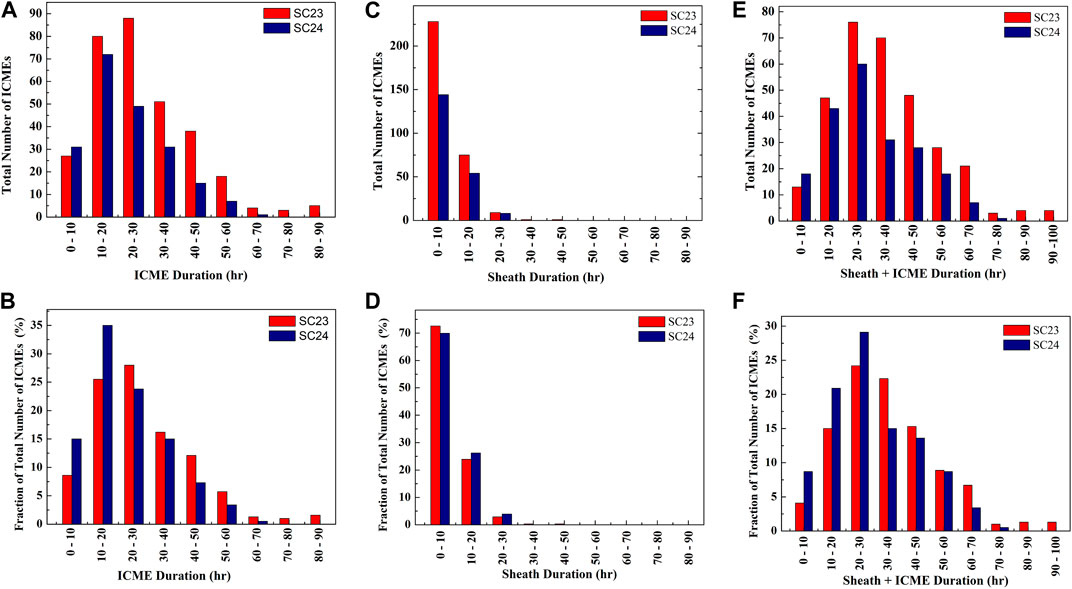
FIGURE 1. The distributions of duration of ICME structures, i.e., ICMEs, sheath region preceding ICMEs, and ICMEs together with sheath (i.e., entire transients) are shown in (A),(B), (C),(D), and (E),(F), respectively, for both solar cycles 23 and 24. (A),(C),(E) and (B),(D),(F) show the distributions for the total number of ICMEs and the percentage fraction of the total number of ICMEs in each bin of duration, respectively.
To examine the statistical significance of the differences in the duration of ICMEs over cycles 23 and 24, we performed the two-sample Kolmogorov-Smirnov (KS) test. The KS test is a nonparametric test that can compare two samples and determine whether or not the two samples are from the same distribution at a given confidence level, i.e., p-value. The test computes a KS statistic (D) which is the maximum distance between the empirical cumulative distribution functions of two samples. The two samples are considered to come from different distributions if the value of the KS statistic (D) is larger than the computed critical values (Dc). The critical value Dc can be computed at different p-value using the number of data points (i.e., sizes) of the first and second samples. It means for D > Dc, the null hypothesis that the two samples are drawn from the same distribution is rejected. For example, the number of ICMEs in solar cycles 23 and 24 is 314 and 206, respectively, i.e., m = 314 and n = 206, and this gives Dc = 0.146 at p = 0.01. The value of KS statistic D = 0.159 is found for the two samples of the duration of ICMEs, taking each sample for solar cycles 23 and 24. It is clear that D > Dc which implies that the duration of ICMEs is different in cycles 23 and 24 with a 99% confidence level. This suggests that there remains only a very small probability of 1% that the difference between the two distributions of CMEs duration could have occurred just by random chance. However, we compute Dc = 0.175 at p = 0.001, and in this case, D < Dc, which implies that at the confidence level of 99.9%, the duration of ICMEs is not different in cycles 23 and 24. The minimum confidence level of 95% is often accepted in ICMEs research, and we will consider the same in concluding the findings from the two-sample KS test (Gopalswamy et al., 2015b).
We note that the duration of ICMEs identified at 1 AU over solar cycle 23 ranges between 3 and 90 h with an average of 28.8 h. The median of ICME duration is 26 h implying that half of the observed events last longer than 26 h, and half of all the events have a duration below 26 h. To understand the degree of dispersion in the sample of ICMEs duration, we note that the standard deviation is around 16.2 h. From Figure 1, we clearly see that the distribution of ICMEs duration peaks at 20–30 h having ∼28% (88 events) of the total number of ICMEs. We also note that there are around ∼16% (51 events) of the total number of ICMEs which have the duration within 30–40 h and ∼25% (80 events) of ICMEs with the duration within 10–20 h. On the other hand, in solar cycle 24, the duration of ICMEs ranges between 3 and 63 h with an average of 23.3 h. The median and standard deviation for ICMEs duration in cycle 24 are 20.5 and 13 h, respectively. A major fraction of ∼35% (72 events) of the total number of ICMEs in cycle 24 has a duration within 10–20 h. In addition to this, there are ∼24% (49 events) of events having duration within 20–30 h and 15% (31 events) corresponding to the duration within 10 h.
On comparing cycles 23 and 24, we note that the average duration of an ICME in cycle 24 is decreased by 19% of that in the previous cycle. Although the distribution for both the cycles is skewed right in the direction of longer duration values (i.e., positively skewed), the degree of skewness is stronger for cycle 23. We further note that ∼10% (30 events) of ICMEs in cycle 23 have a duration larger than 50 h while only ∼4% (8 events) of such ICMEs are present during cycle 24. Furthermore, the fractions of the total number of ICMEs over cycles 23 and 24 having a duration shorter (longer) than 20 h are ∼34% (66%) and ∼50% (50%), respectively. This suggests that the fraction of the total number of ICMEs in cycle 24 with larger duration decreased. The shorter duration of ICMEs in cycle 24 was attributed as a reason for their weaker geoeffectiveness (Kilpua et al., 2014).
The shorter duration of ICMEs at 1 AU may result either due to their smaller sizes or larger mean speeds which is defined as the radial propagation speed averaged over the entire duration of ICME. However, the mean ICME propagation speed at 1 AU in cycle 23 is 475 km s−1 which decreased by ∼12% of its value to 420 km s−1 in cycle 24. The ranges of speeds in cycles 23 and 24 are 290–1,300 km s−1 and 270–680 km s−1, respectively. Assuming that the total pressure is reduced in ICMEs and heliosphere in cycle 24 (Gopalswamy et al., 2015b), the possibility of smaller duration of ICMEs can be due to reduced ICME internal total pressure which may play a dominant role in governing the radial expansion/sizes of the ICMEs. This will be discussed in Section 4 following the analysis of ICME sizes in Section 3.2.
The sheath regions of ICMEs are known to contribute ∼30% of energy input in the magnetosphere during major geomagnetic storms (Zhang et al., 2008), and therefore, it is of interest as well. The value of KS statistic D = 0.099 is found for the two samples of the duration of sheaths, taking each sample for solar cycles 23 and 24. However, we compute Dc = 0.122 at p = 0.05, and in this case, D < Dc, which implies that at the confidence level of 95%, the duration of sheaths is not different in cycles 23 and 24. The duration of ICME sheaths in cycle 23 ranges from 0 to 43 h with an average value of 7 h. The median and standard deviation of the duration are 5.5 and 6.6 h, respectively. The distribution of sheaths duration peaks at 0–10 h having ∼73% (228 events) of the total number of ICMEs. We further note that there are around ∼24% (75 events) of the total number of ICMEs which have sheaths duration within 10–20 h and less than 1% (2 events) has sheaths duration larger than 30 h. However, the sheath duration for solar cycle 24 ranges from 0 to 28.5 h with an average value of 7 h. The median and standard deviation are noted to be 6 and 6.7 h, respectively. The distribution of sheaths duration for ICMEs in cycle 24 peaks at 0–10 h for ∼69% (143 events) of the total number of events while only ∼26% (54 events) of events have sheaths duration within 10–20 h.
Our analysis shows that ∼16% (49 events) and ∼25% (52) of the total number of ICMEs in solar cycles 23 and 24, respectively, have no sheath region, i.e., sheath duration is 0 h for these events. Interestingly, the distribution of sheath duration for ICMEs in cycle 23 is almost the same as in cycle 24, with only 2% smaller for the binning duration of 10–20 h and 4% larger for the duration bin of 0–10 h. A similar duration of sheaths for both the cycles is unexpected as ICMEs in cycle 24 were found to be slower and less geoeffective at 1 AU (Shen et al., 2017). If the sheaths ahead of ICMEs measured at 1 AU are a long-term effect during their complete journey, it is possible that both faster and slower ICMEs tending towards equalizing their speed to solar wind accumulate an equal amount of upstream solar wind plasma. This is consistent with recent studies of Salman et al. (2020a,b) who found that radial thickness of sheaths has no clear dependence on the initial speeds, measured in situ speeds, and associated Mach numbers of the CMEs. This suggests that accumulation of the solar wind is the dominant mechanism deciding the sizes of the sheaths at 1 AU rather than the compression which should depend on CME speed or shock Mach number (Russell and Mulligan, 2002). Also, Temmer et al. (2021) found that the sheath density does not depend on the CME propagation speed but rather depends on the ambient density and solar wind flow speed in the interplanetary space ahead of the CME. They suggested that the sheath region consists of piled-up ambient solar wind material and its magnitude is partially decided by the size of the CME. The discussion over different parameters dictating the duration and size of sheath at 1 AU is detailed in Section 4.
The energy transfer efficiency for sheaths and ICMEs is comparable, and their contribution to geomagnetic storms is decided by the relative duration of sheaths and ICMEs (Guo et al., 2010). The value of KS statistic D = 0.163 is found for the two samples of the duration of entire region of ICMEs, taking each sample for solar cycles 23 and 24. We compute Dc = 0.146 at p = 0.01, and in this case, D > Dc, which implies that at the confidence level of 99%, the duration of entire region of sheaths combined with ICMEs structure is different in cycles 23 and 24. The total duration of the entire region of sheaths combined with ICMEs structure over solar cycle 23 ranges from as low as 5 h to as high as 99.8 h with an average value of 35.8 h. The median and standard deviation of the duration are 33 and 17.6 h, respectively. From Figure 1, we see that the distribution of duration of combined regions of sheaths and ICMEs peaks at 20–30 h having ∼24% (76 events) of the total number of ICMEs. We further note that there are around ∼22% (70 events) of the total number of ICMEs which have a duration ranging between 30 and 40 h and ∼15% (47 events) of ICMEs with the duration within 10–20 h.
The distribution for cycle 23 shows a much wider peak than that for only ICME duration. In contrast, the duration for combined sheaths and ICMEs range for solar cycle 24 varies from 5 to 72 h with an average of 30.3 h. The median and standard deviation of the duration are 27.6 and 15.6 h, respectively. The distribution for cycle 24 peaks at 20–30 h having ∼29% (60 events) of the total number of ICMEs. In addition, ∼15% (31 events) of the total number of ICMEs have a duration ranging between 30 and 40 h and ∼21% (43 events) of ICMEs with a duration ranging between 10 and 20 h. The fractions of the total number of ICMEs over cycles 23 and 24 having a duration shorter (longer) than 30 h are ∼43% (57%) and ∼58% (42%), respectively. This suggests that the fraction of events in cycle 24 having a duration shorter (longer) than 30 h is increased (decreased) by ∼10% of its value in cycle 23. Since the duration of sheaths is equal in both cycles, the reason for shorter duration of ICMEs in cycle 24 will also hold good for the entire transients combining sheaths and ICMEs.
3.2 Radial Size of Interplanetary Coronal Mass Ejections, Sheath, and Entire ICMEs
We investigate the radial sizes of ICMEs, sheaths, and entire transients over solar cycles 23 and 24. The range, average, median, and standard deviation of the radial sizes of ICMEs over solar cycles 23 and 24 are noted in Table 1. The value of KS statistic D = 0.247 is found for the two samples of the radial sizes of ICMEs, taking each sample for solar cycles 23 and 24. We compute Dc = 0.175 at p = 0.001, and in this case, D > Dc, which implies that at the confidence level of 99.9%, the radial sizes of ICMEs are different in cycles 23 and 24. The average radial sizes of ICMEs in cycle 23 are 0.33 AU which decreased by 33% in cycle 24. From Figure 2, we see that the distribution of radial sizes for cycle 23 peaks at 0.1 to 0.2 AU having ∼23% (73 events) of the total number of ICMEs. However, the distribution peak for solar cycle 24 is within 0.1 AU having ∼34% (70 events) of the total number of ICMEs. For both cycles 23 and 24, the fraction of the total number of ICMEs corresponding to adjacent larger and smaller radial sizes than the distribution peak is also noted in Table 1. In addition to the distribution peak in cycle 23, there are ∼23% (72 events) of the total number of ICMEs which have radial sizes within 0.2–0.3 AU while ∼18% (56 events) of total ICMEs have radial sizes within 0.1 AU. However for cycle 24, in addition to the distribution peak, there are ∼29% (59 events) of cases having radial sizes within 0.1–0.2 AU.
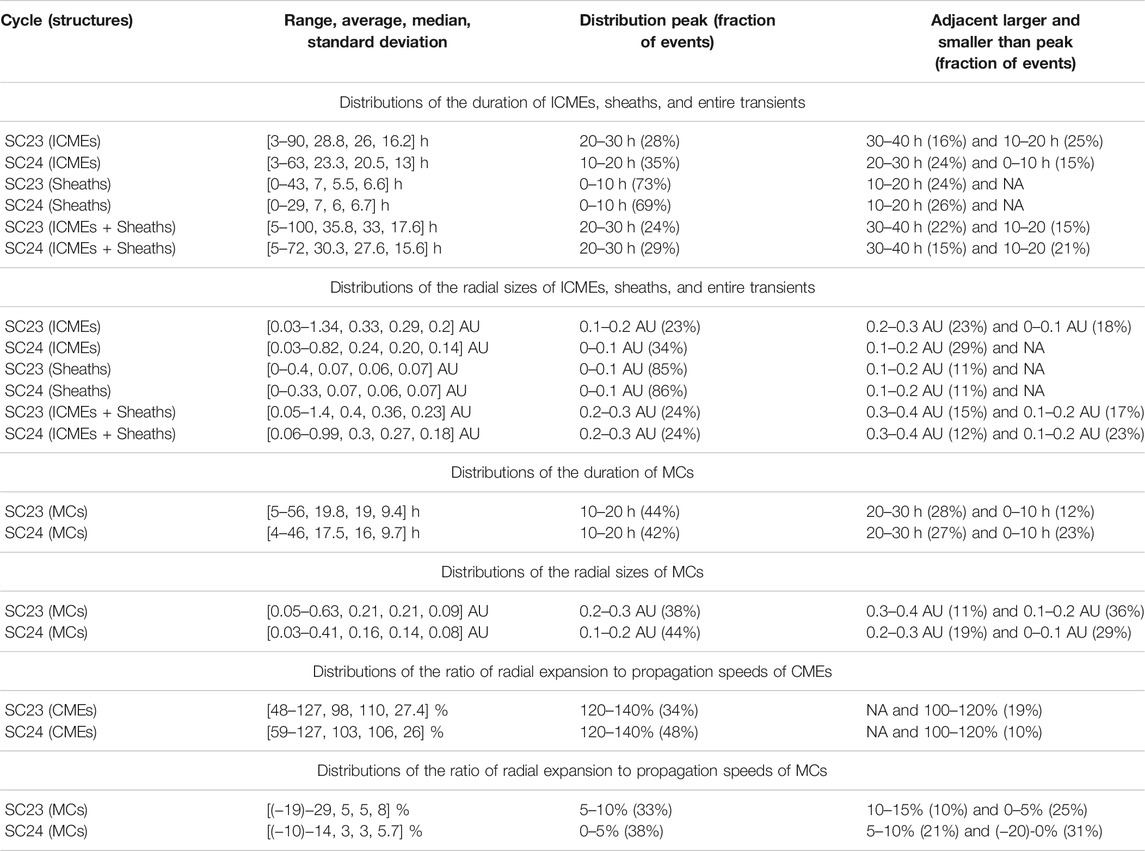
TABLE 1. The statistics of distributions of duration and radial sizes of different ICMEs structures at 1 AU for solar cycles 23 and 24 are listed. From the top: the distribution of the duration of ICMEs, sheaths, and entire transients (first panel); the radial sizes of ICMEs, sheaths, and entire transients (second panel); the duration of MCs (third panel); and the radial sizes of MCs (fourth panel). The ratio of radial expansion to radial propagation speeds of associated CMEs near the Sun and MCs at 1 AU is in the fifth and sixth panels, respectively. From the left: the solar cycle and structures (first column); the range, average, median, and standard deviation (second column); peak of the distribution having fraction of total number of events (third column); adjacent larger and smaller than the distribution peak having fraction of total number of events (fourth column).
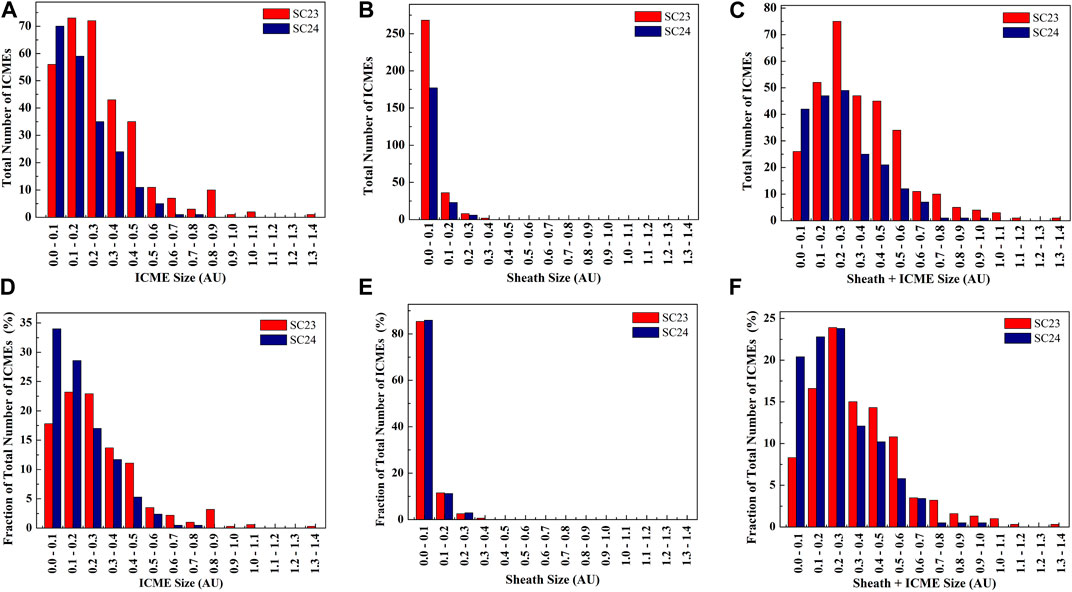
FIGURE 2. The distributions of the radial sizes of ICMEs region, sheaths region preceding ICMEs, and the entire region of ICMEs together with sheaths (i.e., entire transients) for solar cycles 23 and 24 are shown. (A),(B),(C) and (D),(E),(F) show the distributions for the total number of ICMEs and the percentage fraction of the total number of ICMEs in each bin of duration, respectively.
The distribution of radial sizes for both cycles is positively skewed, and the degree of skewness is stronger for cycle 23. The fractions of the total number of ICMEs over cycles 23 and 24 having radial sizes smaller (larger) than 0.2 AU are ∼41% (59%) and ∼63% (37%), respectively. The smaller fraction of the total number of ICMEs in cycle 24 at increasing radial sizes suggests that the sizes of ICMEs were relatively smaller than that in cycle 23. Earlier studies have confirmed the reduced heliospheric pressure in cycle 24 than that in previous cycle (Gopalswamy et al., 2020), and such reduced pressure should have allowed the CMEs to expand to larger sizes at 1 AU. Also, the anomalous lateral expansion of CMEs close to the Sun was confirmed by Gopalswamy et al. (2014). The possible reasons for smaller radial sizes of ICMEs in cycle 24 despite their propagation through the reduced pressure in the ambient medium will be discussed in Section 4. It is possible that ICMEs of cycle 23 are expanding at faster rate which does not cease even at larger distances from the Sun in contrast to ICMEs of cycle 24. We will also discuss our findings in comparison with earlier studies (Mitsakou and Moussas, 2014; Jian et al., 2018) on different chosen samples of ICMEs at 1 AU during different phases of cycles 23 and 24.
The range, average, median, and standard deviation of radial sizes of sheaths region of ICMEs in cycles 23 and 24 are listed in Table 1. The value of KS statistic D = 0.116 is found for the two samples of radial sizes of sheaths, taking each sample for solar cycles 23 and 24. We compute Dc = 0.122 at p = 0.05, and in this case, D < Dc, which implies that at the confidence level of 95%, the radial sizes of sheaths are not different in cycles 23 and 24. The distribution peak of sheaths radial sizes and the adjacent larger than the distribution peak is almost the same for both the cycles as shown in Figure 1. The distribution peak is within 0.1 AU for 85 and 86% for the total number of ICMEs in cycles 23 and 24, respectively. This suggests an equal degree of pile-up compression of the ambient medium, i.e., sheath accumulation region, ahead of ICMEs front. However, this is not expected as there are differences in the ICMEs speeds, sizes, and pressure in background solar wind medium between cycles 23 and 24 which should have resulted in a different rate of compression and lateral deflection of ambient medium plasma around the leading edge of ICMEs (Siscoe and Odstrcil, 2008).
The distribution of radial sizes of the entire transients, i.e., ICMEs combined with sheaths, is shown in the right panel of Figure 2 for both the cycles. The value of KS statistic D = 0.248 is found for the two samples of the radial sizes of entire region of ICMEs, taking each sample for solar cycles 23 and 24. We compute Dc = 0.175 at p = 0.001, and in this case, D > Dc, which implies that at the confidence level of 99.9%, the radial sizes of entire transient are different in cycles 23 and 24. The distribution for entire transients is slightly wider at peak than that for only ICMEs. The radial sizes at distribution peak, larger and smaller radial sizes than the peak with their corresponding fraction of the total number of events are listed in Table 1. The average radial size of the entire transients is 0.4 AU in cycle 23 which decreased by ∼25% in cycle 24. The distribution of radial sizes of combined regions of sheaths and ICMEs peaks in the range 0.2–0.3 AU having ∼24% of the total number of ICMEs in both cycles. We note that there are ∼15% (47 events) and ∼17% (52 events) of the total number of ICMEs in cycle 23 having radial sizes within 0.3–0.4 AU and 0.1-0.2 AU respectively. However, for cycle 24, there are ∼12% (25 events) of the total number of ICMEs having radial sizes within 0.3–0.4 and ∼23% (43 events) of ICMEs with sizes within 0.1–0.2 AU. We also note that the fractions of the total number of ICMEs over cycles 23 and 24 having radial sizes smaller (larger) than 0.3 AU are ∼49% (51%) and ∼67% (33%), respectively. It is obvious that the fraction of events in cycle 24 having radial sizes smaller (larger) than 0.3 AU is increased (decreased) by ∼18% of its value in cycle 23 highlighting relatively larger sizes of transients in cycle 23.
3.3 Radial Sizes and Duration of Magnetic Clouds
The number of magnetic clouds (MCs) observed at 1 AU in solar cycles 23 and 24 is 107 and 94, respectively. These numbers of MCs are ∼34% and ∼45% of the total number of ICMEs in cycles 23 and 24. The abundance of MCs in cycle 23 is in agreement with earlier studies that MCs are about one-third of the total number of ICMEs (Richardson and Cane, 2010; Chi et al., 2016). However, there are more MCs per ICME in cycle 24 despite it was weaker in terms of sunspot number than cycle 23. The distribution of duration and radial sizes of MCs during both cycles are shown in Figure 3. For the samples of MCs in both cycles, the value of KS statistic D = 0.143 is found for the two samples of the duration of MCs, taking each sample for solar cycles 23 and 24. We compute Dc = 0.192 at p = 0.05, and in this case, D < Dc, which implies that at the confidence level of 95%, the duration of MCs is not different in cycles 23 and 24. But, for the two samples of the radial sizes of MCs, taking each sample for solar cycles 23 and 24, D = 0.269. The value of Dc = 0.230 at p = 0.01, therefore, we find D > Dc for the radial sizes. This implies that at the confidence level of 99%, the radial sizes of MCs are different in cycles 23 and 24.
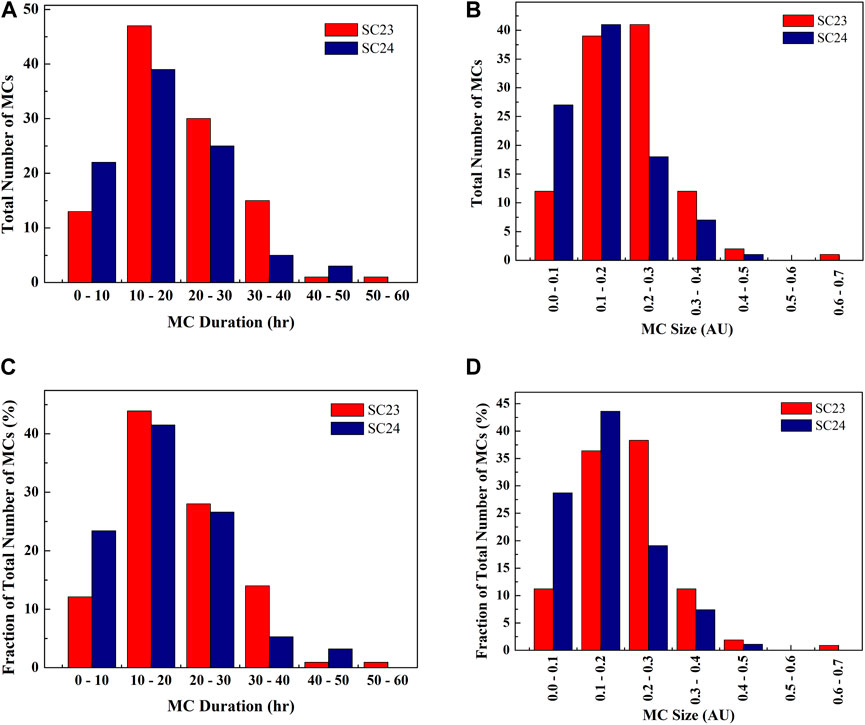
FIGURE 3. The distributions of the duration and radial sizes of MCs for solar cycles 23 and 24 are shown. (A),(B) and (C),(D) show the distributions for the total number of MCs and the percentage fraction of the total number of MCs in each bin, respectively.
For the distribution of duration and radial sizes, the range, average, median, and standard deviation for MCs observed in both cycles are listed in Table 1. We note that the average duration of MCs in cycle 23 is 19.8 h, and it decreased by ∼12% in cycle 24. The average size of MCs in cycle 23 is 0.21 AU, and it decreased by ∼24% in cycle 24. This implies that average speed of MCs at 1 AU in solar cycle 24 should have decreased by ∼14% of that in the earlier cycle. From the in situ observations, we confirm that average speed of MCs in cycle 23 is 470 km s−1 which decreased by ∼16% in cycle 24. However, the range of mean speeds is 315–1,315 km s−1 and 270–580 km s−1 for cycles 23 and 24, respectively. The smaller sizes of MCs in cycle 24 than in cycle 23 could also be due to diminished magnetic content inside MCs of cycle 24 which is also responsible for their reduced geoeffectiveness (Kilpua et al., 2014). The study by Gopalswamy et al. (2015b) found that the total pressure inside MCs of cycle 24 dropped by 41%, very similar to the drop in the ambient pressure by 38%, of its value in cycle 23. Lugaz et al. (2017) found that the average threshold of CME speed to drive a shock was lower in solar cycle 24 than that in solar cycle 23. Despite this, they found that the percentage of CMEs with shocks was the same for both cycles 23 and 24. The decrease in expected frequency shocks in cycle 24 was explained in terms of the slower expansion speed of CMEs in solar cycle 24 (Lugaz et al., 2017).
Although it has been confirmed that the total pressure in the heliosphere at 1 AU in cycle 24 is reduced by ∼38% of its value in cycle 23 (Gopalswamy et al., 2015b), the reduced sizes of MCs in cycle 24 by ∼24% of its value in cycle 23 are possible if the weakened ambient pressure in cycle 24 did not play a dominant role in shaping the radial expansion of MCs, especially during the later phase of their propagation. However, the possibility that the flux-ropes of cycle 24 were smaller in the beginning itself near the Sun cannot be ignored completely. The average duration of MCs in cycles 23 and 24 has decreased by ∼25% of that for the ICMEs in the same cycle. The average radial sizes of MCs in cycles 23 and 24 have decreased by ∼36% and ∼33%, respectively, of that for the ICMEs in the same cycle. The smaller radial sizes and duration of MCs than non-MCs ICMEs, in both cycles, can arise due to the geometric selection effect, i.e., ICMEs nose pass through the observing spacecraft, and higher magnetic erosion of MCs in solar wind medium.
From Figure 3, we note that the distribution of duration of MCs for cycle 23 peaks at 10–20 h having ∼44% (47 events) of the total number of MCs. The adjacent larger and smaller durations than distribution peak have ∼28% (30 events) and ∼12% (13 events) of the total number of MCs. The distribution for cycle 24 also peaks at the same 10–20 h with ∼42% (39 events) of the total number of MCs, and the adjacent larger and smaller duration than distribution peak have ∼27% 25) and ∼23% (22 events) of the total number of MCs. The distribution peak of the duration of MCs has shifted towards a shorter duration having a larger fraction of events than that for ICMEs. The distribution peak of radial sizes for cycle 24 peaks at 0.1 to 0.2 AU having ∼44% (41 events) of the total number of MCs while for cycle 23, it peaks at 0.2 to 0.3 AU having ∼38% (41 events) of the total number of MCs.
We also note that the adjacent larger and smaller radial sizes than the distribution peak of radial sizes for cycle 23 have ∼11% (12 events) and ∼36% (39 events) of the total number of MCs, respectively. However, for cycle 24, the adjacent larger and smaller radial sizes than the distribution peak have ∼19% (18 events) and ∼29% (27 events), respectively, of the total number of MCs. Therefore, even taking the spread in the peak of the radial sizes, a majority of MCs in cycle 24 are found to be smaller than those in the earlier cycle. This is evident as the fractions of the total number of MCs over cycles 23 and 24 having a size shorter (longer) than 0.2 AU are ∼48% (52%) and ∼72% (28%), respectively. We also note that the degree of decrease in the sizes of MCs than that of ICMEs, in a fraction of events with radial sizes larger than 0.2 AU, is almost the same for both cycles. In Section 4, we discuss the reasons for our finding in the context of earlier studies.
3.4 Expansion Speeds of Magnetic Clouds
The RC catalog adopted for our analysis also lists the most probable coronal mass ejection (CMEs) associated with a few ICMEs/MCs. We find that there are 53 and 29 MCs in solar cycles 23 and 24, respectively, for which a clear association with their source CMEs is established. Although the total number of CME-MC pairs is relatively small, we examine the evolution of their radial expansion speeds from the Sun to 1 AU, in order to understand the role of the pressure difference between ICME and ambient medium, in their overall propagation. The average radial propagation speeds of CMEs close to the Sun are noted as 1,415 km s−1 in cycle 23 and 1,000 km s−1 in cycle 24, while its value for MCs near the Earth is noted as 510 km s−1 in cycle 23 and 410 km s−1 in cycle 24. Also, the average radial expansion speeds of CMEs close to the Sun are noted as 1,550 km s−1 in cycle 23 and 1,110 km s−1 in cycle 24, while its value for strictly expanding MCs near the Earth is noted as 45 km s−1 in cycle 23 and 25 km s−1 in cycle 24. Since the propagation speeds of CMEs and MCs are different close to the Sun and at 1 AU, one needs to estimate that what fraction of radial propagation speeds is the radial expansion speeds for CMEs and MCs in both cycles.
The methods to estimate the radial propagation and expansion speeds close to the Sun and Earth are described in Section 2. The distributions of the ratio of radial expansion to radial propagation speeds of CMEs and MCs are shown in Figure 4 for both solar cycles 23 and 24. We performed the KS test on the two samples of the ratio of expansion to propagation speeds of CMEs, taking each sample for solar cycles 23 and 24. The value of KS statistic D = 0.143 is found while the computed Dc = 0.314 at p = 0.05 is noted. It is clear that D < Dc, which implies that at the confidence level of 95%, the ratio of expansion to propagation speeds of CMEs is not different in cycles 23 and 24. Similarly, the KS test on the two samples of the ratio of expansion to propagation speeds of MCs at 1 AU gives D = 0.236. It is clear that D < Dc at p = 0.05, which implies that at the confidence level of 95%, the ratio of expansion to propagation speeds of MCs is not different in cycles 23 and 24. The range, average, median, and standard deviation for the ratio of radial expansion to propagation speeds of the selected CMEs and MCs are listed in Table 1.
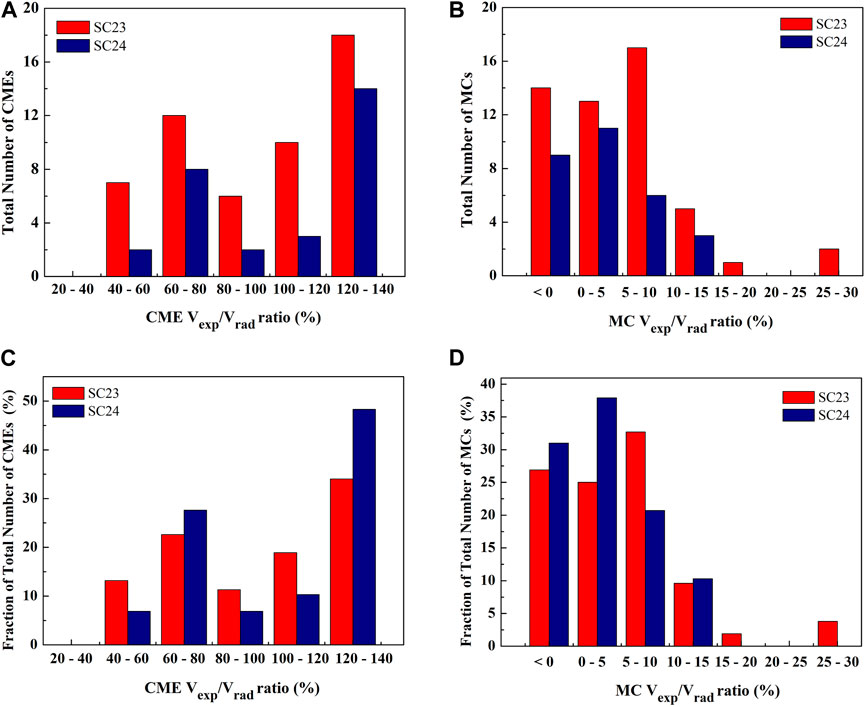
FIGURE 4. The distributions of the ratio of radial expansion (Vexp) to radial propagation speed (Vrad) of CMEs near the Sun and associated MCs at 1 AU for solar cycles 23 and 24 are shown. (A),(B) and (C),(D) show the distributions for the total number of CMEs/MCs and the percentage fraction of the total number of CMEs/MCs in each bin, respectively.
Our study assumes that under self-similar expansion, the radial and lateral expansion speeds of CMEs are equal when they are close to the Sun. We note that the average ratio of radial expansion to propagation speeds of CMEs in cycle 23 is 98%, and it increased to ∼103% in cycle 24. However, the average ratio of radial expansion to propagation speeds of MCs in cycle 23 is 5%, and it decreased to ∼3% in cycle 24. Excluding MCs with negative expansion speeds, i.e., taking only the strictly expanding MCs, we note that the average radial expansion speeds of MCs in cycle 23 are ∼9% (45 km s−1) of average radial propagation speeds (510 km s−1) and become ∼6% (25 km s−1) of propagation speeds (410 km s−1) in cycle 24. The statistics suggest that the radial expansion speeds of CMEs close to the Sun are only slightly larger fraction of their radial propagation speeds in cycle 24 than in cycle 23. Also, the radial expansion speeds of MCs at 1 AU in cycle 24 are only slightly smaller fraction of their radial propagation speeds than that in cycle 23. The decrease in the average radial expansion speeds measured at 1 AU for MCs in cycle 24 than that in cycle 23 is also noted in earlier studies (Gopalswamy et al., 2015b; Lugaz et al., 2017). Clearly, the distribution of expansion speeds of CMEs/MCs in cycles 23 and 24 is not significantly different which is also confirmed from the KS test.
From Figure 4, we note that the distribution of the ratio of expansion to propagation speeds of CMEs peaks at 120–140% for both the cycles with ∼34% (18 events) and ∼48% (14 events) of the total number of CMEs in cycles 23 and 24, respectively. The distribution for the range 100%–120% includes ∼19% (10 events) and ∼10% (3 events) of the total number of CMEs. Taking all the bins with the ratio of expansion to radial propagation speeds below 100% (i.e., when radial expansion speeds are smaller than the radial propagation speeds), the fraction of CMEs in cycle 23 is only ∼5% larger than that in cycle 24. These statistics suggest that expansion of CMEs, in general, is not significantly larger in solar cycle 24 than that in the previous cycle. However, the overexpansion of CMEs of cycle 24 has been reported earlier and explained in terms of reduced ambient solar wind pressure (Gopalswamy et al., 2014, Gopalswamy et al., 2020). It is possible that such overexpansion occurred much closer to the Sun in the coronagraphic field of view than the height at which the speeds are estimated and used in our study.
From Figure 4, we note that the ratio of radial expansion to radial propagation speeds of MCs at 1 AU in cycle 24 peaks at 0–5% and has ∼38% (11 events) of the total number of MCs while only ∼21% (6 events) of MCs have expansion speeds contribution in the range of 5–10% of the radial propagation speeds. On the other hand, the distribution for cycle 23 peaks at 5–10% and has ∼33% (17 events) of the total number of MCs. About ∼10% of events in both cycles have radial expansion speeds in the range of 10–15% of their radial propagation speeds. It is also noted that ∼27% and ∼31% of the total number of MCs have negative expansion speeds at 1 AU in solar cycles 23 and 24, respectively. The non-expansion of clouds is possible if they are compressed by the preceding and/or following large-scale solar wind structures. Such compression of CMEs by the following fast solar wind and faster CMEs has been reported earlier (Temmer et al., 2014; Mishra et al., 2017; Heinemann et al., 2019). Excluding the compressed MCs, the radial expansion speed of MCs is typically a small fraction (9% for cycle 23 and 6% for cycle 24) of their radial propagation speeds. Our statistics suggest that MCs in solar cycle 24 at 1 AU, on average, are expanding slightly slower than that in cycle 23. It is also found by Lugaz et al. (2017) that radial expansion speeds of CMEs in solar cycle 24 are smaller by about a factor of 2 than that in cycle 23. They also showed that reduced expansion speed is compensated by the decrease in the solar wind speeds and fast magnetosonic speeds. This resulted in a more or less equal probability of shock generation by CMEs in cycles 24 and 23.
In the present study, the radial expansion speeds of MCs are taken as half of the difference between the propagation speeds at the front and back of the MCs. However, Démoulin et al. (2008) have shown that the differences in the velocity at the front and back of MCs are just apparent, and larger differences do not necessarily imply their faster expansion rate. They showed that the velocity difference (ΔV) between the front and back of MC is the product of the mean velocity (Vc), the ratio of MC time duration (Δt) to its transit time (τ = D/Vc) at a distance D from the Sun, and the expansion coefficient (ζ). This implies that the larger differences in the velocity at the front and back can arise due to a larger mean propagation velocity and acceleration of the MC. We note that Démoulin et al. (2008) had used the x-component (along the Sunspacecraft line) of MC speed and determined ΔVx, but we can use the total speed of Earth-directed MC observed at L1 as the difference between ΔVx and ΔV in our case would be insignificant. The dimensionless expansion rate,
We computed the dimensionless expansion parameter of each MC in solar cycles 23 and 24 for which the CME-MC pair was established. We find that around 27% and 31% of MCs from the sample have a negative value of dimensionless expansion parameter implying that they are non-expanding MCs with ΔV less than zero. Taking only the expanding MCs with ΔV greater than zero, we find the average value of dimensionless expansion parameters as 0.64 and 0.62 in solar cycles 23 and 24, respectively. Therefore, we see that the average expansion rates in both cycles are almost equal. The constancy of the expansion parameter is expected as the decrease in the average value of ΔV in cycle 24 is compensated by the decrease in the mean velocity (Vc) of MC. Earlier studies have also shown that although MCs of different sizes and field strengths have a very broad range of velocity difference at their front and back, they have a narrow range (ζ = 0.8 ± 0.2) of dimensionless expansion parameter (Démoulin et al., 2008; Démoulin and Dasso, 2009; Gulisano et al., 2010).
Although the average value of the dimensionless expansion parameter is 0.63 ± 0.1 for MCs in both the cycles, it ranges from 0.1 to 1.57 for cycle 23 and 0.1 to 1.77 for cycle 24. The larger spread in the expansion parameter is expected due to different plasma parameters in each MCs, overtaking streams, and the ambient solar wind. The MCs compressed by following large-scale solar wind structures are expected to have a lower value of dimensionless expansion parameter, in general. If the compression is strong enough, it can indeed stop the expansion of MCs leading to ΔV less than zero. However, if the following structures/streams responsible for compression completely overtake through the preceding MC, then the MC would experience a lesser pressure at its back but higher internal pressure inside. This can cause the MC to overexpand, i.e., faster than the usual rate of expansion, and have a value of dimensionless expansion parameter greater than unity (Gulisano et al., 2010). It is obvious that the main driver of MC expansion is the rapid decrease of the total solar wind pressure with solar distance, but other factors such as pressure inside MC, its compression by following structures, and thereafter its temporal stage of evolution at the time of observations can influence the expansion rate of the MC.
4 Summary and Discussion
In the present study, we have estimated the duration and radial sizes of ICMEs, sheaths preceding ICMEs, and MCs that arrived near the Earth at 1 AU during solar cycles 23 and 24. Taking CME-MC pairs associated with each other, we estimated radial propagation and expansion speeds of CMEs close to the Sun and MCs at 1 AU. The estimated dimensions of ICMEs/MCs are interpreted based on their radial expansion behavior between the Sun and Earth. The distribution of estimated characteristics of ICMEs and MCs is listed in Table 1. We compare our findings with those of earlier studies that have used a different sample of events during different phases/intervals of solar activity.
Our analysis finds the average duration of ICMEs, sheaths, entire region ICMEs, and MCs in cycle 23 at 1 AU as approximately 26, 7, 35, and 20 h, respectively. The average duration of ICMEs, entire ICMEs, and MCs in solar cycle 24 is decreased by ∼19%, ∼16%, and ∼12%, respectively, of its value in the previous cycle 23. In contrast to ICMEs/MCs, the average duration of sheaths in cycle 24 is the same as in the previous cycle. Furthermore, the average radial sizes of ICMEs, sheaths, entire region of ICMEs, and MCs in cycle 23 are 0.33, 0.07, 0.4, and 0.21 AU, respectively. The average radial sizes of ICMEs, entire ICMEs, and MCs in solar cycle 24 decreased by ∼33%, ∼25%, and ∼24%, respectively, of its value in the previous cycle 23. Similar to duration, the average radial sizes of sheaths of ICMEs remain the same in both cycles.
In general for both cycles, the dimensional characteristics (i.e., duration and radial sizes) of the ICMEs, entire region of ICMEs, and MCs have wide distributions which range from around one-fifth of their average values to around three times their average values. In our study, radial sizes of MCs are around two-third of ICMEs radial sizes in both cycles. The possibility of erosion of ICMEs at the front during their propagation can be a reason for smaller and embedded MCs in the extended ICMEs structures (Ruffenach et al., 2012; Wang et al., 2018). The radial sizes of ICMEs, MCs, and their sheaths also depend on the trajectory of in situ spacecraft along the flanks or nose of the structures. In our study, the radial sizes of the sheaths at 1 AU range from as low as zero to as high as five times its average value. The average radial sizes of the sheaths are one-fifth and one-third of their following ICMEs radial sizes in cycles 23 and 24, respectively. Surprisingly, the radial sizes of sheaths in a weaker solar cycle 24 are a relatively larger fraction of their following ICMEs radial sizes than that in cycle 23. This suggests that there is almost no correlation between sheaths and ICME radial sizes at 1 AU. This is expected because the dynamic evolution of ICMEs is governed by expansion but the compression by CMEs or shocks is responsible for the sheaths (Russell and Mulligan, 2002). In a recent study, Temmer et al. (2021) have shown that the amount of sheath material depends on ambient solar wind density and speed ahead of the CME as well as on the angular width of the CME.
Our estimates of average duration and radial sizes of ICMEs in cycle 23 are slightly smaller by only 10% of that reported by Zhang et al. (2008). However, the average values of sheaths duration and sizes in our study are considerably smaller by 25% of those reported by them. Such a difference is possible as they have selected ICMEs responsible for intense geomagnetic storms which are expected to be stronger than the general population of ICMEs considered in the present study. Furthermore, the study of Forsyth et al. (2006); Mitsakou and Moussas (2014) found that average radial sizes of ICMEs (sheaths) in cycle 23 are 0.27 AU (0.1 AU) which are smaller by 20% (larger by 30%) of our estimates. Our findings of radial sizes and duration of ICMEs in cycle 23 are in agreement with the study of Richardson and Cane (2010). Furthermore, our study reports that the average radial sizes for ICMEs during cycles 23 and 24 are smaller by 10% and 25%, respectively, than that reported by Lawrance et al. (2020). The difference of our results from that in Lawrance et al. (2020) is expected as they have considered events only during the declining phase of cycles when one expects to have stronger ICMEs leading to intense geomagnetic storms than that over the rising phase of the solar cycle (Gonzalez et al., 2011).
Based on the in situ observations of MCs from Helios spacecraft, Gulisano et al. (2010) established a relation between the average radial size (S) of a MC and its distance (R) in AU from the Sun. They found that S = (0.23 ± 0.01) × R0.78 ± 0.12, and this result was consistent with the findings of Bothmer and Schwenn (1998) within error bars. However, using the in situ observations of MCs from several spacecraft located at different distances within 0.3 to 10 AU, Leitner et al. (2007) expressed the relation as S = (0.20 ± 0.02) × R0.61 ± 0.09. In the present study, the average radial size of MCs in solar cycle 23 is in good agreement with that derived from the expression of Gulisano et al. (2010) and Leitner et al. (2007). However, the average radial size of MCs in solar cycle 24 is 30% and 20% smaller than that obtained from expression by Gulisano et al. (2010) and Leitner et al. (2007), respectively. We also note that the estimated sizes of MCs included in our study agree with the typical sizes of MCs during 1974–1981 as reported in Bothmer and Schwenn (1998). Overall, our findings of radial sizes are reasonably consistent with earlier studies.
Furthermore, the average radial expansion speeds (Vexp) of MCs can be approximated as Vexp = 0.18 × VMC × D0.22 from the expression of Gulisano et al. (2010), where VMC is the radial propagation speeds of MCs. The expansion speeds of MCs at 1 AU from this expression are 100% and 200% larger than that from in situ observations in solar cycles 23 and 24, respectively. Also, following the expression of Leitner et al. (2007), Vexp = 0.12 × VMC × D0.39, the expansion speeds of MCs at 1 AU are 30% and 100% larger than that from in situ observations in solar cycles 23 and 24, respectively. It is obvious that these established relations overestimate the expansion speeds of MCs at 1 AU. It is possible that the expressions of radial sizes as a function of distance from the Sun are biased due to the use of higher fraction of observations within 1 AU (such as from Helios at 0.3 to 0.7 AU). Furthermore, we also note that neither of the expressions used above was fitted using observations close to the Sun, it would be misleading to compare the expansion speeds of CMEs from the expressions that we obtained from coronagraphic observations. The differences in radial sizes/expansion speeds may be attributed to the preference in the selection of events from a different phase and interval of the solar cycle. The difference can also arise from the subjective identification criteria of ICMEs/MCs and also timings of front and rear boundaries of the events in the in situ observations.
In our chosen sample, around 70% of MCs are strictly expanding in both solar cycles 23 and 24. This is in agreement with Jian et al. (2018) who reported the same fraction of MCs with nonzero radial expansion speeds at STEREO (Kaiser et al., 2008). We find that the radial expansion speeds of MCs in cycles 23 and 24 are only 9% and 6%, respectively, of their radial propagation speeds at 1 AU. Wang et al. (2005) have found that typical speeds at which ICMEs expand at 1 AU are 12% of their radial speeds which is in good agreement with our values for cycle 23. It is expected that non-MC ICMEs have larger radial expansion speeds at 1 AU. We also note that the average radial expansion speed of MCs at 1 AU in cycle 24 is lower by about a factor of 2 as compared to cycle 23. We find that near the Sun in cycle 24, the fraction of radial speeds as expansion speeds of CMEs is increased by only ∼5% of its value in cycle 23; however, a considerable anomalous lateral expansion of CMEs close to the Sun in cycle 24 was reported in Gopalswamy et al. (2014). It is possible that overexpansion of CMEs in cycle 24 happened much closer to the Sun than the height where expansion speeds are estimated and used in our study. We infer that the CMEs in cycle 24 observed as MCs in the in situ observations 1 AU have not expanded considerably during the later segment of their long journey.
The expansion of MCs is governed by the difference in the total pressure between MCs and the ambient medium. The ambient solar wind pressure at 1 AU has decreased in cycle 24 as compared to that in cycle 23. Despite this, the reduced average expansion speeds of MCs in cycle 24 are only possible if the total pressure inside the MCs also decreased. In our analysis, the expansion speeds of CMEs in both cycles are almost similar fraction of their propagation speeds. However, the results of Gopalswamy et al. (2020) suggested that CMEs in solar cycle 24 become halos closer to the Sun and at lower speeds than that in cycle 23. We infer that the reduction in the heliospheric pressure in cycle 24 (Richardson, 2013; Gopalswamy et al., 2015a) seems to be balanced by the dilution of magnetic content inside the CMEs with or without their overexpansion close to the Sun. This can prevent them from expanding further as they evolve through interplanetary medium and reach 1 AU as in situ observed MCs. Our findings of radial sizes and expansion speeds at 1 AU suggest that the ratio of MCs to ambient medium total pressure at 1 AU should be slightly higher in cycle 23 than that in cycle 24 which is in agreement with Gopalswamy et al. (2015b). Furthermore, the limited radial expansion of ICMEs/MCs in the interplanetary medium in cycle 24 might have caused their crosssection to rapidly flatten, and this can also be partially responsible for their smaller radial sizes than that in cycle 23. However, the possibility of ejection of relatively smaller flux-ropes from the Sun itself in a weaker cycle 24 cannot be ignored, and further studies are required to rule out this possibility. We assume our findings from studying CME-MC pairs would also apply to CME-ICME (non-MC) pairs. This is because non-MC ICMEs are essentially the same as MCs but appear different due to the geometric selection effect in the in situ observations.
In our study, the dimensionless expansion parameter is the same (ζ = 0.63 ± 0.1) in both the cycles for MCs at 1 AU. This implies a constant expansion rate of MCs at 1 AU in cycles 23 and 24. Also, our analysis does not indicate that the ratio of expansion to propagation speeds of CMEs close to the Sun is considerably different between both cycles. However, the observed larger angular width of CMEs at a given speed in cycle 24 than that in cycle 23 is interpreted owing to overexpansion of CMEs in cycle 24 (Gopalswamy et al., 2014). It is possible that CMEs overexpanded much closer to the Sun than the average height at which speeds are estimated and used in the present study. If one assumes that the average value of dimensionless expansion parameter does not change beyond the distance where pressure balance is reached, this would suggest that CMEs in solar cycle 24 attain pressure balance with the ambient solar wind at a larger distance from the Sun. This can be confirmed in future studies taking limb CMEs and measuring the variation in their radial and lateral expansion speeds as well as angular widths. The sample of CMEs considered in the present study is Earth-directed halos, and their coronagraphic observations suffer from severe projection effects. Therefore, the estimation of radial propagation and expansion speeds of CMEs close to the Sun would have large uncertainties, and the findings based on this cannot be considered strong enough to make a solid conclusion.
Similar to the evolution of radial sizes of ICMEs, the sheaths preceding ICMEs also evolve as they propagate in the heliosphere. Several factors cause solar wind to deflect around an ICME and getting pile-up at its nose (Siscoe and Odstrcil, 2008; Takahashi and Shibata, 2017). The observed sizes of sheaths keeping compressed plasma of ambient medium accumulate gradually over long periods and range of distances from the Sun. The equal average dimension of sheaths in both cycles is unexpected because ICMEs in cycle 23 are of larger sizes, more geoeffective, faster radial propagation, and expansion speeds 1 AU than that in cycle 24. The unexpected result can be explained if the efficiency of these sheath accumulating factors, integrated over time of ICMEs journey from the Sun to 1 AU, is averaged to be equal in both cycles. In the present study, our sample has ∼16% and ∼26% of the total number of ICMEs without sheaths in cycles 23 and 24, respectively. This is not expected as the slower upstream solar wind speed and lower fast magnetosonic speed in interplanetary space in cycle 24 should have given a higher probability of the formation of shocks and sheaths in cycle 24. However, it was not the case as Lugaz et al. (2017) have shown for the slow CMEs with their reduced radial expansion speeds in cycle 24 compensated the effects of reduced solar wind speeds and fast magnetosonic speeds. Further studies are required in this direction to understand the heliospheric evolution of ICME sheath and its size in connection with the sizes of the ICME (Temmer et al., 2021). Our study did not analyze the sheaths sizes ahead of MCs separately instead focus on the general ICMEs sample including MCs. However, the sheaths preceding MCs observed due to the geometric selection effect are expected to have smaller sizes than the sheaths preceding non-MC ICMEs. This is because the compression ratio by CMEs-driven shock is higher near the nose of the CME front, and the separation between shock and ICME leading edge is larger at the flanks (Kwon and Vourlidas, 2018).
Based on the RC catalog, we find that the ICME number observed at 1 AU in the ecliptic plane in cycle 24 is decreased by 34% of its value in the previous cycle. This can be primarily due to a decrease in the CME rate itself from the Sun; however, other factors such as the launch of Earth-directed CMEs from higher latitudes, longitudes, and their deflection in cycle 24 can also contribute (Lamy et al., 2017; Mishra et al., 2019). The increased fraction of ICMEs as MCs (45% of ICMEs) in cycle 24 than that (24% of ICMEs) in cycle 23 might be an effect of reduced interaction of weaker ICMEs with the weaker ambient solar wind. Such reduced interaction did not disrupt the flux-rope structures and enabled them to be observed as MCs at 1 AU. The abundance of MCs in cycle 24 can also be due to bias in the Earth-arriving CMEs source regions towards the central meridian. In this scenario, one should find a decrease in the occurrence of complex ejecta in cycle 24 which can be explored in future studies. However, the increased abundance of MCs relative to ICMEs did not translate into an increase in the intensity of geomagnetic storms in cycle 24 Kilpua et al. (2014).
Overall, we find that size of ICMEs/MCs, their sheaths, and radial expansion speeds at 1 AU are difficult to be determined from their observations close to the Sun. These characteristics are governed primarily by their expansion and/or compression history with increasing distance from the Sun which is significantly decided by the decrease in the total pressure inside the ICMEs and also in the environment around them. Our study used expansion speeds of CMEs close to the Sun and MCs at 1 AU, and thus, the conclusion drawn here is based on the two-point measurements only. However, to better understand the evolution of radial sizes and expansion behavior of ICMEs, we need to observe them at different heliocentric distances. We point out that there is vast literature discussing the evolution of propagation speeds of CMEs from the Sun to 1 AU (Gopalswamy et al., 2001; Manoharan et al., 2004; Davies et al., 2009; Liu et al., 2010; Mishra et al., 2014; Harrison et al., 2018); however, only limited efforts are made for understanding the evolution of radial expansion speeds (Liu et al., 2005; Démoulin and Dasso, 2009; Gulisano et al., 2010). Therefore, further studies in this direction are required for an in-depth understanding of the factors responsible for the observed sizes of ICMEs/MCs and especially their preceding sheaths structures.
Data Availability Statement
Publicly available datasets were analyzed in this study. This data can be found here: CDAW CME catalog (https://cdaw.gsfc.nasa.gov/CME_list/), RC catalog of ICMEs (http://www.srl.caltech.edu/ACE/ASC/DATA/level3/icmetable2. htm), and CDAWeb (https://cdaweb.gsfc.nasa.gov/index.html/).
Author Contributions
WM and NS contributed to the initial conception of the paper. The analysis was carried out primarily by UD under the guidance of WM and NS. The main draft was prepared by WM, and all of the authors have read the paper and approved its final version.
Conflict of Interest
The authors declare that the research was conducted in the absence of any commercial or financial relationships that could be construed as a potential conflict of interest.
Publisher’s Note
All claims expressed in this article are solely those of the authors and do not necessarily represent those of their affiliated organizations, or those of the publisher, the editors, and the reviewers. Any product that may be evaluated in this article, or claim that may be made by its manufacturer, is not guaranteed or endorsed by the publisher.
Acknowledgments
We acknowledge the use of CDAW catalog of CMEs, RC catalog of ICMEs, and CDAWeb for providing in situ observations of solar wind at 1 AU. We also thank the referees for their helpful comments.
References
Antia, H. M., and Basu, S. (2010). Solar Rotation Rate During the Cycle 24 minimum in Activity. Astrophysical J. 720, 494–502. doi:10.1088/0004-637X/720/1/494
Bisoi, S. K., Janardhan, P., and Ananthakrishnan, S. (2020). Another Mini Solar Maximum in the Offing: A Prediction for the Amplitude of Solar Cycle 25. J. Geophys. Res. Space Phys. 125, e27508. doi:10.1029/2019JA027508
Bothmer, V., and Schwenn, R. (1998). The Structure and Origin of Magnetic Clouds in the Solar Wind. Ann. Geophys. 16, 1–24. doi:10.1007/s00585-997-0001-x
Brueckner, G. E., Howard, R. A., Koomen, M. J., Korendyke, C. M., Michels, D. J., Moses, J. D., et al. (1995). The Large Angle Spectroscopic Coronagraph (LASCO). Solar Phys. 162, 357–402. doi:10.1007/BF00733434
Burlaga, L. F., Plunkett, S. P., and Cyr, St. O. C. (2002). Successive CMEs and Complex Ejecta. J. Geophys. Res. 107, 1266. doi:10.1029/2001JA000255
Burlaga, L., Sittler, E., Mariani, F., and Schwenn, R. (1981). Magnetic Loop Behind an Interplanetary Shock: Voyager, Helios, and IMP 8 Observations. J. Geophys. Res. 86, 6673–6684. doi:10.1029/JA086iA08p06673
Chi, Y., Shen, C., Wang, Y., Xu, M., Ye, P., and Wang, S. (2016). Statistical Study of the Interplanetary Coronal Mass Ejections From 1995 to 2015. Sol. Phys. 291, 2419–2439. doi:10.1007/s11207-016-0971-5
Davies, J. A., Harrison, R. A., Rouillard, A. P., Sheeley, N. R., Perry, C. H., Bewsher, D., et al. (2009). A Synoptic View of Solar Transient Evolution in the Inner Heliosphere Using the Heliospheric Imagers on STEREO. Geophys. Res. Lett. 36, a–n. doi:10.1029/2008GL036182
DeForest, C. E., Howard, T. A., and McComas, D. J. (2013). Tracking Coronal Features From the Low Corona to Earth: A Quantitative Analysis of the 2008 December 12 Coronal Mass Ejection. Astrophysical J. 769, 43. doi:10.1088/0004-637X/769/1/43
Démoulin, P., and Dasso, S. (2009). Causes and Consequences of Magnetic Cloud Expansion. Astron. Astrophysics. 498, 551–566. doi:10.1051/0004-6361/200810971
Démoulin, P., Janvier, M., Masías-Meza, J. J., and Dasso, S. (2016). Quantitative Model for the Generic 3D Shape of ICMEs at 1 AU. Astron. Astrophysics. 595, A19. doi:10.1051/0004-6361/201628164
Démoulin, P., Nakwacki, M. S., Dasso, S., and Mandrini, C. H. (2008). Expected In Situ Velocities From a Hierarchical Model for Expanding Interplanetary Coronal Mass Ejections. Sol. Phys. 250, 347–374. doi:10.1007/s11207-008-9221-9
Eyles, C. J., Harrison, R. A., Davis, C. J., Waltham, N. R., Shaughnessy, B. M., Mapson-Menard, H. C. A., et al. (2009). The Heliospheric Imagers Onboard the STEREO Mission. Sol. Phys. 254, 387–445. doi:10.1007/s11207-008-9299-0
Forsyth, R. J., Bothmer, V., Cid, C., Crooker, N. U., Horbury, T. S., Kecskemety, K., et al. (2006). ICMEs in the Inner Heliosphere: Origin, Evolution and Propagation Effects. Space Sci. Rev. 123, 383–416. doi:10.1007/s11214-006-9022-0
Gonzalez, W. D., Echer, E., Clúa de Gonzalez, A. L., Tsurutani, B. T., and Lakhina, G. S. (2011). Extreme Geomagnetic Storms, Recent Gleissberg Cycles and Space Era-Superintense Storms. J. Atmos. Solar-Terrestrial Phys. 73, 1447–1453. doi:10.1016/j.jastp.2010.07.023
Good, S. W., and Forsyth, R. J. (2016). Interplanetary Coronal Mass Ejections Observed by MESSENGER and Venus Express. Sol. Phys. 291, 239–263. doi:10.1007/s11207-015-0828-3
Gopalswamy, N., Akiyama, S., and Yashiro, S. (2020). The State of the Heliosphere Revealed by Limb-Halo Coronal Mass Ejections in Solar Cycles 23 and 24. Astrophysical J. 897, L1. doi:10.3847/2041-8213/ab9b7b
Gopalswamy, N., Akiyama, S., Yashiro, S., Xie, H., Mäkelä, P., and Michalek, G. (2014). Anomalous Expansion of Coronal Mass Ejections During Solar Cycle 24 and its Space Weather Implications. Geophys. Res. Lett. 41, 2673–2680. doi:10.1002/2014GL059858
Gopalswamy, N., Dal Lago, A., Yashiro, S., and Akiyama, S. (2009). The Expansion and Radial Speeds of Coronal Mass Ejections. Cent. Eur. Astrophysical Bull. 33, 115–124.
Gopalswamy, N., Lara, A., Yashiro, S., Kaiser, M. L., and Howard, R. A. (2001). Predicting the 1-AU Arrival Times of Coronal Mass Ejections. J. Geophys. Res. 106, 29207–29217. doi:10.1029/2001JA000177
Gopalswamy, N., Xie, H., Akiyama, S., Mäkelä, P., Yashiro, S., and Michalek, G. (2015a). The Peculiar Behavior of Halo Coronal Mass Ejections in Solar Cycle 24. Astrophysical J. 804, L23. doi:10.1088/2041-8205/804/1/L23
Gopalswamy, N., Yashiro, S., Xie, H., Akiyama, S., and Mäkelä, P. (2015b). Properties and Geoeffectiveness of Magnetic Clouds During Solar Cycles 23 and 24. J. Geophys. Res. Space Phys. 120, 9221–9245. doi:10.1002/2015ja021446
Gopalswamy, N., Yashiro, S., Michalek, G., Xie, H., Mäkelä, P., Vourlidas, A., et al. (2010). A Catalog of Halo Coronal Mass Ejections From SOHO. Sun and Geosphere 5, 7–16.
Gosling, J. T., Bame, S. J., McComas, D. J., and Phillips, J. L. (1990). Coronal Mass Ejections and Large Geomagnetic Storms. Geophys. Res. Lett. 17, 901–904. doi:10.1029/gl017i007p00901
Gulisano, A. M., Démoulin, P., Dasso, S., Ruiz, M. E., and Marsch, E. (2010). Global and Local Expansion of Magnetic Clouds in the Inner Heliosphere. Astron. Astrophysics. 509, A39. doi:10.1051/0004-6361/200912375
Guo, J., Feng, X., Zhang, J., Zuo, P., and Xiang, C. (2010). Statistical Properties and Geoefficiency of Interplanetary Coronal Mass Ejections and Their Sheaths During Intense Geomagnetic Storms. J. Geophys. Res. 115, a–n. doi:10.1029/2009JA015140
Harrison, R. A., Davies, J. A., Barnes, D., Byrne, J. P., Perry, C. H., Bothmer, V., et al. (2018). CMEs in the Heliosphere: I. A Statistical Analysis of the Observational Properties of CMEs Detected in the Heliosphere From 2007 to 2017 by STEREO/HI-1. Sol. Phys. 293, 77. doi:10.1007/s11207-018-1297-2
Heinemann, S. G., Temmer, M., Farrugia, C. J., Dissauer, K., Kay, C., Wiegelmann, T., et al. (2019). CME-HSS Interaction and Characteristics Tracked From Sun to Earth. Sol. Phys. 294, 121. doi:10.1007/s11207-019-1515-6
Howard, T. A., and DeForest, C. E. (2012). The Thomson Surface. I. Reality and Myth. Astrophysical J. 752, 130. doi:10.1088/0004-637X/752/2/130
Hundhausen, A. J., Sawyer, C. B., House, L., Illing, R. M. E., and Wagner, W. J. (1984). Coronal Mass Ejections Observed During the Solar Maximum Mission: Latitude Distribution and Rate of Occurrence. J. Geophys. Res. 89, 2639–2646. doi:10.1029/ja089ia05p02639
Janardhan, P., Bisoi, S. K., Ananthakrishnan, S., Tokumaru, M., and Fujiki, K. (2011). The Prelude to the Deep Minimum Between Solar Cycles 23 and 24: Interplanetary Scintillation Signatures in the Inner Heliosphere. Geophys. Res. Lett. 38, a–n. doi:10.1029/2011GL049227
Jian, L. K., Russell, C. T., Luhmann, J. G., and Galvin, A. B. (2018). STEREOObservations of Interplanetary Coronal Mass Ejections in 2007-2016. Astrophysical J. 855, 114. doi:10.3847/1538-4357/aab189
Jian, L. K., Russell, C. T., Luhmann, J. G., Skoug, R. M., and Steinberg, J. T. (2008). Stream Interactions and Interplanetary Coronal Mass Ejections at 5.3 AU Near the Solar Ecliptic Plane. Sol. Phys. 250, 375–402. doi:10.1007/s11207-008-9204-x
Joselyn, J. A., Anderson, J. B., Coffey, H., Harvey, K., Hathaway, D., Heckman, G., et al. (1997). Panel Achieves Consensus Prediction of Solar Cycle 23. Eos Trans. AGU. 78, 205. doi:10.1029/97EO00136
Kaiser, M. L., Kucera, T. A., Davila, J. M., St. Cyr, O. C. O. C., Guhathakurta, M., and Christian, E. (2008). The STEREO Mission: An Introduction. STEREO Mission. 136, 5–16. doi:10.1007/978-0-387-09649-0_2
Kilpua, E. K. J., Luhmann, J. G., Jian, L. K., Russell, C. T., and Li, Y. (2014). Why Have Geomagnetic Storms Been So Weak During the Recent Solar Minimum and the Rising Phase of Cycle 24?. J. Atmos. Solar-Terrestrial Phys. 107, 12–19. doi:10.1016/j.jastp.2013.11.001
Kilpua, E., Koskinen, H. E. J., and Pulkkinen, T. I. (2017). Coronal Mass Ejections and Their Sheath Regions in Interplanetary Space. Living Rev. Sol. Phys. 14, 5. doi:10.1007/s41116-017-0009-6
Kwon, R.-Y., and Vourlidas, A. (2018). The Density Compression Ratio of Shock Fronts Associated With Coronal Mass Ejections. J. Space Weather Space Clim. 8, A08. doi:10.1051/swsc/2017045
Lamy, P., Floyd, O., Quémerais, E., Boclet, B., and Ferron, S. (2017). Coronal Mass Ejections and Solar Wind Mass Fluxes Over the Heliosphere During Solar Cycles 23 and 24 (1996-2014). J. Geophys. Res. Space Phys. 122, 50–62. doi:10.1002/2016JA022970
Lawrance, M. B., Moon, Y.-J., and Shanmugaraju, A. (2020). Relationships Between Interplanetary Coronal Mass Ejection Characteristics and Geoeffectiveness in the Declining Phase of Solar Cycles 23 and 24. Sol. Phys. 295, 62. doi:10.1007/s11207-020-01623-1
Leitner, M., Farrugia, C. J., Möstl, C., Ogilvie, K. W., Galvin, A. B., Schwenn, R., et al. (2007). Consequences of the Force-Free Model of Magnetic Clouds for Their Heliospheric Evolution. J. Geophys. Res. 112, a–n. doi:10.1029/2006JA011940
Li, H., Wang, C., Richardson, J. D., and Tu, C. (2017). Evolution of Alfvénic Fluctuations inside an Interplanetary Coronal Mass Ejection and Their Contribution to Local Plasma Heating: Joint Observations from 1.0 to 5.4 au. Astrophysical J. 851, L2. doi:10.3847/2041-8213/aa9c3f
Li, Y., Luhmann, J. G., and Lynch, B. J. (2018). Magnetic Clouds: Solar Cycle Dependence, Sources, and Geomagnetic Impacts. Sol. Phys. 293, 135. doi:10.1007/s11207-018-1356-8
Liu, Y., Davies, J. A., Luhmann, J. G., Vourlidas, A., Bale, S. D., and Lin, R. P. (2010). Geometric Triangulation of Imaging Observations to Track Coronal Mass Ejections Continuously Out to 1 AU. Astrophysical J. 710, L82–L87. doi:10.1088/2041-8205/710/1/l82
Liu, Y., Richardson, J. D., and Belcher, J. W. (2005). A Statistical Study of the Properties of Interplanetary Coronal Mass Ejections From 0.3 to 5.4AU. Planet. Space Sci. 53, 3–17. doi:10.1016/j.pss.2004.09.023
Liu, Y., Richardson, J. D., Belcher, J. W., Kasper, J. C., and Elliott, H. A. (2006). Thermodynamic Structure of Collision-Dominated Expanding Plasma: Heating of Interplanetary Coronal Mass Ejections. J. Geophys. Res. 111, A01102. doi:10.1029/2005JA011329
Lugaz, N., Farrugia, C. J., Winslow, R. M., Small, C. R., Manion, T., and Savani, N. P. (2017). Importance of CME Radial Expansion on the Ability of Slow CMEs to Drive Shocks. Astrophysical J. 848, 75. doi:10.3847/1538-4357/aa8ef9
Manoharan, P. K. (2006). Evolution of Coronal Mass Ejections in the Inner Heliosphere: A Study Using White-Light and Scintillation Images. Sol. Phys. 235, 345–368. doi:10.1007/s11207-006-0100-y
Manoharan, P. K., Gopalswamy, N., Yashiro, S., Lara, A., Michalek, G., and Howard, R. A. (2004). Influence of Coronal Mass Ejection Interaction on Propagation of Interplanetary Shocks. J. Geophys. Res. 109, A06109. doi:10.1029/2003JA010300
Marubashi, K., and Lepping, R. P. (2007). Long-Duration Magnetic Clouds: a Comparison of Analyses Using Torus- and Cylinder-Shaped Flux Rope Models. Ann. Geophys. 25, 2453–2477. doi:10.5194/angeo-25-2453-2007
Mathew, S. K., Martínez Pillet, V., Solanki, S. K., and Krivova, N. A. (2007). Properties of Sunspots in Cycle 23. Astron. Astrophysics. 465, 291–304. doi:10.1051/0004-6361:20066356
Mishra, W., Srivastava, N., and Davies, J. A. (2014). A Comparison of Reconstruction Methods for the Estimation of Coronal Mass Ejections Kinematics Based on SECCHI/HI Observations. Astrophysical J. 784, 135. doi:10.1088/0004-637x/784/2/135
Mishra, W., and Srivastava, N. (2015). Heliospheric Tracking of Enhanced Density Structures of the 6 October 2010 CME. J. Space Weather Space Clim. 5, A20. doi:10.1051/swsc/2015021
Mishra, W., Srivastava, N., Wang, Y., Mirtoshev, Z., Zhang, J., and Liu, R. (2019). Mass Loss via Solar Wind and Coronal Mass Ejections during Solar Cycles 23 and 24. Monthly Notices R. Astronomical Soc. 486, 4671–4685. doi:10.1093/mnras/stz1001
Mishra, W., and Wang, Y. (2018). Modeling the Thermodynamic Evolution of Coronal Mass Ejections Using Their Kinematics. Astrophysical J. 865, 50. doi:10.3847/1538-4357/aadb9b
Mishra, W., Wang, Y., Srivastava, N., and Shen, C. (2017). Assessing the Nature of Collisions of Coronal Mass Ejections in the Inner Heliosphere. Astrophysical J. Suppl. Ser. 232, 5. doi:10.3847/1538-4365/aa8139
Mitsakou, E., and Moussas, X. (2014). Statistical Study of ICMEs and Their Sheaths During Solar Cycle 23 (1996 - 2008). Sol. Phys. 289, 3137–3157. doi:10.1007/s11207-014-0505-y
Neugebauer, M., Steinberg, J. T., Tokar, R. L., Barraclough, B. L., Dors, E. E., Wiens, R. C., et al. (2003). Genesis On-Board Determination of the Solar Wind Flow Regime. SSRv. 105, 661–679. doi:10.1023/A:1024478129261
Nieves-Chinchilla, T., Vourlidas, A., Raymond, J. C., Linton, M. G., Al-haddad, N., Savani, N. P., et al. (2018). Understanding the Internal Magnetic Field Configurations of ICMEs Using More Than 20 Years of Wind Observations. Sol. Phys. 293, 25. doi:10.1007/s11207-018-1247-z
Ogilvie, K. W., Chornay, D. J., Fritzenreiter, R. J., Hunsaker, F., Keller, J., Lobell, J., et al. (1995). SWE, A Comprehensive Plasma Instrument for the Wind Spacecraft. Space Sci. Rev. 71, 55–77. doi:10.1007/BF00751326
Owens, M. J., Cargill, P. J., Pagel, C., Siscoe, G. L., and Crooker, N. U. (2005). Characteristic Magnetic Field and Speed Properties of Interplanetary Coronal Mass Ejections and Their Sheath Regions. J. Geophys. Res. 110, A01105. doi:10.1029/2004JA010814
Patsourakos, S., Vourlidas, A., and Stenborg, G. (2010). The Genesis of an Impulsive Coronal Mass Ejection Observed at Ultra-High Cadence by AIA on SDO. Astrophysical J. 724, L188–L193. doi:10.1088/2041-8205/724/2/L188
Pesnell, W. D. (2008). Predictions of Solar Cycle 24. Sol. Phys. 252, 209–220. doi:10.1007/s11207-008-9252-2
Pesnell, W. D. (2016). Predictions of Solar Cycle 24: How Are We Doing?. Space Weather. 14, 10–21. doi:10.1002/2015SW001304
Petrie, G. J. D. (2015). On the Enhanced Coronal Mass Ejection Detection Rate Since the Solar Cycle 23 Polar Field Reversal. Astrophysical J. 812, 74. doi:10.1088/0004-637x/812/1/74
Ramesh, K. B. (2010). Coronal Mass Ejections and Sunspots-Solar Cycle Perspective. Astrophysical J. 712, L77–L80. doi:10.1088/2041-8205/712/1/L77
Reisenfeld, D. B., Gosling, J. T., Forsyth, R. J., Riley, P., and Cyr, St. O. C. (2003). Properties of High-Latitude CME-Driven Disturbances During Ulysses Second Northern Polar Passage. Geophys. Res. Lett. 30, 8031. doi:10.1029/2003GL017155
Richardson, I. G., Berdichevsky, D., Desch, M. D., and Farrugia, C. J. (2000). Solar-Cycle Variation of Low Density Solar Wind During More Than Three Solar Cycles. Geophys. Res. Lett. 27, 3761–3764. doi:10.1029/2000GL000077
Richardson, I. G., and Cane, H. V. (1995). Regions of Abnormally Low Proton Temperature in the Solar Wind (1965-1991) and Their Association With Ejecta. J. Geophys. Res. 100, 23397–23412. doi:10.1029/95JA02684
Richardson, I. G., and Cane, H. V. (2010). Near-Earth Interplanetary Coronal Mass Ejections During Solar Cycle 23 (1996 - 2009): Catalog and Summary of Properties. Sol. Phys. 264, 189–237. doi:10.1007/s11207-010-9568-6
Richardson, I. G. (2013). Geomagnetic Activity During the Rising Phase of Solar Cycle 24. J. Space Weather Space Clim. 3, A08. doi:10.1051/swsc/2013031
Riley, P., Schatzman, C., Cane, H. V., Richardson, I. G., and Gopalswamy, N. (2006). On the Rates of Coronal Mass Ejections: Remote Solar and In Situ Observations. Astrophysical J. 647, 648–653. doi:10.1086/505383
Ruffenach, A., Lavraud, B., Owens, M. J., Sauvaud, J.-A., Savani, N. P., Rouillard, A. P., et al. (2012). Multispacecraft Observation of Magnetic Cloud Erosion by Magnetic Reconnection during Propagation. J. Geophys. Res. 117, a–n. doi:10.1029/2012JA017624
Russell, C. T., and Mulligan, T. (2002). The True Dimensions of Interplanetary Coronal Mass Ejections. Adv. Space Res. 29, 301–306. doi:10.1016/s0273-1177(01)00588-9
Sachdeva, N., Subramanian, P., Colaninno, R., and Vourlidas, A. (2015). Cme Propagation: Where Does Aerodynamic Drag "Take Over"?. Astrophysical J. 809, 158. doi:10.1088/0004-637x/809/2/158
Salman, T. M., Lugaz, N., Farrugia, C. J., Winslow, R. M., Jian, L. K., and Galvin, A. B. (2020a). Properties of the Sheath Regions of Coronal Mass Ejections With or Without Shocks From STEREO In Situ Observations Near 1 au. Astrophysical J. 904, 177. doi:10.3847/1538-4357/abbdf5
Salman, T. M., Winslow, R. M., and Lugaz, N. (2020b). Radial Evolution of Coronal Mass Ejections Between MESSENGER, Venus Express , STEREO, and L1: Catalog and Analysis. J. Geophys. Res. Space Phys. 125, e27084. doi:10.1029/2019JA027084
Schwenn, R., dal Lago, A., Huttunen, E., and Gonzalez, W. D. (2005). The Association of Coronal Mass Ejections With Their Effects Near the Earth. Ann. Geophys. 23, 1033–1059. doi:10.5194/angeo-23-1033-2005
Schwenn, R. (2006). Space Weather: The Solar Perspective. Living Rev. Solar Phys. 3, 2. doi:10.12942/lrsp-2006-2
Shen, C., Chi, Y., Wang, Y., Xu, M., and Wang, S. (2017). Statistical Comparison of the ICME's Geoeffectiveness of Different Types and Different Solar Phases From 1995 to 2014. J. Geophys. Res. Space Phys. 122, 5931–5948. doi:10.1002/2016JA023768
Siscoe, G., and Odstrcil, D. (2008). Ways in Which ICME Sheaths Differ From Magnetosheaths. J. Geophys. Res. 113, a–n. doi:10.1029/2008JA013142
Solanki, S. K., Wenzler, T., and Schmitt, D. (2008). Moments of the Latitudinal Dependence of the Sunspot Cycle: a New Diagnostic of Dynamo Models. Astron. Astrophysics. 483, 623–632. doi:10.1051/0004-6361:20054282
Stone, E. C., Frandsen, A. M., Mewaldt, R. A., Christian, E. R., Margolies, D., Ormes, J. F., et al. (1998). The Advanced Composition Explorer. Adv. Compost. Explorer Mission. 86, 1–22. doi:10.1007/978-94-011-4762-0_1
Takahashi, T., and Shibata, K. (2017). Sheath-Accumulating Propagation of Interplanetary Coronal Mass Ejection. Astrophysical J. 837, L17. doi:10.3847/2041-8213/aa624c
Temmer, M., Holzknecht, L., Dumbović, M., Vršnak, B., Sachdeva, N., Heinemann, S. G., et al. (2021). Deriving CME Density From Remote Sensing Data and Comparison to In‐Situ Measurements. J. Geophys. Res. Space Phys. 126, e28380. doi:10.1029/2020JA028380
Temmer, M., Rollett, T., Möstl, C., Veronig, A. M., Vršnak, B., and Odstrčil, D. (2011). Influence of the Ambient Solar Wind Flow on the Propagation Behavior of Interplanetary Coronal Mass Ejections. Astrophysical J. 743, 101. doi:10.1088/0004-637X/743/2/101
Temmer, M., Rybák, J., Bendík, P., Veronig, A., Vogler, F., Otruba, W., et al. (2006). Hemispheric sunspot Numbers ${R_{n}}$ and ${R_{s}}$ From 1945-2004: Catalogue and N-S Asymmetry Analysis for Solar Cycles 18-23. Astron. Astrophysics. 447, 735–743. doi:10.1051/0004-6361:20054060
Temmer, M., Veronig, A. M., Peinhart, V., and Vršnak, B. (2014). Asymmetry in the CME-CME Interaction Process for the Events From 2011 February 14-15. Astrophysical J. 785, 85. doi:10.1088/0004-637X/785/2/85
Vršnak, B., Žic, T., Vrbanec, D., Temmer, M., Rollett, T., Möstl, C., et al. (2013). Propagation of Interplanetary Coronal Mass Ejections: The Drag-Based Model. Sol. Phys. 285, 295–315. doi:10.1007/s11207-012-0035-4
Wang, C., Du, D., and Richardson, J. D. (2005). Characteristics of the Interplanetary Coronal Mass Ejections in the Heliosphere Between 0.3 and 5.4 AU. J. Geophys. Res. 110, A10107. doi:10.1029/2005JA011198
Wang, C., and Richardson, J. D. (2004). Interplanetary Coronal Mass Ejections Observed by Voyager 2 Between 1 and 30 AU. J. Geophys. Res. 109, A06104. doi:10.1029/2004JA010379
Wang, Y.-M., and Colaninno, R. (2014). Is Solar Cycle 24 Producing More Coronal Mass Ejections Than Cycle 23?. Astrophysical J. 784, L27. doi:10.1088/2041-8205/784/2/L27
Wang, Y., Shen, C., Liu, R., Liu, J., Guo, J., Li, X., et al. (2018). Understanding the Twist Distribution Inside Magnetic Flux Ropes by Anatomizing an Interplanetary Magnetic Cloud. J. Geophys. Res. (Space Physics). 123, 3238. doi:10.1002/2017ja024971
Webb, D. F., and Howard, T. A. (2012). Coronal Mass Ejections: Observations. Living Rev. Solar Phys. 9, 3. doi:10.12942/lrsp-2012-3
Wolf, R. (1861). Abstract of His Latest Results. Monthly Notices R. Astronomical Soc. 21, 77–78. doi:10.1093/mnras/21.3.77
Xie, H., Ofman, L., and Lawrence, G. (2004). Cone Model for Halo CMEs: Application to Space Weather Forecasting. J. Geophys. Res. 109, A03109. doi:10.1029/2003JA010226
Yashiro, S., Gopalswamy, N., Michalek, G., Cyr, St. O. C., Plunkett, S. P., Rich, N. B., et al. (2004). A Catalog of White Light Coronal Mass Ejections Observed by the SOHO Spacecraft. J. Geophys. Res. 109, A07105. doi:10.1029/2003JA010282
Zhang, J., Poomvises, W., and Richardson, I. G. (2008). Sizes and Relative Geoeffectiveness of Interplanetary Coronal Mass Ejections and the Preceding Shock Sheaths During Intense Storms in 1996-2005. Geophys. Res. Lett. 35, L02109. doi:10.1029/2007gl032045
Zhang, J., Richardson, I. G., Webb, D. F., Gopalswamy, N., Huttunen, E., Kasper, J. C., et al. (2007). Solar and Interplanetary Sources of Major Geomagnetic Storms (Dst≤ −100 nT) During 1996-2005. J. Geophys. Res. 112, a–n. doi:10.1029/2007JA012321
Keywords: sun, coronal mass ejections, expansion speeds, solar cycle, heliosphere
Citation: Mishra W, Doshi U and Srivastava N (2021) Radial Sizes and Expansion Behavior of ICMEs in Solar Cycles 23 and 24. Front. Astron. Space Sci. 8:713999. doi: 10.3389/fspas.2021.713999
Received: 24 May 2021; Accepted: 12 August 2021;
Published: 13 September 2021.
Edited by:
Teimuraz Zaqarashvili, University of Graz, AustriaReviewed by:
Manuela Temmer, University of Graz, AustriaHui Li, National Space Science Center (CAS), China
Copyright © 2021 Mishra , Doshi and Srivastava . This is an open-access article distributed under the terms of the Creative Commons Attribution License (CC BY). The use, distribution or reproduction in other forums is permitted, provided the original author(s) and the copyright owner(s) are credited and that the original publication in this journal is cited, in accordance with accepted academic practice. No use, distribution or reproduction is permitted which does not comply with these terms.
*Correspondence: Wageesh Mishra , d2FnZWVzaC5taXNocmFAaWlhcC5yZXMuaW4=