 David Garcia-Gragera1*
 Carolina Arnau1,2
 Enrique Peiro1,2
 Claude-Gilles Dussap3
 Laurent Poughon3
 Olivier Gerbi4
 Brigitte Lamaze5
 Christophe Lasseur5
 Francesc Godia1,2
- 1MELiSSA Pilot Plant – Claude Chipaux Laboratory, Universitat Autònoma de Barcelona, Barcelona, Spain
- 2CERES-IEEC, Campus UAB, Barcelona, Spain
- 3Institut Pascal, Université Clermont Auvergne, CNRS, Clermont-Ferrand, France
- 4Sherpa Engineering, Nanterre, France
- 5ESA-ESTEC, Noordwijk, Netherlands
MELiSSA (Micro Ecological Life Support System Alternative) is developing bioregenerative Life Support technologies for long-term Space missions. The MELiSSA concept is conceived as a loop with several compartments, each one performing a specific function, providing all together edible material production, atmosphere regeneration and water recovery with a concomitant use of wastes, i.e., CO2 and organic wastes. Each one of the compartments is colonized with specific bacteria or higher plants depending on its specific function. The MELiSSA Pilot Plant is a facility designed for the terrestrial demonstration of this concept, hosting laboratory rats as a crew mock-up mimicking the respiration of humans. Currently, the MELiSSA Pilot Plant focus on the integration of three compartments: Compartment 3 (nitrifying packed-bed bioreactor based on the co-culture of immobilized Nitrosomonas europaea and Nitrobacter winogradsky), compartment 4a (an air-lift photobioreactor for the culture of the edible cyanobacteria Limnospira indica with concomitant oxygen production) and Compartment 5 (an animal isolator with rats as mock-up crew). The output from these tests shows a high robustness and reliability and the performance of oxygen producing and oxygen consuming compartments is successfully demonstrated under transitory and steady-state conditions. This contribution reports on the current state of development of the MELiSSA Pilot Plant Facility and the most recent results of the integration work.
Introduction
The MELiSSA (Micro-Ecological Life Support System Alternative) project focusses on the development and integration of a system providing life support for long-term human missions in space (Mergeay et al., 1988), such as a base on Moon or Mars, and is led by the European Space Agency, in the context of an international consortium with 15 partners (Lasseur et al., 2010). The project approach is inspired in an ecological system by reproducing its main functions in specific compartments (Hendrickx et al., 2006). In the proposed closed loop structure, first, Compartments 1 and 2 are dedicated to the degradation of wastes, with a first step based on thermophilic bacteria and a second complementary step of biotransformation of the wastes. Compartment 3 performs nitrification and it is an aerobic bioreactor working with an axenic pure co-culture of Nitrosomonas and Nitrobacter autotrophic bacteria. This co-culture transforms ammonium (NH4+) to nitrite (NO2−) and then to nitrate (NO3−), the last one being a more assimilable form of nitrogen for the photosynthetic elements of the loop. Some Nitrospira related microorganisms have been discovered over the past years that perform complete ammonium oxidation to nitrate in one organism, instead of the two-stage nitrification, such as Nitrospira inopinata (Daims et al., 2015). It is considered a promising discovery, but so far their application in a scenario of intensive bioprocessing has not yet been achieved to fulfill the MELiSSA and urine nitrification requirements. Hence, the canonical two-stage nitrification as selected originally for MELiSSA has been maintained. Compartment 4a and 4b are dedicated to oxygen, water and edible biomass production from the consumption of CO2, evapo-transpiration and using light as energy source, and they are a photobioreactor (PBR) working with an axenic pure culture of the cyanobacteria Limnospira indica and a higher plant compartment for the culture of three representative plants [Lactuca sativa (lettuce), Triticum aestivum (wheat) and Beta vulgaris (red beet)], respectively. Finally, Compartment 5 corresponds to the animal isolator, in which a group of rats is used to mimic the crew. The animals are basically connected to the rest of the loop in the gas phase to demonstrate the atmosphere regeneration to support breathing. A complete illustration of the loop is shown in Figure 1 Those compartments are operated in continuous mode for long-term periods under controlled conditions, based on the use of mathematical models developed for each compartment, and are connected one to each other through various interfaces (gas, liquid and solid). Overall, the system should provide the essential functions of life support: food production, air regeneration, water reclamation and waste treatment when fully developed, and represents a unique effort in the development of life support systems enhancing the self-sustainability of human activities in Space.
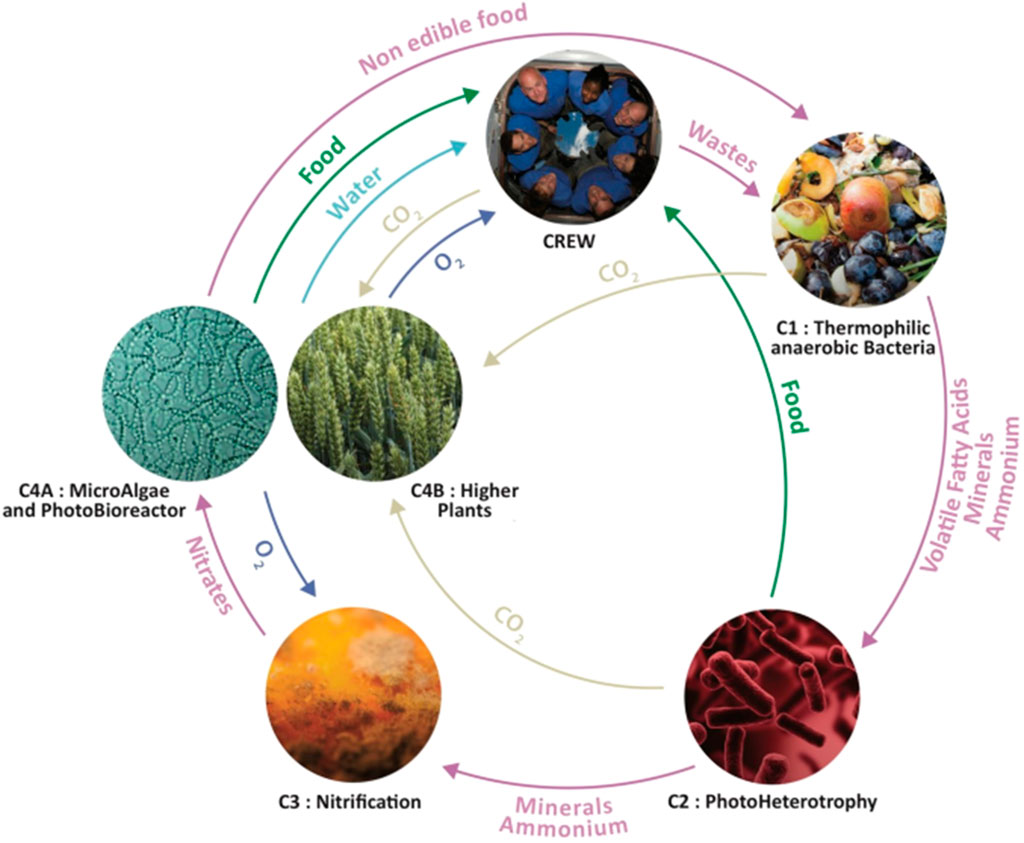
FIGURE 1. Scheme of the MELiSSA loop concept. All the 5 compartments are presented in circles. Interphases with nutrient, water and gas exchanges are presented with arrows. Source: www.melissafoundation.org.
Taking into consideration the complexity of these proposed system, the MELiSSA Consortium has developed the MELiSSA Pilot Plant (MPP) with the main goal of demonstrating long-term continuous operation feasibility under the supervision of a control system (Gòdia et al., 2004; Poughon et al., 2009) with knowledge-based models that reproduce each compartment’s individual characterization and intercompartment dynamics. Thus, in this pilot plant, the different compartments have been scaled-up to achieve the oxygen production equivalent to the respiration needs of one human (0.84 kg·d−1) (Wieland, 2005), with 20–40% concomitant production of edible material. The MPP is developed using terrestrial conditions, with the main objective to demonstrate the feasibility of the MELiSSA loop concept, using an industrial approach based on systems engineering, operating under high quality standards, including clean room operation for the area hosting axenic compartments (Compartments 3 and 4a). This dedicated facility to MELiSSA loop demonstration is located at Universitat Autònoma de Barcelona and it is a European Space Agency external laboratory. To note, MELiSSA Consortium is performing in parallel studies to test MELiSSA compartments at Space conditions as well as studies on the application of the MELiSSA technology to Earth in order to foster circular systems.
The MELiSSA Pilot Plant is developed in a stepwise approach. First, the individual compartments have been designed according to the final scenario of the MPP based on the research work done previously to characterize them and develop their mathematical models. Once manufactured and installed in the MPP site, the compartments, associated instrumentation and auxiliary equipment have been operated and fully characterized for a wide range of operational conditions, while testing simultaneously the monitoring and control elements developed for each one of them. Second, the so called integration phase has followed. This phase implies the progressive connection of the compartments, involving gas, liquid and solid phases. Today, the integration work is at the level of connecting Compartment 3 (nitrification), Compartment 4a (photosynthesis) and Compartment 5 (crew compartment), both in gas and liquid phase. The results of the integration are reported in this contribution and have been obtained in three consecutive steps. First, compartments 4a and 5 have been connected in close loop in the gas phase. The results from this first connection have been reported previously (Alemany et al., 2019). Second, compartments 3 and 4a have been connected in the liquid phase. Third, the two previous connections have been combined, so, compartments 5 and 4a connected in gas phase and 3 and 4a connected in liquid phase. Each integration step has been operated for long-term periods (several months of continuous operation) under different operational conditions, including several steady-state conditions and the corresponding transitory phases. In the following, the results obtained in the last two steps of integration are discussed, representing a step forward in the integration of the building blocks that should lead to the demonstration of the MELiSSA loop concept and envisage how it would contribute to human exploration missions in Space.
Materials and Methods
Nitrifying Reactor (Compartment 3) Description
The nitrification compartment (Compartment 3) is a cylindrical packed-bed bioreactor of 7 L operation volume (SNC-Lavalin, Brussels, Belgium and Bioprocess Technologies, Madrid, Spain). It is packed with polystyrene beads and colonized by a co-culture of Nitrosomonas europaea and Nitrobacter winogradsky that grow forming a biofilm. N. europaea is a Ammonia Oxidizing Bacteria (AOB) capable to oxidize ammonia into nitrite. Then, complete nitrification is achieved by the oxidation of nitrite into nitrate by the Nitrite Oxidizing Bacteria (NOB) N. winogradsky. 2 mol of oxygen are needed for the complete oxidation of 1 mol of N-NH4+ making it an aerobic process. On top of the central packed-bed section, the reactor has a bottom section, mechanically stirred, where fresh liquid feeding, liquid recirculation inlet and gas sparging take place. There is as well a top section after the packed-bed for gas-liquid separation, and liquid and recirculation outlets. Both top and bottom section hold the instrumentation for on-line monitoring of the compartment (pH, T, pO2, conductivity). It is operated in a recirculation closed gas-loop mode regulated by means of a mass flow-meter (Bronkhorst, F-202D-FA, Bronkhorst, Ruurlo, Netherlands). pH is measured by means of two sterilizable glass pH probe connected to a pH amplifier (Mettler Toledo, Inpro 3253, Greifensee Switzerland). pO2 is measured by means of two Clark amperometric sensor (Mettler Toledo, InPro6950i/12/320, Greifensee, Switzerland) (see Figure 2).
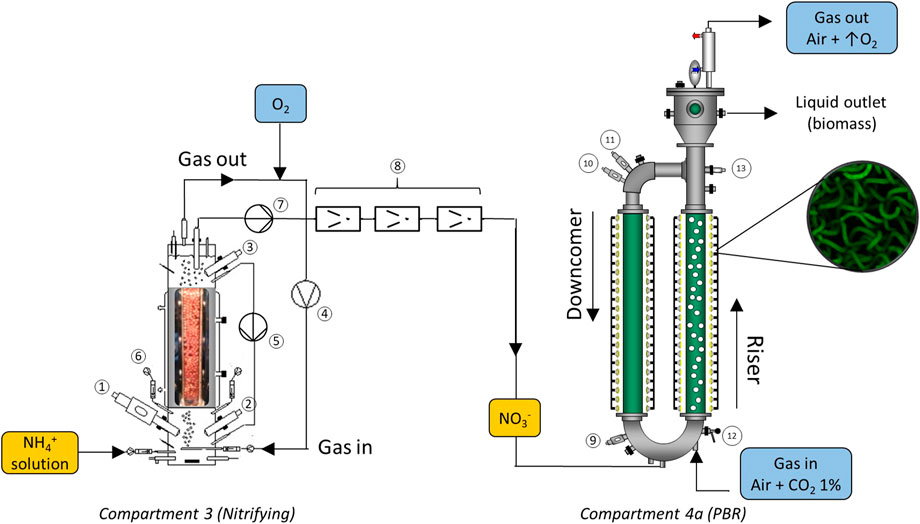
FIGURE 2. Diagram for liquid connection between nitrifying and photosynthetic compartments (3-C4a). Nutrient solution containing ammonium is fed into Compartment 3 where nitrification takes place. The output containing nitrate is pumped into Compartment 4a for photosynthesis. Nitrifying bioreactor elements: 1-pH sensor, 2,3 pO2 sensors, 4-recirculating gas closed-loop, 5-liquid recirculation loop, 6-acid and base additions, 7-outlet pumping system, 8-filtration system to avoid nitrifying bacteria reaching the photobioreactor. Photobioreactor elements: 9,10-pH sensors, 11-pO2 sensor, 12-sampling valve, 13-biomass sensor.
Photobioreactor (Compartment 4a) Description
The photobioreactor compartment (Compartment 4a) is an 83L external-loop gas lift photobioreactor (Bioengineering Ag, Wald, Switzerland). It is used for Limnospira indica cultivation. The reactor consists of two glass cylindrical tubes with 15 cm diameter and 1.5 m height with an illuminated volume of 55 L. Illumination is provided by 350 halogen lamps (MR16HM, (12 V, 20 W), Sylvania, Mississuaga, Ontario, Canada) around the glass tubes and can be adjusted by the control system of the loop in order to regulate oxygen production. The upper and lower parts of the tubes are connected by U-shaped stainless steel sections that allow improved liquid circulation and heat exchange through an external jacket. The gas phase is injected through the bottom of the right column (riser) and exits from the gas separation section situated at the top of that same column, which creates a difference of density that allows the fluid to return through the left column (downcomer) (see Figure 2).
For continuous operation of the bioreactor during the experiment, the inlet feed medium is pumped by a variable speed gear pump (Lewa, EEC0002S11, Hispania S.L., Leonberg, Germany) followed by a 0.2 µm filtration (MCY4440DFLPH4, Pall Corporation, New York, United States). Outlet flow is regulated with a second variable speed gear pump (Lewa Hispania S.L., EEC0002S11, Leonberg, Germany) Inlet and outlet air supply is regulated and measured by means of three flow-meters and controllers (Bronkhorst, F-202D-FA, Bronkhorst, Ruurlo, Netherlands). pH is measured by means of a conventional sterilizable glass pH probe connected to a pH amplifier (Mettler Toledo, Inpro 3253, Switzerland). Control of pH is performed by addition of NaOH (2 M) or H2SO4 (2 M) as required. The composition of the outlet gas is continuously monitored on-line by a IR analyser for CO2 and a paramagnetic analyser for O2 (600 series, CAI, United States).
Animal Compartment Description
The crew mock-up compartment (Compartment 5) is an animal isolator of 1550 L volume (Hosokawa Micron Ltd., Runcorn, UK). It is divided in three zones: main chamber, transfer air-lock and recirculation loop. It is designed to host the animal crew with artificial light at periods of 12–12 h day-night cycles. It includes six 250 mm round glove ports at the front of the isolator to perform the animal support operations.
In the main chamber, an overpressure of 200 Pa is maintained by pressure control through two pressure transmitters (Rosemount, 2051 CG1,Shakopee, Minnesota, United States). An external 250 L buffer tank is connected to the isolator to compensate the effects of atmospheric pressure changes. Temperature and humidity in the isolator are monitored by the use of two transmitters (Vaisala, HMT337, Helsinki, Finland) and controlled at 22°C and 55%, respectively. A gas recirculation loop ensures a homogenous distribution of air in the isolator using a recirculation flow of 90 m3·h−1. An active carbon filter is installed (Bi-On® ACPA, Bioconservación, Barcelona, Spain) in order to avoid accumulation of contaminants during long operational periods. CO2 and O2 are measured on-line through an IR and paramagnetic analyzers respectively (SICK-Maihak, GSM810, Hamburg, Germany). Finally, the transfer airlock operates with an independent pressure control to allow the entry and exit of materials (cages, food, bedding, etc.) without affecting the main isolator variables.
Three Wistar rats (Charles River Laboratories, Domaine des Oncins, France) with an age of 12 weeks were selected as the suitable crew model for inhabiting the isolator and running the experiments. The rational for the animals selection has been described previously (Alemany et al., 2019). A different group of rats is used for each experimental condition where different liquid flow rates of the liquid loop are tested. The rats are fed with an ab libitum diet (Teckad 2914, Envigo, United States). Weekly monitoring of the rats weight is performed.
Cell Strains and Culture Media
Nitrobacter winogradsky and Nitrosomonas europaea were provided by DSMZ, (Germany) for nitrifying bioreactor culture. Limnospira indica PCC 8005 was provided by SCK CEN (Mol, Belgium) for PBR cultivation. The strains were grown axenically during the experiment in their corresponding bioreactor. Culture media was a combination of a modified Zarrouk medium (Cogne et al., 2003) and the medium defined in the literature for nitrifying cultures (Pérez et al., 2004): 1.358 g·L−1 of (NH4)2SO4, 1 g·L−1 of K2SO4, 1 g·L−1 of NaCl, 0.816 g·L−1 of NaHCO3, 0.71 of Na2HPO4, 0.68 of KH2PO4, 0.5 of K2HPO4, 0.1 g·L−1 of MgSO4·7H2O, 0.18 g·L−1 of (NH4)6Mo7O2·4H2O, 0.08 g·L−1 EDTA-2Na·2H2O, 0.01 g·L−1 of FeSO4·7H2O, 0.04 g·L−1 of CaCl2·2H2O, 1.81 mg·L−1 of MnCl2·4H2O, 0.22 mg·L−1 of ZnSO4·7H2O, and 0.079 mg·L−1 of CuSO4·5H2O.
Liquid Connection Between Compartment 3 and 4a
A liquid stream was constantly supplied from a reservoir tank to the inlet of the nitrifying bioreactor. Liquid effluent from nitrifying bioreactor was constantly processed by a three-step filtration to maintain axenicity in both bioreactors. This was a critical operation to avoid any cells detached from Compartment 3 biofilm reaching Compartment 4a, with the associated contamination effects. The effluent from nitrifying bioreactor was pumped to the inlet of the PBR with a gear pump (Lewa, EEC0002S11, Hispania S.L., Leonberg, Germany). A variable peristaltic pump (Watson-Marlow 323Du, Watson Marlow Fluid Technology Group, Wilmington, United States) at the nitrifying bioreactor outlet was used to keep an overpressure in the liquid connection line at 200 mbarg. Finally, the PBR effluent was continuously collected in a harvesting tank (see Figure 2).
A set of different liquid flow rates corresponding to three NH4+ loads (ppm·d−1) into compartment 3 were initially tested: 10, 20 and 30 L·d−1. A combination of testing conditions was defined by setting two illumination levels (qo): 120 and 285 W·m−2. So, a total of six conditions were tested. Operational conditions in the PBR were stablished as follows: pH was set at nominal value of 8.5, CO2 was constantly injected at 1% composition in the air inlet at a total gas flow of 2.8 L·min−1 and temperature was set at 36°C. Conditions in Compartment 3 were as follows: pH was controlled at 8.1 by the addition of H2SO4 (0.1 M) and KOH (1.9 M), pO2 was maintained at 80% thanks to the injection of external pure O2 into the recirculation closed gas-loop, a recirculation liquid flow between the top and bottom section of the bioreactor was set at 4.5 L·h−1 to improve the homogeneity and temperature was set at 30°C.
Gas Connection Between Compartments 4a and 5
The animal isolator was connected to the PBR at the entrance and output of the compartment so that closed gas loop was established by using a diaphragm vacuum pump (GAST, 22D1180-202-1005, Benton Harbor, Michigan, United States).
After completion of previous tests, involving Compartments 3 and 4a in the liquid phase, a new series of experiments was carried out. Now, the animal isolator was connected in the gas phase to the PBR, and liquid connection between nitrifying bioreactor and PBR was maintained (see Figure 3). Therefore, the three compartments were connected. In this scenario, the liquid flow-rate was increased to 20, 30 and 40 L·d−1 and the N-NH4+ concentration was maintained at 300 ppm at 20 and 30 L·d−1, while it was decreased to 240 ppm at 40 L·d−1. The main control variable of these experiments was the light intensity of the PBR. The control system adjusted the light intensity to maintain an O2 concentration set-point in the animal isolator and compensating the animals oxygen needs along the day/night cycles. For each liquid loop flow rate condition, the O2 set-point in the isolator was sequentially changed following this sequence: 21–19-20–21%. The rationale between this operation schedule was to test the capacity of the control system to adjust the illumination conditions in the PBR each time a new O2 set-point was fixed in the animal isolator. Additionally, the experimental period at a given flow rate between the nitrifying bioreactor and PBR coincided with a new group of rats in the isolator.
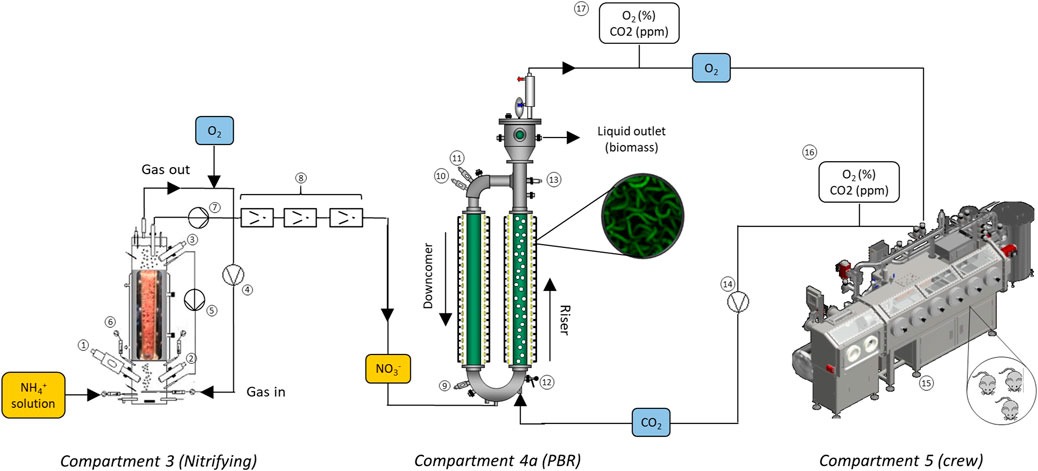
FIGURE 3. Diagram for liquid connection between intriguing and photosynthetic compartments (C3-C4a), and gas connection between compartment 5 (animal isolator) and compartment 4a. The gas phase from the PBR (rich in O2) is send to the isolator. Then, the gas rich in CO2 is pumped back to the PBR. Compartment elements: see Panel 2 for elements from 1 to 13, 14-gas connection line between C4a and C5, 15-animal isolator, 16-gas analyser in C5, 17-gas analyser in C4a outlet.
Biomass Concentration Determination
Off-line monitoring of biomass in the PBR was carried out by cell dry weight (CDW) determination and OD measurement. For CDW, 25–50 ml of culture broth were filtered through a 47 mm-glass microfiber (GMFC-52047, Scharlab, Barcelona, Spain), dried at 105°C until constant weight. OD measurement was performed at 750 nm in an optical spectrophotometer (UV-VIS DR6000, Hach, Düsseldorf, Germany).
TIC Total Inorganic Carbon and Nitrogen Determination
Filtered fractions for biomass determination in the PBR were used for NO3− and TIC analysis. Samples were diluted 1:100 with milli-Q H2O and NO3− was analysed by spectrophotometry with LCK 339 kits (Hach, Weinheim, Germany). For TIC determination a 1:5 dilution with milli-Q H2O was required. 1.5 ml of sample were loaded to a multi N/C2100S equipment (Analytik Jena, Jena Germany). 200 µL from the sample were injected into the acidic TIC reactor and 0.5 ml of H3PO4 at 10% were added to the chamber. CO2 generated from the acidification was detected by the NDIR detector and quantified by triplicate.
In Compartment 3, NO3− at the bioreactor outlet was analysed following the same method as in Compartment 4a. NH4+ and NO2− were analysed with LCK 303/304 and LCK 342 (Hach, Weinheim, Germany).
Gas Analysis, O2 Production and CO2 Consumption
Outlet gas composition from the PBR was measured on-line by an IR analyser for CO2 coupled to a paramagnetic analyser for O2 (600 series CAI, Orange, California, United States). In the case of Compartment 4a and 3 liquid connection, oxygen volumetric production rate (g·L−1·h−1) was calculated on-line based on continuous monitoring of outlet gas composition in the PBR:
where Fin is the inlet air flow rate, FCO2 is the inlet CO2 flow rate, Fout is the total outlet gas flow rate, O2out is the outlet mole fraction of O2 in %, MWO2 is the molecular weight of O2 (32 g·mol−1). The flow rates are expressed at normal conditions (T = 273.15 K; p = 1 atm). In the case of the second integration step (Compartments 5 and 4a connected in the gas phase and 3 and 4a connected in the liquid phase), the inlet gas composition of PBR is analysed by means of the gas analyser in compartment 5. Then, oxygen volumetric production rate in PBR is calculated as follows:
where O2in is the inlet mole fraction of O2 (%) in the PBR.
PBR CO2 consumption was calculated for each condition considering on-line gas analysis and off-line TIC concentration in the steady state. In such situation, no carbon accumulation takes place and CO2 can be calculated in g·L−1·h−1 by means of the following mass balance:
where CLOUT is the carbon concentration (g·L−1) in the liquid outlet converted into CO2 by means of molecular weight, D is the dilution rate (h−1), Fin (L·h−1) is the bioreactor gas flow rate, XCOUT is the molar fraction of CO2 in the outlet gas, XCIN is the molar fraction of CO2 in the inlet gas and MWCO2 is the molecular weight of O2 (44 g·mol−1). When PBR and animal compartment where connected in the gas phase, XCIN was the corresponding CO2 concentration in the animal compartment.
Considering that O2 was the controlled variable in the animal compartment, O2 consumption in animal compartment was assumed to be the same as O2 production in the PBR. In the case of CO2 consumption (g·h−1) of the rats, calculation was as follows:
where XCOUT5 and XCIN5 are the molar fractions of CO2 at the outlet and inlet of animal compartment respectively.
Statistical Analysis
One-way ANOVA analysis assuming differences in variances was performed to assess variability of O2 generation of the system. This statistical approach was also used to study the differences in body weight of the animals. A significance value of p < 0.05 was considered in all cases.
Results
Compartment 3 and 4a Liquid Connection
Nitrifying bioreactor and PBR are connected in the liquid phase in continuous operation mode for a total period of 276 days. The nitrification compartment provides the necessary nitrogen source for the growth of cyanobacteria (Clauwaert et al., 2017) A total of six different conditions were tested corresponding to three different ammonium loads: 435, 870, and 1300 ppm·d−1 into Compartment 3 at 10, 20, and 30 L·d−1 respectively. These flow rate conditions are combined with two levels for qo in the PBR: 120 and 285 W·m−2.
Figures 4D–F presents the operation profile of the PBR in terms of oxygen production and biomass cell density for the complete series of experimgents. In all the tested conditions steady state in the PBR is achieved as it is maintained with stable parameters for a period of at least 3 Hydraulic Residence Times (HRT) for each condition. The highest biomass concentration is obtained for 10 L·d−1 condition (Figure 4E with values between 2.1 and 2.2 g·L−1, while the lowest cell density is reached at 30 L·d−1 (Figure 4F) with values between 0.9 and 1.1 g·L−1. On the contrary, the highest biomass productivity results from 30 L·d−1 conditions, followed by 20 and 10 L·d−1 respectively. On-line oxygen production monitoring is also presented in Figure 4. The dynamics of the system can be observed for each qo increase followed by a stabilisation profile. The highest oxygen production is reached at 30 L·d−1 condition (between 2.1 and 2.7 g·h−1) while the lowest production occurs at 10 L·d−1 (1.4–1.7 g·h−1). The same pattern is also observed from specific production values (qO2). Detailed data are presented in Table 1. Figure 5 reflects the influence of light and flow in the performance of the PBR in terms of oxygen and biomass production. A Pareto’s ANOVA was performed to study the influence of those factors. The liquid flow is the factor showing the greatest effect on biomass and oxygen production. The influence of flow on biomass concentration is 85%, while it is 69% for oxygen production. In contrast, light intensity shows little influence in biomass concentration (4%), while its contribution increases up to 21% regarding oxygen production. The interaction effect between factors in both cases is at 11 and 10% respectively.
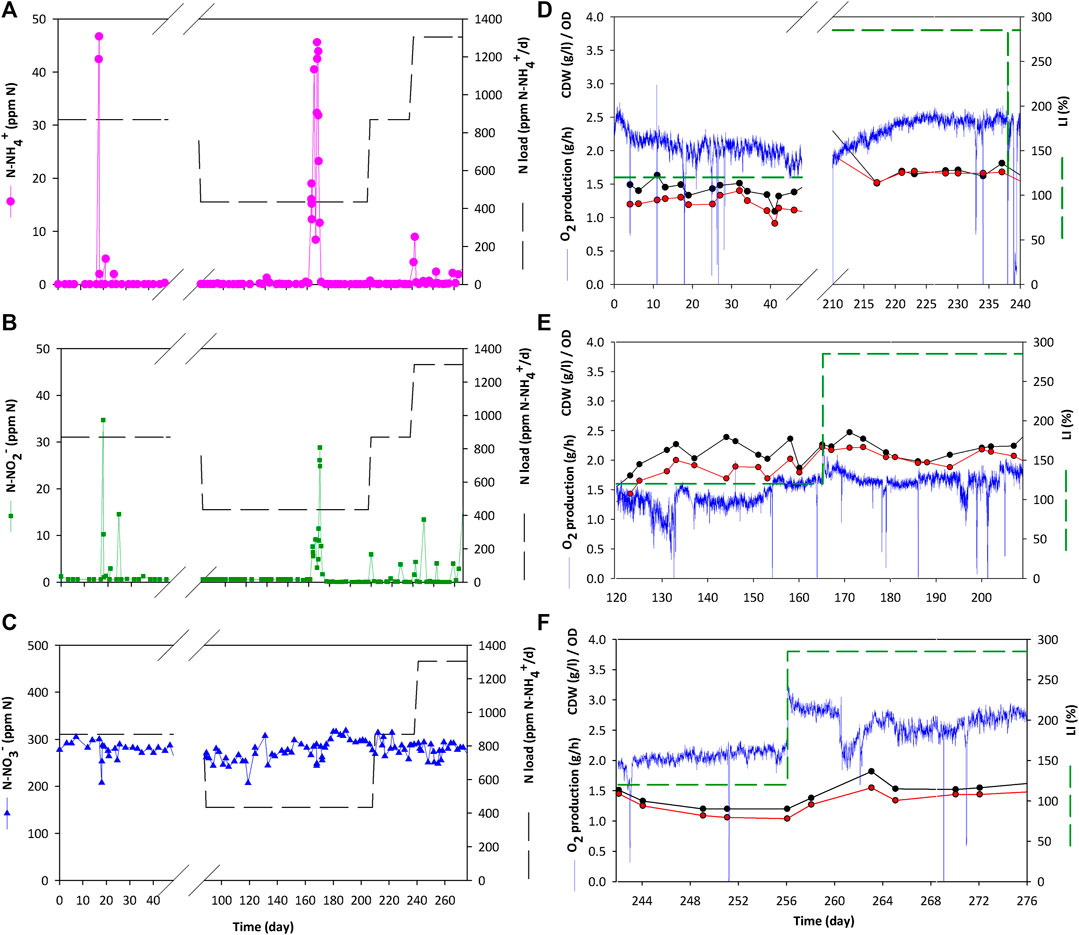
FIGURE 4. Results for integration experiments between nitrifying and photosynthetic compartment. Panels (A–C) show the nitrogen species at the nitrification bioreactor outlet. N-NH4+ concentration is presented in dotted pink points. N-NO2- is presented in square green points. And N-NO3- is displayed in blue triangle points. Panels (E–F) illustrates the oxygen production and biomass content in the PBR for different combinations of light and liquid flow rate [(D) 20 L·d−1; (E) 10 L·d−1; (F) 30 L·d−1]. Light intensity is presented in dashed green line, O2 production is showed in solid blue lines, biomass related parameters are displayed in black and red dotted points for CDW and OD respectively.
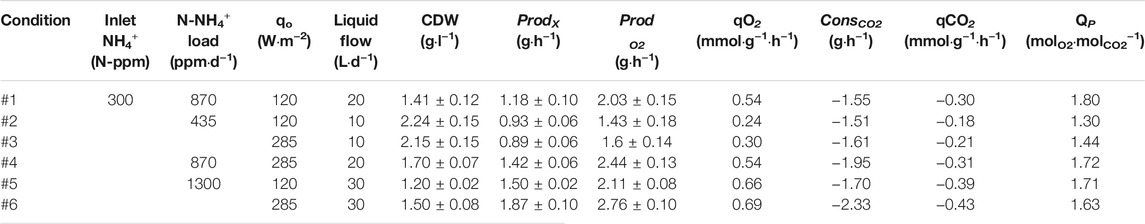
TABLE 1. Tested conditions and results in PBR for liquid connection between Compartment 3 (nitrification) and 4 (PBR).
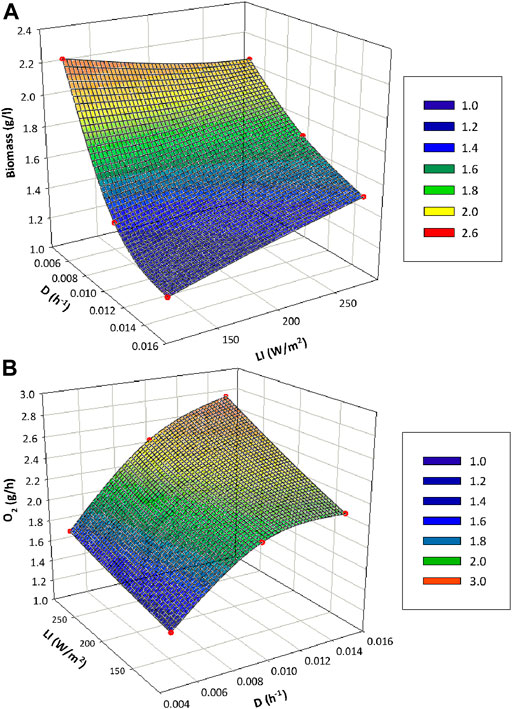
FIGURE 5. Influence of light and liquid flow rate in the performance of the PBR in terms of biomass content (A) and oxygen production (B). The individual point data is interpolated to reach the mesh representation.
Values from carbon dioxide consumption in the PBR are also presented in Table 1, showing that carbon dioxide consumption by L. indica increases in correspondence with oxygen production. 2.3 g CO2·h−1 are consumed when the cells are exposed to the maximum qo of 285 W·m−2 at a continuous flow of 30 L·d−1. The minimum carbon dioxide consumption is found at the lowest flow rate of 10 L·d−1 and minimum light intensity (120 W·m−2). Photosynthetic quotient ranges between 1.3 and 1.8 molO2·molCO2−1, which is in agreement with theoretical values between 1.2 and 1.4 when NO3− is used as nitrogen source according to the stoichiometry (Cornet, 2007).
In terms of N balance, all the nitrogen supplied to compartment 4 is in form of NO3− previously converted from NH4+ in compartment 3. The ammonium conversion is maintained at 99% during most of the experiment (Figures 4A–C). Only minor transitory peaks occur because of operation activities in the bioreactor focused on biomass removal with an external circulation system coupled with filtration for biomass retention. During these short periods the maximum N-NH4+ and N-NO2- concentration in the PBR is 0.1 and 1 ppm respectively (data not shown) and therefore can be considered negligible. The outlet N-NO3- concentration from the nitrifying bioreactor is between 275 and 300 N-ppm (Table 2). Yield values are higher than 90%, whilst conversion of ammonium is at 99% during all steady states (transitory peaks are not considered). The yield is higher (96–99%) with the lowest ammonium load of 435 N-ppm·d−1, but the yield decreases (91–93%) when the load increases to 870 and 1300 ppm·d−1. Inlet N-NH4+ into nitrifying bioreactor was maintained constant at 300 N-ppm for all conditions, resulting in different ammonium loads depending on the liquid flow rate. The output from nitrifying bioreactor was the inlet of the PBR, so YN/X was calculated considering that input. Results show that YN/X is maintained constant no matter the experimental condition used. 0.10–0.11 g of N-NO3- are needed to generate 1 g of biomass. In terms of oxygen as a product, YN/O2 is between 0.06 and 0.07 g·g−1 in all tested conditions. The yields obtained fit with the reaction stoichiometry described in previous works (Cornet et al., 1998).
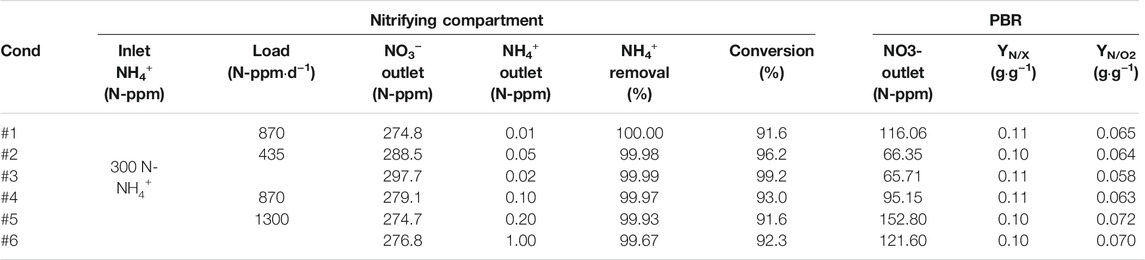
TABLE 2. Nitrogen balances observed in nitrifying bioreactor for every experimental condition during liquid connection experiments between nitrifying and photosynthetic compartment. The outlet of NO3− from nitrifying bioreactor is considered as the inlet concentration in the PBR.
Compartment 3 and 4 Liquid Connection Combined with Compartment 4a and 5 Gas Connection
Gas Phase Performance
The connection between the PBR and the animal isolator was conducted during 110 days Three female Wistar rats were connected in the gas phase with the PBR, which provided the oxygen needed in the animal isolator to maintain the oxygen atmospheric concentration at the target value (21–19 to 20–21%). On the other hand, the carbon dioxide produced by the rats was supplied to the PBR to cover the carbon needs for photosynthetic activity. In parallel, the nitrogen needs of the PBR were supplied by the nitrifying bioreactor after complete removal of ammonium and conversion into nitrate. Different liquid flows between nitrifying bioreactor and the PBR (20-30-40 L·d−1, each one with a different group of rats in the animal isolator for age reasons) were tested in order to assess the effect of hydraulic changes in the PBR.
Figure 6A provides the gas phase evolution of the animal isolator and the PBR. The oxygen concentration of the isolator is controlled first at the set-point of 21% following the sequential changes (21–19 to 20–21%) for each animal group. A repetitive cyclic pattern in the oxygen concentration profile is observed, caused by the circadian activity (day and night cycles) of the rats. Light irradiance in C4a changes likewise to adapt the oxygen production to the animals needs. Changes in oxygen set-point concentration are made when 6 HRT are reached in the PBR. During oxygen set-point decrease (from 21 to 19%), the control system turns off the lights and it takes 30, 26 and 20 h for the first, second and third group of rats respectively to reach the target value. In transition periods where the oxygen set-point is increased from 19 to 20%, the lights are set by the control system to the maximum intensity (285 W·m−2) and it takes 8, 7.8 and 19.5 h for each group respectively to reach the target set-point. Finally, when oxygen set-point is increased from 20 to 21% the transition takes 8.5, 8.3 and 19.8 h respectively. Figure 6B focuses in the carbon dioxide concentration of the animal isolator and the PBR. Carbon dioxide in the animal isolator is kept between 12,000 and 16,000 ppm (1.2–1.6%) during all the test, except for the period between day 55–60, when it reaches 18,000 ppm because of a perturbation in the gas flow exchange between the PBR and animal isolator. However, normal values are recovered afterwards. The cyclic biological activity of the rats during day and night is also observed in carbon dioxide dynamics.
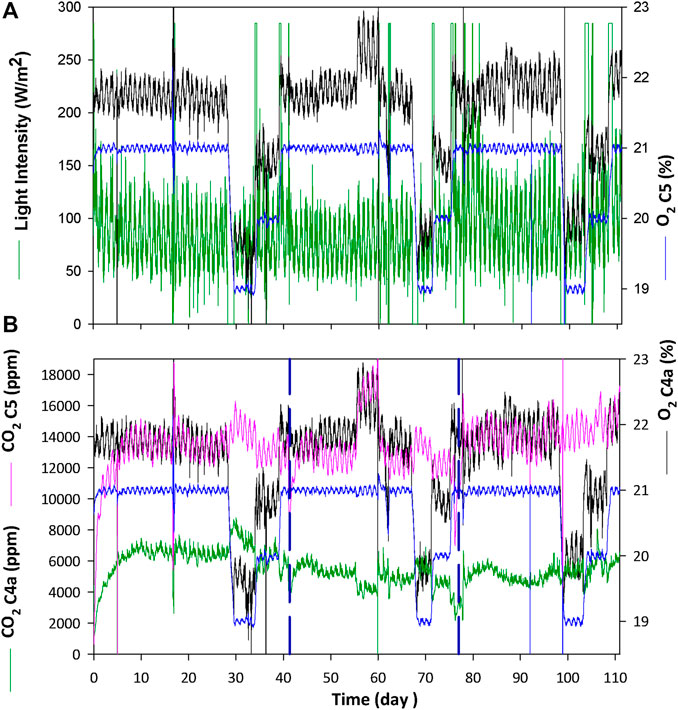
FIGURE 6. Gas phase results for the gas interface connection between the PBR and the crew compartment during the experimental period of 111 days. The same oxygen set-point conditions in the crew compartment are repeated for each liquid flow rate tested in the PBR, which are indicated by vertical dashed lines in graph (B). Graph (A) focuses on the oxygen profile between compartments and light intensity in the PBR (Green: light intensity in PBR; Blue: O2% in animal isolator; Black: O2% at the PBR outlet). Graph (B) shows the behaviour of carbon dioxide composition (Green: CO2 at PBR outlet; Pink: CO2 in Animal isolator; Blue: O2% in animal isolator; Black: O2% at the PBR outlet).
Results for oxygen production in the PBR, carbon dioxide production by the crew and light intensity for each group of animals and for each oxygen concentration in the isolator are presented in Figures 7A–C. The average oxygen needs of the rats are different for each group and consequently the oxygen production. The average oxygen production by the PBR is 1.5, 1.9 and 2.1 g·h−1 for the first, second and third group respectively during the 21% set-point. The same pattern is observed for 19 and 20% concentration. Regarding carbon dioxide generation of the rats. 2.3, 2.4 and 3.0 g·h−1 are produced by each group at 21% O2 concentration. RQ of the rats at 21% is 1.0, 0.9 and 0.97 molO2·molCO2−1 for each group (data not shown). Average light intensity (
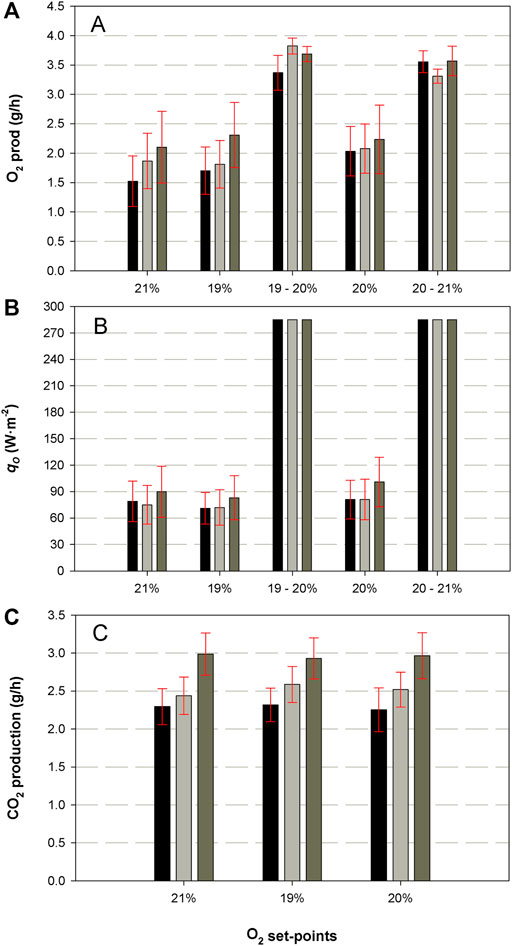
FIGURE 7. Results for oxygen production (A) and light irradiance (B) in the PBR during the integration with the crew compartment. Carbon dioxide production by the crew compartment are presented in (C). These values are presented for each O2% set-point concentration in the animal isolator. Black, grey and brown columns correspond to the first, second and third group of rats respectively.
Table 3 shows the results obtained in the PBR. Biomass concentration is different depending on the group (and flow) tested. In the steady state, which takes place at 21% oxygen set-point, the highest concentration is 1.24 g·L−1 when the system works at 20 L·d−1. The lowest concentration, 0.81 g·L−1 is observed in the last group of rats when inlet liquid flow rate in the PBR is 40 L·d−1. Changes within the same group are also observed for each oxygen set-point. Carbon dioxide uptake is only presented at 21% set-point condition as stability of TIC concentration in the liquid phase of the PBR is only achieved at 21% after 6 HRT. Maximum carbon dioxide demand is 2.18 g·h−1 at 20L·d−1 (first group). Similar uptake is observed for the other tested groups (1.92 and 2.08 g·h−1). Specific oxygen production rates and carbon dioxide consumption rates (qO2 and qCO2) increases for each group of rats sequentially, indicating a higher efficiency in oxygen production, but also a higher carbon dioxide demand. PQ ranges between 1 and 1.4.
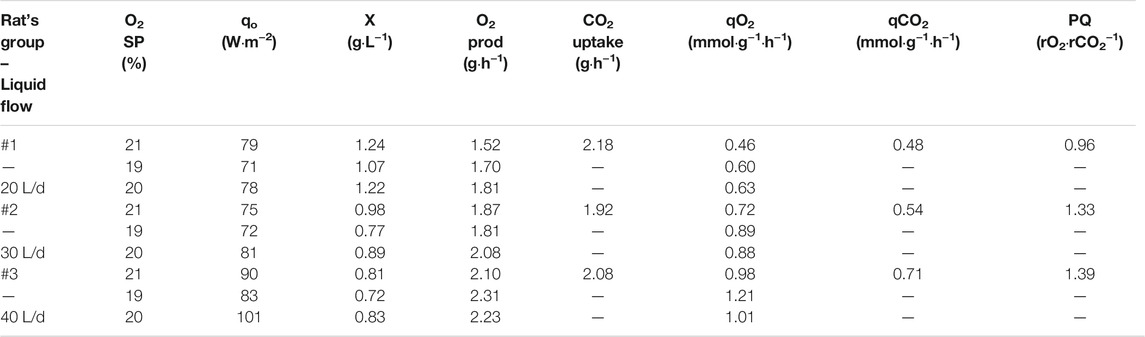
TABLE 3. PBR performance results in terms of O2 and CO2 generation and biomass concentration reached for every condition. CO2 uptake is only expressed at 21% O2 set-point as liquid phase is not stable at 19 and 20% leading to variability in TIC concentration.
Finally, the daily monitoring of the rats (Figure 8) shows that the weight gain differs between groups. Average weight gain of the first group is 0.77 g·d−1·rat−1, followed by the second group (1.35 g·d−1·rat−1) and the third group (1.30 g·d−1·rat−1). The fourth group of rats, which corresponds to the control group, showed a weight gain of 1.75 g·d−1·rat−1. Pearson’s correlation shows a positive correlation between the starting weight of the rats and the weight gain rate (r = 0.95; p < 0.05). All the animal groups did not show any relevant alteration in their physiological parameters, behaviour or clinical evaluation. Food and water intake are normal in all the groups (data not shown).
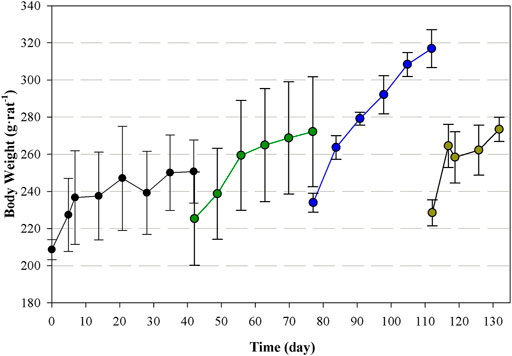
FIGURE 8. Body weight for each group of rats (first: black; second: green; third: blue) during their corresponding experimental period. The last group of rats (brown) corresponds to the control group.
Liquid Phase Results
As mentioned, nitrogen in form of NO3− was provided to the PBR through the liquid phase, which was connected to the outlet of the nitrifying bioreactor. Nitrification profile during the whole experiment is presented in Figure 9. Ammonium conversion is maintained at 100% and no accumulation of nitrite nor ammonium takes place during the first hydrodynamic condition (20 L·d−1) at 870 ppm·d−1. In the second experimental period (30 L·d−1) a peak of nitrite (187 N-ppm) and ammonium (46 N-ppm) is measured at the outlet of nitrifying bioreactor on day 60, probably caused by the biomass removal in the packed-bed as a nominal operation (excess biomass accumulation is removed periodically from the packed-bed to avoid clogging). Recovery of the complete nitrification takes place within 6 days. In the last hydraulic condition (40 L·d−1) the tested nitrogen load of 1740 results in ammonium (78 N-ppm) and nitrite (186 N-ppm) accumulation at the bioreactor outlet, therefore showing that the maximum load capacity was achieved. Then, the system is recovered after decreasing the nitrogen load to 1400 ppm·d−1, reaching total nitrification as in previous conditions. Finally, at the end of the same hydraulic condition, a third and last nitrite pick (113 N-ppm) occurs due to a second operation to control biomass in the bioreactor to avoid clogging. Those peaks are translated in a slight presence of nitrite in the PBR: maximum concentration of 78, 58 and 36 N-ppm respectively. No presence of ammonium is detected in the PBR. In the first and second cases, the presence of nitrite in the PBR is translated into a light intensity increase reaching maximum qo during night periods (data not shown), except in the last group.
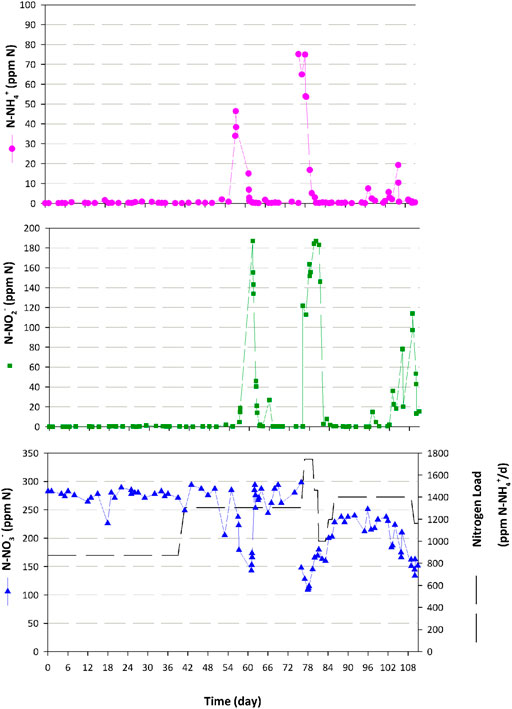
FIGURE 9. Nitrogen species at the nitrification compartment outlet during the integration experiments where Compartment 3 and 4a are connected in the liquid phase and Compartment 4a and 5 in the gas phase. [Dotted pink: N-NH4+ (ppm); Square green: N-NO2- (ppm); Triangle blue: N-NO3- (ppm)].
Nitrogen balances during steady state of the PBR (corresponding to O2 concentration in the animal isolator at 21%) are presented in Table 4. Ammonium is not detected in the liquid outlet of the nitrifying bioreactor, so ammonium removal is at 99% for all conditions. Conversion of ammonium into nitrate is at 91.6, 96.3 and 94.2% for each condition respectively, which is in line with the performance of the bioreactor in previous integration experiment (Compartment 3 and 4a Lliquid Connection). The outlet nitrate concentration in the PBR depends on the hydraulic condition. Higher concentration is measured at 30 L·d−1 (202 N-ppm) than at 20 L·d−1 (160 N-ppm). It is not the same behaviour as at 40 L·d−1 (155 N-ppm) because of the inlet concentration reduction to diminish the ammonium+ load into the system. Results show that the same YN/X is obtained in all conditions. 0.09 g of N-NO3- are needed to generate 1 g of biomass. In contrast, around 0.06 g of N-NO3- are needed to generate 1 g of oxygen. These values are in the same range as those obtained in the first series of experiments.
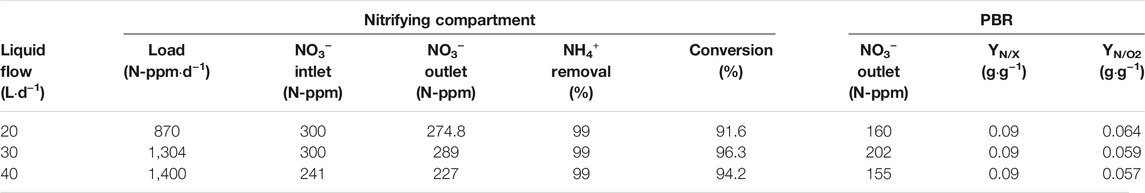
TABLE 4. Nitrogen balances observed in nitrifying bioreactor and photobioreactor for every experimental condition during liquid connection between nitrifying and photosynthetic compartments and gas connection between photosynthetic and crew compartment. The outlet of NO3− from nitrifying bioreactor is considered as the inlet concentration in the PBR.
Discussion
Compartment 3 Ad 4a Liquid Connection
The obtained results prove that liquid connection between nitrifying and photosynthetic bioreactors was successful. Nitrogen requirements of L. indica were met thanks to the nitrate supplied by the nitrifying bioreactor after a complete nitrification process performed by the co-culture of N. europaea and N. winogradsky. Indeed the operation of the photobioreactor was very stable and robust in the range of 10–30 L·d−1 and qo of 120 W·m−2 and 285 W·m−2. Stability for each condition was maintained at steady-state to obtain reliable data. In terms of nitrification activity, the system has been proved to be robust enough to maintain the ammonium conversion at 100% for 200 days no matter the load. There were minor accumulation peaks that were rapidly recovered and had no impact on photosynthetic activity of L. indica. These peaks were most likely caused after biomass removal from the packed-bed reducing the amount of active biomass. Then, once the previous active levels of biomass were reached, the nitrification activity recovered to 100%. Additionally, residual N-NO2- concentration in the PBR supernatant was below the limit for drinking water (World Health Ogranization, 2017).
The effect of light and dilution rate have been proved to contribute in a different degree to the performance of the PBR. Liquid flow, and consequently dilution rate, is the factor having the greatest effect on biomass and oxygen productivity. It is an indication that what really influences the behaviour of cyanobacteria is light availability rather than the amount of light. Figure 5 shows that light availability was directly proportional to the amount of light, but inversely proportional to the amount of cells. Results in terms of oxygen production were very relevant for the definition of the next integration step including the gas connection of the animal compartment to the PBR. Animal compartment in the MELiSSA loop aims to mimic the human activity. In this case the rats are the mock crew. As reported previously (Alemany et al., 2019), the oxygen needs for 1 rat is 0.48–0.7 g·h−1. The analysis of the obtained results for Compartment 3 and 4a liquid connection shows that depending on the liquid flow between bioreactors, different number of rats could be used in the experimental connection with the animal compartment. When working at 10, 20 or 30 L·d−1, the maximum oxygen productions achieved in the steady state were 1.6, 2.44 and 2.76 g·h−1 respectively. Under this scenario, the maximum number of rats that could be selected in the animal compartment is 4 with a theoretical minimum and maximum oxygen demand of 1.92 and 2.8 g·h−1 respectively. Nevertheless, under this scenario the system would be at the maximum capacity to meet the maximum oxygen requirements. It is for this reason that 3 rats were selected for the experiments where nitrifying bioreactor and the PBR were connected in the liquid phase, and the PBR was connected through the gas phase with animal compartment. This solution provides some margin to the system to react against potential perturbations or changes imposed by the user in the gas phase composition of the animal isolator. The selection of 3 rats imposes a theoretical oxygen demand into the system of 1.44–2.1 g·h−1 for minimum and maximum values. In order to meet this demand, the minimum and maximum carbon dioxide needs of the PBR would be 1.32 and 1.93 g·h−1 respectively assuming a middle range experimental QP of 1.5 molO2·molCO2−1 (Table 1). The animal compartment would provide 1.78–2.60 g·h−1 of carbon dioxide if a theoretical RQ of 0.9 molCO2·molO2−1 is considered (McGregor and Lee, 1998). So, the carbon needs of the PBR would be met. In terms of N needs, no lack of nitrate is expected in the PBR to meet the O2 requirements if the same N-NH4+ loads in nitrifying bioreactor are maintained. It has been demonstrated that according to yields displayed in Table 2, the amount of N-NO3−1 needed in the PBR would be between 0.09 and 0.12 g·h−1. Hence, any of the 3 tested loads conditions in the nitrifying bioreactor are acceptable.
According to previous rationale, the best hydrodynamic conditions for the next integration phase would be selecting a liquid flow of 20 and 30 L·d−1 between nitrifying bioreactor and the PBR. The liquid flow of 10 L·d−1 should be discarded as the system could be in the limit in terms of oxygen production, especially during high activity periods of the rats. Additionally, the exploration of a wider experimental liquid flow domain could provide of relevant information for further optimisation of the MELiSSA loop. This is why a liquid flow of 40 L·d−1 was also selected as an experimental condition for the second phase tests.
Compartment 3 and 4 Liquid Connection Combined With Compartment 4a and 5 Gas Connection
After a 110 days experiment, where the PBR and the animal isolator were connected in the gas phase, it has been demonstrated that the system is able to cover the oxygen needs of the rats and carbon needs of L. indica while operating in a closed gas loop. This condition is in agreement with previous results (Alemany et al., 2019). The added value of the current work is that nitrogen requirements of L. indica to cover the oxygen demand, have been covered by the continuous operation of a nitrifying bioreactor. This is particularly relevant since it represents a further step in the completion of the overall closed-life support system.
Focusing on the gas phase dynamics, the system could maintain a constant oxygen concentration in the animal isolator. Oscillations (±0.04%) in the measured value are the direct cause of circadian activity of the rats. In all oxygen set-points (21,19, 20%), the activity of the rats was higher during night periods because of its photoperiod (Antle and Mistlberger, 2005). In all cases the RQ of the rats ranged between 0.9 and 1.0 molO2·molCO2−1, which is consistent with the experimental data reported in the literature (McGregor and Lee, 1998; Jørgensen et al., 2010).
Transition periods, where oxygen set point was increased, took less than 10 h in two groups of rats and less than 20 h in the last group. This proves the fast response of the system to adjust to a change in the parameters of the crew compartment. It should be reminded that the aim of Compartment 4a (PBR) in the loop is to respond to oxygen demand variations thanks to its fast dynamics. The explanation of a higher time period for the transition in the last group of rats is the higher oxygen demand of the rats. It was demonstrated by the average oxygen produced in the PBR for each rat’s group (Figure 7), which increased up to 2.1 g·h−1 in that case. Indeed, the body weight gain of the rats, which could be an indication of the physiological activity of the rats, has been correlated with the oxygen demand of the system. In contrast, the transition periods for the first group of rats was not lower than in the second group, even a lower oxygen demand (1.5 vs. 1.9 g·h−1). This effect could be explained by the differences in the PBR capabilities. In the first case, the biomass concentration in the PBR was higher than in the second case (1.24 g·L-1 vs. 0.98 g·L−1), potentially limiting the light availability to the cells and decreasing the photosynthetic activity at the same light irradiance. This hypothesis is plausible considering the average
In terms of carbon dioxide concentration, the levels were always maintained below 15,000 ppm. This was below the acceptance limit of 3% for rats (Krohn and Hansen, 2002; Krohn et al., 2003). However, future experiments in the system should consider lowering this level and make it closer to the limits accepted for humans (<0.5%). This point will address in future integration steps of the MELiSSA loop.
Results from liquid connection experiments between Compartment 3 and 4a showed that maximum oxygen production in the PBR was around 2.4–2.8 g·h−1 with a flow rate of 20–30 L·d−1. However, during the second phase of the experiments (liquid connection between Compartment 3 and 4a and gas connection between Compartment 4a and 5) the system has proved to be over the previous determined limits. Light irradiance was maintained around 30% of its capacity with enough margin to meet the oxygen demand during transition periods. Indeed, the maximum oxygen production in those transition phases exceeded by 25% the reported values of the first experimental phase. This difference evidences that transition phases should be treated differently than steady state. Comparing biomass concentration at maximum light intensity condition in both experimental phases shows that cell density is lower in the second phase, leading to a higher light availability. From a biological perspective this effect might be explained by the molecular composition of the cells. The photosynthetic capacity of L. indica is influenced by the pigment content. When light availability is increased, it takes some hours (Tomaselli et al., 1997) to reduce the pigment content to protect the cells against potential photoinhibition (Muramatsu and Hihara, 2012; Weiwen Zhang, 2018). It is during that transition that the closed loop benefits from the still high pigment content to exploit the maximum photosynthetic activity of the cells. It can be concluded that the capacity of the system in transition steps cannot be extrapolated at long-term, when the system would evolve to reach a new steady state with lower oxygen generation capacity.
Regarding nitrogen needs of L. indica to meet the oxygen requirements of the animal crew, it has been demonstrated that nitrifying bioreactor is capable to fulfil them. Indeed, nitrate concentration in the PBR outlet was always kept higher than 20 N-ppm, which is considered a potentially limiting concentration (Depraetere et al., 2015). This scenario avoided any metabolic drift in L. indica, allowing an optimal performance in terms of air revitalisation. However, the limiting capacity of the nitrifying bioreactor was reached in the last condition (40 L·d−1), so ammonium load had to be reduced in order to avoid nitrogen species accumulation. One of the outputs from this work is that the maximum capacity of nitrifying bioreactor in the MELiSSA loop is 1400 ppm·d−1, which should be taken into consideration when it comes to introduce the urea in the loop. Once the ammonium load was decreased, the full nitrification capacity was fully recovered. Although complete nitrification was dominant during most of the test, three partial nitrification events occurred. Nitrite and ammonium reached the PBR resulting in different consequences. Whilst nitrite was present at detectable levels, no ammonium was detected at the PBR outlet. This result shows that L. indica can use ammonium as nitrogen source as previously reported in the literature (Sachdeva et al., 2018). Even nitrite concentration in the PBR reached up to 78 N-ppm during peaks periods, no irreversible effects were detected in L. indica culture. In the first and second accumulation events (78 and 58 N-ppm), the presence of nitrite had an effect on photosynthetic activity. The control system adjusted the lights up to the maximum qo of 285 W·m−2 during 2–3 h in order to cover the oxygen needs of the animal compartment. This behaviour was not observed in the last accumulation event (36 N-ppm) suggesting that a concentration higher than 40 N-ppm of nitrite have an inhibitory effect on L. indica photosynthetic activity. Nevertheless, this event shows the robustness of the system in such a wide range of conditions and in front of potential perturbations. The main function of air revitalisation in Compartment 4a was never at risk and oxygen needs of the rats were fulfilled during 110 days of continuous operation.
Conclusion
The work presented here has demonstrated the feasibility of integrating three compartments of the MELiSSA loop: Compartment 4a (photosynthesis) and 5 (crew compartment) in the gas phase and Compartment 3 (nitrification) and 4a in the liquid phase. The step-wise approach has been proved to be a key factor in the progress to demonstrate the MELiSSA loop concept. Results from the first experimental period have been relevant to define the integration conditions for the following step. The system has succeeded to maintain its main functions to guarantee the survival of the animal crew for a long operational period, proving as well its robustness and reliability against perturbations, which is very relevant in the MELiSSA loop context. It can be concluded that this experimental work represents a step forward in the demonstration of the MELiSSA loop concept and its contribution to bioregenerative life support.
Data Availability Statement
The original contributions presented in the study are included in the article material, further inquiries can be directed to the corresponding author.
Ethics Statement
The animal study was reviewed and approved by Committee on Ethics in Animal and Human Research (4017 CEEAH—UAB).
Author Contributions
All authors listed have made a substantial, direct, and intellectual contribution to the work and approved it for publication.
Funding
The MELiSSA Pilot Plant is funded from ESA contributions from Spain (main contributor), Belgium, France, Italy and Norway, under Frame Contract C4000109802/13/NL/CP. Co-funding from Ministerio de Ciencia e Innovación (RD 788/2020), Generalitat de Catalunya and Universitat Autònoma de Barcelona is also acknowledged.
Conflict of Interest
The authors declare that the research was conducted in the absence of any commercial or financial relationships that could be construed as a potential conflict of interest.
Publisher’s Note
All claims expressed in this article are solely those of the authors and do not necessarily represent those of their affiliated organizations, or those of the publisher, the editors and the reviewers. Any product that may be evaluated in this article, or claim that may be made by its manufacturer, is not guaranteed or endorsed by the publisher.
Acknowledgments
MELiSSA is an international consortium of 15 partners led by the European Space Agency (for information: https://www.melissafoundation.org). Its activities are governed by a Memorandum of Understanding (ESA 4000100293/10/NL/PA).
References
Alemany, L., Peiro, E., Arnau, C., Garcia, D., Poughon, L., Cornet, J.-F., et al. (2019). Continuous Controlled Long-Term Operation and Modeling of a Closed Loop Connecting an Air-Lift Photobioreactor and an Animal Compartment for the Development of a Life Support System. Biochem. Eng. J. 151, 107323. doi:10.1016/j.bej.2019.107323
Clauwaert, P., Muys, M., Alloul, A., De Paepe, J., Luther, A., Sun, X., et al. (2017). Nitrogen cycling in Bioregenerative Life Support Systems: Challenges for waste refinery and food production processes. Progress in Aerospace Sciences 91, 87–98.
Cogne, G., Lehmann, B., Dussap, C.-G., and Gros, J.-B. (2003). Uptake of Macrominerals and Trace Elements by the cyanobacteriumSpirulina Platensis (Arthrospira Platensis PCC 8005) under Photoautotrophic Conditions: Culture Medium Optimization. Biotechnol. Bioeng. 81, 588–593. doi:10.1002/bit.10504
Cornet, J.-F., Dussap, C. G., and Gros, J.-B. (1998). Kinetics and Energetics of Photosynthetic Micro-organisms in Photobioreactors. Bioproc. Algae Reactor Technol. Apoptosis 59, 153–224. doi:10.1007/bfb0102299
Cornet, J. F. (2007). Procédés Limités par le Transfert de Rayonnement en Milieu Hétérogène Étude des Couplages Cinétiques et Énergétiques dans les photo-bioréacteurs par une approche thermodynamique. Milieux fluides et réactifs: Université Blaise Pascal - Clermont-Ferrand II. Available at: https://hal.archives-ouvertes.fr/tel-01281239.
Daims, H., Lebedeva, E. V., Pjevac, P., Han, P., Herbold, C., Albertsen, M., et al. (2015). Complete Nitrification by Nitrospira Bacteria. Nature 528, 504–509. doi:10.1038/nature16461.Complete
Depraetere, O., Pierre, G., Deschoenmaeker, F., Badri, H., Foubert, I., Leys, N., et al. (2015). Harvesting Carbohydrate-Rich Arthrospira Platensis by Spontaneous Settling. Bioresour. Techn. 180, 16–21. doi:10.1016/j.biortech.2014.12.084
Gòdia, F., Albiol, J., Pérez, J., Creus, N., Cabello, F., Montràs, A., et al. (2004). The MELISSA Pilot Plant Facility as an Integration Test-Bed for Advanced Life Support Systems. Adv. Space Res. 34, 1483–1493. doi:10.1016/j.asr.2003.08.038
Hendrickx, L., De Wever, H., Hermans, V., Mastroleo, F., Morin, N., Wilmotte, A., et al. (2006). Microbial Ecology of the Closed Artificial Ecosystem MELiSSA (Micro-ecological Life Support System Alternative): Reinventing and Compartmentalizing the Earth's Food and Oxygen Regeneration System for Long-Haul Space Exploration Missions. Res. Microbiol. 157, 77–86. doi:10.1016/j.resmic.2005.06.014
Jørgensen, H., Hansen, C. H., Mu †, H., and Jakobsen, K. (2010). Protein and Energy Metabolism of Young Male Wistar Rats Fed Conjugated Linoleic Acid as Structured Triacylglycerol. Arch. Anim. Nutr. 64, 322–336. doi:10.1080/1745039X.2010.486594
Krohn, T. C., and Hansen, A. K. (2002). Carbon Dioxide Concentrations in Unventilated IVC Cages. Lab. Anim. 36, 209–212. doi:10.1258/0023677021912361
Krohn, T. C., Hansen, A. K., and Dragsted, N. (2003). The Impact of Low Levels of Carbon Dioxide on Rats. Lab. Anim. 37, 94–99. doi:10.1258/00236770360563723
Lasseur, C., Brunet, J., Weever, H. De., Dixon, M., Dussap, G., Godia, F., et al. (2010). MELiSSA: The European Project of Closed Life Support System. Gravity Space Biol. 23, 3–12.
McGregor, I. S., and Lee, A. M. (1998). Changes in Respiratory Quotient Elicited in Rats by a Conditioned Stimulus Predicting Food. Physiol. Behav. 63, 227–232. doi:10.1016/S0031-9384(97)00429-0
Mergeay, M., Verstraete, W., Dubertret, G., Lefort-tran, M., Chipaux, C., and Binot, R. (1988). MELiSSA. A Microorganisms Based Model for CELSS Development. in Proc. 3rd Symp. Sp. Therm. Control Life Support Syst. Noordwijk, The Netherlands. The Netherlands): Noordwijk, 65–68.
Muramatsu, M., and Hihara, Y. (2012). Acclimation to High-Light Conditions in Cyanobacteria: From Gene Expression to Physiological Responses. J. Plant Res. 125, 11–39. doi:10.1007/s10265-011-0454-6
Pérez, J., Montesinos, J., Albiol, J., and Gòdia, F. (2004). Nitrification by Immobilized Cells in a Micro-ecological Life Support System Using Packed-Bed Bioreactors: An Engineering Study. J. Chem. Technol. Biotechnol. 79, 742–754. doi:10.1002/jctb.1050
Poughon, L., Farges, B., Dussap, C. G., Godia, F., and Lasseur, C. (2009). Simulation of the MELiSSA Closed Loop System as a Tool to Define its Integration Strategy. Adv. Space Res. 44, 1392–1403. doi:10.1016/j.asr.2009.07.021
Sachdeva, N., Giambarresi, G., Poughon, L., Cabrera, J. C., Leroy, B., Lasseur, C., et al. (2018). Assessment of Transient Effects of Alternative Nitrogen Sources in Continuous Cultures of Arthrospira Sp. Using Proteomic, Modeling and Biochemical Tools. Bioresour. Techn. 267, 492–501. doi:10.1016/j.biortech.2018.07.062
Tomaselli, L., Boldrini, G., and Margheri, M. C. (1997). Physiological Behaviour of Arthrospira (Spirulina) Maxima during Acclimation to Changes in Irradiance. J. Appl. Phycology 9, 37–43. doi:10.1023/A:1007956210329
Whishaw, I. Q., and Kolb, B. (2004). “The Behavior of the Laboratory Rat,” in In The Behavior of the Laboratory Rat. Editors I. Whishaw, and B. Kolb (New York: Oxford Univeristy Press), 183–194. doi:10.1093/acprof:oso/9780195162851.001.0001
Wieland, P. (2005). Designing for Human Presence in Space: An Introduction to Environmental Control and Life Support Systems. Washington, DC: ECLSS.
World Health Ogranization (2017). Nitrate and Nitrite in Drinking-Water: Background Document for Development of WHO Guidelines for Drinking-Water Quality. Available at: https://apps.who.int/iris/handle/10665/75380.
Zhan, J., and Wang, Q. (2018). Photoresponse Mechanism in Cyanobacteria: Key Factor in Photoautotrophic Chassis. Adv. Exp. Med. Biol., 75–96. doi:10.1007/978-981-13-0854-3_12
Nomenclature
CLOUT outlet liquid CO2 concentration (mmol·L−1)
D dilution rate (h−1)
FCO2 inlet CO2 gas flow (L·h−1)
Fin bioreactor inlet gas flow (L·h−1)
Fout bioreactor total outlet gas flow (L·h−1)
HRT Hydraulic Residence Time (days)
O2out outlet O2 fraction (%)
PQ Photosynthetic quotient (molO2·molCO2−1)
qO light irradiance in the PAR region (W·m−2)
qO2 specific O2 production (mmol·g−1·h−1)
qCO2 specific CO2 consumption (mmol·g−1·h−1)
rCO2 CO2 volumetric consumption rate (g·L−1·h−1)
RQ respiratory quotient (molCO2·molO2−1)
rO2 O2 volumetric production rate (g·L−1·h−1)
rX biomass volumetric production rate (g·L−1·h−1)
VR bioreactor volume (L)
X biomass concentration (g·L−1)
XCOUT molar fraction of CO2 in the outlet gas (mol·mol−1)
XCI molar fraction of CO2 in the inlet gas (mol·mol−1)
Keywords: Continuous operation, bioreactors, Limnospira indica, Nitrosomonas europaea, Nitrobacter winogradsky, Micro Ecological Life Support System Alternative, Environmental Control and Life Support System
Citation: Garcia-Gragera D, Arnau C, Peiro E, Dussap C-G, Poughon L, Gerbi O, Lamaze B, Lasseur C and Godia F (2021) Integration of Nitrifying, Photosynthetic and Animal Compartments at the MELiSSA Pilot Plant. Front. Astron. Space Sci. 8:750616. doi: 10.3389/fspas.2021.750616
Received: 30 July 2021; Accepted: 22 September 2021;
Published: 19 October 2021.
Edited by:
Cyprien Verseux, University of Bremen, GermanyReviewed by:
Ricardo Amils, Autonomous University of Madrid, SpainAaron J. Berliner, University of California, Berkeley, United States
Copyright © 2021 Garcia-Gragera, Arnau, Peiro, Dussap, Poughon, Gerbi, Lamaze, Lasseur and Godia. This is an open-access article distributed under the terms of the Creative Commons Attribution License (CC BY). The use, distribution or reproduction in other forums is permitted, provided the original author(s) and the copyright owner(s) are credited and that the original publication in this journal is cited, in accordance with accepted academic practice. No use, distribution or reproduction is permitted which does not comply with these terms.
*Correspondence: David Garcia-Gragera, ZGF2aWQuZ2FyY2lhLmdyYWdlcmFAdWFiLmNhdA==