 Yage Zhao
 Majdi Hochlaf
 Malgorzata Biczysko
- 1Department of Physics, International Centre for Quantum and Molecular Structures, College of Sciences, Shanghai University, Shanghai, China
- 2Université Gustave Eiffel, COSYS/LISIS, 5 Bd Descartes, Champs sur Marne, France
Increased importance of vibrational fingerprints in the identification of molecular systems, can be highlighted by the upcoming interstellar medium (ISM) observations by the James Webb Space Telescope, or in a context of other astrochemical environments as meteorites or exoplanets, Mars robotic missions, such as instruments on board of Perseverance rover. These observations can be supported by combination of laboratory experiments and theoretical calculations, essential to verify and predict the spectral assignments. Astrochemical laboratory simulations have shown that complex organic molecules (COMs) can be formed from simple species by vacuum ultraviolet or X-ray irradiation expanding interest in searching for organic biological and prebiotic compounds. In this work an example of nucleobase, thymine, is selected as a test case for highlighting the utility of computational spectroscopic methods in astrochemical studies. We consider mid-infrared (MIR) and near-infrared (NIR) vibrational spectra of neutral (T) and cationic (T+) thymine ground states, and vibrationally-resolved photoelectron (PE) spectra in the far UV range from 8.7 to 9.4 eV. The theoretical framework is based on anharmonic calculations including overtones and combination bands. The same anharmonic wavenumbers are applied into the simulations of vibrationally-resolved photoelectron spectra based on Franck-Condon computations. The infrared and vibrationally-resolved photoelectron spectra are compared with the available experimental counterparts to verify their accuracy and provide assignment of the observed transitions. Finally, reliable predictions of spectra, going beyond currently available experimental data, either dealing with energy ranges, resolution or temperature, which can support astrochemistry studies are provided.
Introduction
Before the middle of the last century, it was widely believed that the environment in the cosmic space was not suitable to the formation and survival of molecules, and that most matter in space would exist as atoms or amorphous dust grains (Herzberg, 1988). With the development of new astronomical techniques, especially the advent of telescopes, detectors, and spectrometers operating in the radio, infrared (IR), and ultraviolet (UV)/visible ranges of the electromagnetic spectrum, it is currently proven that most of the matter in the circumstellar systems and interstellar environments exists in the molecular form (Allamandola et al., 1989; Sandford et al., 2020). Dense interstellar clouds are the regions where most of the chemical reactions involved occur. These are the environments where new planetary systems are formed, so, some of the chemical species produced in these environments are expected to be transported to small objects such as asteroids and comets. This implies that newly formed planetary systems likely possess an inventory of complex prebiotic organics, which can be delivered to and seed planets, as was the case for the primitive Earth (Sandford et al., 2020). Moreover, photochemistry with high-energy processing of the interstellar ice mantles, planetary atmospheres, or the planetary soil is a key mechanism for extraterrestrial synthesis of prebiotic molecules (Arumainayagam et al., 2021), but photochemistry can also lead to the molecules modification or destruction (Serrano-Andrés and Merchán, 2009).
Nowadays, it is thought that some starting prebiotic molecular materials may be widely distributed throughout the Universe (Sandford et al., 2020) and the search for the biosignatures is one of the main goals of current and future space missions involving the next generation of space telescopes (JWST, ARIEL, OST, HabEx, LUVOIR) (Lasne, 2021), spectrometers onboard of spacecrafts or rovers (Flasar et al., 2005; Vago et al., 2017; Vago et al., 2018; Williford et al., 2018) or the new class of high-resolution spectrometers operating in the UV region, (i.e., CHESS) (Hoadley et al., 2020) allowing observations beyond capacities of present-day facilities such as the Hubble Space Telescope (HST). In the case of essential molecules of life, it has been shown that carbonaceous meteorites contain a wide range of extraterrestrial nucleobases (Callahan et al., 2011), but uracil is still the only pyrimidine base formally reported in such meteorites (Stoks and Schwartz, 1979). It has been shown (Materese et al., 2017) that all desoxyribonucleic acid (DNA) and ribonucleic acid (RNA) nucleobases can be formed in icy astrophysical environments by UV irradiation of pyrimidine, but the relative abundance of these nucleobases greatly differs (Materese et al., 2013). Therefore, uracil and cytosine are more easily formed than thymine, which is consistent with the detection of uracil but not of thymine in meteorites. In 2019, (Oba et al., 2019) demonstrated that all DNA/RNA nucleobases, except guanine, can be also formed from a mixture of simple, abundant molecules (H2O, CO, NH3 and CH3OH) exposed to UV photons at 10 K. So far, none of nucleobases have been detected in the interstellar medium (ISM), but other complex molecules exist in ISM, including two simplest nitrogen-bearing aromatic molecules: benzonitrile (c-C6H5CN) (McGuire et al., 2018) and 1-cyano-1,3-cyclopentadiene (c-C5H5CN) (McCarthy et al., 2021). Analysis of chemical composition and structure of any type of astrochemical “samples” (meteorites, comets, planetary atmosphere or soil, ISM) and search for prebiotic organic matter in extraterrestrial materials is a very challenging task (Callahan et al., 2011; Fornaro et al., 2020). The detection is usually performed employing spectroscopic measurements and their comparison with the data available from the laboratory experiments. However, the latter might be not available, or even difficult to obtain with the desired accuracy/resolution or in the conditions mimicking astrochemical environments of interest (Puzzarini and Barone, 2020b). Moreover, despite the large amount of information that can be obtained from experiments, uncertainties arise in the assignment of spectral peaks, even for small molecules (Puzzarini et al., 2014). In this respect quantum chemistry (QC) based simulations of spectra represents a very powerful tool to either 1) support laboratory experiments or 2) provide missing data not (yet) available from experiments (Biczysko et al., 2017; Puzzarini and Barone, 2020a). Indeed, computational spectroscopic techniques (Barone et al., 2021) may support either laboratory experiments or astrochemical observations in different wavelength/frequency ranges from the microwave (μw), infrared (IR), ultraviolet-visible (UV-VIS), up to the photoelectron (PE) spectra including soft X-rays, as schematically represented in Figure 1. Interestingly, the same quantum chemical computations can provide information in several spectral ranges, both absorption and emission, as well as with different resolutions. Finally, spectra computed for isolated molecules allow at the same time their own characterization in the absence of interactions, and may serve as the reference data for interpreting results obtained in more complex environments (Barone et al., 2015).
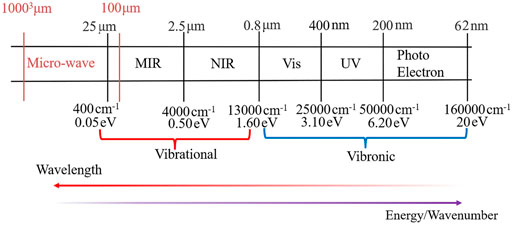
FIGURE 1. The wavelength and energy range corresponding to vibrational and vibronic spectra simulations.
In this work, we will illustrate the application of computational spectroscopy focusing on the thymine and its photoionization initiated by the absorption of a VUV photon, i.e.,
Methods
Computational Details
The geometry optimizations, harmonic and anharmonic vibrational computations of neutral thymine and of its cation in their ground states (i.e.
The B2PLYP harmonic computations have been used together with the cubic and quartic semi-diagonal constants and the second and third order derivatives of dipole moment from B3LYP (Becke, 1993) computations to create anharmonic hybrid force fields employed in spectra simulations. Both B2PLYP and B3LYP computations are carried out in conjunction with the aug-cc-pVTZ (denoted hereafter as AVTZ) (Dunning and Thom, 1989; Kendall et al., 1992) basis set. The B2PLYP and B3LYP force fields are combined into the hybrid B2PLYP/AVTZ//B3LYP/AVTZ one by assuring the normal modes overlap between these two sets as implemented in GAUSSIAN16. Namely, the correspondence between two sets of normal modes (two different levels of theory, or the initial and the final states in electronic transition, vide infra) is defined using the linear transformation as proposed by Duschinsky (Duschinsky, 1937):
where Q and Q' represent the two sets of mass-weighted normal coordinates. The Duschinsky matrix J describes the projection of one normal coordinate basis vectors on those of the other. The displacement shift vector K corresponds to the displacements of the normal modes between the two structures. For a hybrid method involving harmonic and anharmonic data computed at different levels of theory the normal modes consistency was checked automatically. A cut-off of 90% for each coordinate was required to consider the two sets of normal modes as equivalent.
For anharmonic contributions, the second order vibrational perturbation theory (VPT2) (Nielsen, 1951; Mills, 1972) has been employed. In VPT2 computations the third and fourth order derivatives of the potential energy surface have been obtained by numerical differentiation (Barone, 2005; Bloino, 2015) of analytic second-order derivatives while the cubic electric dipole moment surfaces have been obtained through numerical differentiations of the dipole moment derivatives. As established in the literature (Amos et al., 1991; Martin et al., 1995; Barone, 2005; Vázquez and Stanton, 2007; Rosnik and Polik, 2014; Bloino, 2015; Franke et al., 2021; Mendolicchio et al., 2021), the VPT2 approaches accounting for the possible presence of anharmonic resonances is very effective in predicting infrared and Raman spectra of medium-sized molecules (Barone et al., 2014; Bloino, 2015; Bloino et al., 2015; Krasnoshchekov et al., 2015; Franke et al., 2021). In this work, we adopt the generalized VPT2 (GVPT2) model (Bloino and Barone, 2012; Bloino et al., 2015) where nearly-resonant contributions are removed from the perturbative treatment (leading to the deperturbed model, DVPT2) and treated in a second step variationally, using a set of default thresholds. Resonance definition and general recommendations on the applied computational procedures are described in detail in the tutorial review by Bloino et al. (Bloino et al., 2016).
The computation of vibrationally-resolved photoelectron spectra has been performed employing the sum-over-states Time-Independent (TI) (Barone et al., 2009; Barone, 2012) formulation, using the Adiabatic Hessian (AH) descriptions of the potential energy surfaces and the Franck-Condon (FC) (Condon, 1926; Franck and Dymond, 1926; Condon, 1928; Sharp and Rosenstock, 1964; Doktorov et al., 1977) approximation for the transition dipole moment, denoted as TI AH|FC (Bloino et al., 2016). This approach takes into account both the shift between the geometries and rotation of the normal modes upon the ionization through Duschinsky transformation. TI AH|FC spectra have been computed with the class-based prescreening method (Santoro et al., 2007a; Santoro et al., 2007b), including as well the temperature effects (Santoro et al., 2008). For the latter, all vibrational states with a Boltzmann population of at least 10% of that of the ground state zero vibrational level have been considered as the initial states for the vibronic transitions. The TI AH|FC computations have been done within the harmonic framework, but the initial and final levels harmonic wavenumbers have been replaced by their anharmonic counterparts from the B2PLYP/B3LYP GVPT2 computations, to partially recover anharmonicity in a cost-effective way. Finally the energy difference between the
Results and Discussion
Equilibrium Structure and Vibrational Spectroscopy
Equilibrium geometrical parameters of neutral thymine and its cation calculated at the B2PLYP/AVTZ level are listed in Table 1, while the most significant structural and charge changes upon ionization are reported in Figure 2. Additional data, B3LYP/AVTZ structures and NBO atomic charges are reported in Supplementary Tables S1–S3, respectively (cf. the supplementary information). For neutral thymine accurate reference equilibrium structure has been obtained by two complementary techniques (Vogt et al., 2014), namely ab initio, re structural parameters from the composite approach based on the all-electron CCSD (T) (Raghavachari et al., 1989) geometry optimizations employing the cc-pwCVTZ basis set (Peterson and Dunning, 2002) and the semi-experimental (reSE) (Pulay et al., 1978) method, based on the fit of equilibrium rotation constants (obtained from the experimental ones by extracting vibrational corrections), which agree with each other to within 0.002 Å and 0.2°, further confirming their high accuracy. B2PLYP/AVTZ and B3LYP/AVTZ structures compared with the re (ab initio) one exhibit mean absolute errors (MAE) of about 0.0025 Å with the largest discrepancies of about 0.008 Å and 0.01 Å, respectively. The latter are mainly due to the overestimation of C-N bond lengths. The accuracy is even better for the angles with MAE below 0.15° and largest discrepancies of ± 0.3°. Based on the good quality of both DFT structures for neutral thymine similar accuracy can be expected for the cation.
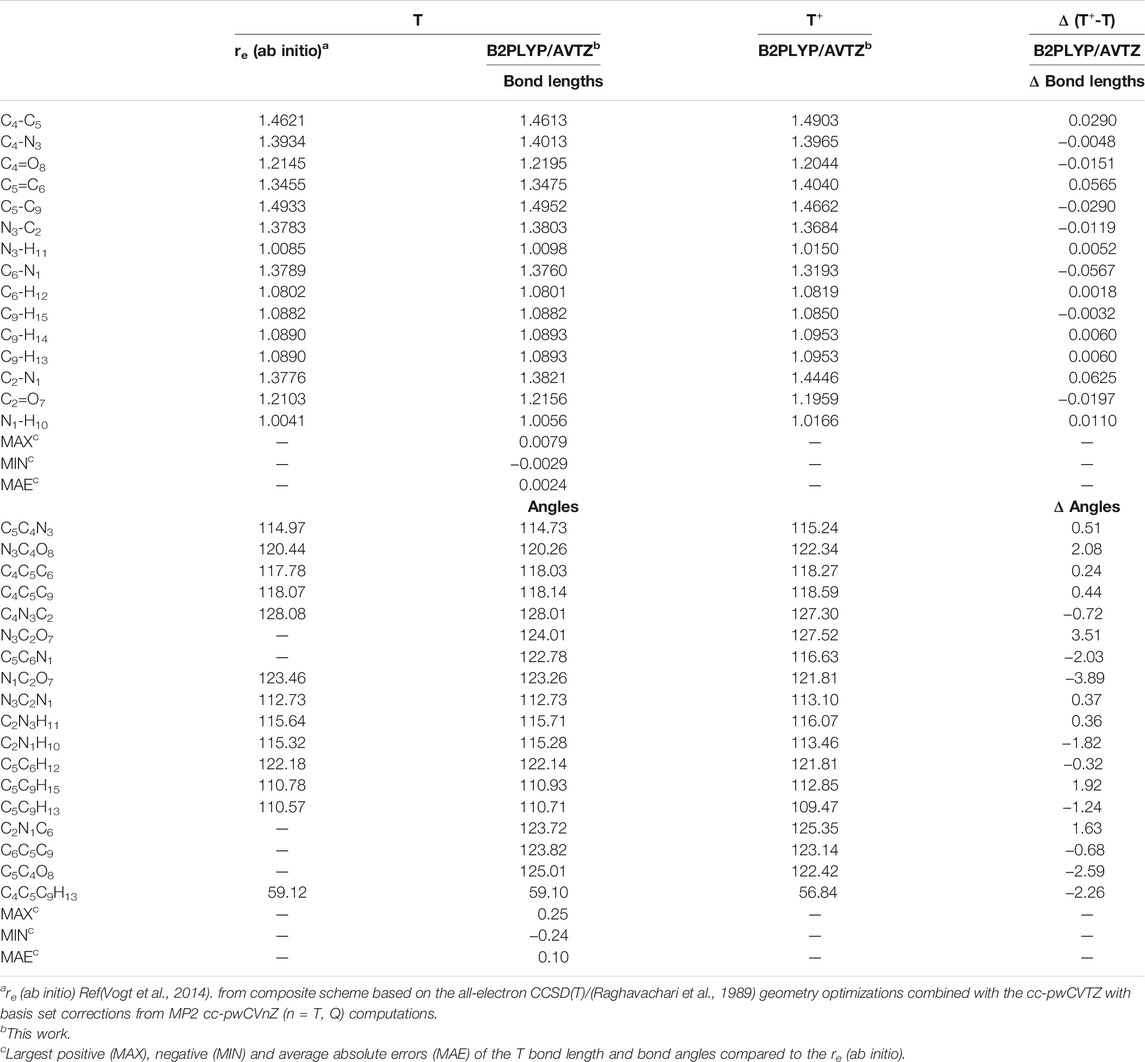
TABLE 1. Structural parameters of neutral Thymine and its cation (bond lengths in Å, angles in deg).
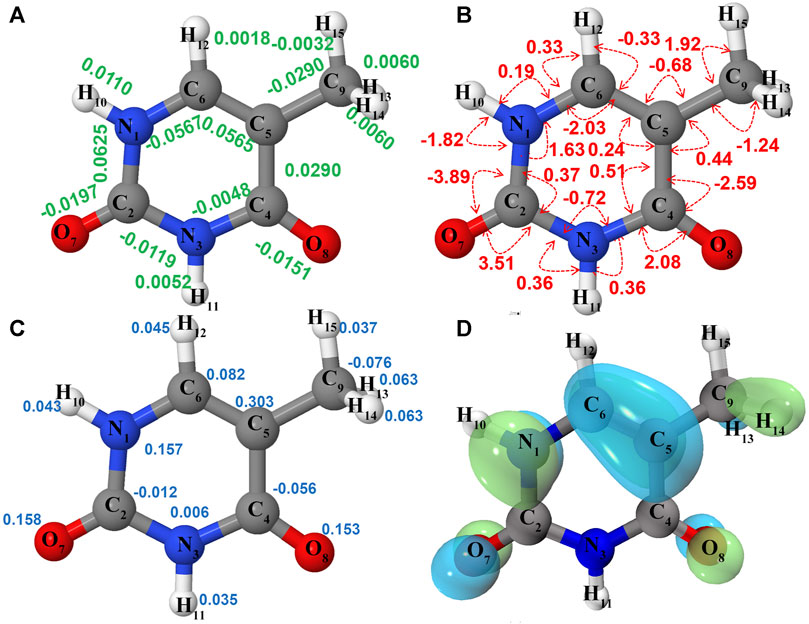
FIGURE 2. Structure and properties of neutral thymine (
Table 2 lists all fundamental anharmonic wavenumbers and IR intensities of T and T+ computed at the B2PLYP/AVTZ//B3LYP/AVTZ GVPT2 level, along with the most important overtones and combination bands. For neutral thymine, the assignment is based on the visual inspection of normal modes (Figure 3), and used as a basis to express T+ vibrations according to the Duschinsky rotation (Figure 4). Corresponding normal modes of T and T+ are listed in the same row, allowing a straight forward comparison of the changes in the wavenumbers and IR intensities upon ionization. The accuracy of simulated IR spectra of T
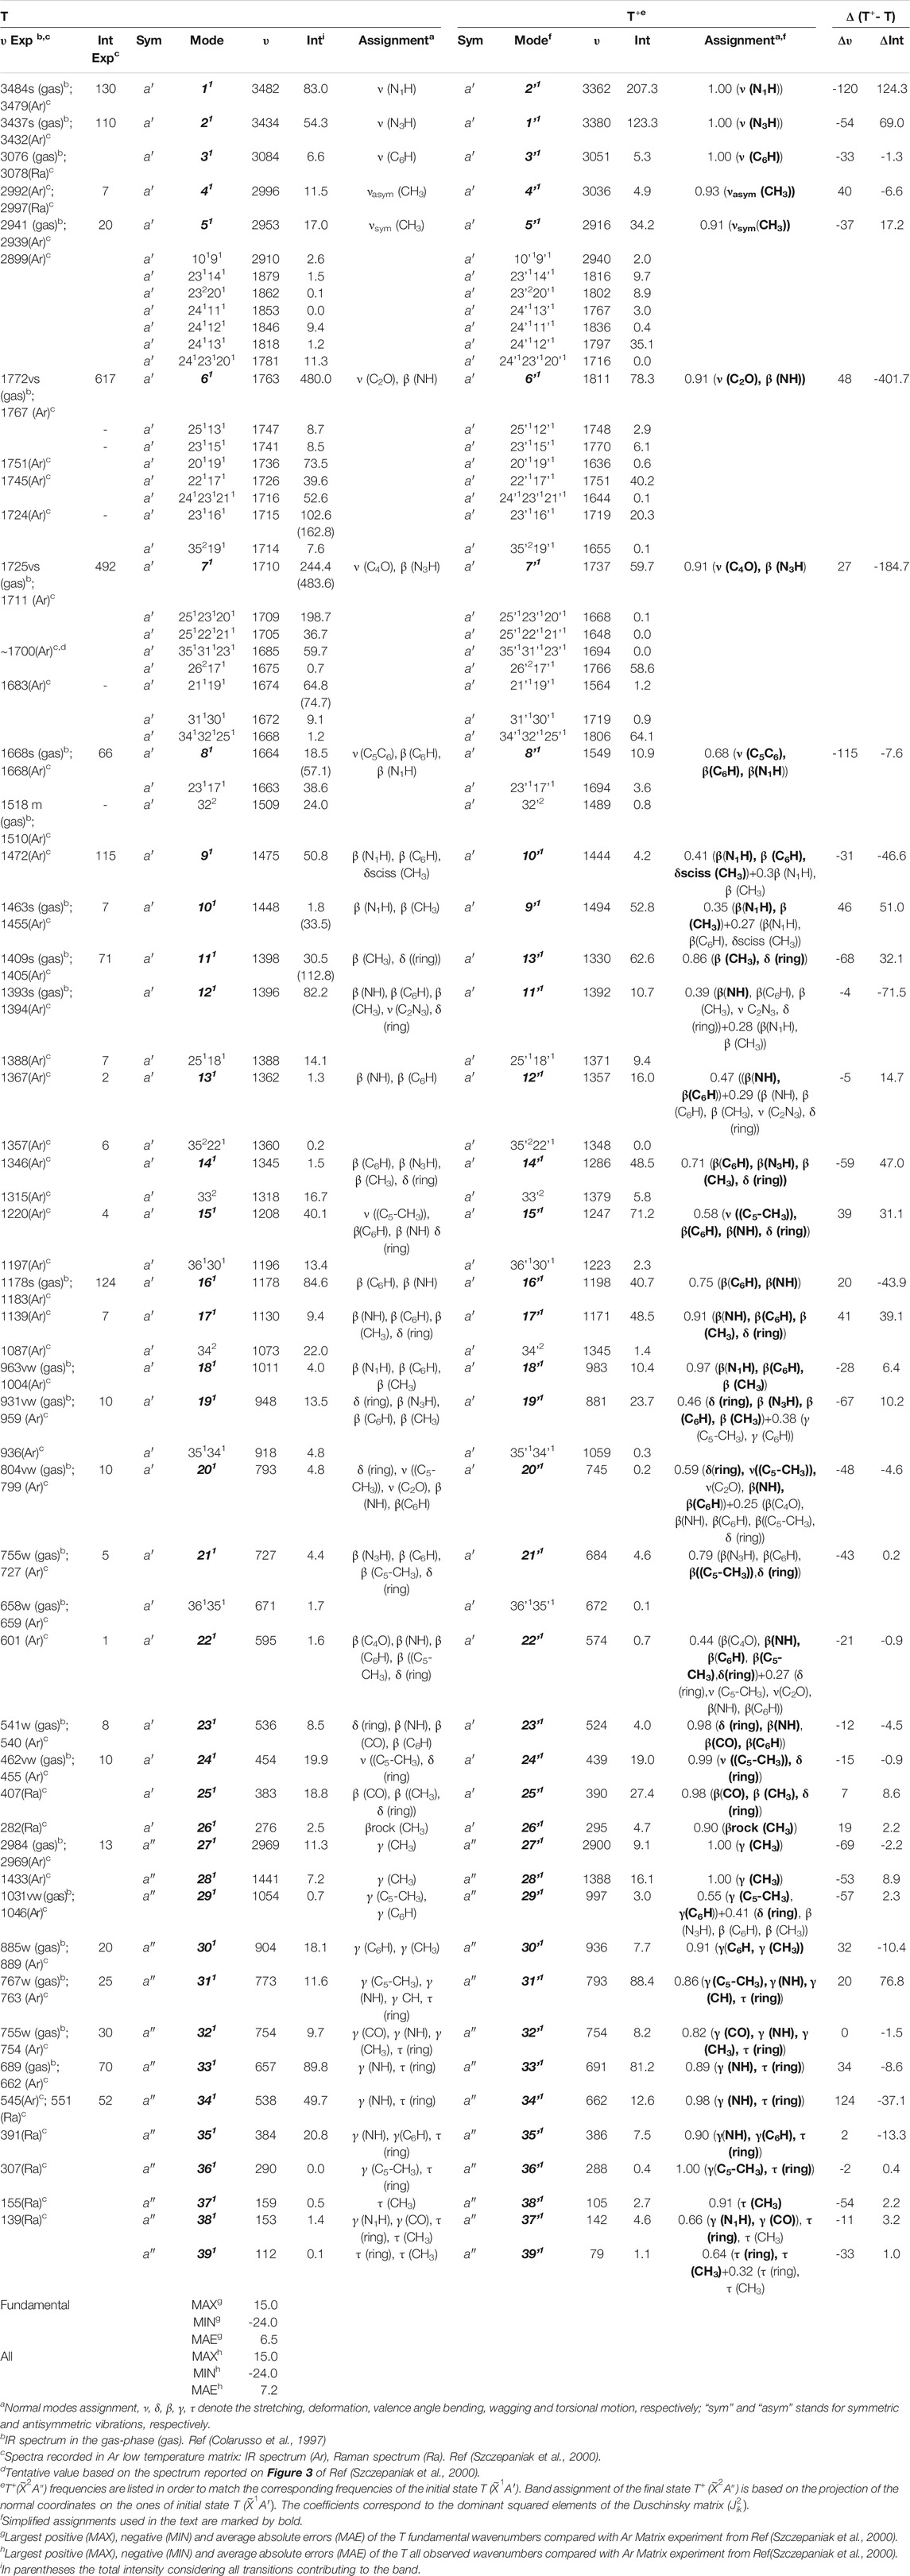
TABLE 2. Anharmonic wavenumbers (
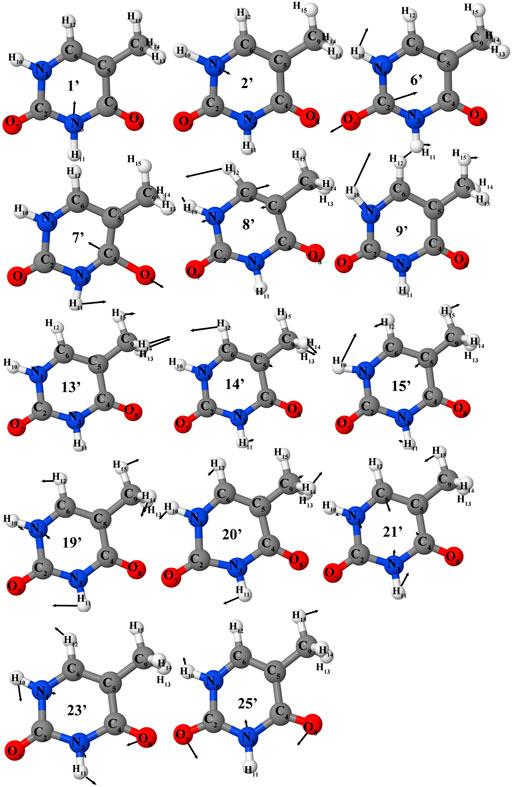
FIGURE 3. Selected vibrations of the thymine (in cation normal modes representation) corresponding to most intense transitions in IR or photoelectron spectra.
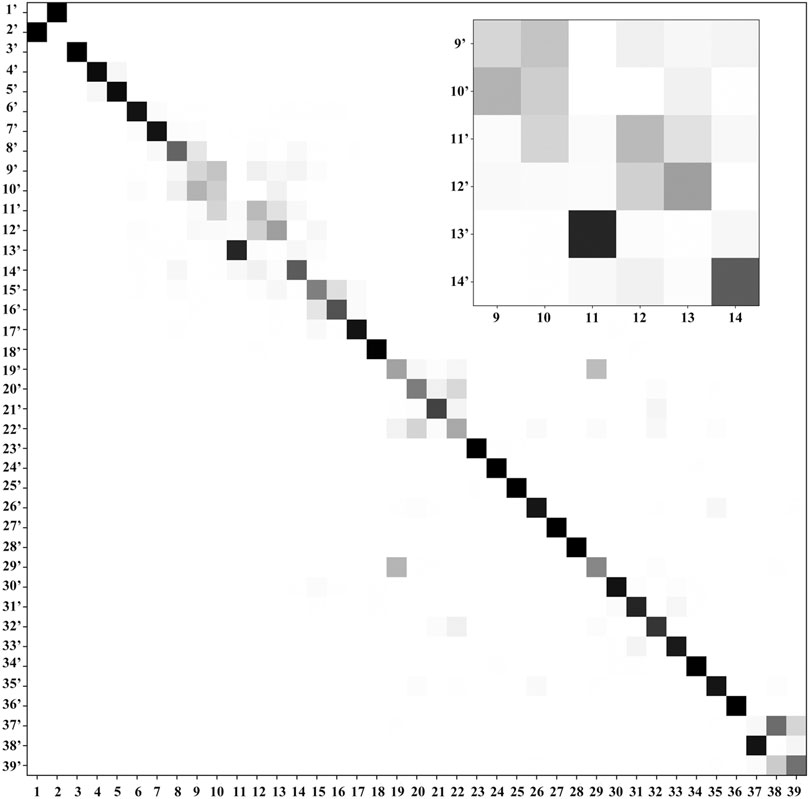
FIGURE 4. Duschinsky matrix: the normal coordinates of the final state T+ (columns) are expressed in the basis set of the normal coordinates of the initial state T (rows). A gray scale is used to represent the magnitude of each element of the J matrix, with a white square for a near-null value and a black square for 1 (equivalent normal modes). The part with largest mode coupling is shown in the inset.
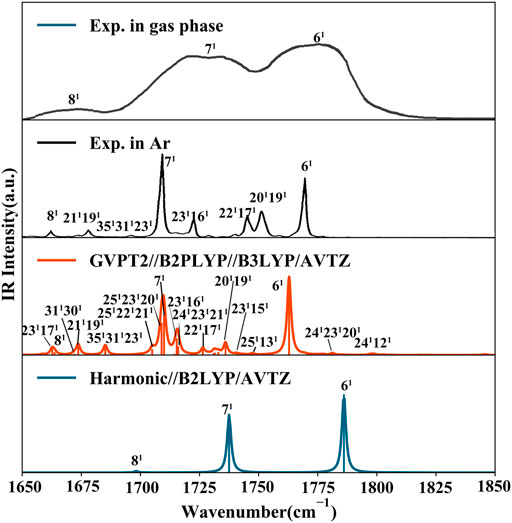
FIGURE 5. IR spectrum of thymine in the CO stretching range (1650 cm−1 - 1850 cm−1). Computed stick spectra were broadened by Lorentzian functions with half width at half-maximum (HWHM) of 1 cm−1. Most significant contributions to intense bands are assigned as mn where m is the normal mode and n is the number of quanta on this mode (1 fundamentals, 2 overtones). Experimental spectra of gas phase thymine (Colarusso et al., 1997) and of Ar low temperature matrix trapped thymine (Szczepaniak et al., 2000) are shown for comparison.
Ionization effects are correlated with the changes in electron density yielding structure modifications, which in turn tune the molecular vibrations and relative spectra. These changes are directly related to the active vibrational progression of photoelectron spectra, and reflected in the modification of infrared spectra patterns (band positions shifts and dipole moment/IR intensity variations). The most significant geometrical changes are related to the C2-N1-C6-C5 part of the ring, with the C6-N1 bond shorter by about 0.06 Å, the C2-N1 and C6-C5 longer by a similar amount, along with the C5C6N1 bond angle decrease by 2.03° and C2N1C6 bond angle increase by 1.63°. These structural modifications can be associated with the changes in the electron density upon removing an electron from a HOMO orbital mainly localized on C2-N1-C6-C5 part of the ring and both oxygen atoms (Figure 2D). Small changes in other structural parameters such as X-H (X = N, C) bond elongation by 0.0018 Å - 0.011 Å or C=O bonds shortening by 0.015 Å - 0.02 Å, introduce effects on relevant vibrations, with the wavenumbers redshifted between -30 cm−1 to -120 cm−1, or blue shifted by up to about 50 cm−1, respectively (see Table 2). In addition to wavenumbers changes, IR spectra are influenced by the charge modifications and different polarity of relevant bonds (NBO charges are reported in the Supplementary Table S3). The negative charge decrease on oxygen atoms by over 0.15 e leads to smaller polarity of both C=O bonds, and in consequence lower IR intensity for these strong transitions in the case of T+. Moreover, ionization leads to some mode mixing which can be analyzed based on the projection of the normal coordinates between the two electronic states using the Duschinsky matrix J, which is graphically represented in Figure 4. Namely, the group of T+ modes related to the ring deformation, 9', 10', 11', 12' and 13' is described by contributions from 10, 9, 12, 13 and 11 T vibrations, as depicted in the inset of Figure 4. Non-negligible Duschinsky rotation is also observed for the modes 19', 22', 29' and 39'. Interestingly, most of the remaining modes are not affected by significant mode mixing. The ionization induced changes in the band position and IR intensities lead to very different spectrum patterns for T and T+, as presented in Figure 6. In general terms, the IR spectrum of T+ is characterized by several bands of similar intensities, while the spectrum of T is dominated by strong transitions corresponding to bands dominated by CO stretching (assigned as ν (CO), β (NH)). The latter, the T (
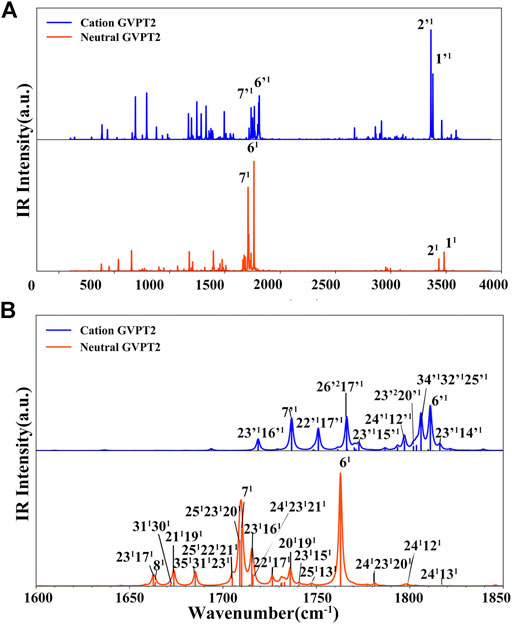
FIGURE 6. MIR spectra simulated at GVPT2//B2PLYP//B3LYP/AVTZ level. Spectra line-shapes were broadened by Lorentzian functions with HWHM of 1 cm−1. (A) 100 cm−1 - 4000 cm−1 range (B) The 1600 cm−1 -1850 cm−1 range related to the modes 6, 7 and the non-fundamentals involved in the Fermi resonances. Most intense bands are assigned as mn where m is normal mode and n number of quanta (1 fundamentals, 2 overtones).
In summary, neutral and cationic fundamental modes involved in Fermi resonances are 6/6' [ν (C2O), β (NH)) and 7/7' (ν (C4O), β (N3H)]. Indeed, the T (
Overall, we can conclude that the relatively small changes in the structure and electron density due to ionization lead to significant modifications of the vibrational properties, such as normal modes, wavenumbers, IR intensities and anharmonic resonances. Hence, the resulting IR spectra of T and T+ differ significantly.
Photoelectron Spectra
The
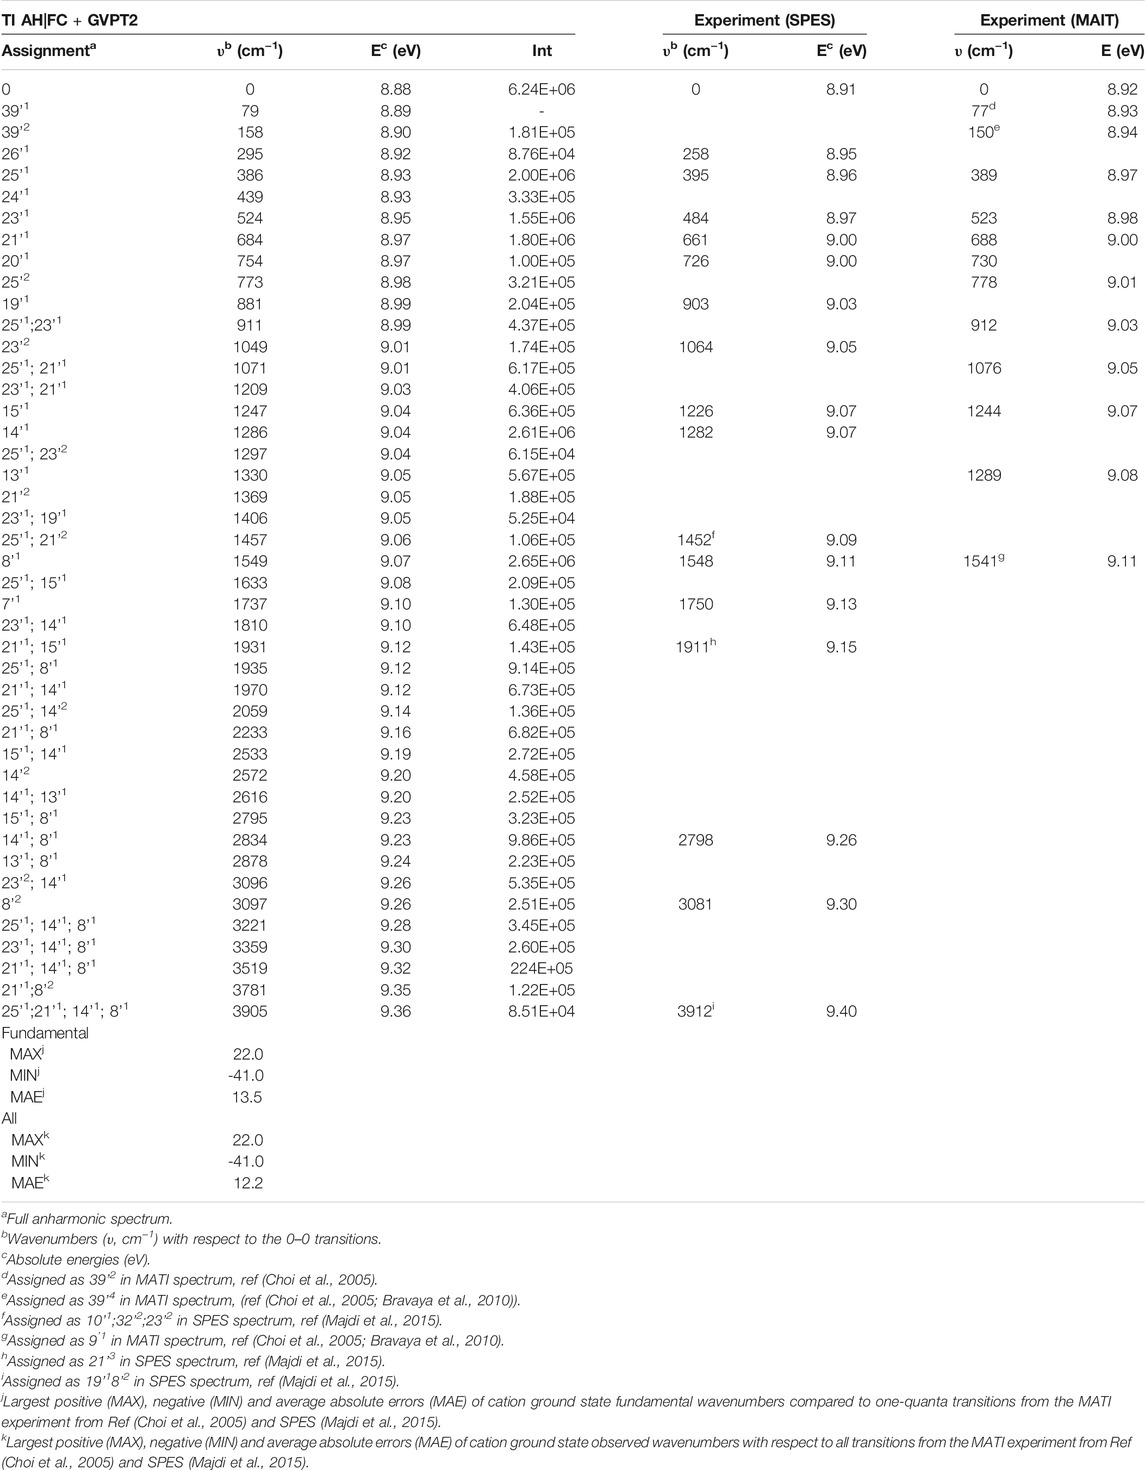
TABLE 3. TI AH|FC photoelectron spectra, selected transitions compared to the SPES and VUV-MATI experimental spectra.
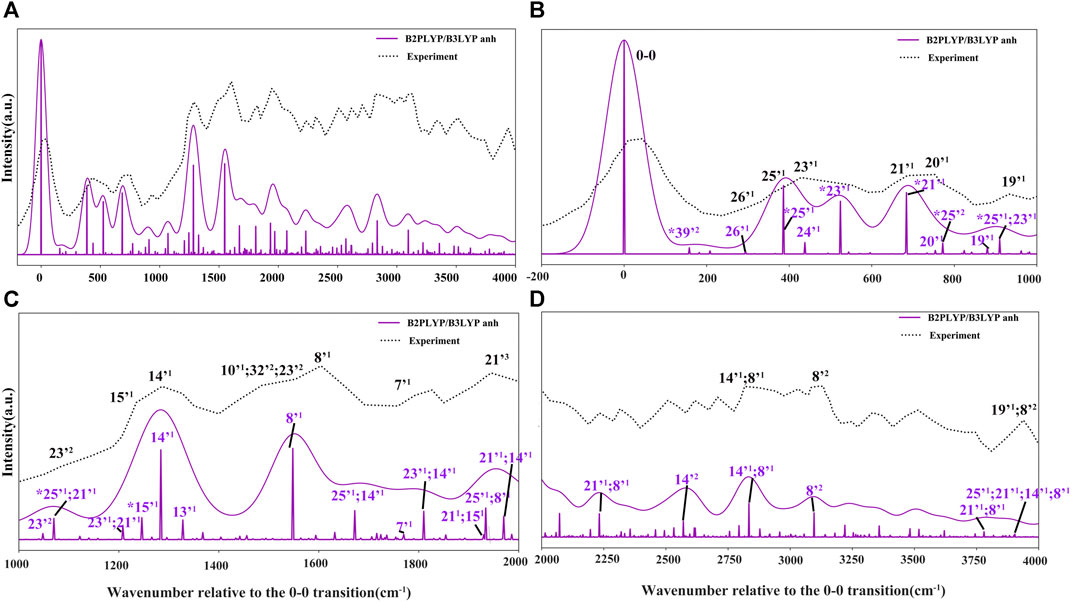
FIGURE 7. Photoelectron TI AH|FC spectrum (60 K) and SPES experimental spectrum (Majdi et al., 2015). The computed spectrum is represented as single transitions, with most intense ones assigned as mn, which represents the final vibrational state with n quanta associated to mode m. The convoluted spectra line-shapes have been obtained by broadening with Gaussian function with HWHM of 50 cm−1. Bands observed also in the VUV-MATI experimental spectrum (Choi et al., 2005; Bravaya et al., 2010) are marked by asterisk (*).
The more detailed comparison, including all experimentally observed transitions of both MATI and SPES spectra is reported in Table 3. In the energy range up to 1000 cm−1 from 0–0, the calculated spectrum shows one-quanta transitions related to |26'1>, |25'1>, |23'1>, |21'1>, |20'1>, |19'1> modes, in agreement with the tentative assignments of experimental spectra proposed previously. Nevertheless, the two lowest transitions observed in the VUV-MATI experiment have been assigned as 2 and 4 quanta progressions of mode 39' > [τ (ring), γ (CH3)] based on the harmonic computations at the B3LYP/6–311+G (d, p) level. At variance, based on anharmonic B2PLYP/B3LYP computations from this work, one and two quanta transitions of [γ (CH3), τ (ring)], matches well the bands at 77 cm−1 and 150 cm−1 from VUV-MATI experiment. Consequently, we reassign these bands to the |39'1> and |39'2> transitions, respectively. The intense |8'1> transition simulated at 1549 cm−1, shows a good agreement with the experimental band at 1541/1548 cm−1 observed in both VUV-MATI and SPES experiments, which have been attributed to |9'1> and |8'1>, respectively, thus confirming the latter assignment. Moreover, for the broad band at about 1900 cm−1, the calculated spectrum suggests assignment to the combination bands |25'1; 8'1>, |21'1; 15'1> instead of previously proposed three-quanta transition of mode 21 (|21'3>), which is over 100 cm−1 blue-shifted and predicted much less intense. For remaining bands in the 0 cm−1 - 2000 cm−1 energy range observed in VUV-MATI and SPES spectra, TI FC|AH computations confirm previously proposed assignments to one and two quanta transitions. In the range of 2000 cm−1 - 4000 cm−1, the TI FC|AH simulations validate the assignment of SPES bands at 2798 cm−1 and 3081 cm−1 to the |14'1; 8'1>, |8'2> transitions, respectively. While, for the band at about 3900 cm−1 a reassignment to four quanta combination |25'1; 21'1; 14’1; 8'1> mode is suggested, instead of the previously proposed three-quanta |19'1; 8'2> one. Overall, the PE spectrum is dominated by the transitions related to the most active modes, with the 2 quanta transitions involving modes 39', 25', 23', 14' and 8' being also important for the assignment of the main peaks. Indeed, the very good agreement with the experimental SPES and VUV-MATI spectra is obtained not only for the fundamental wavenumbers but also includes all observed 22 transitions with MAE of ∼12.2 cm−1.
Finally we would like to notice that the theoretical prediction of the 0–0 transition computed at B2PLYP/AVTZ level in conjunction with GVPT2 B2PLYP/B3LYP anharmonic zero-point-vibrational energies, of 70863 cm−1 (8.79 eV) (Supplementary Table S4), shows an improvement over PBE0/AVDZ and B3LYP/AVTZ but is still differing by over 1000 cm−1 from the experimental VUV-MATI 0–0 transition with the energy of 71920 cm−1 (8.9178 ± 0.001 eV). Improved value is obtained by combining the same anharmonic zero-point-vibrational energies with the adiabatic electronic energy computed at the (R)CCSD(T)-F12(b) (+CV + SR) level (Majdi et al., 2015), leading to 0–0 transition energy of 72092cm−1 (8.94 eV) in agreement within ∼165 cm−1 (∼0.02 eV) with VUV-MATI experiment, highlighting the need for improved estimate of relative electronic energies.
Astrochemical Implications
Good accuracy of simulated vibrational and vibronic spectra, confirmed by comparison with available experimental results allows to provide predictions regarding the “missing” data, with particular relevance of computational support for the astrochemical observations.
In this respect the IR spectra of thymine cation is relevant for the studies of complex atmosphere of Titan, which is an ideal place for understanding the origins of life and chemical reactions due to its similarity to an early Earth environment. According to the data from the Cassini Composite Infrared Spectrometer (CIRS) (Flasar et al., 2005) and other observations (Samuelson et al., 1983; Coustenis et al., 1998; Niemann et al., 2010). Titan’s atmosphere is composed of nitrogen (95–98%), methane (1.8–5.0%), hydrogen (0.1–0.2%), and carbon monoxide (0.005%), with trace amounts of ethane, acetylene, propane, ethylene, hydrogen cyanide, cyanoacetylene, carbon dioxide, water vapor, along with significant amount of hydrocarbons (Cable et al., 2012). This rather dense atmosphere is characterized by a rich and complex organic chemistry (Way et al., 2002; Ali et al., 2013). For this reason, several studies involving the simulation of Titan’s atmosphere have been carried out. The complex organic mixtures that are formed in these simulation experiments (usually by the irradiation of N2, CH4, H2, and CO) are known as “Tholins” (Cassidy et al., 2010). It was already shown that Tholins contain prebiotic molecules, particularly N-bearing cyclic compounds such as purines and pyrimidines. Cassini INMS measurements pointed out the presence of large molecules (>100 amu) in Titan’s atmosphere [see references (Puzzarini et al., 2017) and (Ali et al., 2013)]. Thus, the next step to be undertaken is the astronomical detection of key prebiotic molecules via the observation of their spectroscopic, infrared, or millimeter-wave features. Comparison with “Tholins” vibrational spectra (MIR) allows identifying which of these prebiotic molecules can be plausibly formed at such conditions, thus possibly present in Titan atmosphere.
In Figure 8 the simulated IR spectra of neutral thymine and of its cation in their electronic ground states are superposed to the experimental spectrum of “Tholins” (Gautier et al., 2012) matching well some of its characteristic bands. For instance, the fundamental transition of T+ at about 793 cm−1 [γ (C5-CH3), γ (NH), γ (CH) and τ (ring)] matches well the broad band at 700 cm−1 - 800 cm−1, while the T β (C6H), β (NH) fundamental at 1178 cm−1 fits the shoulder at about 1150 cm−1 - 1200 cm−1. There are also several transitions of both T and T+, which can contribute to the most pronounced band at 1400 cm−1 - 1700 cm−1, such as T+ β (N1H), β (CH3) at about 1494 cm−1 and T [β (N1H), β (C6H)] at about 1475 cm−1 or [ν (C5C6), β (C6H), β (N1H)] at about 1664 cm−1. Moreover, the ν (N1H) of T+ at about 3362 cm−1 corresponds well to the Tholins peak at about 3330 cm−1. However, the intense band in the 2100 cm−1 - 2400 cm−1 range, cannot be associated with neither of T or T+. Moreover, the intense transitions of T and T+ at 1800 cm−1 - 1850 cm−1, are slightly blue-shifted with respect to the Tholins band, thus we can conclude that the IR spectra are roughly consistent with some peaks of the experimental “Tholins” spectrum. Consequently, both species can be potentially present in such complex mixture, but the final confirmation would require further analysis, which can be carried out with the aid of the simulated spectra reported presently.
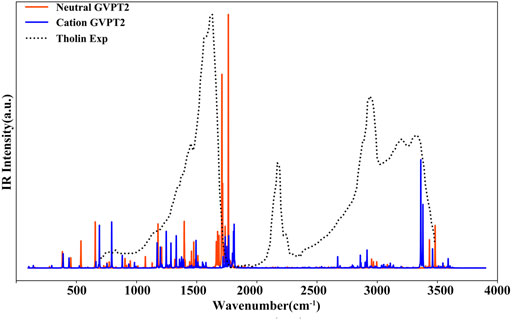
FIGURE 8. Comparison of the simulated IR spectrum of thymine with the experimental spectrum of Tholins (Gautier et al., 2012). GVPT2//B2PLYP//B3LYP/AVTZ stick spectra were broadened by Lorentzian functions with HWHM of 1 cm−1.
Near-infrared spectroscopic studies are employed in order to assist interpretation of data collected by instruments such as SuperCam, ISEM (Infrared Spectrometer for ExoMars) or MicrOmega (Vago et al., 2017) from Mars 2020 (Williford et al., 2018) and ExoMars 2022 (ESZ-Roscosmos) (Vago et al., 2017) space missions. Such investigations target molecular spectroscopic features in NIR, which is less congested in comparison to MIR one. Nevertheless, it requires assignments of molecular vibrational modes in the NIR spectral region, which are very scarce in the literature (Fornaro et al., 2020). Indeed, the analysis of the astrochemical samples needs accurate reference for the assignment and identification of plausible molecules. In this respect, the NIR spectra of gas phase thymine have not been measured experimentally even for the neutral molecule, and is only available for the polycrystalline samples of nucleobases. Besides, the GVPT2//B2PLYP//B3LYP/AVTZ method has been already demonstrated to yield reliable predictions of NIR spectra (Bloino, 2015) but the simulation of thymine polycrystalline NIR spectra has shown to require contributions from monomeric, dimeric, and clustered thymine to reach agreement with experiment (Beć et al., 2019). Moreover, the assignment of NIR bands of gas phase isolated neutral thymine and its cation has not been studied in detail.
For T and T+, wavenumbers and intensities in the NIR range are listed in Table 4, while the spectrum line-shapes are shown in Figure 9, along with the assignment of observed transitions. In the whole NIR range of 4000 cm−1 - 10500 cm−1, two quanta transitions of NH and CH stretches are most intense. While, considering only the 8500 cm−1 - 10500 cm−1 range, three quanta transitions assigned to overtones bands for the excitation of the ν (CH), ν (C5-CH3) stretches are dominant. Remaining overtones and combination bands are related to (ν (NH) ν (CH), ν (C5-CH3)); (β (NH), β (CH), β (C5-CH3)); (γ (NH), γ (CH), γ (CO), γ (C5-CH3)); and δ (ring). As for the MIR range, the neutral and cation of thymine can be clearly distinguished by the NIR measurements.
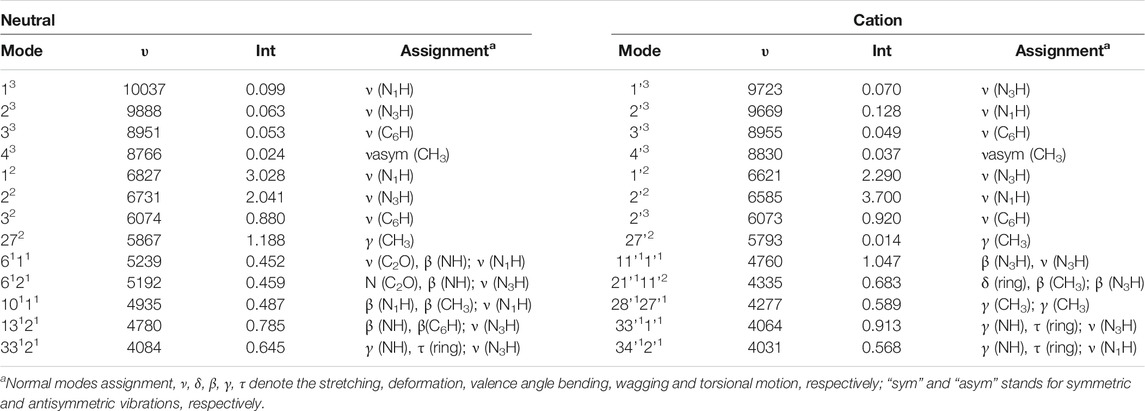
TABLE 4. NIR spectra computed at the GVPT2//B2PLYP//B3LYP/AVTZ level, wavenumbers (υ, cm−1), IR intensities (km/mol) and assignment.
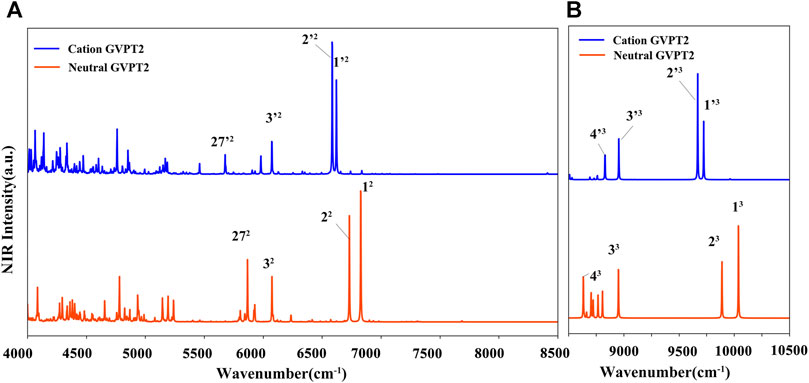
FIGURE 9. (A) (B) NIR spectra simulated at GVPT2//B2PLYP//B3LYP/AVTZ level. Spectra were broadened by Lorentzian functions with HWHM of 1 cm−1. Most intense bands are assigned as mn where n-number of quanta and m is the normal mode.
Finally we should note that photoionization occurs throughout the Universe, so that it is relevant for different astrochemical environments. Depending on the energy of the photon, it can be divided into ultraviolet photoelectron spectroscopy (UPS) and X-ray photoelectron spectroscopy (XPS), the former hitting the low energy of the electron, ejecting off the valence layer electrons, the latter hitting the high energy of the photon, ejecting off the inner layer electrons (Hollas, 2004). In this work we are focusing on the processes initiated by the absorption of a VUV photon leading to the ionization of a valence electron i.e., the
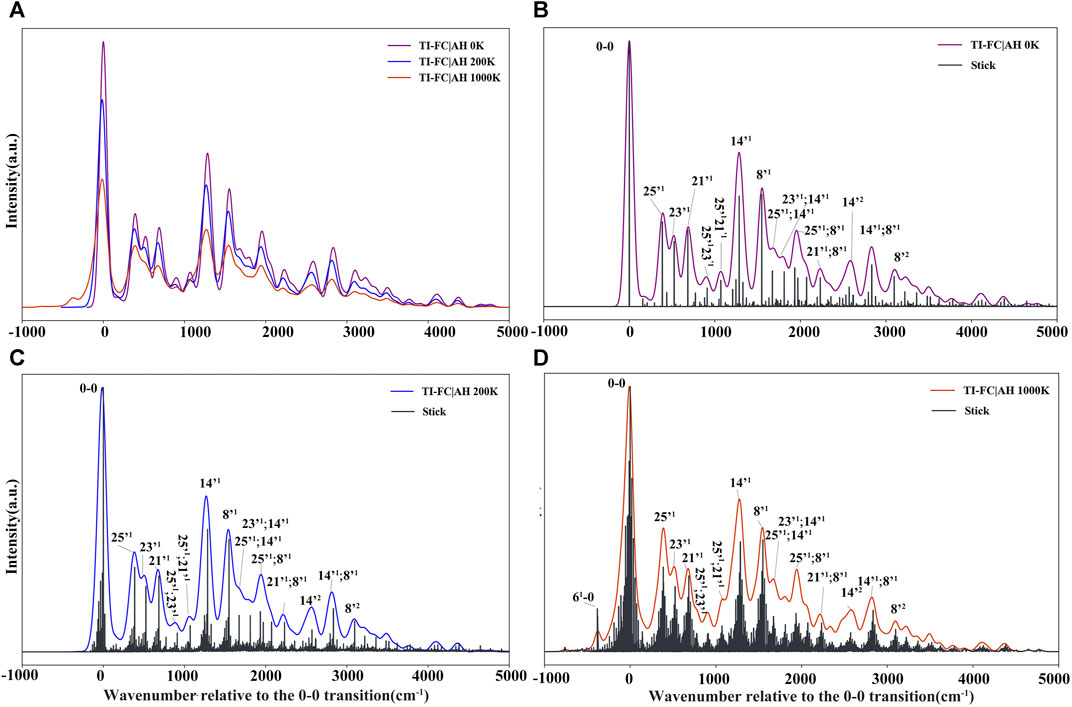
FIGURE 10. Vibrationally resolved electronic spectra: (A) comparison of spectra simulated at 0 K, 200 K, and 1000 K, spectra intensities have been normalized with respect to the most intense band; [(B–D)] convoluted and stick spectra simulated at 0 K, 200 K, and 1000 K, respectively. For all spectra, the line shapes have been convoluted with Gaussian distribution functions with HWHM of 50 cm−1. The assignment for a selected vibronic transition (stick spectrum) is reported, where “mn” and “m’n” represent the vibrational state with n quanta associated with modes m (initial/ground state) and m’ (final/ionic state), respectively.
Conclusion
The anharmonic GVPT2 hybrid B2PLYP//B3LYP/AVTZ computations for the thymine neutral state
The reliability of simulated spectra can be exploited to provide data for situations where the experimental observations have not been performed or are not feasible, with their potential applications supporting astrochemical studies. In this work, we have selected some possible cases, such as the analysis of infrared spectra of “Tholins”, the near-infrared spectra of samples from the Mars missions or the photoelectron spectra in cold and hot environments, from 0 to 1000 K. These examples have been selected due to the increasing role of the analysis of vibrational features in astrochemical studies, and can be extended toward more complex cases, as for instance the simulation of spectra of planet soil mixtures (Fornaro et al., 2014; Fornaro et al., 2020) or molecules absorbed on grains or ices (Barone et al., 2015).
Data Availability Statement
The original contributions presented in the study are included in the article/Supplementary Material, further inquiries can be directed to the corresponding author.
Author Contributions
MB and MH designed the research; YZ performed the calculations; YZ and MB analyzed the data. YZ and MB prepared the original draft; MB and MH reviewed and edited final manuscript.
Funding
This work was enabled by the financial support from the National Natural Science Foundation of China (Grant No. 31870738). M.H. thanks the Programme National “Physique et Chimie du Milieu Interstellaire” (PCMI) of Centre National de la Recherche Scientifique (CNRS)/Institut National des Sciences de l’Univers (INSU) with Institut de Chimie (INC)/Institut de Physique (INP) co-funded by Commissariat à l’Energie Atomique (CEA) and Centre National d’Etudes Spatiales (CNES).
Conflict of Interest
The authors declare that the research was conducted in the absence of any commercial or financial relationships that could be construed as a potential conflict of interest.
Publisher’s Note
All claims expressed in this article are solely those of the authors and do not necessarily represent those of their affiliated organizations, or those of the publisher, the editors and the reviewers. Any product that may be evaluated in this article, or claim that may be made by its manufacturer, is not guaranteed or endorsed by the publisher.
Supplementary Material
The Supplementary Material for this article can be found online at: https://www.frontiersin.org/articles/10.3389/fspas.2021.757007/full#supplementary-material
References
Ali, A., Sittler, E. C., Chornay, D., Rowe, B. R., and Puzzarini, C. (2013). Cyclopropenyl Cation - the Simplest Huckel's Aromatic Molecule - and its Cyclic Methyl Derivatives in Titan's Upper Atmosphere. Planet. Space Sci. 87, 96–105. doi:10.1016/j.pss.2013.07.007
Allamandola, L. J., Tielens, A. G. G. M., and Barker, J. R. (1989). Interstellar Polycyclic Aromatic Hydrocarbons-the Infrared Emission Bands, the Excitation/emission Mechanism, and the Astrophysical Implications. Astrophys. J. Suppl. Ser. 71, 733–775. doi:10.1086/191396
Amos, R. D., Handy, N. C., Green, W. H., Jayatilaka, D., Willetts, A., and Palmieri, P. (1991). Anharmonic Vibrational Properties of CH2F2: A Comparison of Theory and experiment. J. Chem. Phys. 95 (11), 8323–8336. doi:10.1063/1.461259
Arumainayagam, C. R., Herbst, E., Heays, A. N., Mullikin, E., and Mavros, M. G. (2021). Extraterrestrial Photochemistry: Principles and Applications. Prebiotic Photochemistry: From Urey–Miller-like Experiments to Recent Findings, 9–36. doi:10.1039/9781839164354-00009
Barone, V., Bloino, J., Biczysko, M., and Santoro, F. (2009). Fully Integrated Approach to Compute Vibrationally Resolved Optical Spectra: from Small Molecules to Macrosystems. J. Chem. Theor. Comput. 5 (3), 540–554. doi:10.1021/ct8004744
Barone, V., Biczysko, M., and Bloino, J. (2014). Fully Anharmonic IR and Raman Spectra of Medium-Size Molecular Systems: Accuracy and Interpretation. Phys. Chem. Chem. Phys. 16 (5), 1759–1787. doi:10.1039/C3CP53413H
Barone, V., Biczysko, M., and Puzzarini, C. (2015). Quantum Chemistry Meets Spectroscopy for Astrochemistry: Increasing Complexity toward Prebiotic Molecules. Acc. Chem. Res. 48 (5), 1413–1422. doi:10.1021/ar5003285
Barone, V., Alessandrini, S., Biczysko, M., Cheeseman, J. R., Clary, D. C., McCoy, A. B., et al. (2021). Computational Molecular Spectroscopy. Nat. Rev. Methods Primers 1 (1), 38. doi:10.1038/s43586-021-00034-1
Barone, V. (2005). Anharmonic Vibrational Properties by a Fully Automated Second-Order Perturbative Approach. J. Chem. Phys. 122 (1), 014108. doi:10.1063/1.1824881
Beć, K. B., Grabska, J., Ozaki, Y., Czarnecki, M. A., and Huck, C. W. (2019). Simulated NIR Spectra as Sensitive Markers of the Structure and Interactions in Nucleobases. Sci. Rep. 9 (1), 1–13. doi:10.1038/s41598-019-53827-6
Becke, A. D. (1993). A New Mixing of Hartree-Fock and Local Density‐functional Theories. J. Chem. Phys. 98 (2), 1372–1377. doi:10.1063/1.464304
Biczysko, M., Panek, P., Scalmani, G., Bloino, J., and Barone, V. (2010). Harmonic and Anharmonic Vibrational Frequency Calculations with the Double-Hybrid B2PLYP Method: Analytic Second Derivatives and Benchmark Studies. J. Chem. Theor. Comput. 6 (7), 2115–2125. doi:10.1021/ct100212p
Biczysko, M., Bloino, J., and Puzzarini, C. (2017). Computational Challenges in Astrochemistry. Wires Comput. Mol. Sci. 8 (3), e1349. doi:10.1002/wcms.1349
Bloino, J., and Barone, V. (2012). A Second-Order Perturbation Theory Route to Vibrational Averages and Transition Properties of Molecules: General Formulation and Application to Infrared and Vibrational Circular Dichroism Spectroscopies. J. Chem. Phys. 136 (12), 124108. doi:10.1063/1.3695210
Bloino, J., Biczysko, M., and Barone, V. (2015). Anharmonic Effects on Vibrational Spectra Intensities: Infrared, Raman, Vibrational Circular Dichroism, and Raman Optical Activity. J. Phys. Chem. A. 119 (49), 11862–11874. doi:10.1021/acs.jpca.5b10067
Bloino, J., Baiardi, A., and Biczysko, M. (2016). Aiming at an Accurate Prediction of Vibrational and Electronic Spectra for Medium‐to‐large Molecules: An Overview. Int. J. Quan. Chem. 116 (21), 1543–1574. doi:10.1002/qua.25188
Bloino, J. (2015). A VPT2 Route to Near-Infrared Spectroscopy: The Role of Mechanical and Electrical Anharmonicity. J. Phys. Chem. A. 119 (21), 5269–5287. doi:10.1021/jp509985u
Bravaya, K. B., Kostko, O., Dolgikh, S., Landau, A., Ahmed, M., and Krylov, A. I. (2010). Electronic Structure and Spectroscopy of Nucleic Acid Bases: Ionization Energies, Ionization-Induced Structural Changes, and Photoelectron Spectra. J. Phys. Chem. A. 114 (46), 12305–12317. doi:10.1021/jp1063726
Brown, R. D., Godfrey, P. D., McNaughton, D., and Pierlot, A. P. (1989). Microwave Spectrum of the Major Gas-phase Tautomer of Thymine. J. Chem. Soc. Chem. Commun. (1), 37–38. doi:10.1039/C39890000037
Cable, M. L., Hörst, S. M., Hodyss, R., Beauchamp, P. M., Smith, M. A., and Willis, P. A. (2012). Titan Tholins: Simulating Titan Organic Chemistry in the Cassini-Huygens Era. Chem. Rev. 112 (3), 1882–1909. doi:10.1021/cr200221x
Callahan, M. P., Smith, K. E., Cleaves, H. J., Ruzicka, J., Stern, J. C., Glavin, D. P., et al. (2011). Carbonaceous Meteorites Contain a Wide Range of Extraterrestrial Nucleobases. Proc. Natl. Acad. Sci. 108 (34), 13995–13998. doi:10.1073/pnas.1106493108
Cassidy, T., Coll, P., Raulin, F., Carlson, R. W., Johnson, R. E., Loeffler, M. J., et al. (2010). Radiolysis and Photolysis of Icy Satellite Surfaces: Experiments and Theory. Space Sci. Rev. 153 (1), 299–315. doi:10.1007/s11214-009-9625-3
Choi, K.-W., Lee, J.-H., and Kim, S. K. (2005). Ionization Spectroscopy of a DNA Base: Vacuum-Ultraviolet Mass-Analyzed Threshold Ionization Spectroscopy of Jet-Cooled Thymine. J. Am. Chem. Soc. 127 (45), 15674–15675. doi:10.1021/ja055018u1
Colarusso, P., Zhang, K. Q., Guo, B., and Bernath, P. F. (1997). The Infrared Spectra of Uracil, Thymine, and Adenine in the Gas Phase. Chem. Phys. Lett. 269 (1-2), 39–48. doi:10.1016/s0009-2614(97)00245-5
Condon, E. (1926). A Theory of Intensity Distribution in Band Systems. Phys. Rev. 28 (6), 1182–1201. doi:10.1103/PhysRev.28.1182
Condon, E. U. (1928). Nuclear Motions Associated with Electron Transitions in Diatomic Molecules. Phys. Rev. 32 (6), 858–872. doi:10.1103/PhysRev.32.858
Coustenis, A., Salama, A., Lellouch, E., Encrenaz, T., Bjoraker, G., Samuelson, R., et al. (1998). Evidence for Water Vapor in Titan's Atmosphere from ISO/SWS Data. Astron. Astrophys. 336, L85–L89.
Doktorov, E. V., Malkin, I. A., and Man'ko, V. I. (1977). Dynamical Symmetry of Vibronic Transitions in Polyatomic Molecules and the Franck-Condon Principle. J. Mol. Spectrosc. 64 (2), 302–326. doi:10.1016/0022-2852(77)90269-7
Dunning, T. H., and Thom, H. (1989). Gaussian Basis Sets for Use in Correlated Molecular Calculations. I. The Atoms boron through Neon and Hydrogen. J. Chem. Phys. 90 (2), 1007–1023. doi:10.1063/1.456153
Duschinsky, F. (1937). The Importance of the Electron Spectrum in Multi Atomic Molecules. Concerning the Franck-Condon Principle. Acta Physicochim. URSS 7, 551–566.
Flasar, F. M., Achterberg, R., Conrath, B., Gierasch, P., Kunde, V., Nixon, C., et al. (2005). Titan's Atmospheric Temperatures, Winds, and Composition. Science 308 (5724), 975–978. doi:10.1126/science.1111150
Fornaro, T., Biczysko, M., Monti, S., and Barone, V. (2014). Dispersion Corrected DFT Approaches for Anharmonic Vibrational Frequency Calculations: Nucleobases and Their Dimers. Phys. Chem. Chem. Phys. 16 (21), 10112–10128. doi:10.1039/C3CP54724H
Fornaro, T., Burini, D., Biczysko, M., and Barone, V. (2015). Hydrogen-Bonding Effects on Infrared Spectra from Anharmonic Computations: Uracil-Water Complexes and Uracil Dimers. J. Phys. Chem. A. 119 (18), 4224–4236. doi:10.1021/acs.jpca.5b01561
Fornaro, T., Biczysko, M., Bloino, J., and Barone, V. (2016). Reliable Vibrational Wavenumbers for CO and N-H Stretchings of Isolated and Hydrogen-Bonded Nucleic Acid Bases. Phys. Chem. Chem. Phys. 18 (12), 8479–8490. doi:10.1039/C5CP07386C
Fornaro, T., Brucato, J. R., Poggiali, G., Corazzi, M. A., Biczysko, M., Jaber, M., et al. (2020). UV Irradiation and Near Infrared Characterization of Laboratory Mars Soil Analog Samples. Front. Astron. Space Sci. 7 (91), 539289. doi:10.3389/fspas.2020.539289
Foster, J. P., and Weinhold, F. (1980). Natural Hybrid Orbitals. J. Am. Chem. Soc. 102 (24), 7211–7218. doi:10.1021/ja00544a007
Franck, J., and Dymond, E. G. (1926). Elementary Processes of Photochemical Reactions. Trans. Faraday Soc. 21 (2), 536–542. doi:10.1039/TF9262100536
Franke, P. R., Stanton, J. F., and Douberly, G. E. (2021). How to VPT2: Accurate and Intuitive Simulations of CH Stretching Infrared Spectra Using VPT2+K with Large Effective Hamiltonian Resonance Treatments. J. Phys. Chem. A. 125 (6), 1301–1324. doi:10.1021/acs.jpca.0c09526
Frisch, M., Trucks, G., Schlegel, H., Scuseria, G., Robb, M., Cheeseman, J., et al. (2016). Gaussian 16, Revision A. 03, 2 (4). Wallingford CT: Gaussian inc.
Gautier, T., Carrasco, N., Mahjoub, A., Vinatier, S., Giuliani, A., Szopa, C., et al. (2012). Mid- and Far-Infrared Absorption Spectroscopy of Titan's Aerosols Analogues. Icarus 221 (1), 320–327. doi:10.1016/j.icarus.2012.07.025
Grimme, S. (2006). Semiempirical Hybrid Density Functional with Perturbative Second-Order Correlation. J. Chem. Phys. 124 (3), 034108. doi:10.1063/1.2148954
Herzberg, G. (1988). Historical Remarks on the Discovery of Interstellar Molecules. J. R. Astron. Soc. Can. 82, 115. doi:10.1029/JA093iA06p05992
Hoadley, K., France, K., Nell, N., Kane, R., Fleming, B., Youngblood, A., et al. (2020). CHESS: An Innovative Concept for High-Resolution, Far-UV Spectroscopy. Exp. Astron. 50 (2), 233–264. doi:10.1007/s10686-020-09670-z
Kendall, R. A., Dunning, T. H., and Harrison, R. J. (1992). Electron Affinities of the First‐row Atoms Revisited. Systematic Basis Sets and Wave Functions. J. Chem. Phys. 96 (9), 6796–6806. doi:10.1063/1.462569
Krasnoshchekov, S. V., Vogt, N., and Stepanov, N. F. (2015). Ab Initio Anharmonic Analysis of Vibrational Spectra of Uracil Using the Numerical-Analytic Implementation of Operator Van Vleck Perturbation Theory. J. Phys. Chem. A. 119 (25), 6723–6737. doi:10.1021/acs.jpca.5b03241
Lasne, J. (2021). Heterogeneous Physical Chemistry in the Atmospheres of Earth, Mars, and Venus: Perspectives for Rocky Exoplanets. ACS Earth Space Chem. 5 (2), 149–162. doi:10.1021/acsearthspacechem.0c00126
Leś, A., Adamowicz, L., Nowak, M. J., and Lapinski, L. (1992). The Infrared Spectra of Matrix Isolated Uracil and Thymine: an Assignment Based on New Theoretical Calculations. Spectrochim. Acta A. 48 (10), 1385–1395. doi:10.1016/0584-8539(92)80144-l
Majdi, Y., Hochlaf, M., Pan, Y., Lau, K.-C., Poisson, L., Garcia, G. A., et al. (2015). Theoretical and Experimental Photoelectron Spectroscopy Characterization of the Ground State of Thymine Cation. J. Phys. Chem. A. 119 (23), 5951–5958. doi:10.1021/jp510716c
Martin, J. M. L., Lee, T. J., Taylor, P. R., and François, J. P. (1995). The Anharmonic Force Field of Ethylene, C2H4, by Means of Accurate Ab Initio Calculations. J. Chem. Phys. 103 (7), 2589–2602. doi:10.1063/1.469681
Materese, C. K., Nuevo, M., Bera, P. P., Lee, T. J., and Sandford, S. A. (2013). Thymine and Other Prebiotic Molecules Produced from the Ultraviolet Photo-Irradiation of Pyrimidine in Simple Astrophysical Ice Analogs. Astrobiology 13 (10), 948–962. doi:10.1089/ast.2013.1044
Materese, C. K., Nuevo, M., and Sandford, S. A. (2017). The Formation of Nucleobases from the Ultraviolet Photoirradiation of Purine in Simple Astrophysical Ice Analogues. Astrobiology 17 (8), 761–770. doi:10.1089/ast.2016.1613
McCarthy, M. C., Lee, K. L. K., Loomis, R. A., Burkhardt, A. M., Shingledecker, C. N., Charnley, S. B., et al. (2021). Interstellar Detection of the Highly Polar Five-Membered Ring Cyanocyclopentadiene. Nat. Astron. 5 (2), 176–180. doi:10.1038/s41550-020-01213-y
McGuire, B. A., Burkhardt, A. M., Kalenskii, S., Shingledecker, C. N., Remijan, A. J., Herbst, E., et al. (2018). Detection of the Aromatic Molecule Benzonitrile (C-C6H5CN) in the Interstellar Medium. Science 359, 202–205. doi:10.1126/science.aao4890
Mendolicchio, M., Bloino, J., and Barone, V. (2021). General Perturb-Then-Diagonalize Model for the Vibrational Frequencies and Intensities of Molecules Belonging to Abelian and Non-Abelian Symmetry Groups. J. Chem. Theor. Comput. 17, 4332–4358. doi:10.1021/acs.jctc.1c00240
Mills, I. M. (1972). “Vibration-Rotation Structure in Asymmetric- and Symmetric-Top Molecules,” in Molecular Spectroscopy: Modern Research. Editors R. KN, and M. CW (London: Elsevier), 115–140. doi:10.1016/b978-0-12-580640-4.50013-3
Nielsen, H. H. (1951). The Vibration-Rotation Energies of Molecules. Rev. Mod. Phys. 23 (2), 90–136. doi:10.1103/RevModPhys.23.90
Niemann, H. B., Atreya, S. K., Demick, J. E., Gautier, D., Haberman, J. A., Harpold, D. N., et al. (2010). Composition of Titan's Lower Atmosphere and Simple Surface Volatiles as Measured by the Cassini-Huygens Probe Gas Chromatograph Mass Spectrometer experiment. J. Geophys. Res. 115 (E12006), 1–22. doi:10.1029/2010JE003659
Nowak, M. J. (1989). IR Matrix Isolation Studies of Nucleic Acid Constituents: the Spectrum of Monomeric Thymine. J. Mol. Struct. 193, 35–49. doi:10.1016/0022-2860(89)80119-x
Oba, Y., Takano, Y., Naraoka, H., Watanabe, N., and Kouchi, A. (2019). Nucleobase Synthesis in Interstellar Ices. Nat. Commun. 10 (1), 1–8. doi:10.1038/s41467-019-12404-1
Peterson, K. A., and Dunning, T. H. (2002). Accurate Correlation Consistent Basis Sets for Molecular Core-Valence Correlation Effects: The Second Row Atoms Al-Ar, and the First Row Atoms B-Ne Revisited. J. Chem. Phys. 117 (23), 10548–10560. doi:10.1063/1.1520138
Pulay, P., Meyer, W., and Boggs, J. E. (1978). Cubic Force Constants and Equilibrium Geometry of Methane from Hartree-Fock and Correlated Wavefunctions. J. Chem. Phys. 68 (11), 5077–5085. doi:10.1063/1.435626
Puzzarini, C., and Barone, V. (2020a). The Challenging Playground of Astrochemistry: an Integrated Rotational Spectroscopy - Quantum Chemistry Strategy. Phys. Chem. Chem. Phys. 22 (12), 6507–6523. doi:10.1039/D0CP00561D
Puzzarini, C., and Barone, V. (2020b). A Never-Ending story in the Sky: The Secrets of Chemical Evolution. Phys. Life Rev. 32, 59–94. doi:10.1016/j.plrev.2019.07.001
Puzzarini, C., Biczysko, M., Bloino, J., and Barone, V. (2014). Accurate Spectroscopic Characterization of Oxirane: a Valuable Route to its Identification in Titan's Atmosphere and the Assignment of Unidentified Infrared Bands. Astron J. 785 (2), 107. doi:10.1088/0004-637x/785/2/107
Puzzarini, C., Baiardi, A., Bloino, J., Barone, V., Murphy, T. E., Drew, H. D., et al. (2017). Spectroscopic Characterization of Key Aromatic and Heterocyclic Molecules: a Route toward the Origin of Life. Astron j. 154 (3), 82. doi:10.3847/1538-3881/aa7d54
Raghavachari, K., Trucks, G. W., Pople, J. A., and Head-Gordon, M. (1989). A Fifth-Order Perturbation Comparison of Electron Correlation Theories. Chem. Phys. Lett. 157 (6), 479–483. doi:10.1016/S0009-2614(89)87395-6
Reed, A. E., and Weinhold, F. (1983). Natural Bond Orbital Analysis of near‐Hartree-Fock Water Dimer. J. Chem. Phys. 78 (6), 4066–4073. doi:10.1063/1.445134
Rosnik, A. M., and Polik, W. F. (2014). VPT2+K Spectroscopic Constants and Matrix Elements of the Transformed Vibrational Hamiltonian of a Polyatomic Molecule with Resonances Using Van Vleck Perturbation Theory. Mol. Phys. 112 (2), 261–300. doi:10.1080/00268976.2013.808386
Samuelson, R. E., Maguire, W. C., Hanel, R. A., Kunde, V. G., Jennings, D. E., Yung, Y. L., et al. (1983). CO2on Titan. J. Geophys. Res. 88 (A11), 8709–8715. doi:10.1029/JA088iA11p08709
Sandford, S. A., Nuevo, M., Bera, P. P., and Lee, T. J. (2020). Prebiotic Astrochemistry and the Formation of Molecules of Astrobiological Interest in Interstellar Clouds and Protostellar Disks. Chem. Rev. 120 (11), 4616–4659. doi:10.1021/acs.chemrev.9b00560
Santoro, F., Improta, R., Lami, A., Bloino, J., and Barone, V. (2007a). Effective Method to Compute Franck-Condon Integrals for Optical Spectra of Large Molecules in Solution. J. Chem. Phys. 126 (8), 084509. doi:10.1063/1.2437197
Santoro, F., Lami, A., Improta, R., and Barone, V. (2007b). Effective Method to Compute Vibrationally Resolved Optical Spectra of Large Molecules at Finite Temperature in the Gas Phase and in Solution. J. Chem. Phys. 126 (18), 184102. doi:10.1063/1.2721539
Santoro, F., Lami, A., Improta, R., Bloino, J., and Barone, V. (2008). Effective Method for the Computation of Optical Spectra of Large Molecules at Finite Temperature Including the Duschinsky and Herzberg-Teller Effect: The Qx Band of Porphyrin as a Case Study. J. Chem. Phys. 128 (22), 224311. doi:10.1063/1.2929846
Serrano-Andrés, L., and Merchán, M. (2009). Are the Five Natural DNA/RNA Base Monomers a Good Choice from Natural Selection?. J. Photochem. Photobiol. C: Photochem. Rev. 10 (1), 21–32. doi:10.1016/j.jphotochemrev.2008.12.001
Sharp, T. E., and Rosenstock, H. M. (1964). Franck-Condon Factors for Polyatomic Molecules. J. Chem. Phys. 41 (11), 3453–3463. doi:10.1063/1.1725748
Stoks, P. G., and Schwartz, A. W. (1979). Uracil in Carbonaceous Meteorites. Nature 282 (5740), 709–710. doi:10.1038/282709a0
Szczepaniak, K., Szczesniak, M. M., and Person, W. B. (2000). Raman and Infrared Spectra of Thymine. A Matrix Isolation and DFT Study†. J. Phys. Chem. A. 104 (16), 3852–3863. doi:10.1021/jp994410p
Vázquez, J., and Stanton, J. F. (2007). Treatment of Fermi Resonance Effects on Transition Moments in Vibrational Perturbation Theory. Mol. Phys. 105 (1), 101–109. doi:10.1080/00268970601135784
Vago, J. L., Westall, F., Pasteur Instrument Teams, Landing S, A. J., Coates, A. J., Jaumann, R., Korablev, O., et al. (2017). Habitability on Early Mars and the Search for Biosignatures with the ExoMars Rover. Astrobiology 17 (6-7), 471–510. doi:10.1089/ast.2016.1533
Vago, J. L., Coates, A. J., Jaumann, R., Korablev, O., Ciarletti, V., Mitrofanov, I., et al. (2018). “Searching for Traces of Life with the ExoMars Rover,” in From Habitability to Life on Mars. Editors N.A. Cabrol, and E.A. Grin (Amsterdam: Elsevier), 309–347. doi:10.1016/b978-0-12-809935-3.00011-6
Vogt, N., Demaison, J., Ksenafontov, D. N., and Rudolph, H. D. (2014). A Benchmark Study of Molecular Structure by Experimental and Theoretical Methods: Equilibrium Structure of Thymine from Microwave Rotational Constants and Coupled-Cluster Computations. J. Mol. Struct. 1076, 483–489. doi:10.1016/j.molstruc.2014.08.004
Niemann, H. B., Raulin, F., Mauersberger, K., Harpold, D., Gautier, D., Niemann, H. B. O., et al. (2002). The Gas Chromatograph Mass Spectrometer for the Huygens Probe. Space Sci. Rev. 104 (1-4), 553–591. doi:10.1023/A:1023680305259
Williford, K. H., Farley, K. A., Stack, K. M., Allwood, A. C., Beaty, D., Beegle, L. W., et al. (2018). “The NASA Mars 2020 Rover Mission and the Search for Extraterrestrial Life,” in From Habitability to Life on Mars. Editors N.A. Cabrol, and E. A. Grin (Amsterdam: Elsevier), 275–308. doi:10.1016/b978-0-12-809935-3.00010-4
Keywords: vibrational spectra, vibrationally resolved electronic spectra, density functional theory, anharmonic, VPT2, Franck-Condon computations, NIR, photoionization
Citation: Zhao Y, Hochlaf M and Biczysko M (2021) Identification of DNA Bases and Their Cations in Astrochemical Environments: Computational Spectroscopy of Thymine as a Test Case. Front. Astron. Space Sci. 8:757007. doi: 10.3389/fspas.2021.757007
Received: 11 August 2021; Accepted: 20 September 2021;
Published: 14 October 2021.
Edited by:
Ryan C. Fortenberry, University of Mississippi, United StatesReviewed by:
Shubhadip Chakraborty, UMR6251 Institut de Physique de Rennes (IPR), FranceAlbert Rimola, Universitat Autònoma de Barcelona, Spain
Copyright © 2021 Zhao, Hochlaf and Biczysko. This is an open-access article distributed under the terms of the Creative Commons Attribution License (CC BY). The use, distribution or reproduction in other forums is permitted, provided the original author(s) and the copyright owner(s) are credited and that the original publication in this journal is cited, in accordance with accepted academic practice. No use, distribution or reproduction is permitted which does not comply with these terms.
*Correspondence: Malgorzata Biczysko, Ymljenlza29AaS5zaHUuZWR1LmNu