- Solar Stellar and Planetary Science Division, Center for Astrophysics, Harvard & Smithsonian, Cambridge, MA, United States
We have on hand some 25 years of nearly uninterrupted high-quality and high-cadence global helioseismic data. The Global Oscillations Network Group (GONG) project has been producing science quality data since 1995, the Michelson Doppler Imager (MDI) started in 1996, and the Helioseismic and Magnetic Imager (HMI) took over in 2010. Fundamental new constraints have been imposed by helioseismic inferences, yet global helioseismology data processing seems somewhat frozen in time for some of its methodologies. I review and discuss some specific aspects of global helioseismology data analysis, with an emphasis on the issues and challenges presented by mode fitting and inversion techniques. I compare and contrast results derived by different fitting methods, whether using different techniques, different lengths of time series, or different fitting parameters, like leakage matrices or the inclusion or omission of the mode profile asymmetry, leading to our current best handle on the residual systematic errors.
1 Introduction
In 1995, the Global Oscillations Network Group (GONG) project started acquiring nearly continuous helioseismic observations using a network of six nearly identical instruments deployed around the globe in both the northern and southern hemispheres (Harvey et al., 1996). The GONG instrument design is based on a Michelson interferometer called a Fourier tachometer (Beckers and Brown, 1978); while it was initially outfitted with 256-by-242-pixel detectors, the cameras were a little later upgraded to 1,024-by-1,024-pixel detectors (in the 2001–2002 time frame).
Almost a year later, the Michelson Doppler Imager (MDI), flying on board the Solar and Heliospheric Observatory (SOHO), started its nearly continuous helioseismic observations. The MDI instrument used two tunable Michelson interferometers centered around the Ni I photospheric absorption line at 6767.8 Å (Title and Ramsey, 1980). Since SOHO is in a halo orbit around the Sun–Earth L1 Lagrangian point, the available telemetry was limited; therefore, the 1,204-by-1,024-pixel full-disk images had to be binned down on board the spacecraft to 256-by-256-pixel images to fit within the telemetry rate and still provide continuous helioseismic observations, known as the Structure program (Scherrer et al., 1995). Contact with the SOHO spacecraft was at some point lost and later recovered; hence, the MDI observations have a high duty cycle along with two long gaps in late 1998 and early 1999.
In 2010, the Helioseismic and Magnetic Imager (HMI), flying on board the Solar Dynamics Observatory (SDO), started its nearly continuous helioseismic observations. The HMI instrument is conceptually very similar to MDI but is centered around the Fe I absorption line at 6173 Å and uses 4,096-by-4,096-pixel detectors and a 45 s observing cadence (Scherrer et al., 2012), while GONG and MDI use a 60 s observing cadence. Since SDO is in an inclined geosynchronous orbit, it allows nearly continuous, high-data-rate telemetry, thus leading to the acquisition of nearly continuous full-disk images. After nearly a year of coeval observations with HMI, the MDI observation program was terminated in 2011.
For historical reasons, the GONG project reduces its observations in 36-day-long chunks and performs mode fitting, based on Anderson et al. (1990), using 108-day-long time series starting every 36 days. The MDI and the HMI observations are reduced in 72-day-long chunks and the mode fitting, based on a very different approach (Schou, 1992; Larson and Schou, 2015), uses 72-day and 360-day-long abutting time series. Hence, direct comparison of mode characteristics between GONG and MDI or HMI, computed by the respective projects, is for the least tricky and neither project has attempted to implement either a more modern and sophisticated fitting methodology or a more systematic approach to fitting longer time series.
The GONG fitting methodology (Anderson et al., 1990) is known to have its pitfalls since it fits what it considers individual modes with not built-in knowledge of the leakage matrix, has no gap filling, and uses a symmetric mode profile. Some of these individual modes are known to be blended modes, and thus, their measurements have known systematic errors, while the mode profile is known to be asymmetric (Duvall et al., 1993; Hill et al., 1998; Howe and Hill, 1998; Howe and Thompson, 1998; Komm et al., 1998). Similarly, the methodology used to fit the MDI and HMI observations does not fit individual modes but uses an expansion in m to characterize the frequency splittings. It does include a model of the leakage matrix, and it includes, or not, an asymmetric mode profile; yet despite the extensive work presented in Larson and Schou (2015), residual systematic errors are still present.
A drastically different approach has been developed in Korzennik (2005) and later improved in Korzennik (2008a) and Korzennik (2008b), using long time series at first, but also shorter ones, and a logical progression and regular spacing.1 Expanding on this approach, I present results from fitting the longest to date available time series, namely, a 9,216-day-long time series of GONG observations and results from fitting 4,608-day-long and 2,304-day-long time series of MDI and HMI observations, respectively.
Leveraging the high SNR and low background noise of such long time series, I explore the precision and systematic errors primarily associated with the specifics of the leakage matrix used to carry out the mode fitting, but also the effect of averaging two shorter time series versus fitting a longer time series, or fitting coeval observations using different instruments.
2 Data sets
The data sets used for this work are time series of spherical harmonic coefficients computed by the GONG, MDI, and HMI projects using the respective projects’ pipeline processing.
For GONG, these correspond to a weighted mean of spherical harmonic coefficients computed for each coeval dopplergram acquired by the GONG network at any given time. The procedures used by the GONG project to calibrate the raw images and to compute these spherical harmonic coefficients are described in Harvey et al. (1996). To date, these are available on a 1-min cadence for 9,720 days (or 26.6 years), starting on 1995.05.07 and ending on 2022.01.20. While the GONG project does not perform any gap filling, I have adapted the maximum entropy gap filling methodology as coded by Rasmus Munk Larsen to fill these time series. This methodology is used for gap filling in the MDI and HMI time series and is based on Fahlman and Ulrych (1982). This increased the overall GONG fill factor from 85.4% to 95.0%.
For MDI, these correspond to the spatial decomposition of the on-board Gaussian-smoothed 1,024-by-1,024-pixel full-disk images of the Structure program. This program took continuous observations at a 1-min cadence, reducing them, on board the spacecraft, to 256- by-256-pixel images to fit within the continuously available telemetry. The procedures used by the MDI project to calibrate the raw images and to compute these spherical harmonic coefficients are described in Scherrer et al. (1995). They are available for 5,472 days, starting on 1996.05.01 and ending on 2011.04.24, with an overall fill factor of 93.6%, after gap filling, with two long gaps when contact with the SOHO spacecraft was lost; the average fill factor, when excluding these gaps, is 96.7%, after gap filling.
For HMI, these correspond to the spatial decomposition of 4,096-by-4,096-pixel full-disk images acquired nearly continuously at a 45 s cadence. The procedures used by the HMI project to calibrate the raw images and to compute these spherical harmonic coefficients are described in Scherrer et al. (2012). To date, they are available for 4,464 days, starting on 2010.04.30 and ending on 2022.07.20, with a fill factor as high as 99.97%, after gap filling.
As the GONG project reached the milestone of producing its 273rd 36-day-long time series of spherical harmonic coefficients, I was able to fit the longest time series to date of helioseismic observations, namely, a 9,216-day-long time series of 13,271,040 data points spanning some 25.23 years or approximately a full solar cycle.2
Such a time span is twice as long as the longest time series I had analyzed before, using either MDI or GONG observations. By contrast, the HMI observations have yet to reach the 4,608-day-long mark (i.e., 64 of the 72-day-long segments), so the longest time series of HMI data I have fitted to date remains a 2,304-day-long one (i.e., 32 consecutive 72-day-long segments).
3 Fitting and inversion methodologies
The analysis of these time series consists in estimating the limit spectrum for each spherical harmonic (
Using long time series produces estimates of limit spectra with a high SNR and a very low background noise level, but it also averages out any changes of the underlying mode properties. In practice, since the mode frequencies are known to change with time, as they are affected by the solar activity, the observed mode widths will not simply be the convolution of the intrinsic mode width by the window function but will also be widened by the mode frequency changes.
However, fitting shorter time series leads to lower precision on the mode characteristics since the fitted spectra have a lower SNR following the
This leads, in practice, to mode attrition: the exact same set of modes cannot be successfully fitted each time; hence, computing the average of results from fitting shorter time series—like using the nearly equivalent 85 108-day-long time series fitted by GONG, the equivalent 128 72-day-long time series fitted by MDI or HMI, or the not quite equivalent 25 360-day-long time series, also fitted by MDI or HMI—can only produce a smaller set of always present modes.
This has been emphasized in Korzennik (2013), while such comparisons are further complicated by the facts that 1) the GONG fitting procedure does not include any information on the leakage matrix and is fitting symmetric mode profiles—although the mode profile asymmetry is now well established (Duvall et al., 1993)—all the while, 2) the MDI and HMI fitting methodologies use an expansion in m to parameterize the mode frequency splitting rather than fitting individual singlets, and 3) GONG has been fitting 108-day-long time series, offset by 36 days, while MDI and HMI have been fitting 72- and 360-day-long time series, offset by 72 or 360 days, respectively (see discussion in Korzennik, 2013).
There is a clear advantage in fitting the longest time series available since 1) the resulting spectra have high SNR and low background noise, and 2) most of the individual modes will have amplitude well above the noise level. The drawback, of course, is that one ends up measuring an average of the mode characteristics over the time span by the time series.
While I present results from fitting the same very long GONG time series with different leakage matrices, I also present results from fitting coeval GONG and MDI or GONG and HMI somewhat shorter time series, using the same methodology and a leakage matrix computed for each instrument using the same formalism.3 To further assess the effect of any residual systematic errors, I also invert the corresponding rotational splittings to infer an estimate of the mean solar internal rotation rate and contrast such inferences when using rotation splittings derived using, for instance, the same time series and fitting methodology but different leakage matrices.
3.1 Mode fitting
The mode fitting methodology I used has been described in detail in Korzennik (2005), Korzennik (2008a), and Korzennik (2008b). Let me outline here some of its distinctive features. This method uses least squares minimization of an optimal estimate of the limit spectrum at each m, fitting simultaneously a portion of the
The mode profile model is a generalized Lorentzian, that is, modified to include asymmetry, and is parameterized by a power amplitude,
The limit spectra are estimated using sine multi-tapers to smooth out the realization noise resulting from the stochastic nature of the mode excitation. The number of tapers used when fitting a given multiplet,
Obviously, the spatial decomposition of the observed dopplergrams can only be carried out using the visible solar disk. It also must be performed with some apodization at the limb to avoid noise magnification and uses the line-of-sight projection of the velocity. The resulting projection on any target spherical harmonic,
The observed images are at first approximation limited to half a sphere; hence, the dominant leaks obey the parity rules of spherical harmonics, and these will correspond to values of
The leakage coefficients are further combined to account for the distortion of the eigenvalues by differential rotation, following the formalism in Woodard (1989). The differential rotation is characterized by two coefficients, b2 = −0.07712 and b4 = −0.04396 nHz, while the horizontal to vertical ratio,
The fitted model for each m includes the (
The procedure also accounts for the cases where modes for (
The whole process starts with a set of initial guesses, and without this
Uncertainties on all the fitted parameters were estimated from the covariance matrix of the problem. This covariance matrix was estimated from the Hessian matrix (Press et al., 1986) using numerical estimates of the second derivative of the merit function. The increases appropriate for the estimate of these derivatives were based on the size of the shrunken simplex resulting from the fitting.
It should be noted that the leaks closest in frequency to the target modes are in most cases the ones corresponding to
3.2 Rotation inversion techniques
To further characterize systematic errors, I also computed and contrasted inferences of the mean rotation rate using different estimates of the individual frequency splittings. To that effect, I used two inversion techniques that were described in Eff-Darwich and Perez Hernandez (1997), Eff-Darwich et al. (2010), Gregor and Fessler (2015), and Korzennik & Eff-Darwich (in preparation).
The first one is a piece-wise constant regularized least squares method, with the regularization based on smoothing the solution’s second derivative. This smoothing is parameterized by a single Lagrange multiplier that acts as a trade-off between spatial resolution and error magnification, while the smoothing is spatially weighted by the relative precision of the inferred profile at each grid point. The second one uses an iterative algorithm7 with either a global second-derivative smoothing factor or a local first-derivative smoothing factor, set to span 3% of the radius and co-latitude range, and a single control parameter that again acts as a trade-off between spatial resolution and error magnification. The solution grid, that is, the grid used to derive the piece-wise constant rotation profile, was spaced out according to the solution’s spatial resolution.
For both techniques, the corresponding averaging kernels are computed at each grid point as well as some of their properties, namely, the center of gravity of the main peak, a proxy for the effective location of the inferred solution at that grid point, as well as the width of that main peak, an estimate of the solution’s spatial resolution at that location.
4 Results
The longest GONG time series, that is, the 9,216-day-long one, has been fitted with the exact same procedure but using five different estimates of the leakage matrix. One is the estimate computed by Schou (private communication) using the MDI/HMI formalism but using the specific set of parameters used to spatially decompose the GONG images, which are different from MDI or HMI spatial decomposition.
The other four leakage matrices were computed using my own formalism, where I compute the line of sight of a velocity signal for a single spherical harmonic on a grid that matches the observed images and then spatially decompose these images using the same parameters used to decompose the GONG images. One leakage matrix was computed using a value of Bo = 0, where Bo is the heliographic latitude at disk center, which varies as the Earth rotates around the Sun. Hence, for a time series much longer than a year, it averages out to zero. Vorontsov (private communication) has argued that the mean leakage matrix should instead be computed using the quadratic mean of the variation of
For these two values of
For additional comparisons, I also present results from fitting the 9,216-day-long GONG time series using a symmetric mode profile by “simply” modifying my fitting procedure to set
4.1 Mode parameter comparisons
Figure 1 compares mode frequencies with or without a model of the GONG mean PSF in the computation of the leakage matrix, both using the
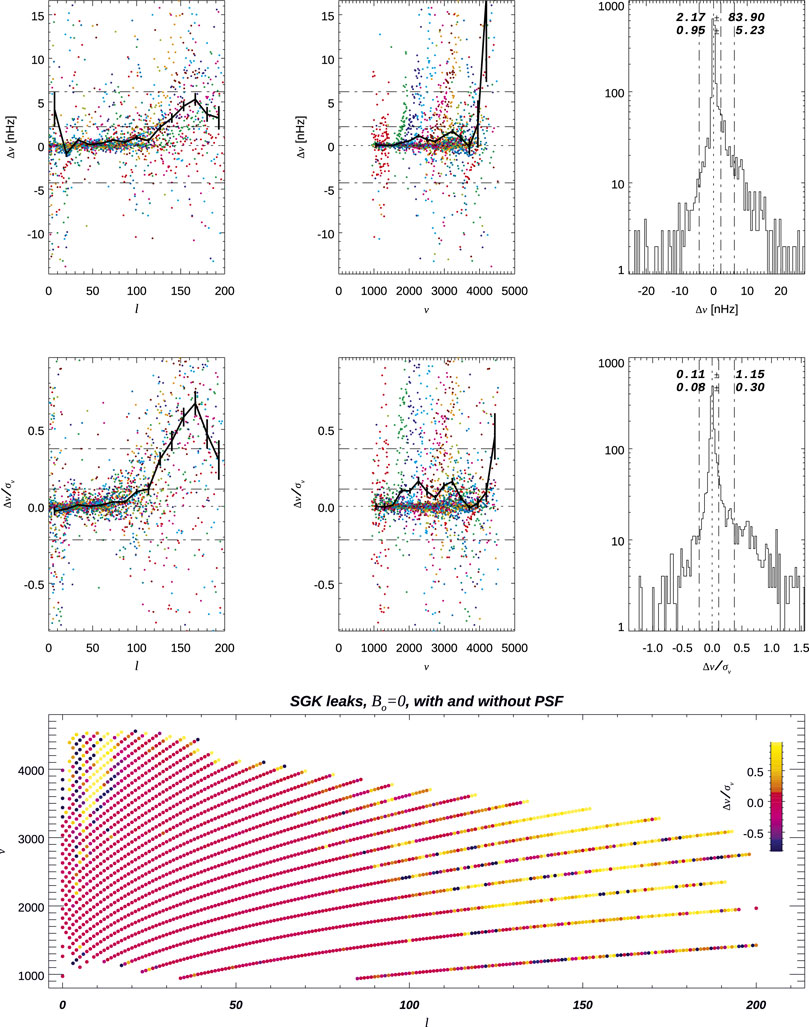
FIGURE 1. Comparison of multiplets,
The raw differences and the scaled differences, that is, the differences divided by their respective uncertainties, show systematic differences at higher degrees, namely, for
Figure 2 compares other mode characteristics when including or not including the PSF, both also using the
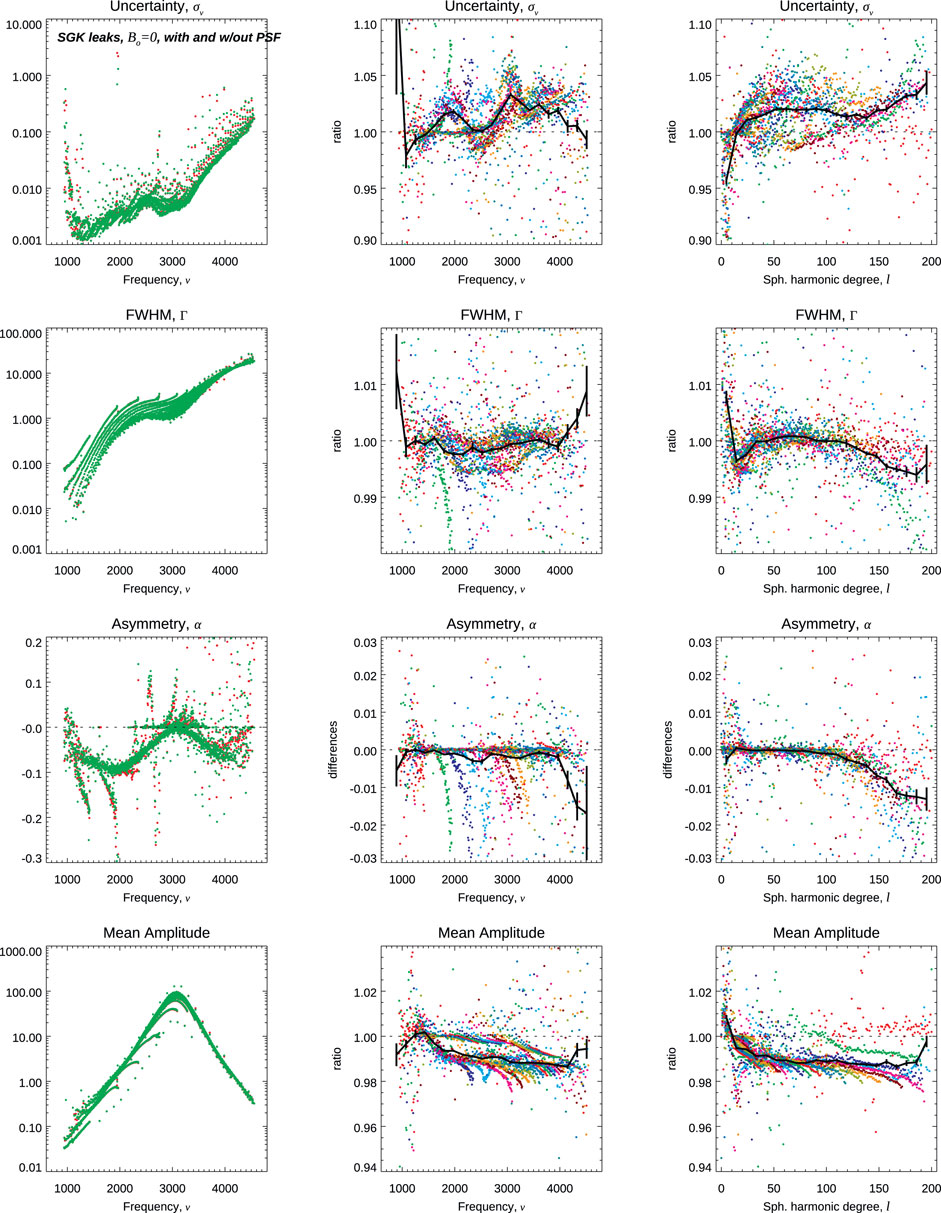
FIGURE 2. Comparison of multiplets’ characteristics when fitting using a leakage matrix that either include or does not include the effect of the PSF. From top to bottom, the uncertainty on the frequency, FWHM, the asymmetry, and the mean amplitude are shown, color-coded on the leftmost column for the two cases, and as either ratios or differences on the two rightmost columns, namely, versus ν or versus
Figure 3 shows similar comparisons for the multiplet frequencies when using either 1) the leakage matrix computed by Schou (JS) or 2) the leakage matrix I computed for
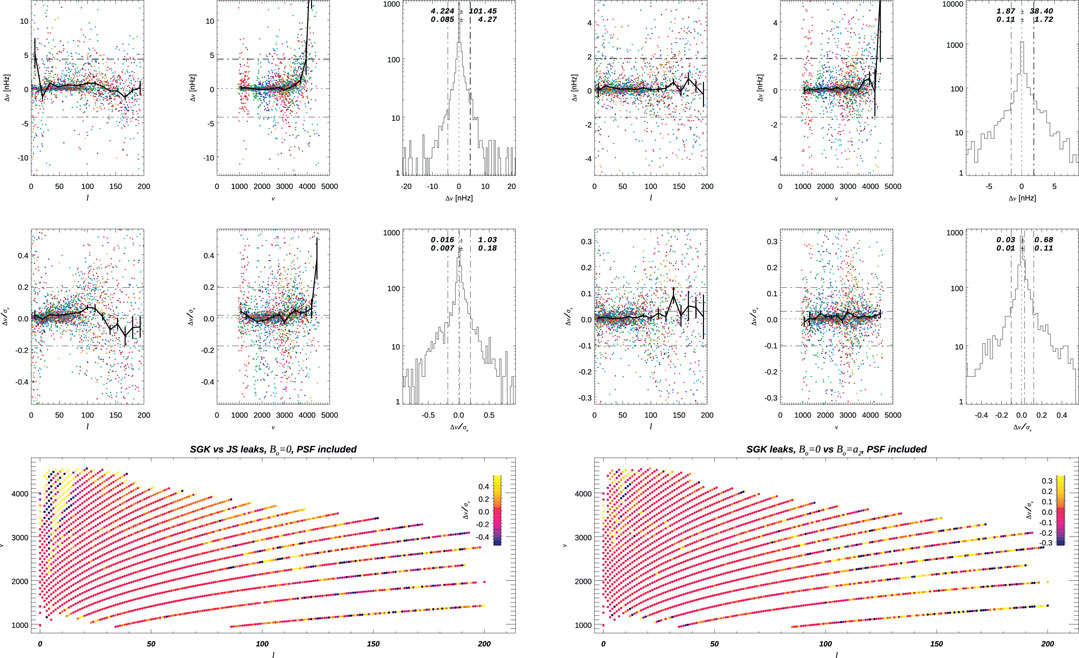
FIGURE 3. Comparison of multiplets’ frequencies when fitting using different leakage matrices. The seven panels on the left compare the results using the JS
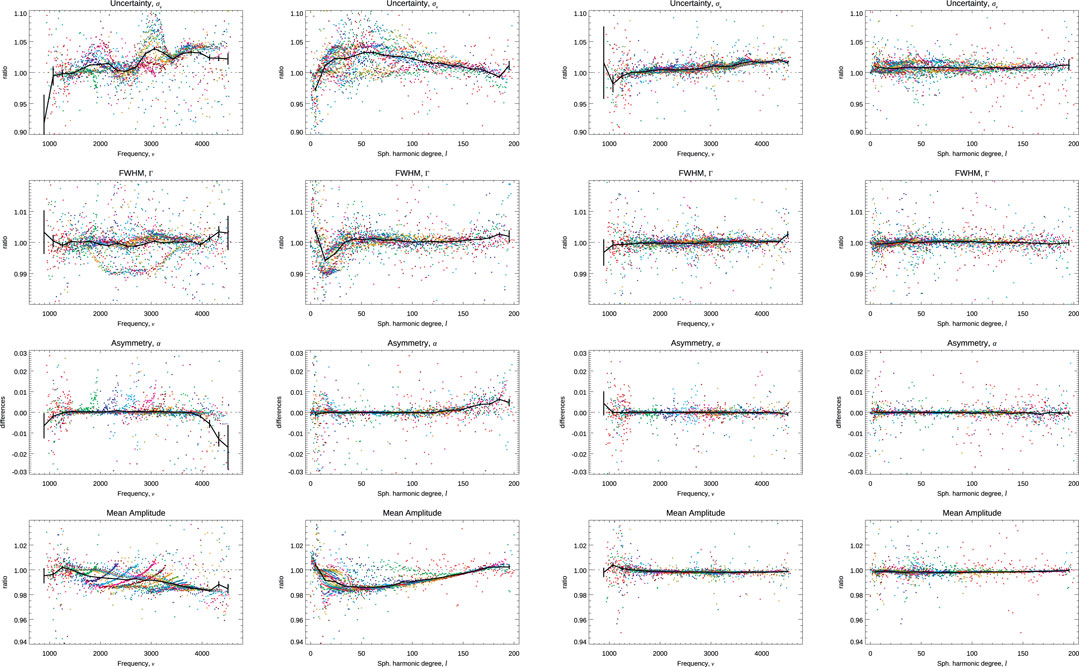
FIGURE 4. Comparison of multiplets’ characteristics when fitting using different leakage matrices. The eight panels on the left compare the results using the JS
By contrast, comparisons when using a symmetric or an asymmetric mode profile show much larger and significant differences, as shown in Figures 5, 6. Not surprisingly, the frequency differences show a clear pattern with a frequency that mimics the frequency dependence of the asymmetry at the 10–20σ levels.
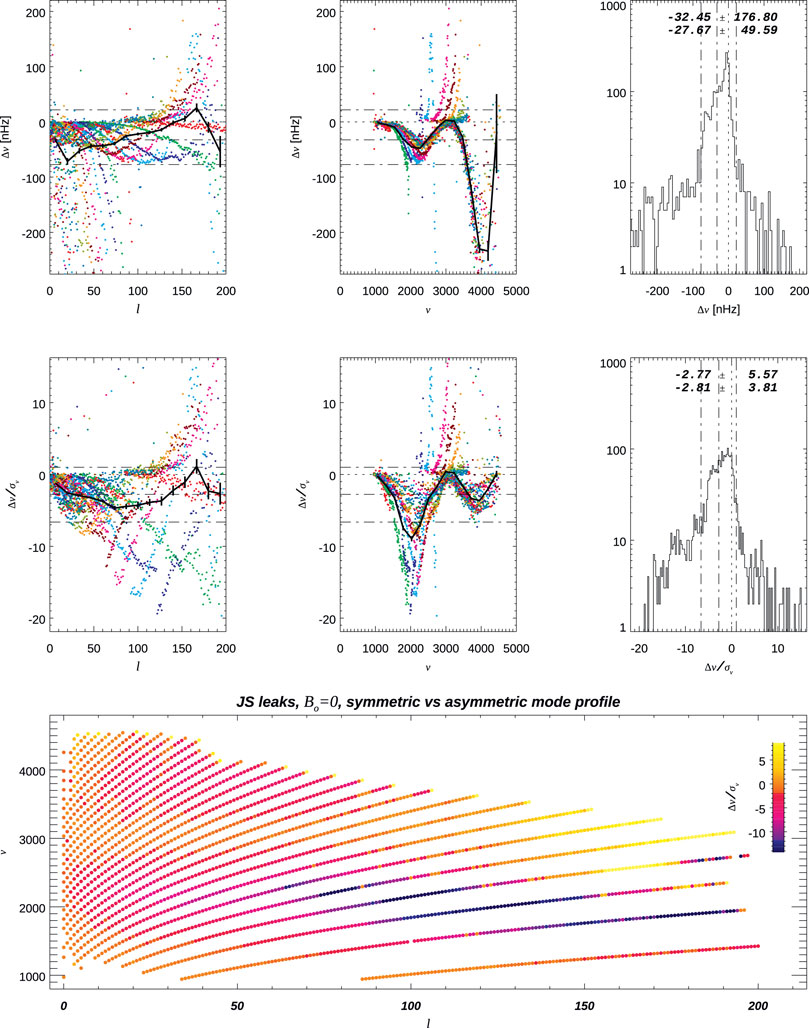
FIGURE 5. Comparison of multiplets’ frequencies when fitting symmetric or asymmetric mode profiles using the same leakage matrix.
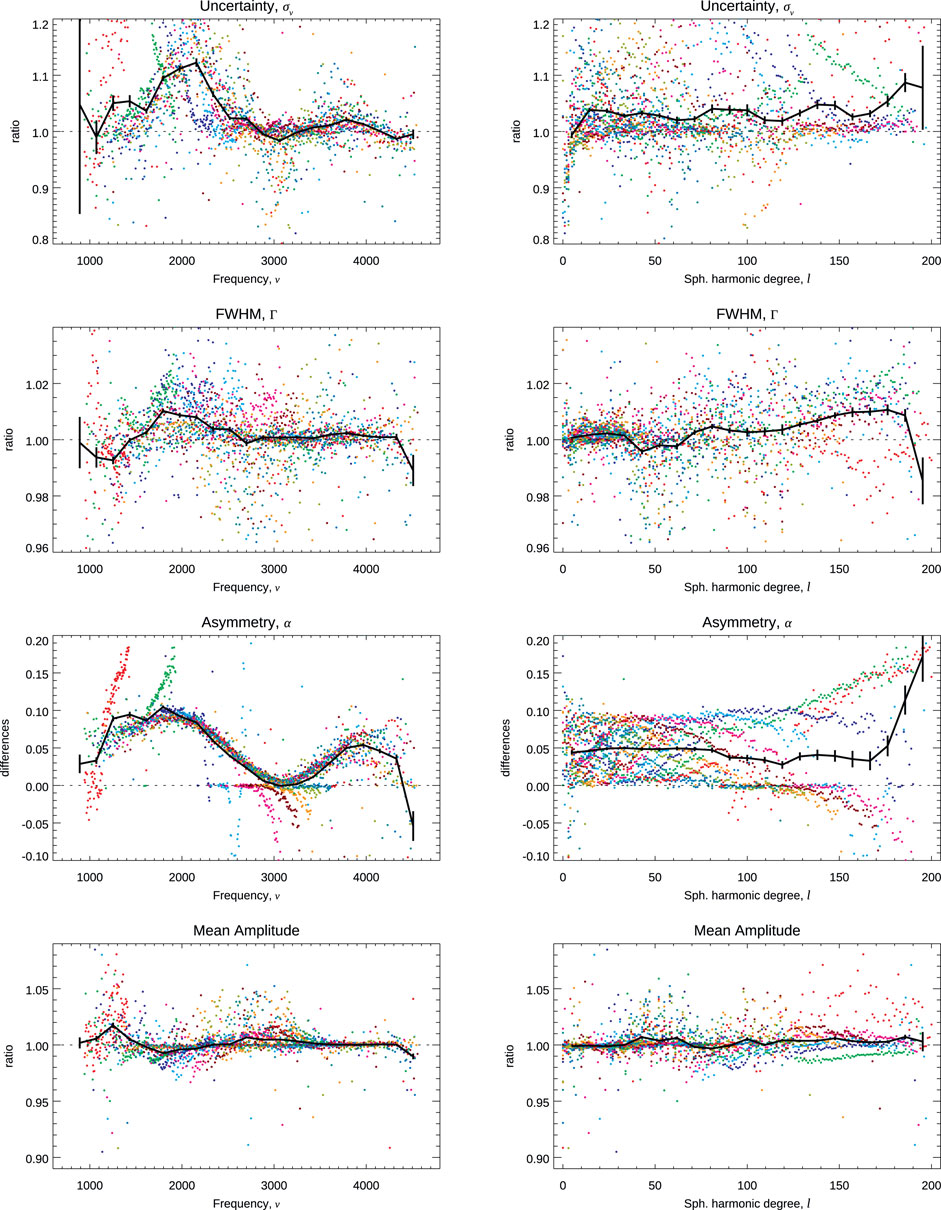
FIGURE 6. Comparison of mode characteristics,
Having also fitted shorter time series, I can compare the averaged values computed from fitting two abutting 4,608-day-long time series to the corresponding 9,216-day-long time series. This comparison is shown in Figures 7, 8, and it shows puzzling systematic differences with clear trends in ℓ and ν, skewed distributions, and scaled differences at the few σ levels. The differences in asymmetry, although small, trend with ℓ and, thus, are likely to be the main reason for the differences in frequencies.
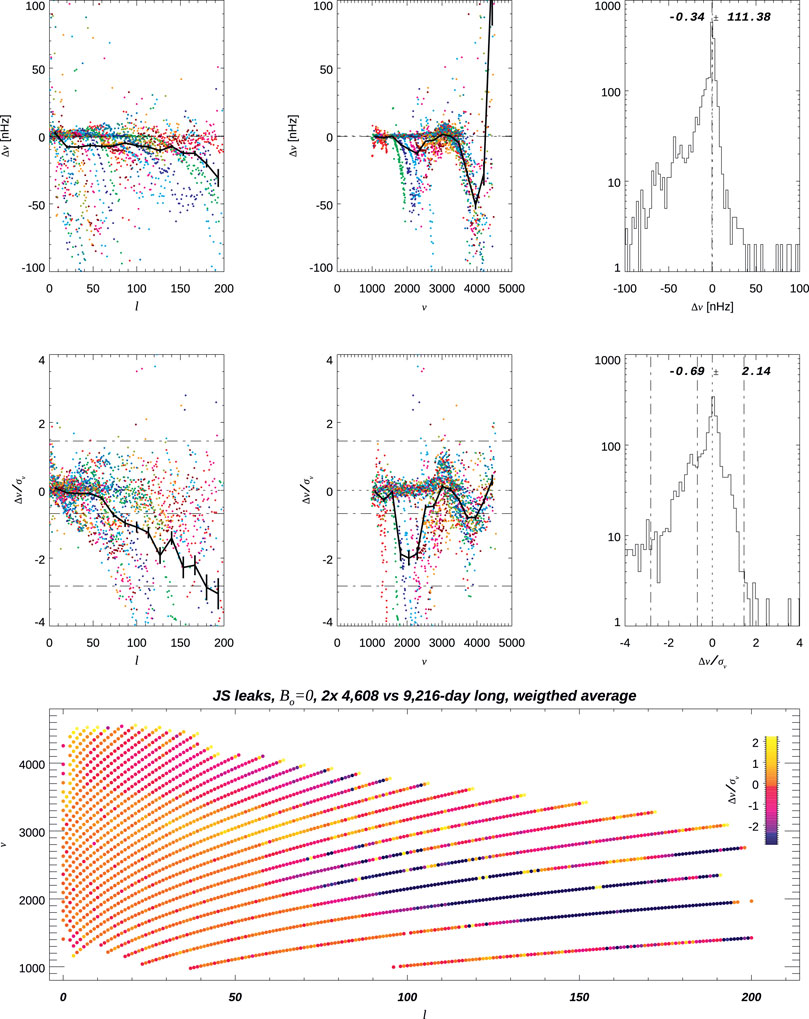
FIGURE 7. Comparison of multiplets when fitting and then averaging two abutting 4,608-day-long time series to the corresponding 9,216-day-long time series, using the same leakage matrix.
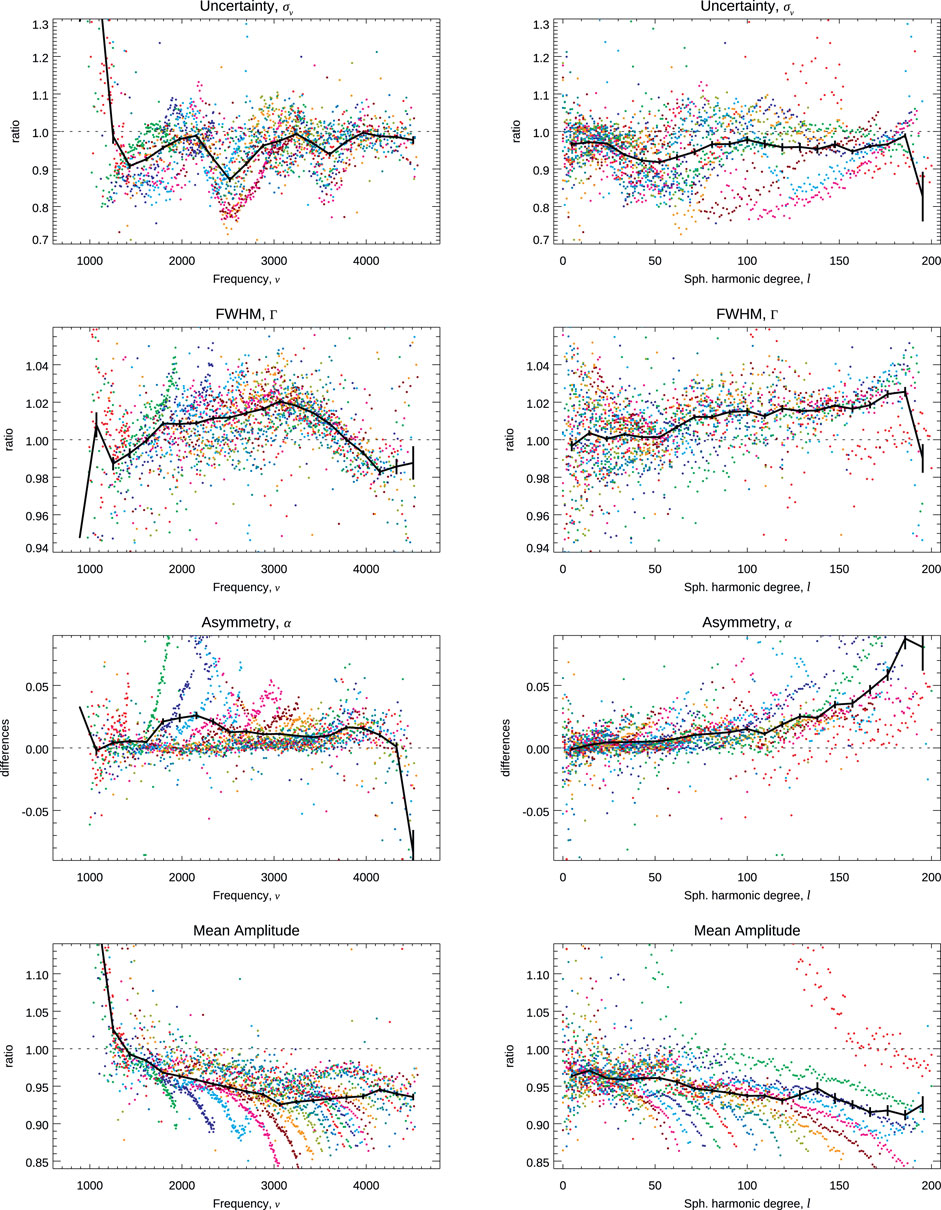
FIGURE 8. Comparison of mode characteristics,
In order to compare fitting GONG observations to fitting MDI or HMI, I used shorter coeval time series, namely, a 4,608-day-long time series for the MDI vs. GONG comparison, starting on 1996.05.01, and a 2,304-day-long time series for the HMI vs. GONG comparison, starting on 2012.02.07.
Figures 9, 10 present the comparison of MDI vs. GONG, showing again trends with ℓ and especially with ν when comparing frequencies, although they remain below the 1σ level. Estimates of the FWHM and the asymmetry show discrepancies at few percentages with a stronger trend with ℓ, while the measured mean power amplitudes are quite different. Figures 11, 12 present the HMI vs. GONG comparison, showing similar trends with ℓ and ν when comparing frequencies to the MDI vs. GONG comparison. However, comparisons of Γ and α present different trends.
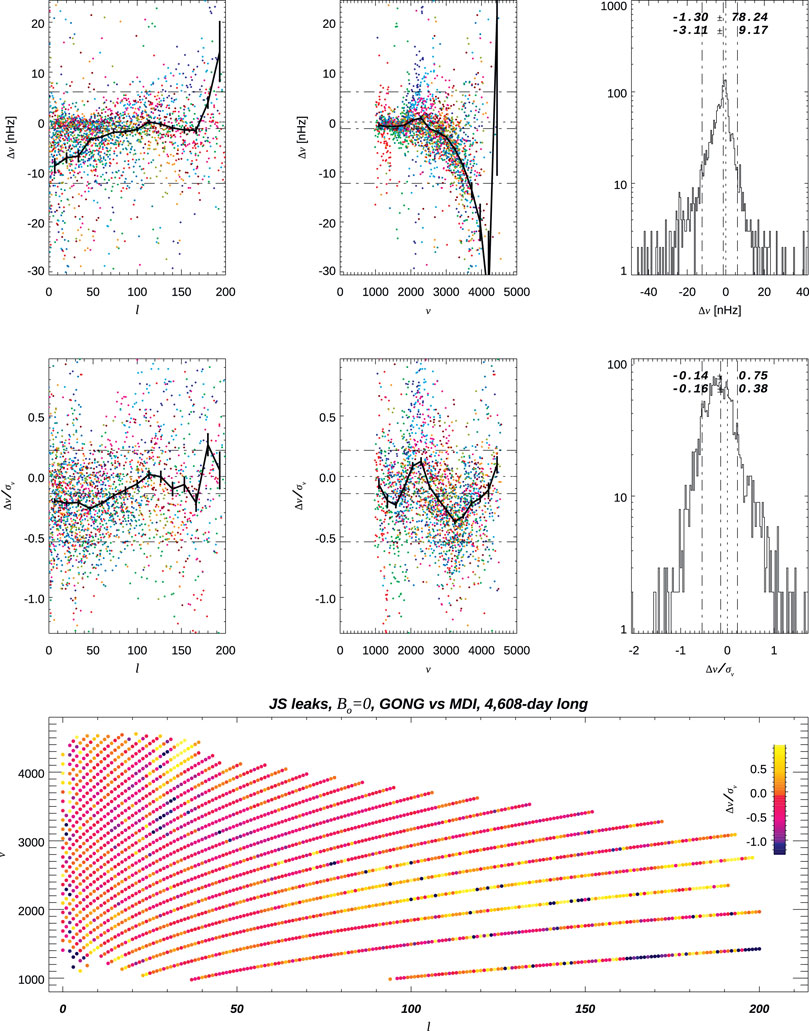
FIGURE 9. Comparison of multiplets’ frequencies when fitting a coeval 4,608-day-long time series of GONG or MDI observations.
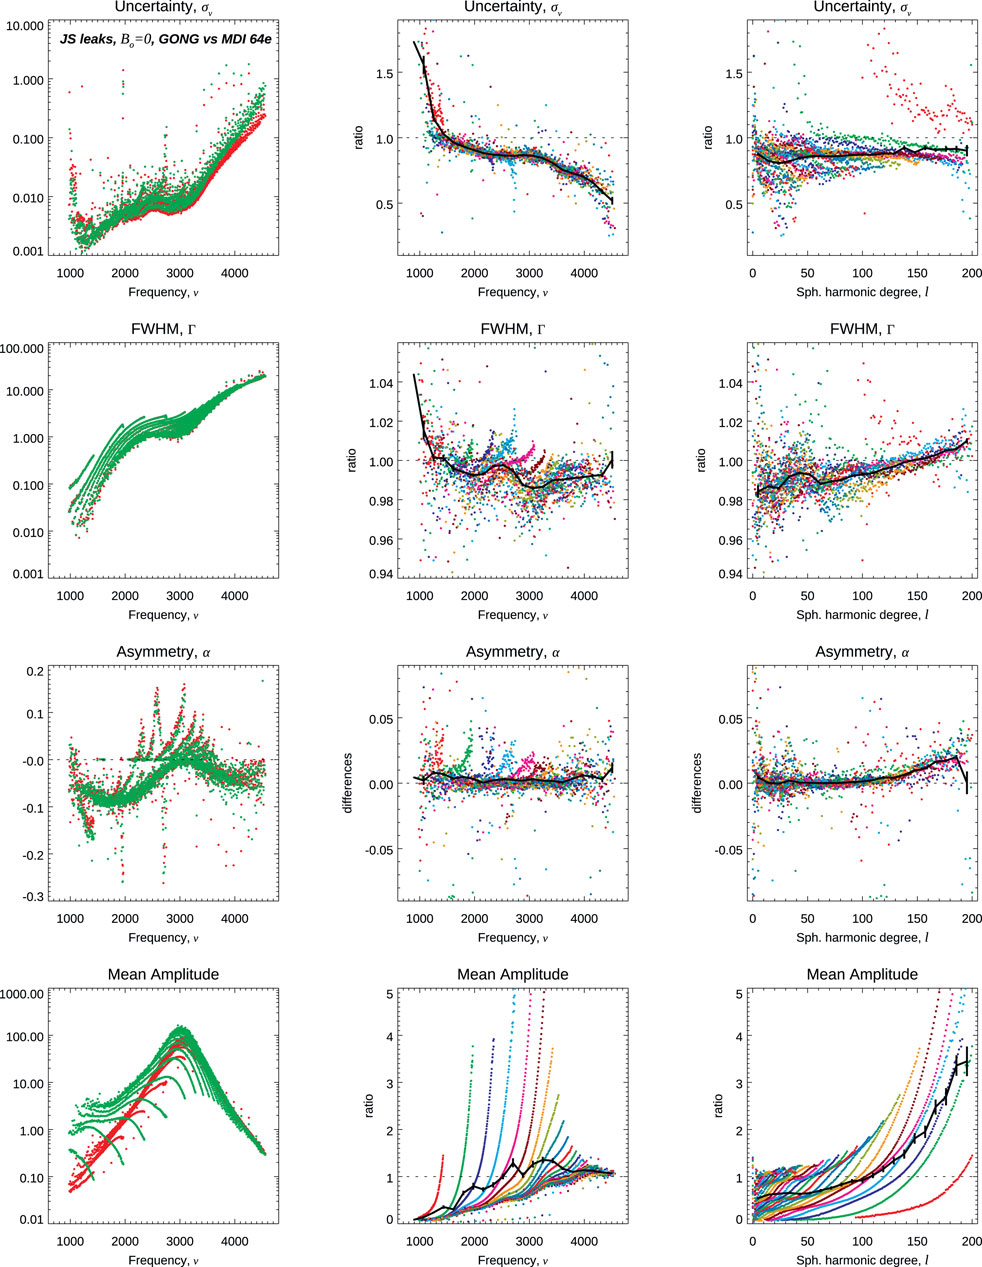
FIGURE 10. Comparison of mode characteristics,
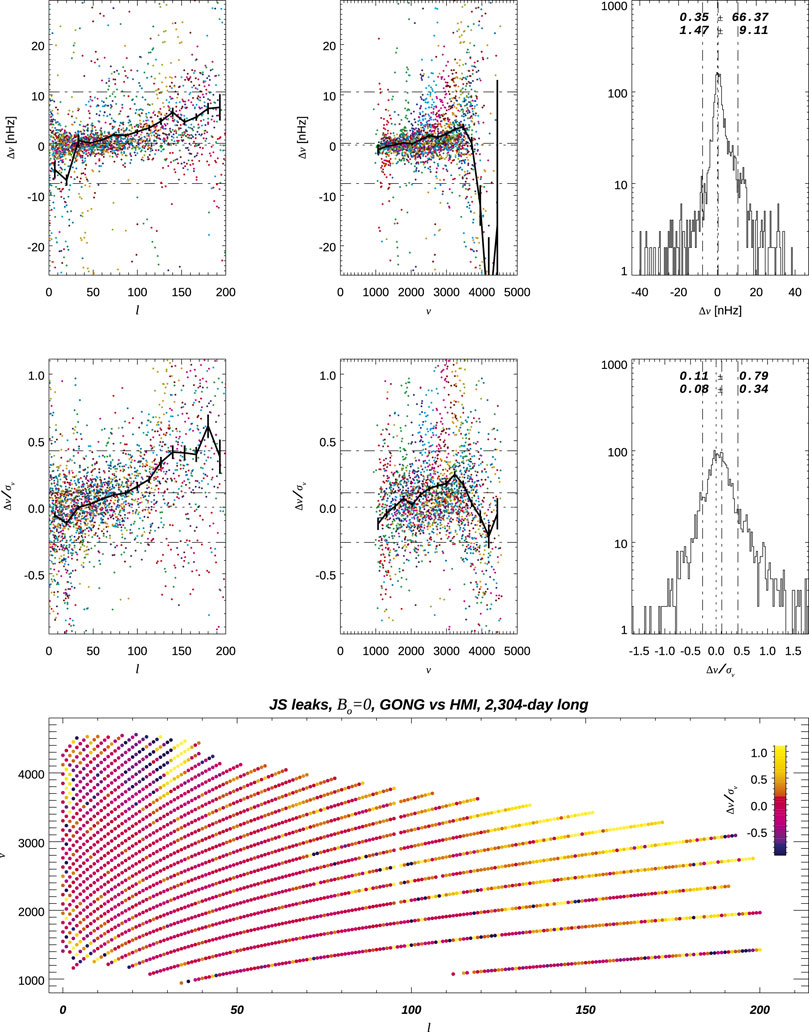
FIGURE 11. Comparison of multiplets’ frequencies when fitting a coeval 2,304-day-long time series of GONG or HMI observations.
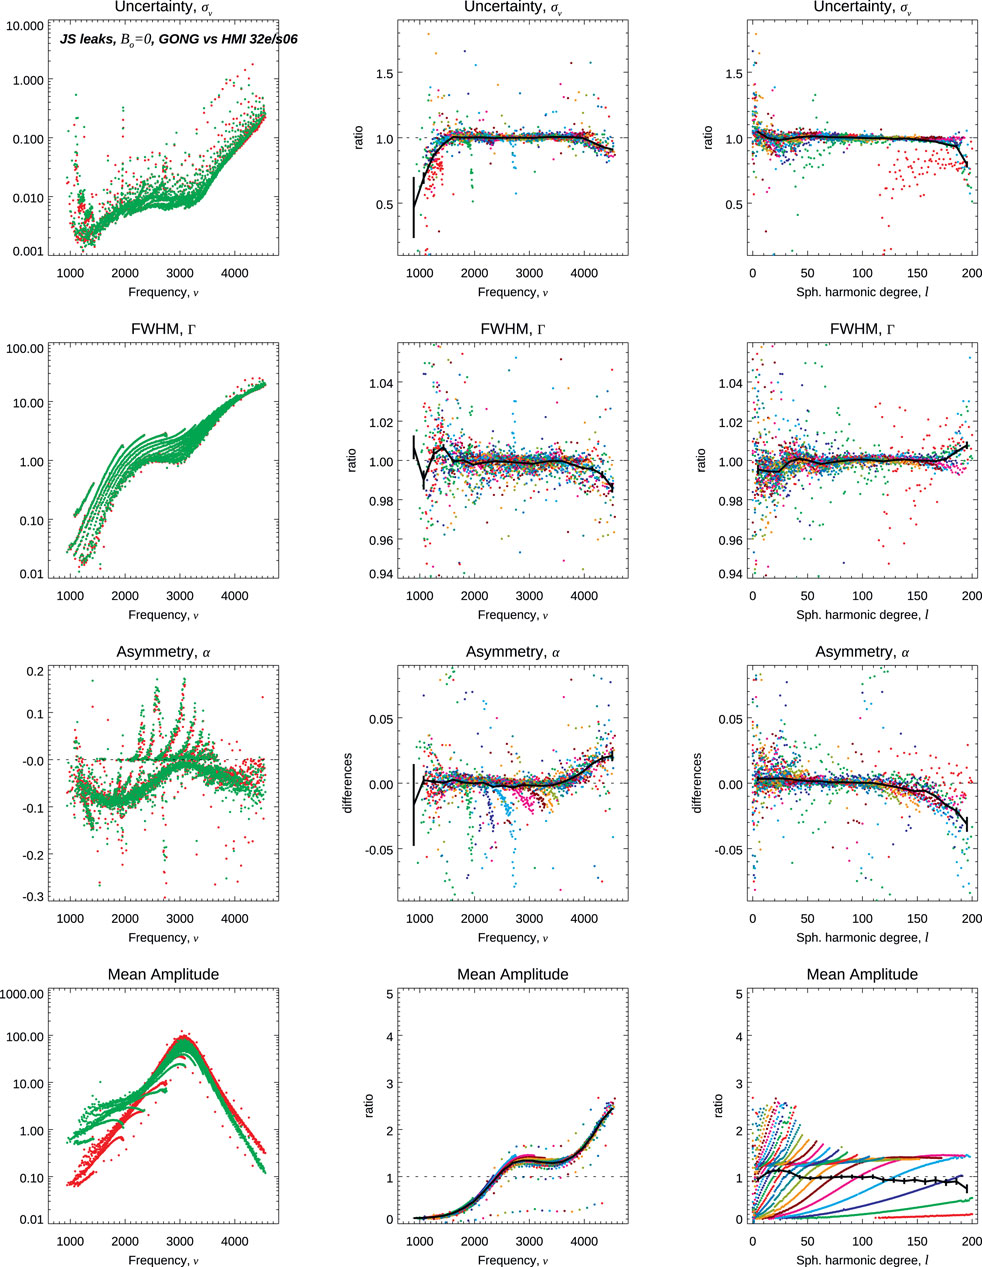
FIGURE 12. Comparison of mode characteristics,
Table 1 summarizes in a numerical form, eight comparisons, where the mean and RMS of the differences and mean and RMS of the scaled differences are tabulated for both singlets,
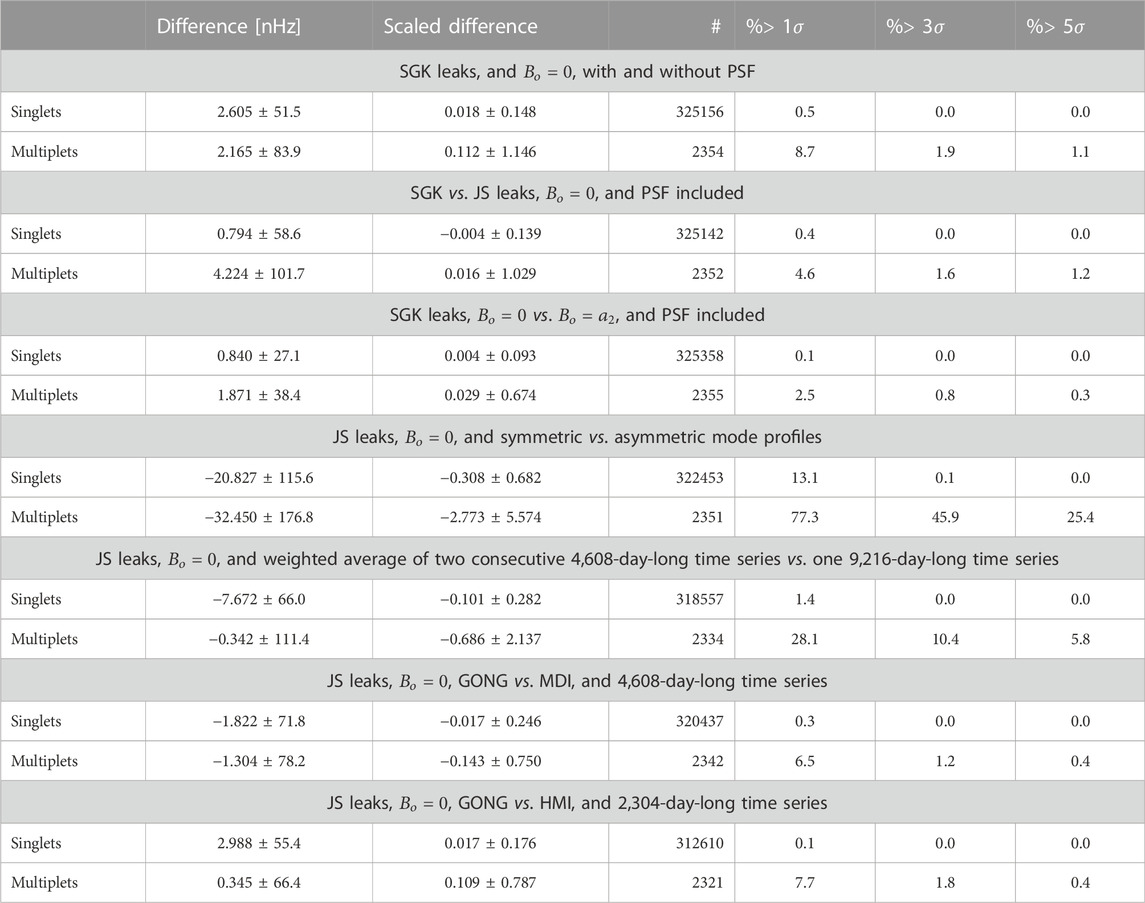
TABLE 1. Overall statistics when comparing frequencies derived using different fitting leakage matrices of time series.
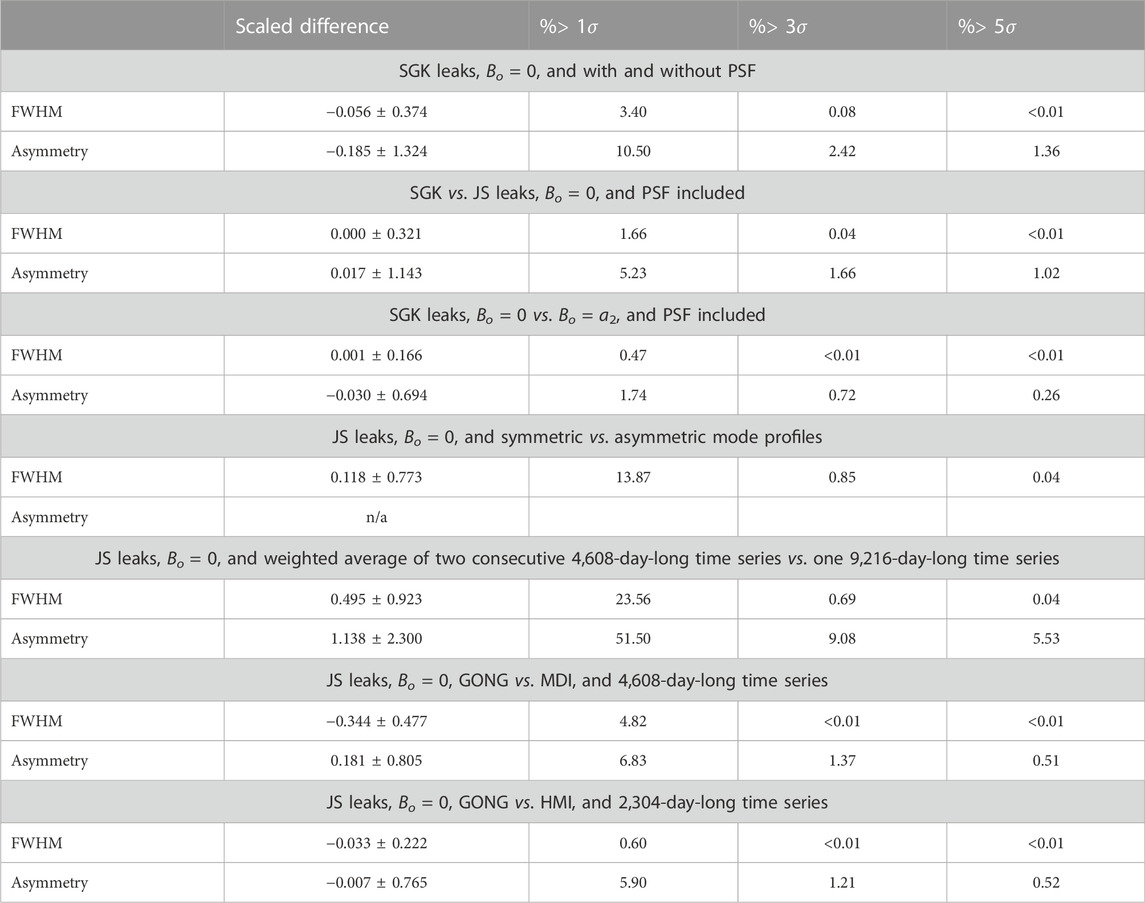
TABLE 2. Overall statistics when comparing mode characteristics derived using different fitting leakage matrices of time series.
Finally, Figure 13 shows the comparison of the uncertainties on the multiplet frequencies,
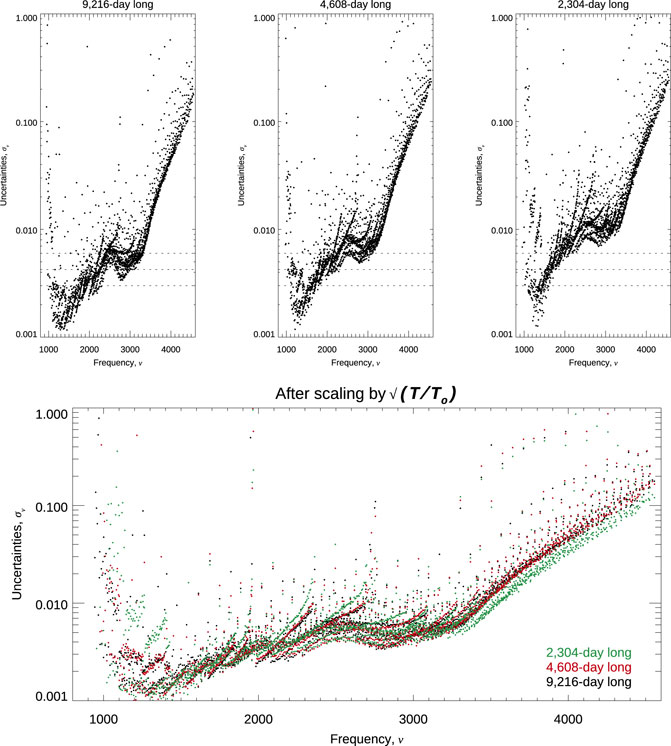
FIGURE 13. Comparison of multiplets’ frequency uncertainties resulting from fitting 9,216-, 4,608-, and 2,304-day-long time series of GONG observations (top panels, left to right). The bottom panel shows how well these scale with the expected
4.2 Rotation inversion comparisons
While the previous section presents comparisons of mode characteristics, more importantly, one should consider whether inferences when using results from different fittings lead to significantly different estimates of solar properties.
Figure 14 presents the mean rotation rate resulting from inverting individual rotation splittings when estimated using different leakage matrices and obtained using three different inversion methodologies. Figure 15 shows the differences in the inferred profiles when using a different inversion methodology and the same set of rotation splittings, while Figure 16 shows the differences when using different splittings but the same methodology.
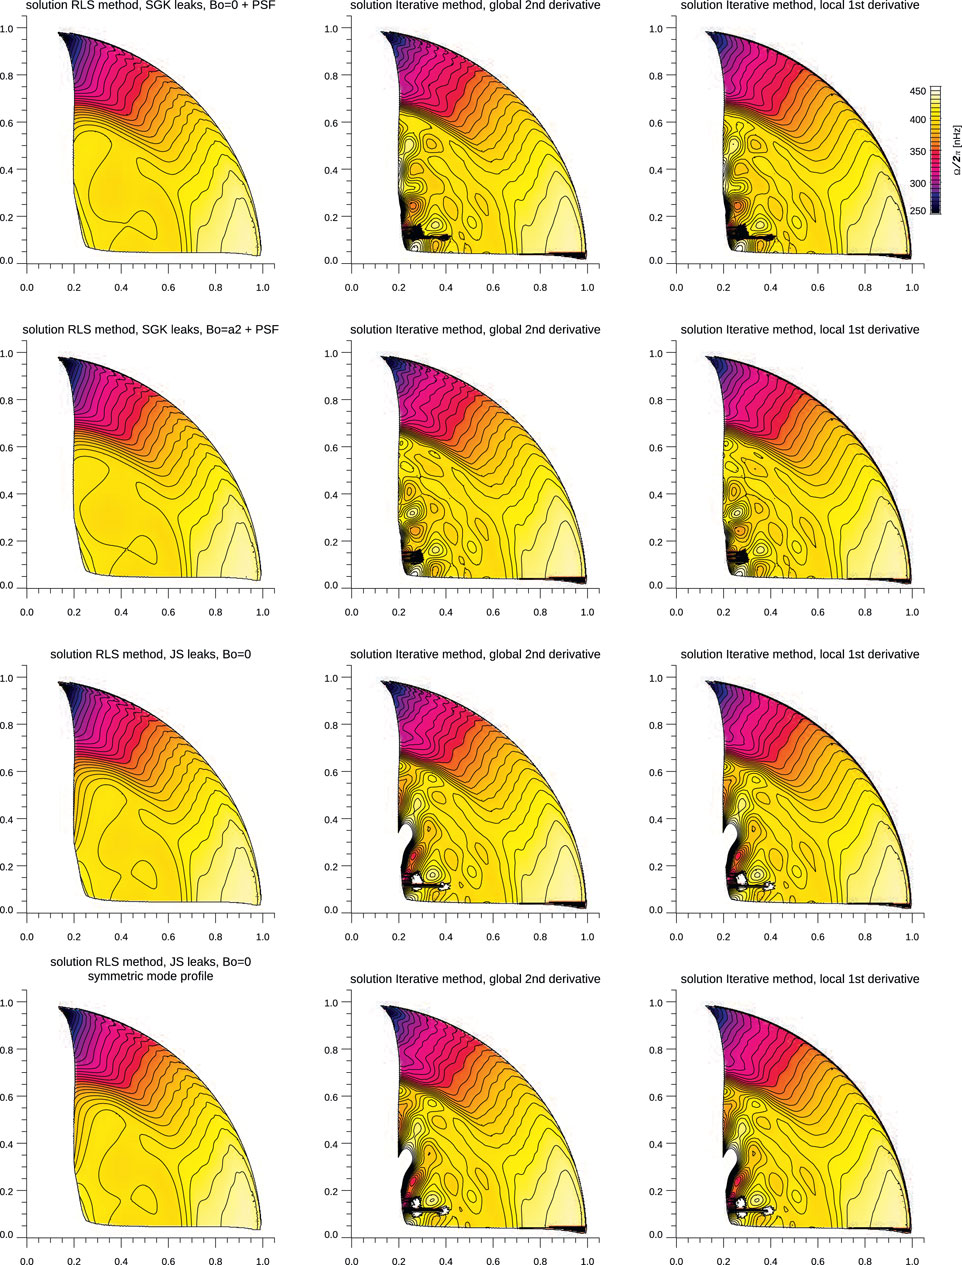
FIGURE 14. Rotation inversion solutions computed for three inversion methodologies (columns) and four sets of splittings (rows). From left to right: the RLS method, the iterative global second-derivative method, and the iterative local first-derivative inversion method. From top to bottom: SGK leaks,

FIGURE 15. Differences in inverted rotation profiles when using different methodologies but the same splittings or the same method and splitting resulting from fitting symmetric or asymmetric mode profiles. From left to right: RLS vs. iterative global second -derivative inversion method, RLS vs. local first-derivative inversion method, and the RLS method but splitting resulting from symmetric or asymmetric fit.
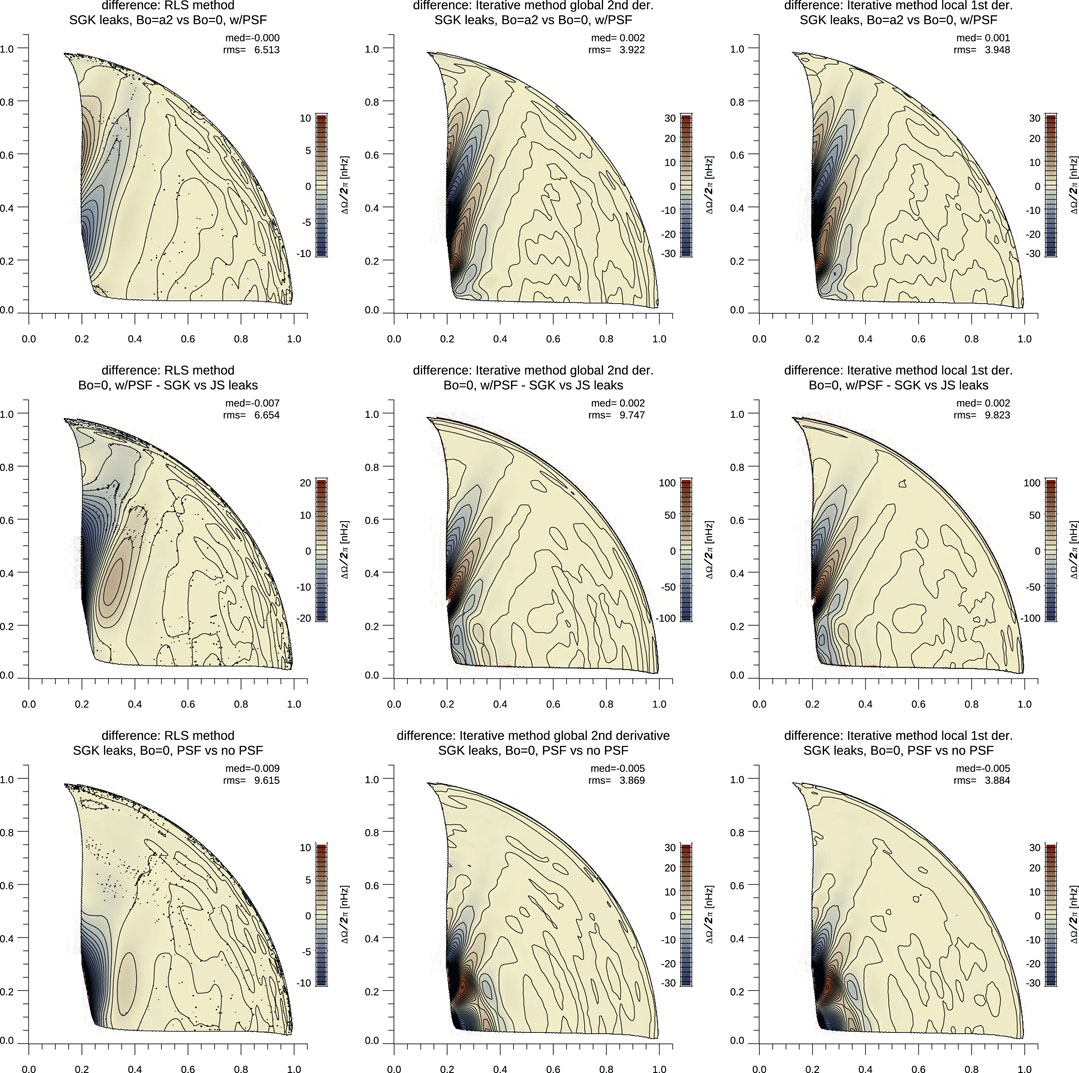
FIGURE 16. Differences in inverted rotation profiles when using different methods (rows) and different splittings (columns). Left to right: the RLS method, the iterative global second-derivative method, and the iterative local first-derivative method. Top to bottom: SGK leaks, including the PSF but with
At first glance, the inverted rotation profiles are quite similar, although differences in inferences near the center are evident when different methods were used. This should be contrasted with the difference in the inferred thickness of the tachocline, and both differences are the result of the different ways smoothness is included in the inversion techniques. It is quite reasonable to assume that the variations near the center of some solutions are the results of noise propagation (this has been confirmed when inverting simulated data, Christensen-Dalsgaard, in preparation), while the resulting trade-off is less smooth near the tachocline.
More interesting, in the context of this study, are the differences resulting from using different splittings. The differences in the top two rows of Figure 16 are quite similar and do not vary much with the inversion methodology (columns). These two correspond to splittings computed by either changing
5 Discussion
The inclusion of PSF in the leakage matrix causes the largest changes in derived mode frequencies, with all other things remaining constant. The effects of using a different
More counter-intuitive is the comparison of the weighted mean frequencies8 resulting from fitting two consecutive shorter time series to the results from fitting the corresponding longer one. It suggests that, besides the fundamental problem of mode attrition, one gains precision when leveraging longer time series versus simply averaging results from shorter time series.
Less surprising are the comparisons of results from fitting coeval long time series of GONG and MDI or GONG and HMI observations. Although the leakage matrices were computed using the same formalism, these are quite different and thus the prime suspects for the cause of the differences, not to mention that the PSF and image distortion of the MDI instrument are not perfectly known, while using a mean PSF based only on the limb measurements for six similar but distinct GONG instruments is most likely an oversimplification.
Finally, comparing inverted rotation profiles also leads to systematic differences, independent of the inversion methodology. One main conclusion from these comparisons is that one must always keep in mind that despite the exquisite precision of modern helioseismic measurements, there remain systematic errors that are not included in the formal uncertainties and are too often ignored when interpreting helioseismic inferences.
Another challenge worth mentioning is how one could combine MDI and HMI observations in a single, very long time series of spherical harmonics. Firstly, the observing cadence is different, 60 s for MDI and 45 s for HMI, but secondly, the instruments measure the surface Doppler shift using a different absorption line (the Ni I photospheric absorption line at 6767.8 Å vs. the Fe I absorption line at 6173 Å); hence, the observed mode amplitude distribution is different. Finally, the spatial resolution of the dopplergrams is quite different, resulting in a very different spatial leakage. Either one could try to use a weighted leakage matrix or one would need to degrade the HMI dopplergrams to match the on-board Gaussian smoothing of the MDI observations, although the unknown PSF of MDI and its image distortion would be an additional difficult issue that would also need to be addressed.
Mode fitting remains challenging when aiming for the best possible precision and accuracy, especially when using long and very long time series, since uncertainties become small and residual systematics become significant. In addition to the contribution of the leakage matrix and the impact of including or not the asymmetry of the mode profile, other subtle effects inject their own biases. However, I remain convinced that several venues can be pursued to improve mode fitting techniques. On one hand, a comprehensive analysis of our estimates of the mode fitting error bars remains warranted, and such an error bar validation can be achieved using Monte Carlo simulations. On the other hand, alternate approaches to fitting time series of various lengths ought to be explored, using techniques that reduce the realization noise. For instance, as suggested by Kosovichev (private communication), “time shifting” might beat down the realization noise, that is, using several time series of a set length but offset by just a small fraction of that length and then combined. Systematic errors set aside, it is ultimately the realization noise that limits the mode fitting precision, and after over two decades of observations, we can no longer count on the
Hence, a thorough review of every step of the global helioseismology data analysis pipeline, while not very glamorous, is still needed to fully exploit the potential of the observations we have on hand.
Data availability statement
The data sets analyzed in this study can be found at the GONG Data Archive at the National Solar Observatory and at the Joint Science Operations Center at Stanford University. The results of this analysis are available at the author's website and the author's Dataverse repository. The leakage matrices are available upon request. Further inquiries can be directed to the corresponding author.
Author contributions
SGK contributed solely to the design, implementation, and execution of the mode fitting. The spherical harmonic coefficients used in this work were produced by the GONG, MDI, and HMI projects, while Jesper Schou provided some of the leakage matrices used in this work. The design of the inversion methods is a collaborative effort with Antonio Eff-Darwich, while the implementation and execution of the inversions is solely the work of SGK.
Funding
SGK acknowledges support by NASA grants 80NSSC22K0516 and 80NSSC20K0602/Stanford University subcontract 62364172-145590.
Acknowledgments
Most of the computations carried out for this study were conducted on the Smithsonian High Performance Cluster. This work utilizes data from the National Solar Observatory Integrated Synoptic Program, which is operated by the Association of Universities for Research in Astronomy, under a cooperative agreement with the National Science Foundation, and with additional financial support from the National Oceanic and Atmospheric Administration, the National Aeronautics and Space Administration, and the United States Air Force. The GONG network of instruments is hosted by the Big Bear Solar Observatory, the High Altitude Observatory, the Learmonth Solar Observatory, the Udaipur Solar Observatory, Instituto de Astrofísica de Canarias, and the Cerro Tololo Inter-American Observatory. The MDI and HMI data were downloaded from the Joint Science Operations Center (JSOC) Science Data Processing (SDP) at Stanford University. MDI is an instrument that flew on board the Solar and Heliospheric Observatory (SOHO), which is a project of international cooperation between ESA and NASA; HMI is an instrument on board the Solar Dynamic Observer (SDO), and the data used for this work are courtesy of the NASA/SDO and the HMI science team.
Conflict of interest
The author declares that the research was conducted in the absence of any commercial or financial relationships that could be construed as a potential conflict of interest.
Publisher’s note
All claims expressed in this article are solely those of the authors and do not necessarily represent those of their affiliated organizations, or those of the publisher, the editors, and the reviewers. Any product that may be evaluated in this article, or claim that may be made by its manufacturer, is not guaranteed or endorsed by the publisher.
Footnotes
1I have fitted time series as short as 36 days and used a factor two progression, fitting time series that are 36, 72, 144, 288 days etc and offsetting them by half their length for those longer than 72 days.
2While the GONG network started observing some 360 days before MDI, I have aligned all the segments I have fitted with the MDI start date (1996.05.01) to allow meaningful comparisons of coeval time series. I have fitted shorter time series of GONG observations starting as early as 1995.05.07, but I choose to fit the longer time series starting on 1996.05.01.
3One cannot use the same leakage matrices from the three instruments since i) the image resolution and the spatial decomposition are different, ii) the instruments’ point spread functions are different, and iii) MDI observations are binned down using a Gaussian smoothing.
4This range is set to be at least some empirical minimum value and not to exceed the mode spacing in n around the target mode.
5Only modes with a power amplitude three times greater than the RMS of the residuals to the fit are fitted.
6That number of iterations was deemed adequate based on the changes in the parameters at the last iteration.
7Also known in tomography as the simultaneous iterative reconstruction technique of regularized weighted least squares problems.
8The weights used for those weighted means are the frequency error bars, although using an unweighted mean produces very similar results.
References
Anderson, E. R., Duvall, J., Thomas, L., and Jefferies, S. M. (1990). Modeling of solar oscillation power spectra. Astrophysical J. 364, 699. doi:10.1086/169452
Duvall, T. L., Jefferies, S. M., Harvey, J. W., Osaki, Y., and Pomerantz, M. A. (1993). Asymmetries of solar oscillation line profiles. Astrophysical J. 410, 829. doi:10.1086/172800
Eff-Darwich, A., Korzennik, S. G., and García, R. A. (2010). Advances in solar rotation rate inferences: Unstructured grid inversions and improved rotational splittings. Astron. Nachrichten 331, 890–895. doi:10.1002/asna.201011420
Eff-Darwich, A., and Perez Hernandez, F. (1997). A new strategy for helioseismic inversions. Astron. Astrophys. Suppl. Ser. 125, 391–398. doi:10.1051/aas:1997229
Fahlman, G. G., and Ulrych, T. J. (1982). A new method for estimating the power spectrum of gapped data. Mon. Not. R. Astron. Soc. 199, 53–65. doi:10.1093/mnras/199.1.53
Gregor, J., and Fessler, J. A. (2015). Comparison of SIRT and SQS for regularized weighted least squares image reconstruction. IEEE Trans. Comput. imaging 1, 44–55. doi:10.1109/TCI.2015.2442511
Harvey, J. W., Hill, F., Hubbard, R. P., Kennedy, J. R., Leibacher, J. W., Pintar, J. A., et al. (1996). The global oscillation network Group (GONG) project. Science 272, 1284–1286. doi:10.1126/science.272.5266.1284
Hill, F., Anderson, E., Howe, R., Jefferies, S. M., Komm, R., and Toner, C. (1998). “Estimated mode parameters from the fitting of GONG spectra,” in Structure and Dynamics of the interior of the Sun and sun-like stars. Vol. 418 of ESA special publication. Editor S. Korzennik, 231.
Howe, R., and Hill, F. (1998). “Estimating low-degree mode parameters from GONG data using the leakage matrix,” in Structure and Dynamics of the interior of the Sun and sun-like stars. Vol. 418 of ESA special publication. Editor S. Korzennik, 237.
Howe, R., and Thompson, M. J. (1998). A strategy for fitting partially blended ridges in GONG solar p-mode spectra. Astronomy Astrophysics Suppl. 131, 539–548. doi:10.1051/aas:1998285
Komm, R. W., Anderson, E., Hill, F., Howe, R., Kosovichev, A. G., Scherrer, P. H., et al. (1998). “Comparison of SOHO-SOI/MDI and GONG spectra,” in Structure and Dynamics of the interior of the Sun and sun-like stars. Vol. 418 of ESA special publication. Editor S. Korzennik, 253.
Korzennik, S. G. (2005). A mode-fitting methodology optimized for very long helioseismic time series. Astrophysical J. 626, 585–615. doi:10.1086/429748
Korzennik, S. G. (2013). “Mode frequencies from GONG, MDI, and HMI data,” in Fifty years of seismology of the Sun and stars. Vol. 478 of astronomical society of the pacific conference series. Editors K. Jain, S. C. Tripathy, F. Hill, J. W. Leibacher, and A. A. Pevtsov, 137.
Korzennik, S. G. (2008a). YAOPBM - yet another peak bagging method. Astron. Nachrichten 329, 453–460. doi:10.1002/asna.200710979
Korzennik, S. G. (2008b). YAOPBM—II: Extension to higher degrees and to shorter time series. J. Phys. Conf. Ser. 118, 012082. doi:10.1088/1742-6596/118/1/012082
Larson, T. P., and Schou, J. (2015). Improved helioseismic analysis of medium-R data from the Michelson Doppler imager. Sol. Phys. 290, 3221–3256. doi:10.1007/s11207-015-0792-y
Press, W. H., Flannery, B. P., and Teukolsky, S. A. (1986). Numerical recipes. The art of scientific computing.
Scherrer, P. H., Bogart, R. S., Bush, R. I., Hoeksema, J. T., Kosovichev, A. G., Schou, J., et al. (1995). The solar oscillations investigation - Michelson Doppler imager. Sol. Phys. 162, 129–188. doi:10.1007/BF00733429
Scherrer, P. H., Schou, J., Bush, R. I., Kosovichev, A. G., Bogart, R. S., Hoeksema, J. T., et al. (2012). The helioseismic and magnetic imager (HMI) investigation for the solar Dynamics observatory (SDO). Sol. Phys. 275, 207–227. doi:10.1007/s11207-011-9834-2
Schou, J. (1992). On the analysis of helioseismic data. Ph.D. thesis (Aarhus, Denmark: Aarhus University).
Title, A. M., and Ramsey, H. E. (1980). Improvements in birefringent filters. 6: Analog birefringent elements. Appl. Opt. 19, 2046–2058. doi:10.1364/AO.19.002046
Williams, W. E., Toner, C., and Hill, F. (1995). “Implementation of an mtf-based merging algorithm for GONG image data,” in Helioseismology. Vol. 376 of ESA special publication. Editors J. T. Hoeksema, V. Domingo, B. Fleck, and B. Battrick, 185.
Keywords: Sun, Sun—interior, Sun—helioseismology, mode fitting, inverse modeling
Citation: Korzennik SG (2023) Precision and systematic errors in global helioseismology mode fitting and inversions: Leveraging some 25 years of nearly uninterrupted observations. Front. Astron. Space Sci. 9:1031313. doi: 10.3389/fspas.2022.1031313
Received: 29 August 2022; Accepted: 21 November 2022;
Published: 16 January 2023.
Edited by:
Kiran Jain, National Solar Observatory, United StatesReviewed by:
Frank Hill, National Solar Observatory, United StatesAnne-Marie Broomhall, University of Warwick, United Kingdom
Copyright © 2023 Korzennik. This is an open-access article distributed under the terms of the Creative Commons Attribution License (CC BY). The use, distribution or reproduction in other forums is permitted, provided the original author(s) and the copyright owner(s) are credited and that the original publication in this journal is cited, in accordance with accepted academic practice. No use, distribution or reproduction is permitted which does not comply with these terms.
*Correspondence: Sylvain G. Korzennik, c2tvcnplbm5pa0BjZmEuaGFydmFyZC5lZHU=
 Sylvain G. Korzennik