 Abdul Qadeer Khan1
 Bushra Ghaffar2
 Munawar Shah1*Irfan Ullah3
 José Francisco Oliveira-Júnior4
 Sayed M. Eldin5
- 1Department of Space Science, GNSS and Space Education Research Lab, National Center of GIS and Space Applications, Institute of Space Technology, Islamabad, Pakistan
- 2Department of Environmental Science, Faculty of Basic and Applied Sciences, International Islamic University, Islamabad, Pakistan
- 3Department of Geology, Bacha Khan University, Charsadda, Pakistan
- 4Laboratório de Meteorologia Aplicada e Meio Ambiente (LAMMA), Insstituto de Ciências Atmosféricas (ICAT), Universidade Federal Do Alagoas (UFAL), Maceió, Brazil
- 5Center of Research, Faculty of Engineering, Future University in Egypt, New Cairo, Egypt
Ionospheric anomalies through satellites can provide useful information about forthcoming earthquakes (EQs) over the epicentral regions. In this paper, we investigated seismo-ionospheric anomalies associated with the Mw 6.5 Sumatra earthquake that occurred in Indonesia on 06 December 2016 at 22:03 UT. We analyzed the total electron content (TEC) from Global Positioning System (GPS) signals received at the nearby stations around the epicenter. Furthermore, we also studied the TEC in local daytime and nighttime from Swarm satellites to confirm the EQ-induced ionospheric perturbations. The TEC showed significant perturbation within 5–10 days before the main shock in the form of positive anomalies beyond the upper bound. Similarly, Swarm satellites also validated the anomalies observed in the GPS TEC from nearby operating stations within 5–10 days over the epicentral region. The geomagnetic indices were quiet for the observed TEC anomalies within 5–10 days before the main shock, having Dst ≤ −40 nt and Kp ≤ 3. This study reveals the legitimate anomalies mainly associated with the EQ and suggests using the TEC from GPS and other satellites to look for possible future precursors with a more equipped satellite cluster.
Introduction
The study of ionospheric anomalies for EQ monitoring and disturbances can provide useful information about the impending main shock over the epicentral region (Fujiwara et al., 2004; Liu et al., 2004). Recently, the GPS is becoming an important technique for monitoring ionospheric anomalies at different temporal and spatial variations. GPS satellites broadcast two signals at high frequencies (f1 = 1575.42 MHZ and f2 = 1227.6 MHZ) that can measure the variation in the ionospheric state. The ionosphere, as a dispersive medium, causes GPS signals’ group velocity to increase the phase velocity. The ionospheric EQ anomalies from GPS ground stations operating around the vicinity of the epicentral area can possibly be observed within a time window of 5–10 days before and after the main shock day (Jin et al., 2014; Shah and Jin, 2018; Hussain and Shah, 2020). However, the ratio of positive anomalies is more than that of negative TEC disturbances associated with large magnitude and shallow hypocentral depth events (Shah et al., 2018). The best magnitude of EQ for the association of seismo-ionospheric anomalies from GPS is Mw ≥ 6.0, and the best hypocentral depth is less than 20 km (Shah et al., 2019a). In addition to GPS TEC, the EQ associated-ionospheric anomalies can also be prominently observed in the analysis of various satellites, such as DEMETER, Swarm, and CSES (Shah et al., 2019b; De Santis et al., 2019; Tariq et al., 2019; Kiyani et al., 2020). For example, Abbasi et al. (2021) showed significant GPS TEC anomalies around the epicenter of future EQs, and the same variations were also found in the daily variations of DEMETER satellite data for the same event over the epicentral region and associated fault lineament regions. Moreover, Marchetti et al. (2019) analyzed the long-term data on Swarm satellites for establishing a statistical relationship between EQ and ionospheric anomalies in the epicentral regions. All these studies provided some clues about EQ-associated ionospheric precursors, but no one has yet forecast an EQ from the ionospheric perturbations with the current satellite cluster (Du et al., 2021; Huang et al., 2021; Zhang et al., 2021; Xu et al., 2022; Zhang et al., 2022). The satellite data can provide more insight into EQ forecasting with a more enhanced cluster (Khan et al., 2022).
Ionospheric anomalies before an EQ can be discussed on the basis of two distinguished hypotheses during the main shock preparation period. For example, Freund (2009) explained the physical process of stressed rocks to generate the electric charge carriers in the form of p-holes (positive holes) that further rise to the atmosphere and cause delays in radio signal propagation. These p-holes are highly mobile to flow out of the stressed rock at hypocentral depth to the nearby unstressed rock volume, followed by its interaction with air molecules at the Earth–atmosphere interface. This situation is similar to that of a battery; if the Earth’s crust is considered as a battery, the applied stress along the fault line produces electromagnetic radiations and pulses toward the atmosphere (Freund, 2002; Tian et al., 2020). As soon as these radiations reach the Earth’s surface and interact with air molecules, they ionize the atmosphere over the EQ preparation zone. Ultimately, this whole process destabilizes the lower edge of the ionosphere from the epicenter, which leads to seismo-ionospheric anomalies (Sekertekin et al., 2020; Chenge and Fu, 2022; Qu et al., 2022; Shah, 2022). Pulinets and Ouzounov (2011) proposed the lithosphere–atmosphere–ionosphere-coupling (LAIC) model to show the precursory nature of the ionosphere and atmosphere caused by radon emanation before a large EQ. The rising up of gases including radon and other particles toward the Earth’s surface produces atmospheric thermal anomalies within the EQ preparation zone. The emission of gases from the EQ preparation zone creates a chain of processes: an increase in the surface temperatures and humidity due to cooling of the hot gases and radon, ionization of alpha particles, formation of the aerosol particles, changes in the atmosphere electric conductivity, and electric coupling (Pulinets and Davidenko, 2014 ; Li et al., 2022). On the basis of p-holes and radon-generated EQ ionosphere anomalies, the observation window of EQ anomalies is 1–10 days before the EQ and after the main shock day (Shah et al., 2021). In this paper, we aim at studying the EQ-induced ionospheric anomalies from GPS TEC measurement and Swarm satellite data to examine a time window for the EQ anomalies before and after the main shock of the large magnitude (Mw 6.5) Sumatra, Indonesia, event. Another objective is to distinguish the seismic anomalies from the anomalies during disturbed storm conditions (Kp > 3).
Data and methods
In this paper, we study the seismo-ionospheric anomalies for the EQ of Mw 6.5 in December 2016 in Sumatra, Indonesia, at a geographical latitude of 5.283°N and geographical longitude of 96.186°E. The hypocentral depth of this EQ was 8.2 km, and it occurred in northern Sumatra at UT = 22:03 h in the Aceh province of Indonesia (Figure 1). More details of this EQ can be retrieved from the USGS website through the following link: https://earthquake.usgs.gov/earthquakes/search/.
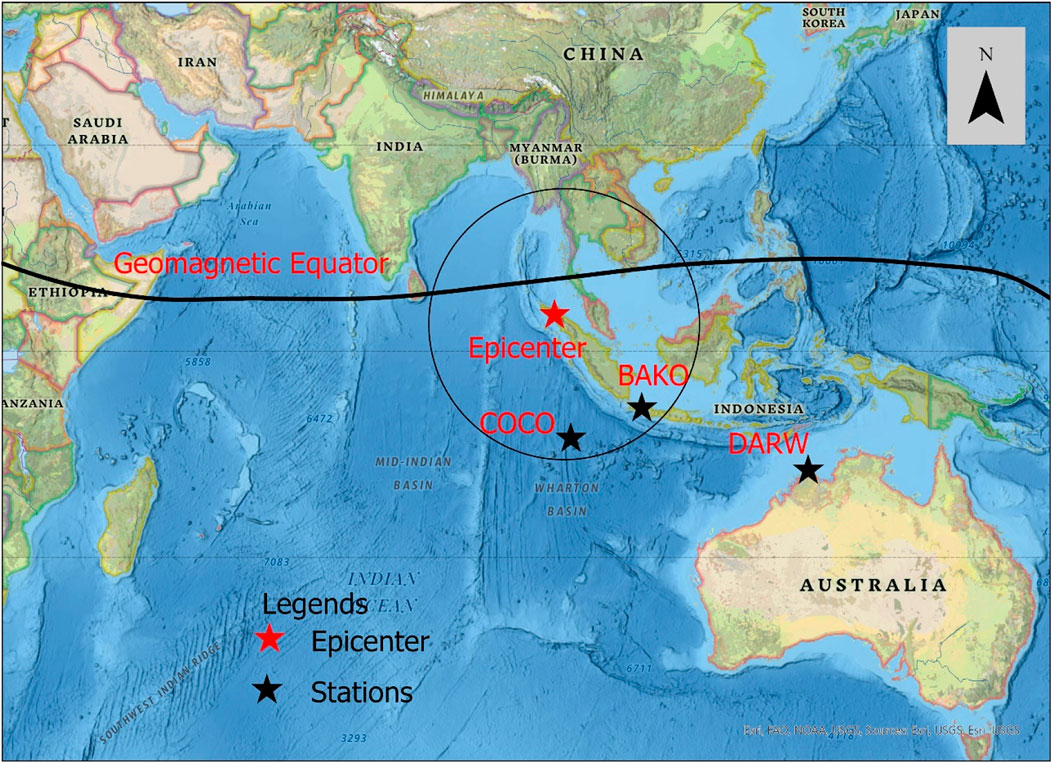
FIGURE 1. Geographical location of the Sumatra EQ that occurred on 06 December 2016 and the GPS stations around the epicenter. The station name and geomagnetic equator are shown at their respective position.
To distinguish the ionospheric anomalies of EQs from those of the geomagnetic storms, it is very important to analyze the geomagnetic storm conditions from different storm indices. In this study, the geomagnetic storm has been analyzed from Dst, Kp, and F10.7 indices for 20 days before and 10 days after the main shock day. For this purpose, the geomagnetic indices are obtained from the ISGI via the web page (http://isgi.unistra.fr/index.php). If the EQ occurs during quiet storm days, then TEC data from GPS can be analyzed to study the different characteristics of the seismo-ionospheric anomalies (Yu et al., 2021; Li et al., 2022; Ren et al., 2022; Wang et al., 2022). Furthermore, the TEC is analyzed from the three available GPS stations in the seismogenic zone of the EQ, as determined by Dobrovolsky et al. (1979), as follows:
In the aforementioned equation, R indicates the radius in km of the EQ affected area, and M is the EQ magnitude. The TEC along the line of sight from the satellite to the receiver in a square meter area can be calculated in the form of the slant total electron content (STEC) by the following equations (Hernández-Pajares et al., 2009):
The carrier phase frequency of GPS signals at the two ends is represented by f1 and f2, respectively. Other important parameters are L and P, which represent the pseudo-range and carrier phase observation of the delay path of GPS signals, respectively. λ is the wavelength of the GPS signals. The ambiguity of the ray path is N, while b and d are the instrumental biases of the carrier phase and pseudo-range of the derived signal, and
The R, H, and Z are the Earth’s radius, height of the ionospheric top layer altitude, and satellite elevation angle for the point of observation, respectively. Both the STEC and VTEC are represented in the TEC unit (where one TECU = 106 el/m2). The diurnal time series of GPS TEC from the stations are bounded by a confidence interval of the median and interquartile range (IQR). The bounds for an observed day are calculated by the median and IQR of 10 days before and 10 days after the study day by the following equations (Shah et al., 2020):
In the aforementioned equations, µ and IQR are the median and interquartile ranges, respectively. In this paper, we also study Swarm satellite data to further confirm the abnormal seismo-ionospheric anomalies of GPS time series. The Swarm mission was launched by the European Space Agency (ESA) on 22 November 2013 in order to study the Earth’s electromagnetic field (Shang et al., 2021; Zhang and Ali, 2021; Yin et al., 2022). The Swarm constellation consists of three identical satellites (Alpha, Bravo, and Charlie) in a polar orbit (Marchetti et al., 2019). Moreover, the initial altitude of the two satellites (Alpha and Charlie), which almost fly side-by-side, is about 480 km. The orbit of the third satellite is 580 km, and it descended slowly as compared to the other two satellites. To measure the Earth’s magnetic field, each Swarm satellite has a vector field magnetometer, absolute scalar magnetometer, and VTEC observation instrument. The orbits of Swarm satellites at various altitudes make the Earth observation clearer than that of other satellites; thus, precise data can be obtained to detect the EQ anomalies within an EQ preparation area. We obtained the daytime and nighttime data during the local time before and after the main shock day over the epicenter in the Dobrovolsky region for the same period as the GPS stations. There are different methods for the analysis of variations of daily time series data (e.g., Huang et al., 2021b; Chen et al., 2021; Wang et al., 2022b; Lu et al., 2022). However, we studied the TEC data from Swarm satellites by bounding statistically with the limits of mean and standard deviation, where the bounds are calculated from all the data (20 days before and 10 days after the main shock day) by the following equations (Shah et al., 2020):
where
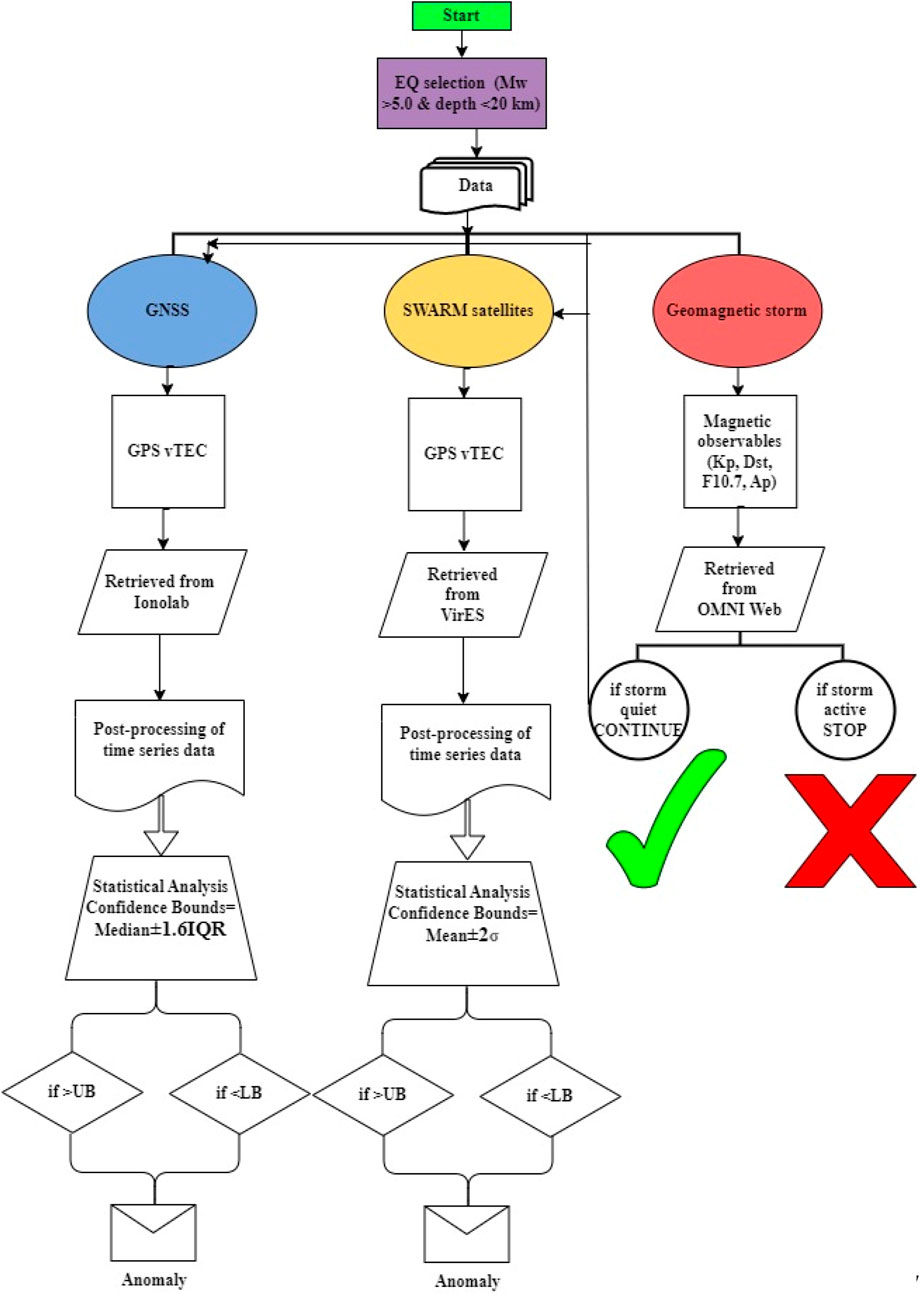
FIGURE 2. Complete flow chart for the observation of seismo-ionospheric anomalies. It is only applicable to EQs during quiet storm conditions.
Results and discussion
In this paper, we analyzed the seismo-ionospheric anomalies before and after the EQ of Sumatra, Indonesia, in December 2016, within a time period of 20 days before and 10 days after the main shock day. This EQ is very important for the studying of seismo-ionospheric anomalies due to its occurrence during quiet storm time (Kp < 3) 10 days before the main shock (Figure 3).
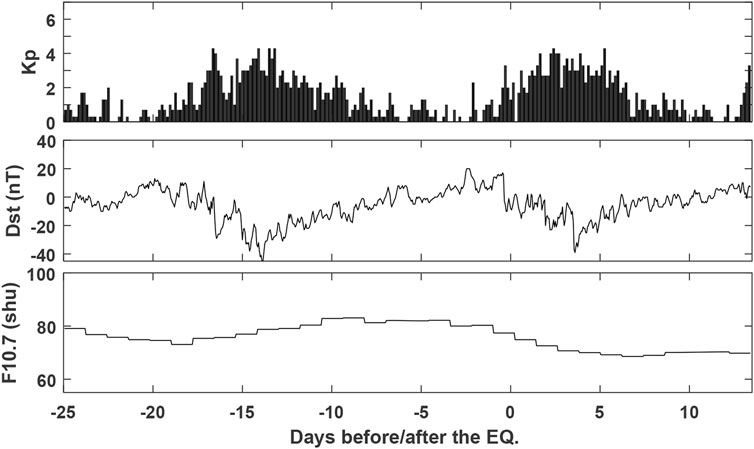
FIGURE 3. Geomagnetic storm conditions before and after the main shock day.
The GPS TEC is retrieved from three GPS stations: two GPS stations operate within the Dobrovolsky region around the epicenter, and one station operates outside the preparation zone far from the epicenter (Figure 1). The details of the stations in geographical and geomagnetic coordinates are mentioned in Table 1.
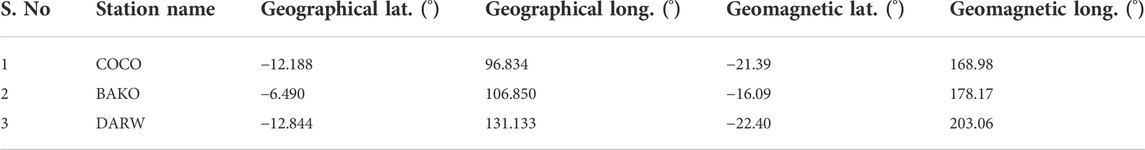
TABLE 1. Geographical and geomagnetic coordinates of the GPS stations.
It is interesting that TEC shows abnormal variation before the main shock day from the two GPS stations operating within the seismic preparation zone (Figure 4). Moreover, the station outside the Dobrovolsky region shows no TEC variations associated with the main shock (Figure 4C). It confirms that TEC anomalies can only be seen from a GPS station operating within the Dobrovolsky region. On the other hand, we also found significant TEC anomalies before the main shock as pre-seismic ionospheric perturbations than post-seismic anomalies. To examine the suspected TEC anomaly of EQs, we calculated the dTEC and applied confidence bounds in the form of upper and lower bounds on the diurnal time series. Both the stations showed more than five TECU anomalies associated with the main shock within 5–10 days prior to the main shock. The TEC values of all three GPS stations showed deviation from normal distributed mean values within 5 days prior to the main shock (Figure 4). When studying EQ anomalies, the solar activity must be monitored in order to distinguish the EQ anomalies from geomagnetic storms, and the geomagnetic indices were quiet (Dst ≤ −40 nT, Kp ≤ 3) in this case during 5–10 days before the main shock. By comparing Figures 3 and 4, we observed no clear storm-induced ionospheric anomalies. Only the Bako station, depicted in Figure 4, showed small ionospheric perturbations 12 days before the main shock.
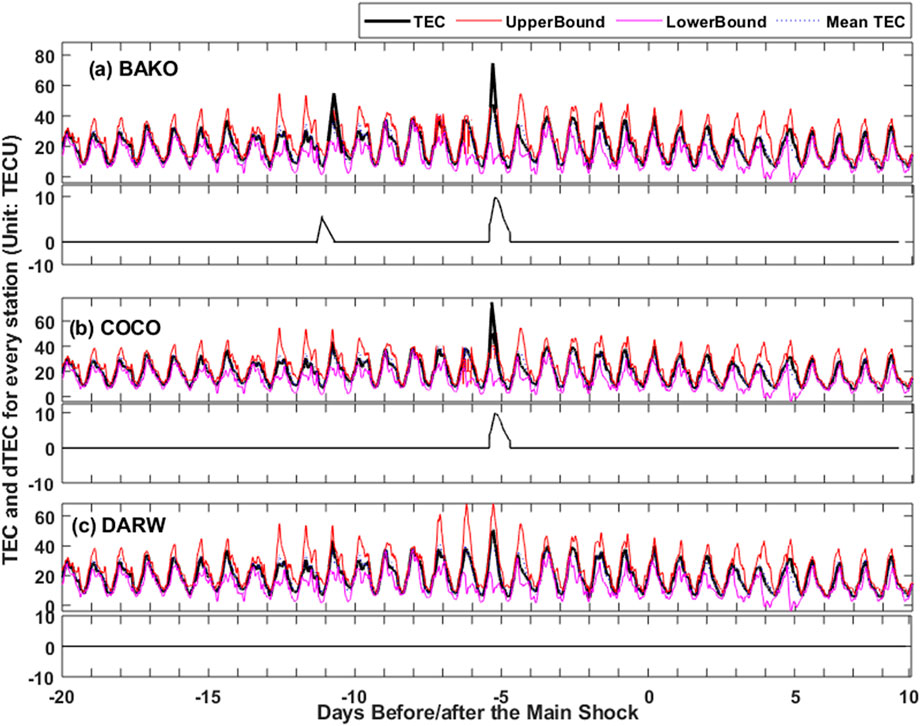
FIGURE 4. TEC from GPS stations (A) Bako, (B) Coco, and (C) Darw with their differential TECs before and after the Mw 6.5 Sumatra earthquake. The bold black line represents TEC, whereas the red and pink lines represent the confidence bounds.
To further validate the EQ anomalies in GPS TEC, we analyzed the three Swarm satellite data in the form of daytime and nighttime observations. The Swarm satellite data were further analyzed under the confidence bounds of mean and standard deviation to clear the abnormal variations before and after the main shock (Figure 5). The left and right panels show daytime and nighttime Swarm observations, respectively. Moreover, the Swarm-A satellite daytime TEC shows no anomaly, and a clear nighttime TEC anomaly can be seen before the main shock of the Mw 6.5 Sumatra earthquake, Indonesia. This TEC anomaly from Swarm-A satellite is three TECUs beyond the upper bound. Therefore, we can clearly say positive ionospheric anomalies before the EQ on the fifth day before the main shock. On the other hand, the daytime TEC data from Swarm-B satellites have a clear EQ anomaly (Figure 5C) and the nighttime data from Swarm-B satellites remained between the confidence bounds of mean and standard deviation (Figure 5D). Additionally, the TEC anomaly obtained through Swarm-B satellite is also positive as it crossed the upper confidence bound. The seismo-ionospheric anomaly from Swarm-B satellites is scaled up to four TECU. Similarly, both the daytime and nighttime TEC data from Swarm-C satellites show clear ionospheric perturbations beyond the upper confidence interval of mean and standard deviation before the main shock day (Figures 5E,F). The Swarm-C anomalies are of low scale (i.e., two TECU) but endorse the finding of GPS station anomalies.
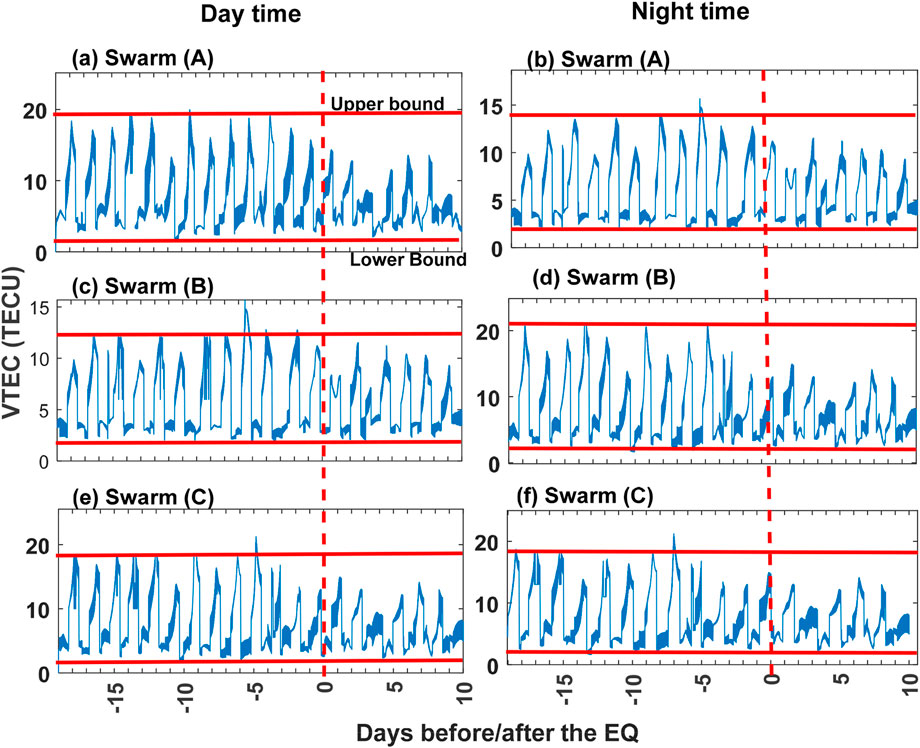
FIGURE 5. TEC from Swarm (A–C) satellites along with the upper and lower confidence bounds. The left and right panels are TEC observations during daytime and nighttime periods, respectively. The red dashed line is the representation of EQ day.
The wavelet correlation confirms a strong correlation between the TEC of GPS stations and Swarm satellites (Figure 6). For this, the Swarm daytime and nighttime data from all three satellites are averaged and then correlated with the TEC of the GPS stations. Interestingly, this analysis also shows no variations in the Darw station, which operates outside the seismogenic zone of the main shock. It correlates with the previous findings of correlation of satellite data (Tian et al., 2019; Zhou et al., 2021; Tian et al., 2021; Zhou et al., 2021b; Jianbo et al., 2022). The correlation of several factors can provide useful information (Zhang et al., 2019; Sun et al., 2021; Wang et al., 2021; Mao et al., 2022; Zhong et al., 2022). Moreover, the anomalous pattern from Swarm satellites within a 5–10-day window before the main shock also confirms the existence of ionospheric anomalies. All these analyses confirm the previous findings of ionospheric anomalies due to p-hole emission from squeezed rocks (Freund, 2009) or radon emanation from the seismogenic regions in the form of LAIC coupling (Pulinets et al., 1997). Furthermore, these abnormalities in TEC within 5–10 days before the main shock for the Sumatra EQ also endorse the previous reports on ionospheric perturbation from different other satellites within the same time window. Additionally, EQ-induced anomalies were found in different reports on the basis of radon gas and p-hole hypotheses (Shah and Jin, 2015; Liu et al., 2017; Ahmed et al., 2018; Arslan et al., 2019; Shah et al., 2020a; Shah et al., 2020b; Timocin et al., 2020; Shah et al., 2021a; Shah et al., 2021b; Jose et al., 2022a; Jose et al., 2022; Shah et al., 2022).
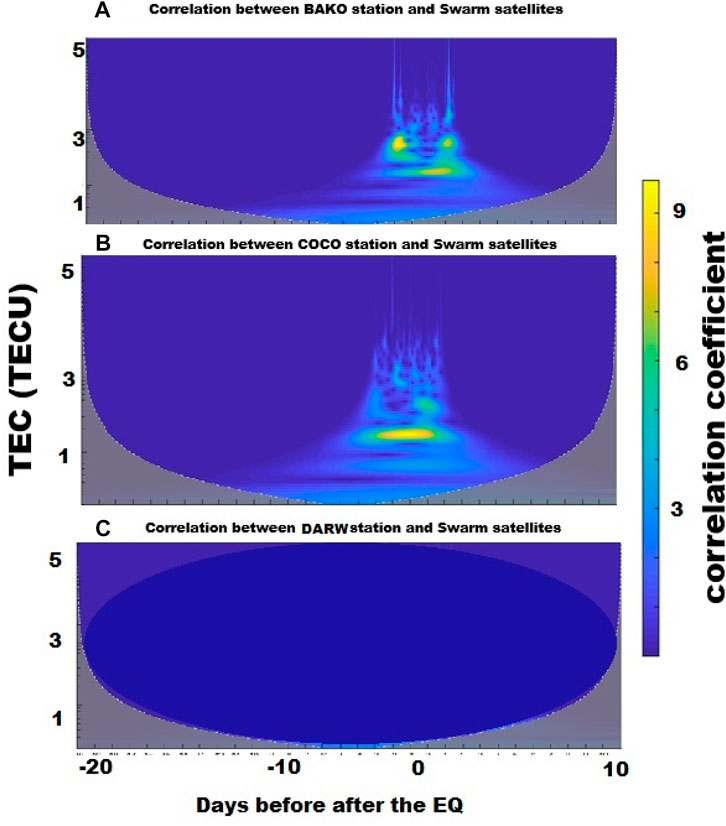
FIGURE 6. Wavelet correlation between the TEC from Swarm satellites and GPS stations associated with the Sumatra EQ.
Conclusion
In this paper, we carried out statistical analysis on the TEC data from GPS stations and Swarm satellites looking for seismo-ionospheric anomalies associated with the Mw 6.5 Sumatra earthquake that occurred in Indonesia on 6 December 2016. During the investigation of the three GPS stations (Bako, Coco, and Darw), a variation of less than 10 TECU was observed in Bako and Coco stations, and no clear anomaly was observed in Darw station data. The reason is that the two GPS stations (Bako and Coco) operate around the EQ epicenter area, while the Darw station is outside the epicentral region. The variation in TEC in all three GPS stations can be observed clearly beyond the confidence bounds prior to the EQ of Mw 6.5 Sumatra, Indonesia (6 December 2016). Furthermore, the geomagnetic storm indices show no evidence of an active storm within 5–10 days before the main shock day due to the presence of Kp < 3 and Dst < −40 nT. It is very necessary to monitor space weather conditions during studies on seismo-ionospheric anomalies.
The statistical analysis of Swarm satellites in the form of daytime and nighttime data also validated the ionospheric anomalies prior to the main shock of the Sumatra EQ in Indonesia. Moreover, the Swarm satellites also showed clear anomalies within the same time window of GPS stations over the epicentral regions. The observed results of the present study agree with previous investigations of possible seismo-ionospheric anomalies. The ground and satellite data showed positive anomalies associated with the EQ in the form of seismo-ionospheric anomalies during quiet storm conditions. This study also confirms the validation of the implemented statistical analysis of mean, median, standard deviation, and IQR and proposes to implement more methods of using more satellite data to forecast the forthcoming EQs.
Data availability statement
Publicly available datasets were analyzed in this study. These data can be found at: https://earthquake.usgs.gov/earthquakes/search/, http://isgi.unistra.fr/index.php, http://www.ionolab.org/.
Author contributions
AK and MS proposed the idea and performed the analyses. SE, BG, JO, and IU assisted in the write-up.
Acknowledgments
The authors are thankful to USGS and ISGI for providing earthquake and geomagnetic storm data, respectively.
Conflict of interest
The authors declare that the research was conducted in the absence of any commercial or financial relationships that could be construed as a potential conflict of interest.
Publisher’s note
All claims expressed in this article are solely those of the authors and do not necessarily represent those of their affiliated organizations, or those of the publisher, the editors, and the reviewers. Any product that may be evaluated in this article, or claim that may be made by its manufacturer, is not guaranteed or endorsed by the publisher.
References
Abbasi, A. R., Shah, M., Ahmed, A., and Naqvi, N. A. (2021). Possible ionospheric anomalies associated with the 2009 Mw 6.4 Taiwan earthquake from DEMETER and GNSS TEC. Acta Geod. geophys. 56 (1), 77–91. doi:10.1007/s40328-020-00325-1
Ahmed, J., Shah, M., Zafar, W. A., Amin, M. A., and Iqbal, T. (2018). Seismo ionospheric anomalies associated with earthquakes from the analysis of the ionosonde data. J. Atmos. Solar-Terrestrial Phys. 179, 450–458. doi:10.1016/j.jastp.2018.10.004
Arslan, M., Shah, M., Hernández-P, M., and Iqbal, T. (2019). Pre-earthquake ionospheric anomalies before three major earthquakes by GPS-TEC and GIM-TEC data during 2015-2017. Adv. Space Res. 63 (7), 2088–2099. doi:10.1016/j.asr.2018.12.028
Chen, J., Du, L., and Guo, Y. (2021). Label constrained convolutional factor analysis for classification with limited training samples. Inf. Sci. 544, 372–394. doi:10.1016/j.ins.2020.08.048
Cheng, Y., and Fu, L. (2022). Nonlinear seismic inversion by physics-informed Caianiello convolutional neural networks for overpressure prediction of source rocks in the offshore Xihu depression, East China. J. Petroleum Sci. Eng. 215, 110654. doi:10.1016/j.petrol.2022.110654
De Santis, A., Marchetti, D., Pavón-Carrasco, F. J., Cianchini, G., Perrone, L., Abbattista, C., et al. (2019). Precursory worldwide signatures of earthquake occurrences on Swarm satellite data. Sci. Rep. 9 (1), 20287. doi:10.1038/s41598-019-56599-1
Dobrovolsky, I. P., Zubkov, S. I., and Miachkin, V. I. (1979). Estimation of the size of earthquake preparation zones. pure Appl. Geophys. 117 (5), 1025–1044. doi:10.1007/bf00876083
Du, Y., Qin, B., Zhao, C., Zhu, Y., Cao, J., and Ji, Y. (2021). A novel spatio-temporal synchronization method of roadside asynchronous MMW radar-camera for sensor fusion. IEEE Trans. Intell. Transp. Syst. 23, 22278–22289. doi:10.1109/TITS.2021.3119079
Freund, F. (2002). Charge generation and propagation in igneous rocks. J. Geodyn. 33 (4), 543–570. doi:10.1016/s0264-3707(02)00015-7
Freund, F. (2009). Stress-activated positive hole charge carriers in rocks and the generation of pre-earthquake signals. Editor M. Hayakawa, Electromagn. Phenom. Assoc. Earthquakes, 41–96.
Fujiwara, H., Kamogawa, M., Ikeda, M., Liu, J. Y., Sakata, H., Chen, Y. I., et al. (2004). Atmospheric anomalies observed during earthquake occurrences. Geophys. Res. Lett. 31 (17), 23–31. doi:10.1029/2004gl019865
Heki, K. (2011). Ionospheric electron enhancement preceding the 2011 Tohoku-Oki earthquake. Geophys. Res. Lett. 38 (17), 3–14. doi:10.1029/2011gl047908
Hernández-Pajares, M., Juan, J. M., Sanz, J., Orus, R., Garcia-Rigo, A., Feltens, J., et al. (2009). The IGS VTEC maps: A reliable source of ionospheric information since 1998. J. Geod. 83 (3), 263–275. doi:10.1007/s00190-008-0266-1
Huang, S., Huang, M., and Lyu, Y. (2021). Seismic performance analysis of a wind turbine with a monopile foundation affected by sea ice based on a simple numerical method. Eng. Appl. Comput. fluid Mech. 15 (1), 1113–1133. doi:10.1080/19942060.2021.1939790
Huang, S., Lyu, Y., Sha, H., and Xiu, L. (2021b). Seismic performance assessment of unsaturated soil slope in different groundwater levels. Landslides 18 (8), 2813–2833. doi:10.1007/s10346-021-01674-w
Hussain, A., and Shah, M. (2020). Comparison of GPS TEC with iri models of 2007, 2012, and 1 2016 over sukkur, Pakistan. Nat. App. Sci. Int. J. 1 (1), 1–10. doi:10.47264/idea.nasij/1.1.1
Jianbo, L., Feng, C., Gao, L., and Chenglin, W. (2022). Improved hybrid method for the generation of ground motions compatible with the multi-damping design spectra. Journal of Earthquake Engineering 22, 13–19. doi:10.1080/13632469.2022.2095059
Jin, S., Jin, R., and Li, J. H. (2014). Pattern and evolution of seismo-ionospheric disturbances following the 2011 Tohoku earthquakes from GPS observations. J. Geophys. Res. Space Phys. 119 (9), 7914–7927. doi:10.1002/2014ja019825
José, F. O. J., Shah, M., Abbas, A., Correia Filho, W. L. F., da Silva Junior, C. A., de Barros Santiago, D, et al. (2022a). Spatiotemporal analysis of fire foci and environmental degradation in the biomes of northeastern Brazil. Sustainability 14 (11), 6935. doi:10.3390/su14116935
José, F. O. J., Shah, M., Abbas, A., Iqbal, M. S., Shahzad, R., Gois, G., et al. (2022). Spatiotemporal analysis of drought and rainfall in Pakistan via standardized precipitation index: Homogeneous regions, trend, wavelet and influence of el niño-southern oscillation. Theor. Appl. Climatol. 149, 843–862. doi:10.1007/s00704-022-04082-9
Khan, M. M., Ghaffar, B., Shahzad, R., Khan, M. R., Shah, M., Amin, A. H., et al. (2022). Atmospheric anomalies associated with the 2021 Mw 7.2 Haiti earthquake using machine learning from multiple satellites. Sustainability 14, 14782. doi:10.3390/su142214782
Kiyani, A., Shah, M., Ahmed, A., Shah, H. H., Hameed, S., Adil, M. A., et al. (2020). Seismo ionospheric anomalies possibly associated with the 2018 M 8.2 Fiji earthquake detected with GNSS TEC. J. Geodyn. 140, 101782. doi:10.1016/j.jog.2020.101782
Li, J., Cheng, F, Gao, L., and Wu, C. (2022). Improved hybrid method for the generation of ground motions compatible with the multi-damping design spectra. J. Earthq. Eng. 72, 1–27. doi:10.1080/13632469.2022.2095059
Li, Y., Du, L., and Wei, D. (2022). Multiscale CNN based on component analysis for SAR ATR. IEEE Trans. Geosci. Remote Sens. 60, 1–12. doi:10.1109/TGRS.2021.3100137
Liu, J. Y., Chuo, Y. J., Shan, S. J., Tsai, Y. B., Chen, Y. I., Pulinets, S. A., et al. (2004). Pre-earthquake ionospheric anomalies registered by continuous GPS TEC measurements. Ann. Geophys. 22 (5), 1585–1593. doi:10.5194/angeo-22-1585-2004
Liu, X., Zhang, Q. Y., Shah, M., and Hong, Z. (2017). Atmospheric-ionospheric disturbances following the April 2015 Calbuco volcano from GPS and OMI observations. Adv. Space Res. 60, 2836–2846. doi:10.1016/j.asr.2017.07.007
Lu, S., Ban, Y., Zhang, X., Yang, B., Liu, S., Yin, L., et al. (2022). Adaptive control of time delay teleoperation system with uncertain dynamics. Front. Neurorobot. 16, 928863. doi:10.3389/fnbot.2022.928863
Mao, Y., Sun, R., Wang, J., Cheng, Q., Kiong, L. C., and Ochieng, W. Y. (2022). New time-differenced carrier phase approach to GNSS/INS integration. GPS Solut. 26 (4), 122. doi:10.1007/s10291-022-01314-3
Marchetti, D., De Santis, A., D'Arcangelo, S., Poggio, F., Piscini, A., Campuzano, A., et al. (2019). Pre-earthquake chain processes detected from ground to satellite altitude in preparation of the 2016–2017 seismic sequence in Central Italy. Remote Sens. Environ. 229, 93–99. doi:10.1016/j.rse.2019.04.033
Pulinets, S. A., Alekseev, V. A., Legen'ka, A. D., and Khegai, V. V. (1997). Radon and metallic aerosols emanation before strong earthquakes and their role in atmosphere and ionosphere modification. Adv. Space Res. 20 (11), 2173–2176. doi:10.1016/s0273-1177(97)00666-2
Pulinets, S., and Davidenko, D. (2014). Ionospheric precursors of earthquakes and global electric circuit. Adv. Space Res. 53 (5), 709–723. doi:10.1016/j.asr.2013.12.035
Pulinets, S., and Ouzounov, D. (2011). Lithosphere–Atmosphere–Ionosphere Coupling (LAIC) model – an unified concept for earthquake precursors validation. J. Asian Earth Sci. 41 (4–5), 371–382. doi:10.1016/j.jseaes.2010.03.005
Qu, J., Feng, Y., Xu, G., Zhang, M., Zhu, Y., and Zhou, S. (2022). Design and thermodynamics analysis of marine dual fuel low speed engine with methane reforming integrated high pressure exhaust gas recirculation system. Fuel 319, 123747. doi:10.1016/j.fuel.2022.123747
Ren, C., Yu, J., Liu, S., Yao, W., Zhu, Y., and Liu, X. (2022). A plastic strain-induced damage model of porous rock suitable for different stress paths. Rock Mech. Rock Eng. 55 (4), 1887–1906. doi:10.1007/s00603-022-02775-1
Sekertekin, A., Inyurt, S., and Yaprak, S. (2020). Pre-seismic ionospheric anomalies and spatio-temporal analyses of MODIS Land surface temperature and aerosols associated with Sep, 24 2013 Pakistan Earthquake. J. Atmos. Solar-Terrestrial Phys. 200, 105218. doi:10.1016/j.jastp.2020.105218
Shah, M., Abbas, A., Adil, M. A., Ehsan, M., Ashraf, U., Júnior, J. F. O., et al. (2022). Possible seismo-ionospheric anomalies associated with M>5.0 earthquakes during 2000–2020 from GNSS TEC. Adv. Space Res. 70, 179–187. doi:10.1016/j.asr.2022.04.025
Shah, M., Abbas, A., Ehsan, M., Aiber, A. C., Adhikari, B., Tariq, M. A., et al. (2021b). Ionospheric–thermospheric responses in south America to the august 2018 geomagnetic storm based on multiple observations. IEEE J. Sel. Top. Appl. Earth Obs. Remote Sens. 15, 261–269. doi:10.1109/JSTARS.2021.3134495
Shah, M., Ahmed, A., Ehsan, M., Khan, M., Tariq, M. A., Calabia, A., et al. (2020b). Total electron content anomalies associated with earthquakes occurred during 1998-2019. Acta Astronaut. 175, 268–276. doi:10.1016/j.actaastro.2020.06.005
Shah, M., Calabia, A., Tariq, M. A., Ahmed, J., and Ahmed, A. (2020a). Possible ionosphere and atmosphere precursory analysis related to Mw >6.0 earthquakes in Japan. Remote Sens. Environ. 239, 111620. doi:10.1016/j.rse.2019.111620
Shah, M. (2022). “Chapter 28 - earthquake ionospheric and atmospheric anomalies from GNSS TEC and other satellites,” in Computers in Earth and environmental Sciences. Editor H. R. Pourghasemi (Amsterdam, Netherlands: Elsevier), 387–399.
Shah, M., Ehsan, M., Abbas, A., Ahmed, A., and Jamjareegulgarn, P. (2021). Possible thermal anomalies associated with global terrestrial earthquakes during 2000-2019 based on MODIS-LST. IEEE Geosci. Remote Sens. Lett. 19, 1–5. doi:10.1109/lgrs.2021.3084930
Shah, M., Inyurt, S., Ehsan, M., Ahmed, A., Shakir, M., Ullah, S., et al. (2020). Seismo ionospheric anomalies in Turkey associated with M≥6.0 earthquakes detected by GPS stations and GIM TEC. Adv. Space Res. 65 (11), 2540–2550. doi:10.1016/j.asr.2020.03.005
Shah, M., and Jin, S. G. (2015). Statistical characteristics of seismo-ionospheric GPS TEC disturbances prior to global Mw≥ 5.0 earthquakes (1998-2014). J. Geodyn. 92, 42–49. doi:10.1016/j.jog.2015.10.002
Shah, M., and Jin, S. (2018). Pre-seismic ionospheric anomalies of the 2013 Mw = 7.7 Pakistan earthquake from GPS and COSMIC observations. Geodesy Geodyn. 9 (5), 378–387. doi:10.1016/j.geog.2017.11.008
Shah, M., Khan, M., Ullah, H., and Ali, S. (2018). Thermal anomalies prior to the 2015 gurkha (Nepal) earthquake from MODIS land surface temperature and outgoing longwave radiations. Geodin. Tektonofiz. 9 (1), 123–138. doi:10.5800/gt-2018-9-1-0341
Shah, M., Qureshi, R. U., Khan, N. G., Ehsan, M., and Yan, J. (2021a). Artificial Neural Network based thermal anomalies associated with earthquakes in Pakistan from MODIS LST. J. Atmos. Solar-Terrestrial Phys. 215, 105568. doi:10.1016/j.jastp.2021.105568
Shah, M., Tariq, M. A., Ahmad, J., Naqvi, N. A., and Jin, S. (2019a). Seismo ionospheric anomalies before the 2007 M7.7 Chile earthquake from GPS TEC and DEMETER. J. Geodyn. 127, 42–51. doi:10.1016/j.jog.2019.05.004
Shah, M., Tariq, M. A., and Naqvi, N. A. (2019b). Atmospheric anomalies associated with Mw>6.0 earthquakes in Pakistan and Iran during 2010–2017. J. Atmos. Solar-Terrestrial Phys. 191, 105056. doi:10.1016/j.jastp.2019.06.003
Shang, K., Chen, Z., Liu, Z., Song, L., Zheng, W., Yang, B., et al. (2021). Haze prediction model using deep recurrent neural network. Atmosphere 12 (12), 1625. doi:10.3390/atmos12121625
Sun, R., Wang, J., Cheng, Q., Mao, Y., and Ochieng, W. Y. (2021). A new IMU-aided multiple GNSS fault detection and exclusion algorithm for integrated navigation in urban environments. GPS Solut. 25 (4), 147. doi:10.1007/s10291-021-01181-4
Tariq, M. A., Shah, M., Hernández-Pajares, M., and Iqbal, T. (2019). Ionospheric VTEC variations over Pakistan in the descending phase of solar activity during 2016–17. Astrophys. Space Sci. 364 (6), 99. doi:10.1007/s10509-019-3591-3
Tian, H., Huang, N., Niu, Z., Qin, Y., Pei, J., and Wang, J. (2019). Mapping winter crops in China with multi-source satellite imagery and phenology-based algorithm. Remote Sens. (Basel, Switz. 11 (7), 820. doi:10.3390/rs11070820
Tian, H., Pei, J., Huang, J., Li, X., Wang, J., Zhou, B., et al. (2020). Garlic and winter wheat identification based on active and passive satellite imagery and the google Earth engine in northern China. Remote Sens. (Basel, Switz. 12 (3539), 3539. doi:10.3390/rs12213539
Tian, H., Wang, Y., Chen, T., Zhang, L., and Qin, Y. (2021). Early-season mapping of winter crops using sentinel-2 optical imagery. Remote Sens. (Basel, Switz. 13 (19), 3822. doi:10.3390/rs13193822
Timoçin, E., Temuçin, H., İnyurt, S., Shah, M., and Jamjareegulgarne, P. (2020). Assessment of improvement of the IRI model for foF2 variability over three latitudes in different hemispheres during low and high solar activities. Acta Astronaut. 180, 305–316. doi:10.1016/j.actaastro.2020.12.042
Wang, J., Tian, J., Zhang, X., Yang, B., Liu, S., Yin, L., et al. (2022). Control of time delay force feedback teleoperation system with finite time convergence. Front. Neurorobot. 16, 877069. doi:10.3389/fnbot.2022.877069
Wang, N., Xing, G., Zhu, T., Zhou, H., and Shi, Y. (2022b). Propagating seismic waves in VTI attenuating media using fractional viscoelastic wave equation. JGR. Solid Earth 127, e2021JB023280. doi:10.1029/2021JB023280
Wang, S., Zhang, K., Chao, L., Li, D., Tian, X., Bao, H., et al. (2021). Exploring the utility of radar and satellite-sensed precipitation and their dynamic bias correction for integrated prediction of flood and landslide hazards. J. hydrology (Amsterdam) 603, 126964. doi:10.1016/j.jhydrol.2021.126964
Xu, L., Liu, X., Tong, D., Liu, Z., Yin, L., and Zheng, W. (2022). Forecasting urban land use change based on cellular automata and the PLUS model. Land (Basel) 11 (5), 652. doi:10.3390/land11050652
Yin, L., Wang, L., Zheng, W., Ge, L., Tian, J., Liu, Y., et al. (2022). Evaluation of empirical atmospheric models using Swarm-C satellite data. Atmosphere 13 (2), 294. doi:10.3390/atmos13020294
Yu, J., Zhu, Y., Yao, W., Liu, X., Ren, C., Cai, Y., et al. (2021). Stress relaxation behaviour of marble under cyclic weak disturbance and confining pressures. Measurement 182, 109777. doi:10.1016/j.measurement.2021.109777
Zhang, C., and Ali, A. (2021). The advancement of seismic isolation and energy dissipation mechanisms based on friction. Soil Dyn. Earthq. Eng. (1984) 146, 106746. doi:10.1016/j.soildyn.2021.106746
Zhang, K., Ali, A., Antonarakis, A., Moghaddam, M., Saatchi, S., Tabatabaeenejad, A., et al. (2019). The sensitivity of north American terrestrial carbon fluxes to spatial and temporal variation in soil moisture: An analysis using radar-derived estimates of root-zone soil moisture. J. Geophys. Res. Biogeosci. 124 (11), 3208–3231. doi:10.1029/2018JG004589
Zhang, X., Ma, F., Dai, Z., Wang, J., Chen, L., Ling, H., et al. (2022). Radionuclide transport in multi-scale fractured rocks: A review. J. Hazard. Mater. 424, 127550. doi:10.1016/j.jhazmat.2021.127550
Zhang, X., Ma, F., Yin, S., Wallace, C. D., Soltanian, M. R., Dai, Z., et al. (2021). Application of upscaling methods for fluid flow and mass transport in multi-scale heterogeneous media: A critical review. Appl. energy 303, 117603. doi:10.1016/j.apenergy.2021.117603
Zhong, T., Cheng, M., Lu, S., Dong, X., and Li, Y. (2022). Rcen: A deep-learning-based background noise suppression method for DAS-VSP records. IEEE Geosci. Remote Sens. Lett. 19, 1–5. doi:10.1109/LGRS.2021.3127637
Zhou, G., Long, S., Xu, J., Zhou, X., Song, B., Deng, R., et al. (2021). Comparison analysis of five waveform decomposition algorithms for the airborne LiDAR echo signal. IEEE J. Sel. Top. Appl. Earth Obs. Remote Sens. 14, 7869–7880. doi:10.1109/JSTARS.2021.3096197
Keywords: ionosphere, earthquake, anomalies, GPS TEC, Swarm satellites
Citation: Khan AQ, Ghaffar B, Shah M, Ullah I, Oliveira-Júnior JF and Eldin SM (2022) Possible seismo-ionospheric anomalies associated with the 2016 Mw 6.5 Indonesia earthquake from GPS TEC and Swarm satellites. Front. Astron. Space Sci. 9:1065453. doi: 10.3389/fspas.2022.1065453
Received: 09 October 2022; Accepted: 14 November 2022;
Published: 30 November 2022.
Edited by:
Angelo De Santis, Istituto Nazionale di Geofisica e Vulcanologia (INGV), ItalyReviewed by:
Sampad Kumar Panda, K L University, IndiaPunyawi Jamjareegulgarn, King Mongkut’s Institute of Technology Ladkrabang, Thailand
Aliihsan Sekertekin, Iğdır Üniversitesi, Turkey
Copyright © 2022 Khan, Ghaffar, Shah, Ullah, Oliveira-Júnior and Eldin. This is an open-access article distributed under the terms of the Creative Commons Attribution License (CC BY). The use, distribution or reproduction in other forums is permitted, provided the original author(s) and the copyright owner(s) are credited and that the original publication in this journal is cited, in accordance with accepted academic practice. No use, distribution or reproduction is permitted which does not comply with these terms.
*Correspondence: Munawar Shah, c2hhaG11bmF3YXIxQGdtYWlsLmNvbQ==